1. Introduction
A main policy concern for agri-food systems concerns the way they will satisfy the food demand of a rising world population, which will reach 9.2 billion people by 2050 [
1].
The European Commission (EC) has recently started tackling this challenge, launching the European Innovation Partnership “Agricultural Productivity and Sustainability”. This policy initiative aims at promoting productivity and efficiency of the agricultural sector and, at the same time, improving its sustainability [
2,
3,
4].
Food production and consumption represent a relevant share of the overall natural resources used by economies (e.g., 20% of the German one [
5]), contributing to and exacerbating the global environmental crisis.
Depending on the farming practice, agriculture can have positive or negative impacts on the environment. While the former comprise, e.g., carbon sequestration, maintenance of landscape, biodiversity conservation and production of biomass from photosynthetic process, intensive agriculture has led in the last decades to overexploitation of natural resources (especially water), degradation of soil fertility, soil, water and air pollution, and loss of highly biodiverse ecosystems.
Many methodologies have been applied for assessing the environmental impact of food. These methodologies take into account a certain aspect related to food production and consumption (e.g., carbon emissions [
6]) or consist in a comprehensive evaluation of all the environmental impacts along the supply chain (Life Cycle Assessment [
7], LCA). None of these methodologies provide straightforward information about the resource efficiency of food products and agricultural practices. Nevertheless, resource efficiency constitutes the core of the European Union (EU) strategy for decoupling population well-being from resource use and promoting sustainable growth [
2,
4].
In this survey, Material Input Per Service unit (MIPS) indicator has been applied to a set of foodstuffs grown in Italy with different agricultural practices: conventional, organic and an agroecological practice called Ma-Pi polyculture.
The aim of the study is to assess the material efficiency of different practices and to evaluate if, and to what extent, non-conventional practices allow the saving of resources and the lowering of environmental burdens related to food production.
In
Section 2, the main issues related to sustainability of agriculture and food systems are briefly illustrated;
Section 3 describes the food systems under investigation and the associated agricultural practices;
Section 4 explains the methodology used and how the study has been designed;
Section 5 shows results and discusses the methodology used;
Section 6 concludes.
2. Background
The world demand for food will increase substantially in the next decades, due to population growth and economic development, which will lead to increased meat and animal protein intakes [
1]. Simultaneously, after a century of decline, commodity prices have been showing a growing and fluctuating trend in the last 10 years, with dramatic surges in 2008 and in 2011 [
8]. According to UNEP, the main causes of the food crisis are “
a combined effect of speculation in food stocks, extreme weather events, low cereals stocks, growth in biofuels competing for cropland and high oil prices” [
9].
Environmental degradation is strictly bound up with food scarcity, since the former can reduce agricultural production, through extreme climatic events, soil degradation and loss of fertility, depletion of natural resources and water. At the same time, food systems contribute significantly to the environmental crisis and are very demanding in terms of natural resources.
The main environmental impacts related to food systems are typically water eutrophication, due to the use of agricultural fertilizers, depletion of water reserves (70% of global withdrawals is due to agriculture [
10]) and production of greenhouse gases (especially methane and nitrous oxide). Moreover, the expansion of agricultural land contributes to climate change and biodiversity loss (when crops replace, e.g., forests), exacerbating competition for land, which has recently emerged in the “land grabbing” phenomenon [
11].
Given the above, the capability of global food systems to satisfy a growing demand for food using fewer natural resources and minimizing the impacts on ecosystems is becoming a priority policy concern. Many environmental assessment methodologies have been developed and applied to food, in order to measure the impact of its production and consumption, mainly in terms of water footprint [
12] and greenhouse gases emissions [
6]. LCA has been widely applied to many agricultural products and foodstuffs. It is a comprehensive methodology for assessing the impacts along the supply chain of products/services [
7]. It includes an inventory part, in which flows exchanged between the environment and the system under investigation are accounted for, and an impact assessment part that takes into account some categories of impact (e.g., resource depletion, climate change potential, ozone depletion potential, eutrophication). In LCA, the impact assessment methods for resources focus mainly on scarcity (
i.e., use of resources in relation to their availability) or exergy content. There is a lack of consensus on how resource depletion should be perceived and modeled and the impact assessment methods differ significantly in their scope [
13]. None of the above mentioned environmental assessment methodologies directly address the amount of material resources used for food production and consumption. Thus, they do not provide straightforward information on the resource efficiency of different agricultural practices, technologies or consumption habits. In LCA, all the input flows are accounted for in Life Cycle (LC) inventories, thus potentially allowing an input/output analysis in terms of material resources; instead results at impact assessment level refer to “resource depletion” only.
3. The Agricultural Systems under Investigation: Conventional, Organic and Post-Organic Food
Environmental impacts and use of resources related to food production can differ significantly, according to the agricultural practice and the structure of the supply chain.
The present study performs a “from cradle to gate” assessment on three systems of food production, characterized by different agricultural practices. The main features of these food chains are described below, and in
Table 1.
3.1. Conventional Food Chain
This system refers to the actual and most common form of food production in Western countries, called “conventional” with respect to the organic practices developed some decades ago.
Table 1.
Main features of the three food chains under investigation.
Table 1.
Main features of the three food chains under investigation.
| Life cycle phase | Conventional food chain | Organic food chain | UPM |
|---|
| Agricultural inputs | Intense use of inputs (agrochemicals, seeds, fodders), mainly supplied by global markets | Restrictions to the chemical synthetic pesticides and fertilizers; use of livestock manure for fertilization | Minimization of external inputs, use of on-farm resources, including seed production and manure (from horses and small courtyards animals) |
| Farming | Intense use of mechanization, irrigation, high yields; homogeneity; use of genetically modified organisms | Crop rotation; use of resistant and autochthonous plant varieties; prohibition of genetically modified organisms | Choice of autochthonous plant varieties; intercropping; crop rotations and green manure; manual or mechanical weed control; minimization of irrigation |
| Cattle breeding | Use of fodders from conventional agriculture (purchased or produced on the farm); intensive breeding; employment of dietary supplements and eventually antibiotics | Regulated stock density; restrictions for ensuring animal wellness; organic feed (preferably produced on the farm); prohibition of antibiotics | Horses and small courtyard animals can be present in the farm |
| Food processing | Processing industry using interchangeable raw materials from globalized markets; production of convenience and functional food | Restrictions in the use of additives, processing aids and chemically synthesized inputs | Low level of processing; locally processing firm controlled and owned by UPM |
| Distribution and retailing | Market channels are commonly supermarkets and megastore, that are usually operating at international level | Varied market channels: traditional ones but also farm shops, farmer markets, purchasing groups are common. Short distance transportation is encouraged | Shops and restaurants are supplied by local farmers; limited provision from other areas when environmental conditions do not allow cultivation of certain foodstuffs |
The conventional farming system is rooted in the project of agricultural modernization and development advanced by the EU’s Common Agricultural Policy (CAP) during the last 30–40 years [
14]. This modernization project, motivated by a basic food sufficiency necessity due to post war shortages, was strongly supported through subsidies and price interventions and led to a substantial enhancement of the EU agriculture’s productivity.
The main technological innovations introduced during the first phase of CAP are the use of chemical fertilizers and pesticides, the mechanization and irrigation systems, the genetically improved seed varieties and the intensification of animal production practices.
The resulting agricultural mode is highly specialized, capital intensive, large-scaled and market-oriented. It operates in a global supply chain, characterized by complexity and concentration of market power in some segments of the supply chain,
i.e., in the industries of agricultural input production, food processors and retailers [
15].
3.2. Organic Food Production
The impacts of conventional food production on health and the environment have raised dissatisfaction and distrust among consumers towards the industrial food systems. The outbreak of animal and human diseases linked to intensive breeding techniques (BSE, swine flu, avian flu, etc.), environmental damage and landscape erosion contributed to a drastic deterioration of the public image of agriculture and to a growing demand for sustainable food systems.
Organic agriculture has spread, especially in Western countries, with the aim of addressing this demand for healthy and environmentally sound food.
The EU legislation started dealing with organic farming with the Regulation 2092/91, repealed in 2007 by the Council Regulation 837/2007 [
16]. This legislation provides detailed rules for the production and labeling of organic products. The main features of organic farming include: crop rotations; restrictions in the use of chemical synthetic pesticides and fertilizers, livestock antibiotics, food additives and processing aids; prohibition of genetically modified organisms; and the use of livestock manure, feed produced on the farm, and resistant and autochthonous plant varieties.
According to the regulation, organic livestock is not compatible with landless production and the choice of breeds should take into account their capacity to adapt to local conditions. Housing conditions and breeding techniques must ensure the animal welfare and stocking density is regulated. Livestock should be fed with organic fodders, preferably coming from their own holding.
3.3. UPM and Ma-Pi Polyculture
Un Punto Macrobiotico (UPM, A Macrobiotic Point) is a cultural association and a peculiar food system experience, created in the Italian Marche region in 1980. UPM was founded by Mario Pianesi, an Italian citizen, with the aim of spreading the macrobiotic philosophy and using the macrobiotic diet for curative purposes. In three decades, UPM has organized an entire food chain, controlling and managing all the phases of the food chain, from farming to processing, distribution and meal preparation.
UPM consists of 63 restaurants and 72 shops spread over the Italian territory. The name “A Macrobiotic Point” emphasizes that each shop/restaurant is managed by local groups of people and is mainly supplied by local farms. According to an UPM association census, in 2010, 95 farms with an average size of 8.8 ha were cereals suppliers; 130 farms with an average size of 1.7 ha supplied legumes and vegetables.
Agricultural producers are committed to following the prescription of the so-called Ma-Pi polyculture, a farming practice defined for this purpose.
Ma-Pi polyculture has been shaped by UPM for the purpose of supplying UPM restaurants with highly natural and healthy food. It can be considered an agroecological practice and a post-organic movement (According to Goodman and Goodman [
17] “smaller organic growers […] have sought new sources of economic rent and livelihood by going “beyond organic”—what we term the “post-organic”—and finding refuge in local direct marketing and local food networks (LFNs)”; this terminology also appears in Moore [
18] with respect to the farmers’ movements in Ireland) since it goes beyond the restrictions of organic farming, aiming at building up an ecologically stable, resilient, highly biodiverse and productive agro-ecosystem. It can also be considered a
low input farming system [
19] as it aims at minimizing the use of external inputs.
Intercropping and presence of trees, hedges and bushes in the field ensure a high level of biodiversity; the auto-production of seeds, the choice of autochthonous, well adapted plant varieties, crop rotations, green manure, mechanical elimination of weeds ensure that the use of agrochemicals is avoided, and the use of external inputs minimized.
Intercropping is a fundamental aspect of the Ma-Pi polyculture, since it allows the upkeep of high biodiversity and productivity at the same time. The diversification of outputs obtained through the polycultural system allows the supply of a variety of vegetables, legumes and cereals to the nearest UPM restaurant and addresses the requirements of the macrobiotic diet, mostly vegetarian (fish from local sea and occasionally game are also part of the diet), in which meals are mainly composed of fixed proportions of cereals, vegetables and legumes.
Food distribution and processing are managed by three UPM firms spread over the Italian territory. The labeling of products includes information regarding place of cultivation, crop variety, amount harvested, crop management (fertilization, weeds management, pest control, irrigation, etc.) as well as the number of steps between producer and consumer, allowing a complete traceability of the chain.
4. Methodology and Design of the Study
4.1. MIPS Indicator
In order to measure the impact of food in terms of natural resource demand the MIPS (Material Input Per Service unit) indicator has been applied to a set of foodstuffs produced with different agricultural practices.
MIPS [
20,
21,
22] estimates the overall environmental pressure caused by products or services, by indicating the life-cycle wide consumption of natural resources in relation to the benefit provided. Measuring the amount of material resources required to produce something, it indicates the resource efficiency of systems.
The total mass of material flows that are used for producing a good,
i.e., the Material Input (MI) has been defined also as the material footprint [
22] and “ecological rucksack”, because it encompasses all upstream processes in the life cycle and hidden flows entailed in a system (e.g., unused extractions and all materials flows that do not directly enter in the final product).
The resource categories encompassed in the material input concept are: abiotic raw materials (i.e., non-renewable resources, used and unused extraction of raw materials, fossil energy carriers, soil excavations); biotic raw materials (i.e., renewable inputs, mainly biomass from cultivated and uncultivated areas); water (when it is actively removed from nature); air (i.e., quantity of oxygen combusted that reflects the amount of carbon dioxide formed); earth movements in agriculture and silviculture or erosion. This categorization and the separate consideration of different impacts allow having a wide overview of the different impact sources and avoids the shifting of burdens between different categories.
The “Service Unit” (SU) component refers to the benefit provided using material or immaterial goods. For products that are used just once (e.g., food) the “material intensity” concept is adopted, with reference to the kilograms of resources required to get one kilogram of food.
MIPS calculation is performed using average Material Input (MI) factors for materials and other inputs. They are the ratio between the quantity (in mass units) of resources used and the quantity of product obtained. MI factors of materials and “modules” (electricity, transport,
etc.) have been calculated and are published by Wuppertal Institute [
23]. In the application of these factors, a “like-domestic technology” assumption has been made, since most of them are calculated for Germany or at EU level.
The material intensity analysis shares with LCA the life-cycle perspective, and therefore the inclusion of upstream processes in the assessment of products and services’ material intensity. Like in LCA, performing a MIPS analysis requires the definition of a system boundary and the compilation of an inventory. The main difference in this phase is that, while LCA accounts for input and output flows, the material intensity analysis focuses only on the inputs side. At impact assessment phase LCA encompasses a wide range of impact categories (e.g., global warming, acidification, etc…), while in MIPS analysis focuses on upstream flows of resources.
4.2. Design of the Study: Products from Conventional and Organic Agriculture
A set of foodstuffs has been chosen for the calculation of food material intensity. The availability of data and the representativeness of the Italian diet were the main criteria for the choice of foodstuffs.
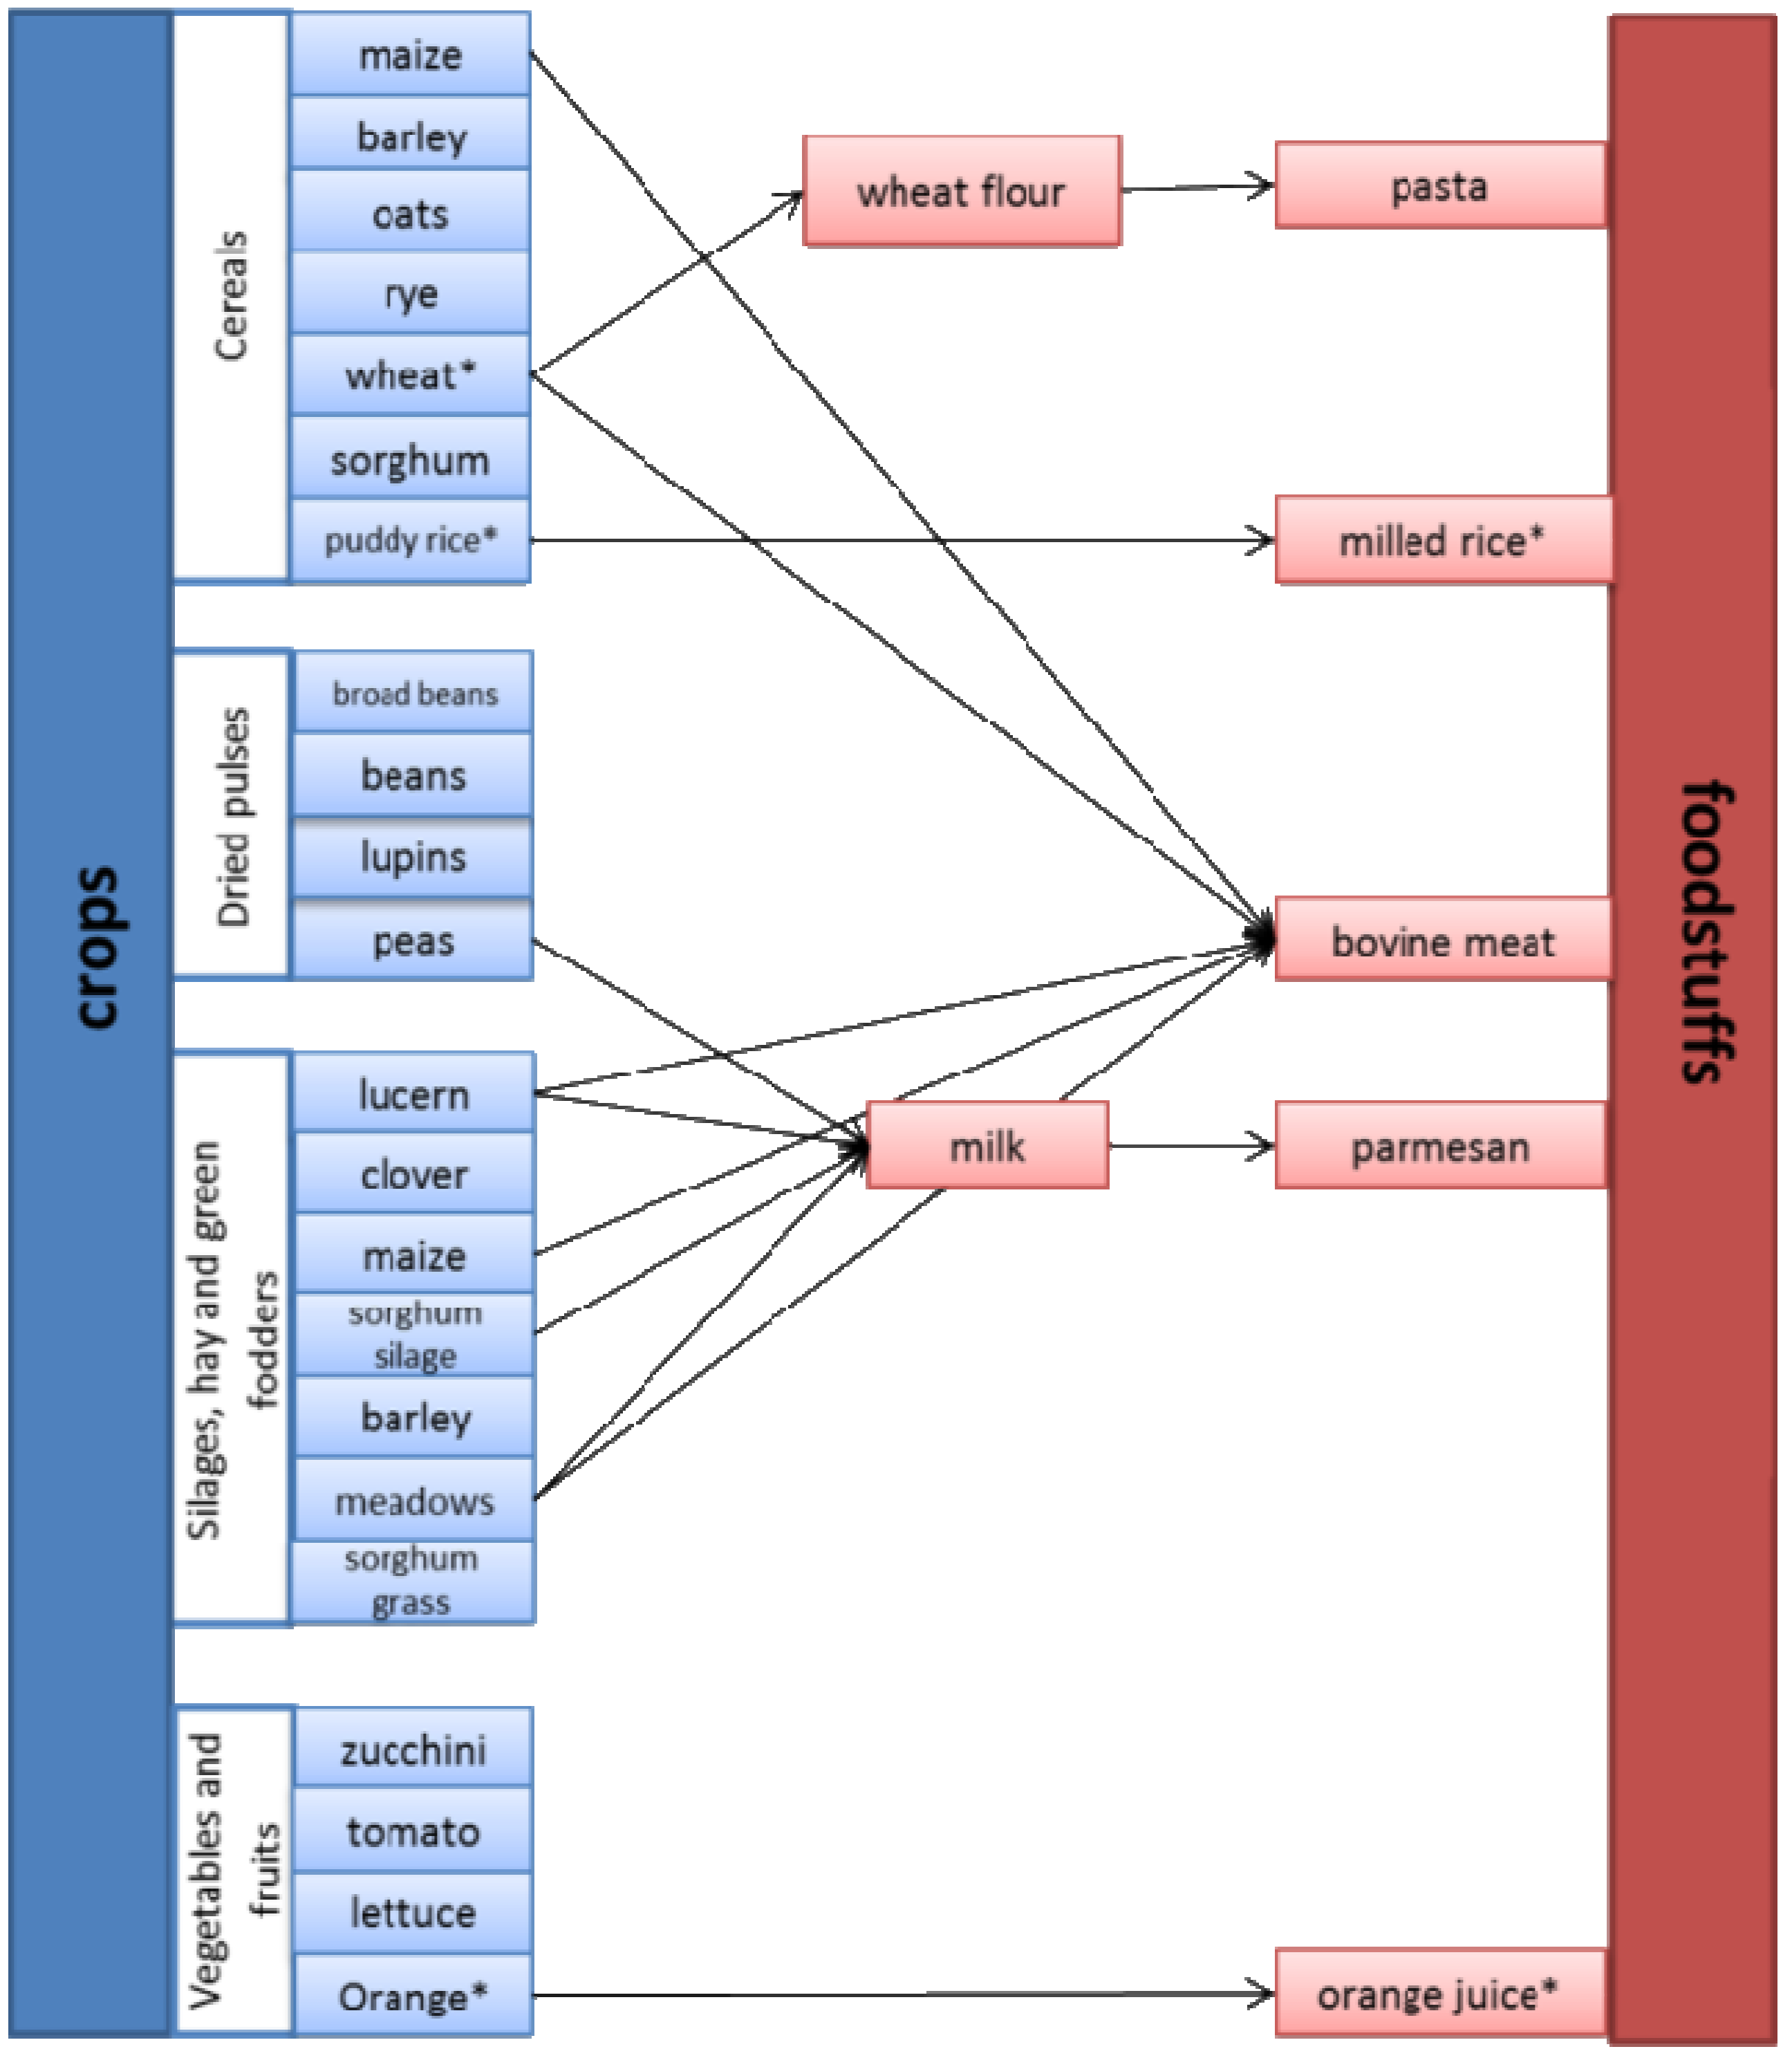
As the calculation of MIPS has a modular reasoning, a set of crops and fodders has been assessed first, and these results have been used for calculating the MI of animal production and processed foodstuffs, as shown in
Figure 1. Figures from Mancini
et al. [
24] have been used for conventional wheat, rice and oranges.
4.2.1. Data Sources and Simplifying Hypothesis
The calculation of MI can focus on specific products, using primary data, or refer to an “average product” grown in a certain region/territory, using data sources from the literature. In this work, the latter approach prevails and the most common farming conditions are taken into account, in order to obtain generalizable results on Italian foodstuffs. Nevertheless, the data availability prevented this option and in some cases the calculations are based on “single case” products.
Data sources used in this study encompass: inventory data from LCA studies; statistics on fuel consumption for agricultural practices from ENAMA (Nation Agency for Agricultural Mechanization) [
25]; statistics and general information on food systems from ISTAT [
26,
27]; harvest index of crops from Weisz
et al. [
28]; data on agronomic practices and average yields from agricultural handbooks [
29,
30].
The following assumptions and simplifying hypotheses have been made for the MI calculation:
Production losses (e.g., losses during cereals’ storing) and surpluses along the supply chains have been neglected; nevertheless they can constitute a relevant share of the total. This assumption implies that systems with low technical efficiency are underestimated.
Infrastructures and agricultural machinery are not part of the analysis, since the impacts linked to these goods, split for the total amount produced during their life span is supposed to be negligible for unit of food produced;
Figure 1.
Agricultural products and foodstuffs under investigation. Arrows show when Material Input (MI) factors have been used for the calculation of foodstuffs; products with * have been previously assessed in Mancini
et al. [
24].
Figure 1.
Agricultural products and foodstuffs under investigation. Arrows show when Material Input (MI) factors have been used for the calculation of foodstuffs; products with * have been previously assessed in Mancini
et al. [
24].
Greenhouses are included in the system boundaries because of the shorter life span of these constructions and in order to compare vegetables grown under greenhouses with the open field ones;
Irrigation is considered for some crops (maize and vegetables) in which it is commonly practiced. However, only the water volumes are considered and not irrigation plants and electricity consumption for irrigation use;
Soil consumption and erosion are out of the analysis due to the lack of specific data;
The harvest factors,
i.e., the share of primary crop harvest of total aboveground plant biomass [
28] are used for calculating the “biotic” category of MI, thus the total amount of harvested biomass per product unit;
The analysis includes the transport of input materials for agriculture and all the deliveries along the supply chain. We assumed a truck transport having the MI values reported in Table S1 in Supplementary, calculated for Germany;
The MI factors of seed used in the calculation are the ones calculated for German crops [
21] as no MI factors for Italian seeds were available;
The MI factors of electricity refer to EU energetic mix [
23] (Table S1 in Supplementary).
All the other MI factors used in this study are the ones published by Wuppertal Institute [
23].
4.2.2. System Boundaries and Data Gathering
4.2.2.1. Vegetal Products
The system boundary used for cereals and dried pulses includes the production of agricultural inputs (for which pre-calculated MI factors have been used), the transport of the inputs to the farm (assuming an average distance of 150 km by truck), ploughing operations, sowing, fertilization, pest treatments and weed control, harvesting, storing (assuming a distance of 25 km from the farm to the storing center). Maize, sorghum and dried pulses processes include also grain drying.
The organic farming of cereals does not use agrochemicals, but inputs for the distribution of manure and slurry (that are livestock by-products, and have null material intensity) are accounted. The average yield of organic crops is assumed to be 25% less than the conventional one. This average value has been chosen on the basis of experts’ opinion and the available literature. Nevertheless, the difference in yields between conventional and organic is highly contextual, depending on the crop, the site characteristics and the farming management. According to Seufert
et al. [
31] the cereals and vegetables have a higher yield difference (up to 34%), while rain-fed legumes show the lowest. Thus, in this study the assumption of 25% yield difference implies that material intensity results for organic legumes may be overestimated, while results of organic cereals may be underestimated.
The production of silages requires, after harvesting, the heaping of the biomass, while hay is produced through a series of field operations (mowing, swathing, turning, baling) that are taken into account in terms of diesel consumption.
The vegetable crops under investigation are assessed according to three different growing practices: conventional in greenhouse (CG) conventional in open field (CF), and integrated agriculture in open field (IO). The production and management of greenhouses is taken into account [
32]; the other phases of the life cycle are nursery production, fertilization, irrigation, pest treatments and harvesting. The integrated production is assumed to avoid chemical fertilizers and to use 50% less amounts of pesticides. Water requirements are the same in conventional and integrated. Data on materials and energy inputs for crops and greenhouses are shown in Tables S2 and S3 in Supplementary.
4.2.2.2. Animal Based Products
Milk (Organic)
Data on milk and cheese production refers to an existing farm producing organic milk and Parmesan, located in the National Park of the Tuscany-Emilian Apennines and described in an LCA study [
33]. The farm is a representative example of organic and high quality production of a typical Italian foodstuff. The fodders for livestock are produced on the farm, through organic practices of cultivation. The feeding ration, which varies depending on the animals’ life stages, includes a mixed concentrate composed of: sorghum silage (53%); dried peas (35%); lucerne hay (7%); grass meadow hay (5%). MIs for these fodders have been previously calculated, as explained in
Section 4.2.2.1.
The assessment of milk material intensity is based on seven sub-processes: fodder production, weaning (using milk powder); yearling nutrition; cows’ nutrition; stables maintenance and milking; transport of milk to retailers (20 km). All the data used for the calculation are shown in Table S4 in Supplementary.
Parmesan (Organic)
The Parmesan production requires the mixture of skimmed and whole milk with the starting serum (from the previous day production) and addition of rennet.
The milk skimming process requires an electricity consumption of 2 kWh per day. The outputs are skimmed milk (90% in weight) and cream (10%). The impact of this process is allocated on the basis of economic criteria, thus considering the market price of the two outputs and the total amount produced: 66% of the impact is allocated to skimmed milk and 33% to cream [
33].
The cooking phase requires diesel consumption while only salt and a polyethylene film are needed for the next phases. The weight reduction during the resting and seasoning phases (10%) is also considered in the calculation. Other inputs are necessary for the maintenance of the plants (water, electricity, natural gas) (Table S5 in Supplementary).
Bovine Meat
The study takes into consideration production of organic and conventional meat. The two models are partially based on existing case studies from the literature [
34,
35], which are representative of two different breeding typologies spread over Northern Italy (Table S6 in Supplementary).
The system boundary includes the fodder production, the production, transport and employment of agricultural inputs, the cattle breeding and water intakes, energy, fossil fuels and water requirements for stable maintenance, the slaughtering phase, and the distribution and purchasing of meat. Waste management and impact of infrastructures and beef packaging have been neglected.
The organic process refers to the production of certified organic meat from semi-extensive breeding. The main data source is a study on the cattle breeding in Val Bormida, in the North West Italian region of Liguria [
35]. This area has a long-established vocation for high-quality meat production, using predominantly the “Piemontese” native breed. The traditional livestock technique is based on summer pasture and wintertime housing with farm-produced lucerne hay feeding. The farm under study has 59.66 ha of land (partially addressed to pasture and partially to fodder cultivation) and 40.4 large animal units (LAU), in a reproductive closed cycle. From the land cultivation, the farm obtains 103 t of grass meadows hay and 36 t of lucerne hay. In accordance with the Council Regulation (EC) No 834/2007 of 28 June 2007 [
16] on organic production, the animal density is low (0.68 LAU/ha of fodder land), the feeding ration is composed of farm-produced forages, the cattle can access open spaces through the pasturing.
The conventional process refers to a representative farm in the North-East Italian region of the Veneto, which presents the highest concentration of Italian cattle [
35]. In this area, the bovine livestock is highly specialized in bullock fattening for meat production on a medium-large scale. Calves are usually imported from Central and Northern Europe and intensively reared in permanent housing. The density of livestock is high, with 9 LAU/ha of fodder land. The diet ration is composed of maize silage (43%) and maize grain (16%) from the farm, soybean imported from Brazil (10%), pulp from sugar beet industry (22%), wheat straw (5%) and bran (4%). The system includes slaughtering.
The MIs of fodders (grain cereals, lucerne hay, silages, meadow grass) used for the calculation have been previously assessed (as explained in
Section 4.2.2.1). The MI of soybean from Brazil is from Lettenmeier
et al. [
22]; by-products used for animal feeding (pulps from sugar beet industry and wheat straw) according to the methodology guidelines [
36] have null material inputs, because they are scruffs of other productive processes. The transport of these products is included when they are produced outside the farm. In the case of conventional breeding, we assumed the sugar beet pulps and bran being transported for 150 km.
In the organic system, cattle reproduce naturally and the herd is composed of animals at different development stages. The conventional farm, instead, is specialized in calve fattening. The animals are purchased at an average weight of 350 kg and sold at around 630 kg [
35]. In this case, calves are considered as inputs of production and their material intensity is obtained from the results of the organic process.
Data on stables’ energy consumptions has been gathered from ENAMA [
25]. They refer to an average equipped stable, with conveyor belt and are dimensioned on the basis of the annual housing time (all the year in the conventional, only winter in organic). Energy and water consumption in the slaughtering phase are the same for the two systems. They are provided by the legislative decree 372/99 (Article 3, Paragraph 9) illustrating the guidelines for the identification of the best practices for butchers [
37].
The phases of transports in the meat chain encompass the provision of inputs for agriculture and of fodders and calves (in the conventional system), the trip from the farm to the slaughterhouse (Table S7 in Supplementary).
4.2.2.3. Processed Foodstuffs
Pasta
The material intensity of pasta from conventional and organic durum wheat has been assessed, using MI of wheat previously calculated (for organic) and the ones published in Mancini
et al. [
24] for conventional. Data used in these calculations are from an LCA study [
38].
In pasta from conventional agriculture (CA) was assumed that half of the wheat used is imported from abroad. The average distance covered by imported wheat results from the average distance of the first 12 countries exporting to the Italian market, weighted for the amounts provided [
39]. Thus, the average distance is 5558 km. The remaining part of the wheat (50%) has national origin and the average distance of provision reported by the literature is 183.3 km.
Organic pasta is produced only with national wheat, assuming an average distance of 100 km for the provision.
The system boundary includes wheat cultivation, grain storing, milling, storing of semolina, pasta production and packaging. Material and energy inputs used for the production of pasta are illustrated in Table S8 in Supplementary.
4.3. Design of the Study: Products from Ma-Pi Polyculture
Ma-Pi polyculture has been scarcely studied and a scientific literature on this agronomic practice does not exist. Therefore, data capture for the MI calculation has been carried out submitting questionnaires to farmers supplying UPM (most of the used data are also the declared in the labels of the food sold in UPM shops).
Given the peculiarity of Ma-Pi polyculture farming system, which is based on intercropping, the chosen service unit for MIPS calculation is a mixed vegetal unit (1 kg) coming from a polyculture parcel land. Additionally, MIs of some main products, which are grown in intercropping systems having a minor variety of crops, have been calculated. In these cases, other outputs of cultivation are assessed as by-products, using appropriate allocation rules, based on mass criteria.
4.3.1. Material Intensity of a Vegetal Unit from Polyculture
The parcel land under study (1 ha) contains four rows of fruit trees (104 trees, in total), is surrounded by a hedge of productive plants (from which firewood, poles, soft fruits are collected) and includes five sub-parcels of 1800 m2 in which a wide variety of vegetables is cropped. Aromatic and edible wild herbs are also collected in the parcel. The MI calculation includes only edible products from polyculture; Table S9 in Supplementary lists the plants varieties and their annual yields. The crops succeed in two turns.
According to Ma-Pi Polycolture prescriptions, external inputs are minimized and chemical fertilizers and pesticides are totally avoided. The inputs employed are diesel for the field operations (380 L/year), water for irrigation (450 m3) and electricity for the irrigation plant (90 kWh).
4.3.2. Material Intensity of Selected Products from Ma-Pi Polyculture
Five agricultural products have been analyzed: whole rice, barley, millet, beans and couscous from durum wheat. Each crop/foodstuff is grown between other plants as shown in Table S10 in Supplementary, and the impact is allocated to various outputs on the base of its mass. The seed is self-produced by the farm, and fertilization is granted through green manure. The external inputs are diesel for field operations and materials and electricity for packaging. All foodstuffs are packed in Polyvinylchloride (PVC) bags (3.6 × 10⁻⁴ kg/kg) using 0.0385 kWh/kg of electricity.
Couscous from durum wheat is the only processed foodstuff considered. The milling phase consumptions are assumed to be equal to the wheat ones. Water requirements and other inputs used in agriculture are shown in Table S11 (in Supplementary). Irrigation of rice requires on average 500 kg of water per kg of products. Considering allocations between the secondary products obtained by the rice field, the resulting amount of water for rice irrigation is 285 kg.
5. Results and Discussion
Table 2 illustrates results of food material intensity, “from cradle to gate”,
i.e., considering the supply chain of foodstuffs, from the production of agricultural inputs until the harvesting or post harvesting treatment (for agricultural products) or the packaging (for foodstuffs). Therefore, only the production phases are considered in this analysis: food distribution, consumption and end-of-life are not included in this study.
Results display the intake of resources (in terms of abiotic and biotic materials, water and air) that is required for producing one kilogram of food/agricultural product, using different agricultural practices: conventional, organic and Ma-Pi polyculture.
Table 2.
Results on material intensity of agricultural products and foodstuffs produced with different conventional and organic agricultural practices (kg/kg).
Table 2.
Results on material intensity of agricultural products and foodstuffs produced with different conventional and organic agricultural practices (kg/kg).
| Crops/foodstuffs | Farming practice | Abiotic | Biotic | Water | Air |
|---|
| Cereals |
| Maize | Conventional | 0.53 | 2.08 | 457.04 | 0.23 |
| Maize, dried | Conventional | 0.65 | 2.40 | 526.84 | 0.36 |
| Sorghum | Conventional | 0.51 | 2.08 | 5.03 | 0.18 |
| Sorghum, dried | Conventional | 0.62 | 2.32 | 5.96 | 0.31 |
| Sorghum, dried | Organic | 0.10 | 2.08 | 0.79 | 0.23 |
| Wheat | Organic | 0.08 | 1.83 | 0.59 | 0.13 |
| Barley | Conventional | 0.80 | 1.88 | 5.48 | 0.22 |
| Barley | Organic | 0.04 | 1.90 | 0.32 | 0.10 |
| Oats | Conventional | 0.96 | 1.93 | 6.21 | 0.26 |
| Oats | Organic | 0.05 | 1.96 | 0.39 | 0.13 |
| Rye | Conventional | 1.09 | 1.93 | 6.29 | 0.26 |
| Rye | Organic | 0.08 | 1.96 | 0.53 | 0.16 |
| Fodders |
| Maize silage | Conventional | 0.10 | 1.00 | 83.12 | 0.05 |
| Sorghum silage | Conventional | 0.10 | 1.00 | 85.35 | 0.05 |
| Sorghum silage | Organic | 0.02 | 1.00 | 112.65 | 0.04 |
| Lucerne hay | Conventional | 0.25 | 4.50 | 68.47 | 0.15 |
| Lucerne hay | Organic | 0.07 | 4.50 | 0.51 | 0.17 |
| Clover hay | Conventional | 0.33 | 4.50 | 184.11 | 0.17 |
| Clover hay | Organic | 0.06 | 4.50 | 242.86 | 0.15 |
| Dried pulses |
| Field beans | Conventional | 1.27 | 1.91 | 8.10 | 0.34 |
| Field beans | Organic | 0.12 | 1.94 | 1.41 | 0.24 |
| Lupins | Conventional | 0.29 | 1.88 | 5.13 | 0.25 |
| Lupins | Organic | 0.11 | 1.90 | 1.13 | 0.23 |
| Bean, dried | Conventional | 1.19 | 1.87 | 8.95 | 0.71 |
| Bean, dried | Organic | 0.32 | 1.88 | 2.50 | 0.73 |
| Peas, dried | Conventional | 0.39 | 1.89 | 5.59 | 0.45 |
| Peas, dried | Organic | 0.22 | 1.91 | 1.97 | 0.49 |
| Vegetables |
| Tomatoes | Conventional, greenhouse | 1.95 | 1.00 | 44.73 | 4.18 |
| Tomatoes | Conventional, open field | 0.09 | 1.00 | 30.40 | 0.04 |
| Tomatoes | Integrated agr., open field | 0.02 | 1.00 | 29.64 | 0.03 |
| Lettuce | Conventional, greenhouse | 5.79 | 1.00 | 76.95 | 12.51 |
| Lettuce | Conventional, open field | 0.18 | 1.00 | 30.90 | 0.12 |
| Lettuce | Integrated agr., open field | 0.04 | 1.00 | 29.77 | 0.09 |
| Zucchini | Conventional, greenhouse | 3.31 | 1.00 | 35.14 | 7.16 |
| Zucchini | Conventional, open field | 0.19 | 1.00 | 15.98 | 0.10 |
| Zucchini | Integrated agr., open field | 0.05 | 1.00 | 29.94 | 0.07 |
| Animal based products |
| Milk, whole | Organic | 0.41 | 4.63 | 20.76 | 0.30 |
| Milk, skimmed | Organic | 0.30 | 3.39 | 15.24 | 0.22 |
| Parmesan | Organic | 7.11 | 69.07 | 322.92 | 5.43 |
| Beef | Conventional | 6.84 | 43.91 | 2222.71 | 6.89 |
| Beef | Organic | 3.14 | 49.37 | 137.14 | 6.46 |
| Processed foodstuffs |
| Pasta | Conventional | 1.62 | 3.20 | 28.75 | 0.88 |
| Pasta | Organic | 1.15 | 2.43 | 21.71 | 0.49 |
The impact has been allocated between products and co-products using mass criteria in the conventional and organic systems. Depending on the chosen allocation criteria results can change significantly, especially in polycultural systems where the main crop and co-product can have similar yields. For this reason, the material intensity of products from Ma-Pi polyculture has been calculated using both mass and economic allocation rules (
Table 3). Results on water for irrigated crops (beans and rice) are particularly sensitive to changes in allocation rules.
Table 3.
Results on material intensity of agricultural products and foodstuffs produced with Ma-Pi polyculture (kg/kg).
Table 3.
Results on material intensity of agricultural products and foodstuffs produced with Ma-Pi polyculture (kg/kg).
| Products from Ma-Pi polyculture | Mass allocation | Economic allocation |
|---|
| Abiotic | Biotic | Water | Air | Abiotic | Biotic | Water | Air |
|---|
| Mix vegetable Ma-Pi | 0.04 | 1.10 | 40.78 | 0.09 | n.a. |
| Beans | 0.02 | 0.52 | 186.80 | 0.04 | 0.03 | 0.86 | 311.63 | 0.07 |
| Rice, puddy | 0.02 | 1.05 | 285.14 | 0.05 | 0.03 | 1.84 | 500.24 | 0.08 |
| Cous cous | 0.01 | 0.97 | 0.08 | 0.03 | 0.01 | 0.88 | 0.08 | 0.03 |
| Millet | 0.02 | 1.05 | 0.22 | 0.02 | 0.03 | 1.78 | 0.37 | 0.04 |
| Barley | 0.02 | 0.59 | 0.13 | 0.04 | 0.02 | 0.57 | 0.12 | 0.04 |
Results of the vegetable mix produced from a polycultural parcel do not require the application of allocation rules; instead the material intensity has been calculated considering only one output (the mix of different vegetables) and all the inputs used in the parcel for cultivation.
Table 4,
Table 5,
Table 6 and
Table 7 illustrate how the use of resources is distributed along the supply chain in some representative agricultural products and foodstuffs, displaying the phases of the life cycle which most contribute to the resource consumption.
In the conventional farming of cereals, most of the water consumption depends on irrigation, when it is practiced (e.g., maize) or on fertilizers and pesticides’ production in non-irrigated crops (e.g., sorghum,
Table 4). Fertilizers are also the main contributors of abiotic resource consumption while air category is affected mainly by diesel used in field operations. In organic production, transports and diesel for field operations are instead responsible for most of the air consumption and abiotic materials (
Table 4).
Table 4.
Material intensity composition of sorghum, dried, conventional (Conv.) and organic (Org.) (kg/kg).
Table 4.
Material intensity composition of sorghum, dried, conventional (Conv.) and organic (Org.) (kg/kg).
| Components of sorghum material intensity | Abiotic | Biotic | Water | Air |
|---|
| Conv. | Org. | Conv. | Org. | Conv. | Org. | Conv. | Org. |
|---|
| Seed | 0.00 | 0.00 | 0.00 | 0.00 | 0.04 | 0.06 | 0.00 | 0.00 |
| Fertilizers | 0.53 | 0.00 | 0.00 | 0.00 | 3.00 | 0.00 | 0.12 | 0.00 |
| Pesticides | 0.01 | 0.00 | 0.00 | 0.00 | 2.33 | 0.00 | 0.00 | 0.00 |
| Transport | 0.01 | 0.01 | 0.00 | 0.00 | 0.08 | 0.05 | 0.01 | 0.01 |
| Diesel | 0.07 | 0.10 | 0.00 | 0.00 | 0.51 | 0.68 | 0.17 | 0.22 |
| Biotic | 0.00 | 0.00 | 2.32 | 2.08 | 0.00 | 0.00 | 0.00 | 0.00 |
| Total material intensity | 0.62 | 0.10 | 2.32 | 2.08 | 5.96 | 0.79 | 0.31 | 0.23 |
Table 5.
Material intensity composition of tomatoes in greenhouse, conventional agriculture (Conv.) and open field, integrated agriculture (Int.) (kg/kg).
Table 5.
Material intensity composition of tomatoes in greenhouse, conventional agriculture (Conv.) and open field, integrated agriculture (Int.) (kg/kg).
| Components of tomatoes material intensity | Abiotic | Biotic | Water | Air |
|---|
| Conv. | Int. | Conv. | Int. | Conv. | Int. | Conv. | Int. |
|---|
| Greenhouse | 1.86 | n.a. | 0.00 | n.a. | 14.27 | n.a. | 4.13 | n.a. |
| Seed | 0.00 | 0.00 | 0.00 | 0.00 | 0.00 | 0.00 | 0.00 | 0.00 |
| Fertilizers | 0.06 | 0.00 | 0.00 | 0.00 | 0.31 | 0.00 | 0.01 | 0.00 |
| Pesticides | 0.00 | 0.00 | 0.00 | 0.00 | 0.95 | 0.47 | 0.00 | 0.00 |
| Irrigation | 0.00 | 0.00 | 0.00 | 0.00 | 29.04 | 29.04 | 0.00 | 0.00 |
| Transport | 0.01 | 0.01 | 0.00 | 0.00 | 0.12 | 0.06 | 0.01 | 0.01 |
| Diesel | 0.01 | 0.01 | 0.00 | 0.00 | 0.05 | 0.07 | 0.02 | 0.02 |
| Biotic | 0.00 | 0.00 | 1.00 | 1.00 | 0.00 | 0.00 | 0.00 | 0.00 |
| Total material intensity | 1.95 | 0.02 | 1.00 | 1.00 | 44.73 | 29.64 | 4.18 | 0.03 |
Table 6.
Material intensity composition of whole milk, organic agriculture (kg/kg) (Values without allocations).
Table 6.
Material intensity composition of whole milk, organic agriculture (kg/kg) (Values without allocations).
| Components of milk material intensity | Abiotic | Biotic | Water | Air |
|---|
| Milk and milk powder for calves | 0.30 | 1.03 | 11.39 | 0.08 |
| Fodders | 0.11 | 4.35 | 0.98 | 0.25 |
| Cattle water intake | 0.00 | 0.00 | 8.93 | 0.00 |
| Stables maintenance | 0.06 | 0.00 | 2.24 | 0.02 |
| Transport | 0.00 | 0.00 | 0.00 | 0.00 |
| Total material intensity | 0.47 | 5.38 | 23.54 | 0.35 |
Table 7.
Material intensity composition of Parmesan, organic agriculture (kg/kg).
Table 7.
Material intensity composition of Parmesan, organic agriculture (kg/kg).
| Components of Parmesan material intensity | Abiotic | Biotic | Water | Air |
|---|
| Milk and milk powder for calves | 3.81 | 11.63 | 147.08 | 0.99 |
| Fodders | 1.46 | 57.44 | 12.87 | 3.36 |
| Cattle water intake | 0.00 | 0.00 | 117.76 | 0.00 |
| Stables maintenance | 0.85 | 0.00 | 29.59 | 0.27 |
| Transport | 0.01 | 0.00 | 0.10 | 0.01 |
| Dairying process | 0.99 | 0.00 | 15.52 | 0.80 |
| Total material intensity | 7.11 | 69.07 | 322.92 | 5.43 |
Concerning the production of vegetables, greenhouses constitute the major part of the total abiotic and air consumption (95% and 99%, respectively), and 31% of the water. In the conventional system, on open field, fertilizers and diesel are the main contributors to the material input, while in the integrated production (on open field) the impact of transport and fuels on air and abiotic consumption is more relevant (
Table 5).
In milk production, the milk powder used for feeding calves constitutes the major part of the material input, especially the abiotic (63%) and water (48%) (
Table 6). The production of fodders is the second largest source of consumption of abiotic materials and air, and the largest for biotic materials. A similar outcome is for Parmesan production (
Table 7), where the dairying process contributes modestly to the consumption of abiotic resources (14%) and air (15%). Stables maintenance (which includes fuels, electricity, water consumption but not the infrastructure) slightly affects the total impact: 14% of abiotic, 10% of water and 6% of air in the milk process, 12% of abiotic, 9% of water, 5% of air in that of cheese.
Results of meat show that organic production allows a drastic reduction of the input of abiotic resources, water and soil, in spite of a lower productivity (in terms of input/output ratio) of extensive breeding systems. In the conventional system, calves are purchased and imported, thus are considered as productive inputs and are responsible for 65% of the biotic resource consumption. Fodder production has the highest impact both in conventional and organic systems, in all resource categories. The slaughtering phase is also relevant in terms of air and abiotic resources, while stable maintenance’s impact is visible only in the organic system (
Table 8).
In the production of pasta from conventional agriculture, transport contributes to 29% of the air and 15% of abiotic consumption (
Table 9). The farming phase has a major weight in the conventional production, while in the organic one the industrial phase (including milling, pasta production and packaging) is the main contributor.
Fuels used in field operations are the main sources of impact in products from Ma-Pi polyculture. They particularly affect the consumption of abiotic materials and air (
Table 10).
Table 8.
Material intensity composition of beef, conventional (Conv.) and organic (Org.) (kg/kg).
Table 8.
Material intensity composition of beef, conventional (Conv.) and organic (Org.) (kg/kg).
| Components of beef material intensity | Abiotic | Biotic | Water | Air |
|---|
| Conv. | Org. | Conv. | Org. | Conv. | Org. | Conv. | Org. |
|---|
| Calves | 0.72 | n.a. | 28.65 | n.a. | 63.67 | n.a. | 1.57 | n.a. |
| Fodders | 4.40 | 1.44 | 15.26 | 49.37 | 2105.81 | 10.30 | 2.59 | 3.40 |
| Cattle water intake | 0.00 | 0.00 | 0.00 | 0.00 | 36.11 | 99.62 | 0.00 | 0.00 |
| Stables maintenance | 0.00 | 0.41 | 0.00 | 0.00 | 0.04 | 4.14 | 0.01 | 0.75 |
| Slaughtering | 1.30 | 1.30 | 0.00 | 0.00 | 13.35 | 13.26 | 2.31 | 2.31 |
| Transport | 0.58 | 0.01 | 0.00 | 0.00 | 5.06 | 0.10 | 0.55 | 0.01 |
| Total material intensity | 7.00 | 3.15 | 43.91 | 49.37 | 2224.05 | 127.41 | 7.04 | 6.47 |
Table 9.
Material intensity composition of pasta, conventional (Conv.) and organic (Org.) (kg/kg).
Table 9.
Material intensity composition of pasta, conventional (Conv.) and organic (Org.) (kg/kg).
| Components of pasta material intensity | Abiotic | Biotic | Water | Air |
|---|
| Conv. | Org. | Conv. | Org. | Conv. | Org. | Conv. | Org. |
|---|
| Wheat | 0.42 | 0.05 | 3.23 | 2.45 | 6.91 | 0.35 | 0.37 | 0.03 |
| Milling phase | 0.58 | 0.58 | 0.00 | 0.00 | 10.83 | 11.17 | 0.08 | 0.15 |
| Pasta production phase | 0.34 | 0.34 | 0.00 | 0.00 | 7.28 | 7.28 | 0.17 | 0.17 |
| Packaging | 0.16 | 0.16 | 0.00 | 0.00 | 2.74 | 2.74 | 0.10 | 0.10 |
| Transport | 0.28 | 0.04 | 0.00 | 0.00 | 2.48 | 0.37 | 0.31 | 0.04 |
| Total material intensity | 1.78 | 1.17 | 3.23 | 2.45 | 30.24 | 21.90 | 1.04 | 0.50 |
Table 10.
Material intensity composition of rice from Ma-Pi polyculture (kg/kg).
Table 10.
Material intensity composition of rice from Ma-Pi polyculture (kg/kg).
| Components of rice material intensity | Abiotic | Biotic | Water | Air |
|---|
| Diesel for field operation | 0.03 | 0.00 | 0.24 | 0.08 |
| Irrigation | 0.00 | 0.00 | 500.00 | 0.00 |
| Farming | 0.00 | 1.84 | 0.00 | 0.00 |
| Packaging | 0.07 | 0.00 | 1.36 | 0.02 |
| Transport | 0.01 | 0.00 | 0.05 | 0.01 |
| Total material input | 0.11 | 1.84 | 501.65 | 0.10 |
5.1. Discussion of Results
Results of MIPS analysis on Italian agricultural products and foodstuffs provide information on the resource efficiency of different foodstuffs and agricultural products, produced through conventional, organic and Ma-Pi polyculture practices.
Amongst agricultural products, vegetables in greenhouse have the highest impact in terms of Total Material Requirement (TMR,
i.e., the sum of abiotic and biotic materials). The open field cultivation allows a drastic resource saving (
Figure 2).
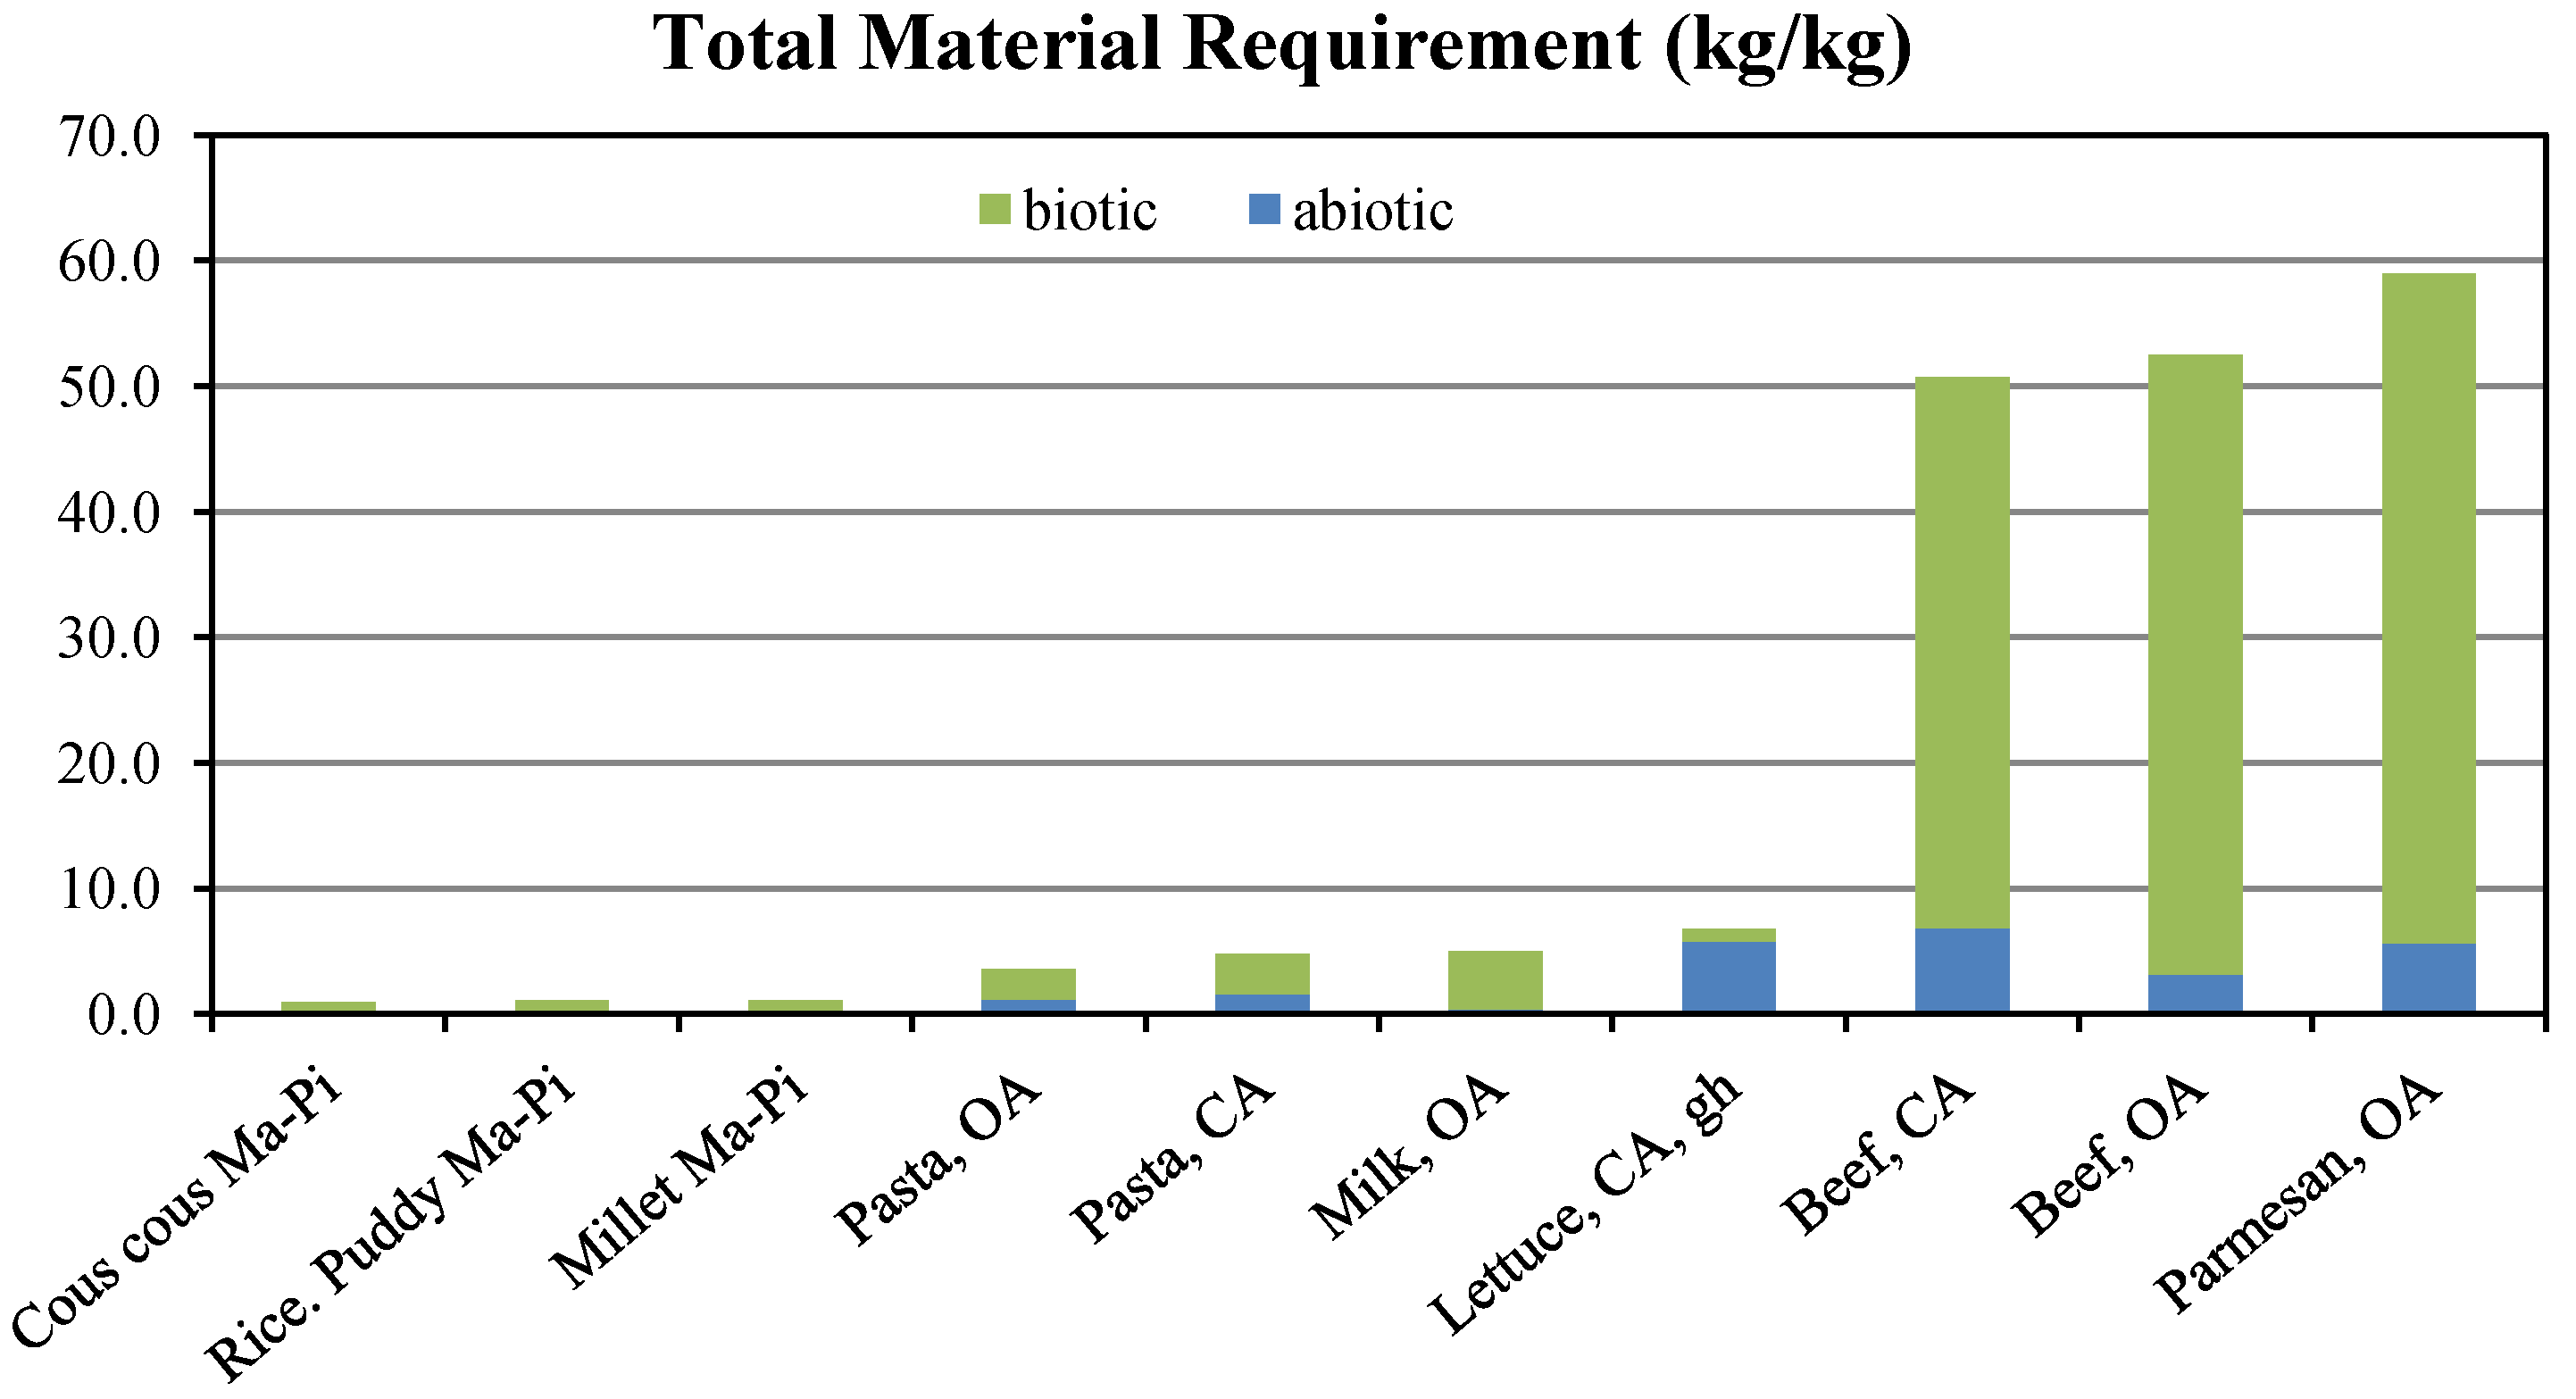
Regarding processed foodstuffs (
Figure 3) results confirm the high impact of meat and cheese, which have the highest TMR, air and (in the case of meat) water consumption (see also
Table 6). Many other studies have demonstrated the high environmental impact of meat, in terms of climate change potential [
40,
41,
42], water footprint [
43] and energy consumption [
44]. This survey confirms similar outcomes in terms of material consumption.
As the concept of material intensity focuses on the withdrawing of natural resources (which is assumed to be a proxy measure for environmental impact), MIPS results—accounting for the inputs along the life cycle and relating it to an output unit—disclose the productivity of production processes, in biophysical terms.
Results show that conventional systems, in spite of higher yields, are in many cases less resource efficient due to the massive amount of inputs employed. This is particularly evident in vegetables grown in greenhouses, where the higher yields do not compensate the use of energy and materials.
Organic productions have a lower yield with respect to conventional ones (it was assumed 25% less than the conventional when specific data was lacking). Nevertheless, organic practice resulted in a higher productivity in terms of material resource used in many crops (e.g., barley, peas, beans, sorghum). The reduction of resource use in organic systems is especially observable in the category of abiotic, water and air.
Figure 2.
Total Material Requirement of selected crops (kg/kg).
Figure 2.
Total Material Requirement of selected crops (kg/kg).
Figure 3.
Total Material Requirement of selected foodstuffs (kg/kg).
Figure 3.
Total Material Requirement of selected foodstuffs (kg/kg).
In general, a trade-off between abiotic or non-renewable and biotic or renewable resources emerges. This is attributable to the higher amounts of seed, i.e., biotic material, per product unit required by organic farming and the use of the vegetal biomass in order to substitute the agrochemicals (e.g., green manure). Impact of biotic materials employed in organic production is even more evident in animal based products. The TMR of organic meat, instead, is slightly higher than the conventional one due to the major value of biotic resources used (49.37 kg/kg vs. 43.91 kg/kg). It reflects that the amount of biomass used for livestock feeding per unit of meat obtained is higher in the organic and extensive system, where cattle graze for the greater part of the year (while in the conventional system concentrated fodders are employed). Nevertheless, organic meat halves the consumption of abiotic materials (3.15 kg/kg vs. 6.84 kg/kg) and reduces drastically water consumption (137.24 kg/kg vs. 2222.71 kg/kg), which in the conventional system are due to fodder cultivation for 95%.
Results on UPM products show that a strong reduction of food material intensity is achievable using agronomic techniques that minimize the employment of external inputs.
In general, results reveal that a major yield does not imply a higher productivity when this gain is obtained with more than proportional employment of inputs.
5.2. Discussion on the MIPS Indicator
MIPS results on agricultural products and foodstuffs grown with different farming practices has provided a material efficiency rating, based on the amount of resources used per unit of obtained output. This indicator provides an estimate of the productivity of different farming practices, in terms of material resources’ use.
The strength of this method is that it encompasses different resource categories, allowing understanding of possible tradeoffs in resource use and avoiding shifting of burdens between different resource categories.
Further potentials of MIPS consist in a straightforward communication of results and in the easy applicability in eco-design contexts, or for supporting resource efficiency policy.
At company level, the use of primary data makes the method suitable for applying dematerialization strategies and enabling an easy comparison between alternatives. The compilation of input inventories as well as the calculation of material intensity (that does not require any dedicated software) can be performed with limited efforts in terms of cost and time.
As shown in this study, the use of secondary data from scientific literature, statistics and LCA studies can instead ease the accomplishment of studies at macro or sectorial level in the field of sustainable production and consumption.
As a tool for evaluating the sustainability of products and services, MIPS has the advantage of focusing on resource efficiency, which has been acknowledged as a priority area for the EU policy [
4] and can be adopted for driving agricultural systems towards a sustainable intensification. Moreover, the analysis of material intensity along the supply chain can be combined with an economic efficiency analysis in order to optimize the use of resources both from an environmental and economic point of view [
45].
Compared to LCA, MIPS analysis lacks information about the impact of resource use in terms of, e.g., scarcity. However, MIPS results provide a straightforward knowledge on the input/output ratio of processes in terms of material natural resources. It therefore allows the implementation of optimization strategies. This kind of information is not readily available from LCA results; yet, the LC inventory can be used to perform a MIPS analysis, which can complement the environmental profile provided by LCA with a material efficiency assessment. Moreover, MIPS encompasses biotic resources, which are currently overlooked by most of the LC impact assessment methods (e.g., the method recommended at EU level, the Abiotic Depletion Potential [
13,
46]).
Shortcomings of the method consist in the limited availability of MI factors, which refer mainly to Germany or at the EU level. The quality of data used for the assessment of MIPS is a further issue which could limit the robustness of the analysis. In this study, diverse sources of data have been used, but only some products have been assessed with data from peer-reviewed studies.
Moreover, MIPS is a rough quantitative evaluation, based on input inventories which does not provide any information on scarcity of resource, i.e., resources use in relation to availability.
Therefore, MIPS analysis should be complemented with other indicators/assessments if more detailed information is required. Specific environmental aspects, i.e., the toxicity of substances used in the agricultural production processes and their pollutant potential, can follow and integrate the MIPS analysis when an in-depth investigation is necessary. The impact of agricultural practices in biodiversity is a further issue of relevance when evaluating the sustainability of food systems.
6. Conclusions
Resource efficiency has been acknowledged by EU policy as a main strategy for achieving a sustainable growth. Given the increasing need for food and bio-based products—driven by megatrends demographic growth and economic development—agriculture and food systems are key sectors in which resource efficiency should be applied. Simultaneously, environmental burdens of food production and consumption should be reduced.
MIPS indicator has been applied in this study to a set of agricultural products and foodstuffs, in order to measure their material efficiency and the resource productivity of different agricultural practices: conventional, organic and Ma-Pi polyculture.
Results showed that, in spite of higher yields achieved in conventional agriculture, many products grown with this practice have a lower material efficiency than the corresponding organic products: higher amounts of inputs employed are not compensated by the greater outputs.
Ma-Pi polyculture, a low input farming system, demonstrates the best performance in terms of material efficiency and allows a drastic reduction of resource consumption. However, this practice has been evaluated only for a limited number of products of vegetal origin (according to the diet that this farming practice supplies, within the food chain “Un Punto Macrobiotico”).
Results suggest that low input farming systems should be promoted in order to gain material efficiency and drive agricultural systems towards productive and sustainable pathways.
A constraining factor for the robustness of the MIPS analysis is the availability of reliable data, which can be gathered from the literature or directly reported.
However, MIPS analysis responds to the present policy priority, i.e., resource efficiency, and monitoring progress towards a sustainable intensification of farming systems. At the same time, this methodology allows a straightforward communication of the impact of food in terms of material requirements. It includes all the burdens along the supply chain, e.g., related to transports of raw materials, intermediate products and food distribution. The life cycle approach avoids shifting of burdens between resource categories and life cycle phases. Thus, it could also be effectively used to guide consumer choice towards green purchases.


