1. Introduction
The current goals of U.S. biofuels production, (
i.e., 36 billion gallons of renewable fuels by 2022, which includes 15 billion gallons derived from corn starch and the remaining 21 billion gallons derived from cellulosic plant material [
1]) is expected to extend biomass crop production to marginal lands and lands with degraded production capabilities [
2,
3,
4] and/or compete for land with traditional food crops. Driven by growing populations, increasing energy demand, and high energy costs, it is very likely that energy crop production would continue to expand and new ethanol processing plants would continue to emerge in various locales across the U.S., which in turn would provide agricultural producers with sufficient incentives to apply greater amounts of fertilizers and cultivate marginal lands with little regards to environmental and economic consequences.
Bioenergy feedstock production on marginal and degraded lands could demand increased application of chemicals and fertilizers [
5] and can have far‑reaching economic consequences due to impacts on soil quality, water quality [
6], and biodiversity. The economic costs of impaired water quality from U.S. cropland erosion were estimated to be in the range of $2 to $8 billion per year [
7]. Similarly, [
4] estimated that expansion of corn and soybean production primarily for biofuel to Conservation Reserve Program (CRP) lands would result in 145 million tons in increased erosion annually at an expense of $11.13 per ton of soil erosion. As a result, expansion of crop production to conservation land could not only have environmental impacts but also significant economic costs. Substantial literature also exists on other potential impacts of production of first and second-generation biofuels, such as change in carbon emissions from land use change [
8], loss in forest cover [
9], and increased competition for water resources [
10], among others.
Best Management Practices (BMPs) are management options that have been proven effective in reducing pollutant levels reaching the water bodies through various independent studies [
11,
12,
13,
14,
15]. However, BMPs can be expected to vary by location in effectiveness and usefulness over time [
12]. Establishment and operation costs of BMPs over their expected useful life (the expected useful life for a BMP is described as providing mitigation of pollutant loadings over a certain period before reestablishment of the BMP is required) make the decision to adopt these practices economic in nature. Agricultural producers making crop management decisions usually lack the economic information necessary to internalize any crop production related externality. In this context, it is imperative to note that there is a need for research to not only estimate the impacts of biomass crop production on water quality, but to evaluate the relative cost-effectiveness of the mitigation practices if biofuels are to become a sustainable energy solution for the U.S. Furthermore, the study would provide insight on the economics of environmental impacts of cellulosic biofuels, currently immature but projected to become competitive and significantly contribute to transportation fuel.
2. Materials and Methods
2.1. Study Area
The current research extends [
16] research that was directed toward providing a comprehensive analysis of the estimated costs of producing and supplying biomass feedstock to a 30-million gallon per year ethanol-conversion facility in the Middle Gulf Coast, Edna-Ganado, Texas area. It is expected that there could be economic incentives in terms of lower transportation costs for producers in the region to respond to the emergence of a market for biofuel feedstock. As a result, the study area selected for the hydrologic and economic research is located within the 60‑mile radius of the watershed housing the ethanol conversion facility.
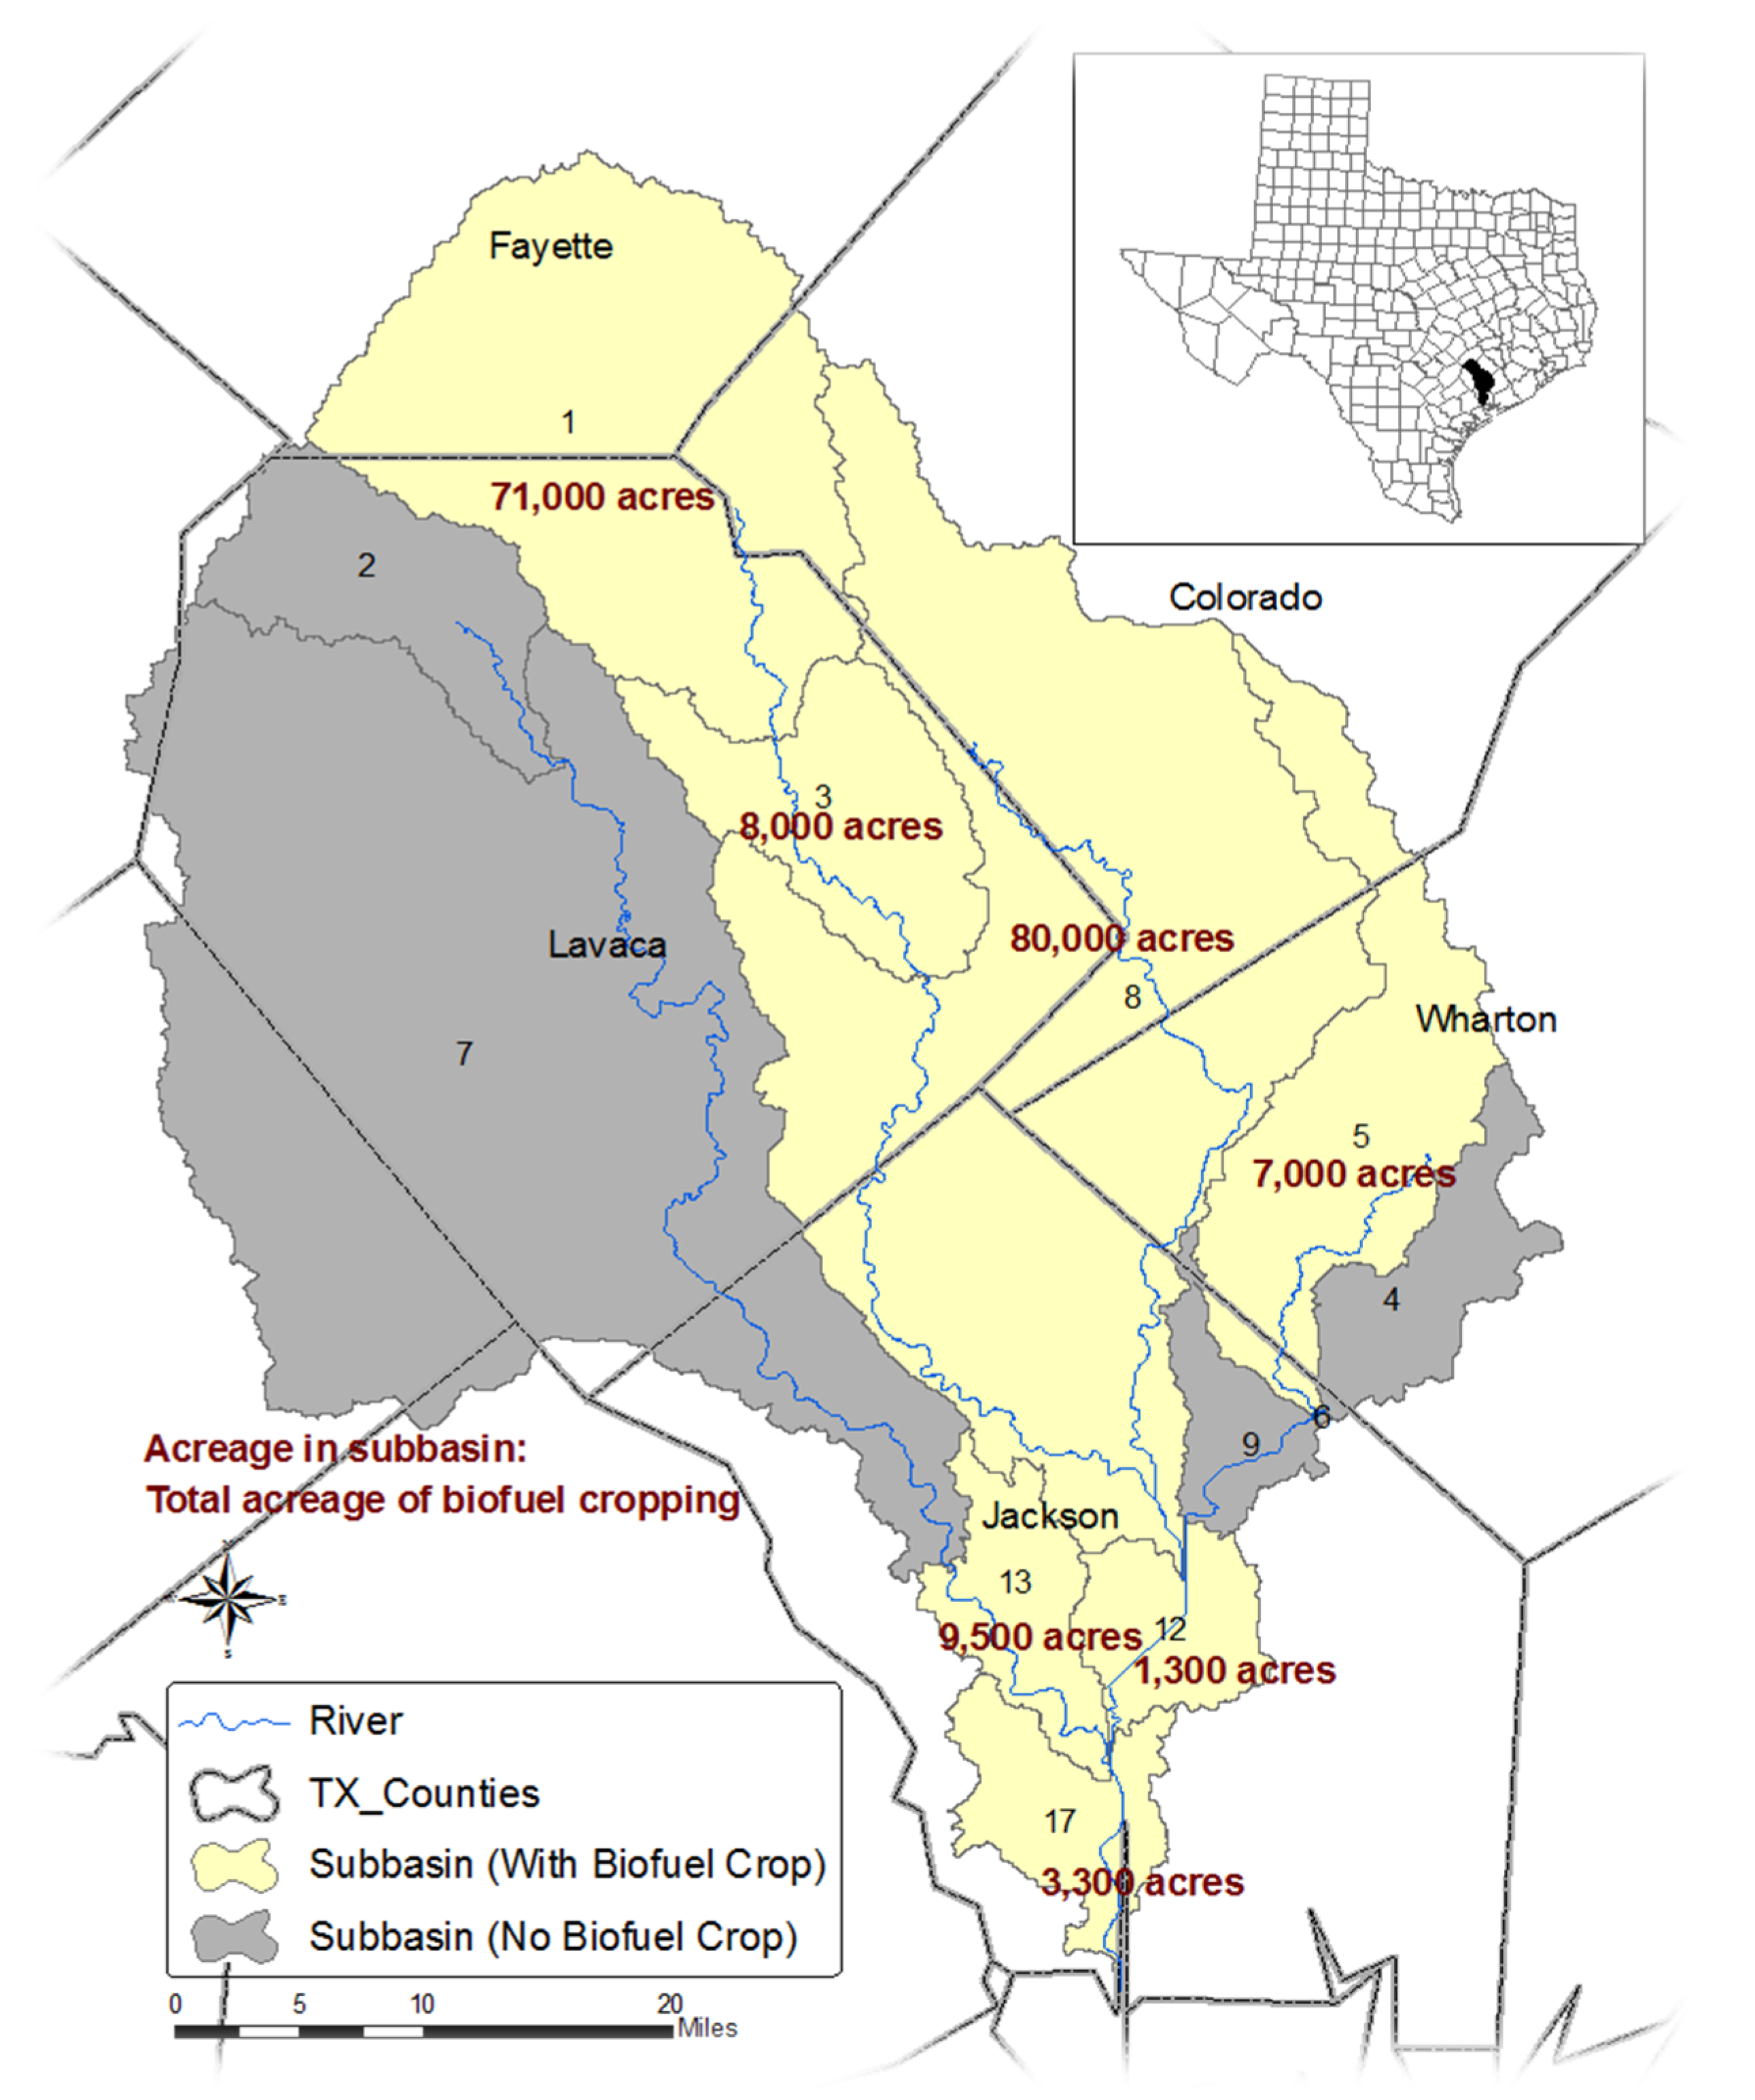
Figure 1.
Sub‑basins of the Tres-Palacios River Watershed, Middle-Gulf Coast, Texas where High‑Energy Sorghum is assumed to replace pastureland to supply biomass for a hypothetical 30-million gallon ethanol plant.
Figure 1.
Sub‑basins of the Tres-Palacios River Watershed, Middle-Gulf Coast, Texas where High‑Energy Sorghum is assumed to replace pastureland to supply biomass for a hypothetical 30-million gallon ethanol plant.
The study area covers parts of Colorado, Fayette, Jackson, Lavaca, and Wharton counties, which are part of the Tres-Palacios River watershed (
Figure 1). The watershed comprises an area of 2300 square miles (nearly 1.5 million acres) that flows into Matagorda Bay. Much of the region in the watershed was once planted to rice, and it became mostly pasture during the 1980s. The revenues from pasture frequently involves very minimal revenues from grazing, often from $0 to $15 per acre. The region is characterized by an annual average precipitation of 42 inches and an average slope of 0.8 percent. The predominant soil textures in the study area are clay loam, sandy loam, and sandy clay loam. For the purpose of this study, the watershed is divided into 17 sub-basins. The outlet of the entire watershed is located in sub-basin 17, where sediment and nutrient loadings represent the cumulative effect of the cropping patterns and management practices, both upstream and within the sub‑basin. The light colored areas in
Figure 1 represent the sub‑basins in the watershed where the High Energy Sorghum (HES) production was assumed to replace pastureland.
2.2. Biofuel Feedstock
The prospects for ethanol energy from simple pasture crops remains to be demonstrated. HES and Switchgrass are regarded as preferred feedstock for biofuel production, mostly because of their ability to produce meaningful supplies of biomass [
17]. High Energy Sorghum was selected for analysis in this study due to its ability to produce large amounts of dry weight biomass per acre, its relatively low input usage, and the climate found in the south‑central and south-eastern United States is well suited for the production of the crop [
18,
19]. In addition, HES is also characterized as drought tolerant and requires one-half less water than corn [
20]. Hence, HES was chosen to replace the pastureland as a potential biofuel crop in the current analysis.
To generate the change in discharges from the land due to pasture conversion to cropland, the Soil Water Assessment Tool (SWAT) [
21] is applied. The SWAT model is a physically‑based, continuous simulation model that uses the concept of a Hydrological Response Unit (HRU) for watershed assessment. Biomass cropping patterns are developed. Cropping patterns are often defined as different ways to growing crops that maximize net crop benefits. BMPs are applied to address the sediment and nutrients runoffs from the watershed. Lastly, economic and financial principles are used to estimate associated costs of adoption of the BMPs.
2.3. SWAT Model Calibration
Application of the SWAT model provides estimates of sediment and nutrient loadings from the watersheds with varying soils, land cover, weather conditions, as well as agricultural activity such as tillage and other production practices. The watershed that is divided into 17 sub-basins is further divided into several unique land use and soil combinations, called as the Hydrological Response Units (HRU). To estimate the implications on water and land resources from HES production, the SWAT analyses in this study utilize past and current flow data. Flow calibration was performed for annual and monthly simulated flows using observed flows from U.S. Geological Survey gauge stations at Hallettsville, TX (08164300) and Speaks, TX (08164350) for the periods of 1975–2008 including two years of model warm-up period. The model calibration for flow was conducted by adjusting appropriate input parameters that affect surface runoff. The adjustment of input parameters was continued until the simulated flows matched the observed flow at the gauge stations. For soil data, National Land Cover Dataset 2001 from Land Use and Soil Survey Geographic Database is used. In this study, sediment and nutrient loadings from the watershed using SWAT default parameter settings were used as the baseline. Changes in sediment and nutrient loadings after HES scenarios were implemented were compared with the baseline.
2.4. Cropping Scenarios
The cropping scenarios in the study include pre‑HES (i.e., existing pasture conditions), HES without BMPs, and HES with BMPs. The pre‑HES scenario reflects the baseline scenario, whereas the HES without and with BMPs reflect the biofuel crop scenarios where the existing pastureland is replaced with HES crop production.
The HES production is implemented in randomly-selected pasture fields in sub‑basins across the watershed and is based on a three-year rotation, consisting of 60,000 acres of HES crop production and 120,000 acres of fallow land. Research has shown that a three-year rotation that includes a two-year fallow followed by the crop has produced higher yield responses than any other rotation pattern [
22]. As a result, the three- year rotation pattern is adopted in the analysis to obtain maximum HES yields possible. Fertilizer nutrients are applied at the rate of 109 kg per acre of Nitrogen and 36 kg per acre of Phosphorous to realize a yield of 12 dry tons per acre [
23]. Although 12.0 dry tons per acre yield is considered possible for HES, only an average of 8.5 dry tons per acre is realized due to varied planting and harvesting dates to minimize costs of production ($/dry ton). In addition, HES production for this analysis is based on requiring two irrigations of 8.3 ac-in each for stand establishment [
16] compared to no irrigation for pasture, partly influencing the loadings. The biofuel crop scenario is implemented over a modeling period of 33 years, 1975–2008, including two model warming-up years.
Two BMPs, filter strip and cover crop are selected for evaluating mitigating sediment and nutrient runoff potential. It is shown through research that filter strips can intercept as much as 50 percent of sediment and nutrient runoff [
11,
24]. Similarly, cover crop when planted and grown after the harvest of a main crop is able to capture nitrates in soil and reduce nitrate-leaching and runoff [
25]. Based on the cited prior research studies, filter strips and cover crops are both selected for this study.
Filter Strips in this study are modeled as edge-of-field vegetation to trap the loadings from the sub‑basins. A filter strip is considered as a typical BMP to reduce sediments and nutrients in an agricultural field where the slope of field is less than five percent [
26]; the average slope of the entire watershed in this study is 0.8 percent. Based on peer reviewed literature [
11,
12], the unit of analysis for the filter strip is assumed to be 21 acres,
i.e., one acre of filter strip for 20 acres of cropland, represented a 20:1 ratio. Any additional land required to establish filter strips is assumed rented so that biomass output is obtained from all 60,000 acres. In addition, the life of the filter strips is assumed to be nine years,
i.e., once the filter strips are established in year one, proper maintenance would allow them to provide loadings mitigation for eight additional years prior to reestablishment being required.
A cover crop BMP involves establishment of native or introduced vegetation, usually sown after the harvest of the main crop to provide a protective cover for the soil. In this study, rye grass is planted as a cover crop during the first year of the two‑year fallow period on each of the 60,000 acres used to produce HES during the previous year. No fertilizers are applied for the cover crop. At the end of the first fallow year, the crop is left on the field as green manure. During the second year, rye grass is planted again as the cover crop on that same 60,000 acres. Following two years of fallow, HES is planted on the 60,000 acres to continue the three-year cycle. This rotation pattern is repeated throughout the modeling period of 33 years.
Additional BMP scenarios are considered in which both a cover crop and filter strips (referred as combination BMPs in the remainder of the paper) are simultaneously implemented in the watershed. These BMPs represent a two-tier level of mitigation, reducing loadings immediately within the field area by the cover crop and on the perimeter of the field by filter strips. Combinations of BMPs produced considerably higher water quality improvements in cases where implementation of only one-type of BMP did not achieve target water quality pollution mitigation [
27]. Therefore, the application of combinations of BMPs in the current analysis was considered as another option to evaluate pollution mitigation levels.
2.5. Economic and Financial Analyses of BMPs
Following estimation of sediment and nutrient loadings and potential mitigation achieved using the BMPs being considered, economic and financial information is identified, organized, and evaluated to facilitate recognition of the most cost-efficient solutions for mitigation of the water quality externality. The information required to identify all relevant costs of individual BMPs include mitigation level achieved by each BMP; number of acres affected by the BMP; expected life of the BMP; initial investment (i.e., construction and establishment costs); annual operating and maintenance costs; revenues associated with the BMP, e.g., grazing income; level of current adoption and maximum adoption allowed; and appropriate discount rate that accounts for inflation and time value.
To compare the cost-effectiveness of the BMPs, common units of expression are needed, such as Net Present Value (NPV) and Annuity Equivalent Value (AEV). NPV estimates represent the present value of funds needed to implement and maintain the BMPs for the entire life of the project; whereas, the AEV of the costs correspond to the calculated fixed annual payments during the project period necessary to pay for the establishment and operation of the BMPs. In other words, AEV represent the fixed annual payments in each of the 33 years of the project period that are necessary to finance the implementation and operation of the BMP practice/project. But, AEV is used to compare BMPs with unequal lives. Hence, AEV is estimated for the BMPs.
Once the requisite information is secured and validated, a modified version of BMPEconomics
© (Texas A&M AgriLife Research, College Station, TX, USA) a Microsoft Excel spreadsheet [
11], is applied to calculate the NPV of all costs and returns of both individual and combination BMPs. Subsequently, the NPV is transformed into an AEV accounting for the expected useful life of BMPs. In estimating the annual cost per unit of reduction, sediment, TN, and TP are evaluated independently,
i.e., assuming all costs are associated with reducing that particular pollutant and ignoring any costs toward reducing the others. An annual inflation rate of 1.9 percent and a time preference rate of 4.1 percent [
28] are used, resulting in an aggregate discount rate of 6.0 percent and facilitating calculations of NPV and AEV. The financial formulas that are incorporated into the BMPEconomics
© to estimate NPV and AEV are provided as Appendix.
3. Results and Discussion
For reporting of results, the first phase is presenting the effectiveness of BMPs in offsetting the negative externalities (contamination of water bodies). These results are followed with a discussion of economic implications on cost to producers (or society) of implementing BMPs in conjunction with production of a biomass feedstock for energy.
The results are reported as percentage reduction achieved due to adoption of BMPs. The results indicate that conversion of 180,000 acres from pasture to a three-year rotation of HES-fallow-fallow results in increased soil and nutrient loadings compared to the pre-HES loadings. All of the loadings reported in
Table 1 are estimated at the watershed outlet,
i.e., at sub-basin 17 outlet. The estimates, reported in English Tons (ET), under the desired mitigation levels (
Table 1) indicate increases in loadings from conversion to HES from pasture. The magnitude of increased loadings is influenced by nutrient application levels to cropland and any rainfall events that occurred in the watershed region. Refer to [
16] to identify the average and range of Wharton County monthly rainfall for years 1984–2009. Wharton County harbors the Tres-Palacios River watershed.
Table 1.
Summary of financial annuity equivalent value of costs per unit for Total Phosphorus, Total Nitrogen, and Sediments associated with each selected Best Management Practices, desired mitigation levels, and effectiveness of individual and combination Best Management Practices measured at the watershed outlet (sub-basin 17), Tres-Palacios River Watershed, Texas, 1975–2008.
| BMP Description | Desired Mitigation Levels a Mitigation (% of Desired) AchievedThrough BMP Adoption | Annuity Equivalent Value of all Costs ($/year) | Annuity Equivalent Cost per English Ton of Reduction ($/Ton/year) c |
|---|
| TP (ET b) | TN (ET) | Sediment (ET) |
|---|
| 216 | 410 | 8,762 | TP | TN | Sediment |
|---|
| FS (20:1) d | 69.3% | 70.8% | 73.5% | 563,862 | 3,763 | 1,942 | 83 |
| FS(15:1) | 71.5% | 73.7% | 77.1% | 751,816 | 4,863 | 2,487 | 111 |
| FS(10:1) | 74.1% | 77.1% | 81.9% | 1,127,723 | 7,040 | 3,563 | 157 |
| FS(5:1) | 77.3% | 81.7% | 87.4% | 2,255,447 | 13,493 | 6,732 | 295 |
| CC e | 48.3% | 55.7% | 66.7% | 13,185,077 | 126,188 | 57,728 | 2,255 |
| CC+FS(20:1) | 88.2% | 97.0% | 102.6% | 13,748,938 | 72,059 | 34,554 | 1,529 |
| CC+FS(15:1) | 89.3% | 98.4% | 104.1% | 13,939,893 | 72,196 | 34,530 | 1,528 |
| CC+FS(10:1) | 90.4% | 100.1% | 106.1% | 14,312,800 | 73,166 | 34,867 | 1,539 |
| CC+FS(5:1) | 91.7% | 102.0% | 108.3% | 15,440,524 | 77,853 | 36,895 | 1,627 |
The two BMPs, filter strips and cover crop, are implemented independently in varying degrees of intensity and as combination BMPs for application in the SWAT model analyses. Their effectiveness in mitigation is reported as percent mitigation achieved (
Table 1). Comparison of effectiveness produced by filter strips to a cover crop indicate that filter strips produced higher mitigation, which is primarily attributed to the strategic placement of filter strips between a field and a water body [
29]. Three alternative levels of filter strips of higher intensity (15:1; 10:1; 5:1) are also implemented to identify any increase in mitigation achieved. The results indicate that filter strips of higher intensity produced slight increases in sediment and nutrient mitigation. Combination BMPs produced increased effectiveness in controlling of sediment and nutrient loadings (
Table 1), which is due to the two-tier protection,
i.e., onsite and edge of field by cover crop and filter strips, respectively.
The economic analyses focused on comparing BMP costs relative to the level of mitigation achieved for the entire watershed, as measured at sub-basin 17. The results indicate that the AEV, measured as $/year, is substantially lower for filter strip BMPs compared to the AEV for a cover crop BMP as well as for the AEV of combination BMPs (
Table 1). The substantial difference in AEV when a cover crop is used as a BMP independently or in combination with a filter strip is primarily due to the cost associated with implementing a cover crop BMP on 120,000 acres each year compared to only 9000 acres for the FS (20:1). The land requirements for the implementation of the filter strip BMPs is calculated as 180,000 acres of HES divided by the total area occupied by the filter strips; 180,000/20 = 9000 acres. Hence, a more valid comparison is through AEV per ton mitigation of soil erosion, TN, and TP produced by each BMP, reported as $/Ton/year in
Table 1. The AEVs per ton per year estimates show that filter strip BMPs are the most cost‑efficient, followed by the combination BMPs, followed by the cover crop BMP. [
12] estimated the AEV of cost per ET (English Ton) of TP for the Cedar Creek Watershed at $4,752, which is relatively higher than the $3,763 estimated in the current study. This difference in the AEV of BMPs are attributed to the differences in mitigation levels achieved that are dependent on topography of the land, rainfall events during the project period, nature of the crop used for the BMPs, and history of fertilizer application.
Typically, social priorities determine the levels of mitigation, which perhaps can be expected to be less than 100 percent. The norm in much of the environmental quality mitigation literature is based on partial mitigation. The current analysis identifies the process of mitigation of an externality and the associated costs of mitigation and leaves the choice to the decision makers (i.e., policy designers and agricultural producers) to determine the desired level of mitigation depending on individual and social and financial limitations/challenges. As water quality deterioration has wide societal impacts, it is crucial to carefully select the level of water quality reduction that society might accept when considering management costs. But, moving forward, it seems reasonable to attempt to preclude any new externalities as opposed to allowing any level of detrimental externalities.
BMPs involve upfront annual and periodic costs. So as to appropriately analyze the impact of actions involving such costs,
i.e., adopting BMPs as part of a collective effort in addressing water quality, an assessment of the payments involved in the use of BMPs on the final economic product across BMPs is necessary. The price of the economic product, ethanol, usually reflects the cost of energy expended in the production of the biofuel crop. The estimates identified in this study, which are the costs of management practices to mitigate the water quality damages, are therefore interpreted as additions (
i.e., marginal) to the estimates identified by [
16]. As estimated by [
16], farm production costs of HES were $1,126.61 per acre, $159.20 per dry ton of biomass and $2.12 per gallon of ethanol, not accounting for the ethanol processing costs. The per acre revenues from HES, a biomass crop, will depend on the supply-demand system of the biomass‑biofuel market. Hence, it is difficult to estimate the per acre revenues. But, the revenues associated with a similar production system such as Bermuda grass grown in the region are in the range of $1,200–$1,500 per acre. Incorporating the cost of management practices to mitigate the water quality externality into the ethanol price, the increase in the ethanol price was in the range of $0.02 to $0.51 per gallon (
Table 2). The cost per acre for attaining corresponding mitigation of sediment, TN, and TP loadings using various BMPs are also presented in
Table 2.
Table 2.
Supply chain costs of producing High Energy Sorghum (HES) per unit and mitigation costs per unit associated with each Best Management Practice, Tres-Palacios River Watershed, Texas, 1975–2008.
Table 2.
Supply chain costs of producing High Energy Sorghum (HES) per unit and mitigation costs per unit associated with each Best Management Practice, Tres-Palacios River Watershed, Texas, 1975–2008.
| BMPDescription | Mitigation (% of Desired) AchievedThrough BMP Adoption | Annuity Equivalent Value of Mitigation Costs ($/year) | Annuity Equivalent Value (AEV) of Mitigation Cost a |
|---|
| TP | TN | Sediment | Costs per Acre (60,000 acres b) | Costs per Dry Ton of HES c | Costs per Gallon of Ethanol d |
|---|
| FS (20:1) e | 69.3% | 70.8% | 73.5% | $ 563,862 | $ 9.40 | $ 1.11 | $ 0.02 |
| FS (15:1) | 71.5% | 73.7% | 77.1% | 751,816 | 12.53 | 1.47 | 0.03 |
| FS (10:1) | 74.1% | 77.1% | 81.9% | 1,127,723 | 18.80 | 2.21 | 0.04 |
| FS (5:1) | 77.3% | 81.7% | 87.4% | 2,255,447 | 37.59 | 4.42 | 0.08 |
| CCf | 48.3% | 55.7% | 66.7% | 13,185,077 | 219.75 | 25.85 | 0.44 |
| CC+FS (20:1) | 88.2% | 97.0% | 102.6% | 13,748,938 | 229.15 | 26.96 | 0.46 |
| CC+FS (15:1) | 89.3% | 98.4% | 104.1% | 13,939,893 | 232.33 | 27.33 | 0.46 |
| CC+FS (10:1) | 90.4% | 100.1% | 106.1% | 14,312,800 | 238.55 | 28.06 | 0.48 |
| CC+FS (5:1) | 91.7% | 102.0% | 108.3% | 15,440,524 | 257.34 | 30.28 | 0.51 |
4. Conclusions
If commitment to biofuels production continues and processing plants are constructed in various locales, numerous agricultural producers may have sufficient incentives to apply greater amounts of fertilizers and cultivate marginal lands, with little regards to environmental consequences. The impacts on water quality with respect to sediment and nutrient loadings from converting a pasture land to a biomass energy crop, High Energy Sorghum (HES), in the Texas Middle-Gulf Coast are estimated using the SWAT model. The SWAT analysis also includes evaluation of select potential BMPs to mitigate the water quality damages in the watershed. The management options are then evaluated to identify the relative cost-effectiveness with the goal to mitigate sediment and nutrient loadings, i.e., to get the most “Bang for the Buck.” The results from the analysis are suggestive that nutrient loading increase from such intensively‑managed agricultural systems and result in offsite water quality deterioration. The BMPs evaluated indicate substantial investment, operation, and maintenance costs. However, the most effective policies in terms of mitigation could mean the use of more economically efficient BMPs, which necessitates further investigation of other potential BMPs. In addition, the novel ex ante nature of the externality source preludes there is adequate information on which to base the supposed impacts of alternative levels of offsite sediment and nutrient loadings. That is, this is a preliminary investigation of this issue, with obvious needs for additional, subsequent investigations to enhance the value of the results noted herein.
Biofuels crop production has environmental and economic effects, both positive and negative [
30]. The current analysis shows that mitigation of potential environmental effects as a consequence of biomass crop production are expensive. The United States government spent approximately $145 million in year 2006 in dredging expenditures for their federal and non-federal channels [
31]. The mitigation costs reported in this paper, which are the costs to adopt BMPs to reduce any sediment and nutrient runoff from biofuel crop production systems to water bodies, would mean costs in addition to the current water clearing costs. Evaluation of overall aggregate economic effects is outside the scope of this paper. But, for biofuels to be a sustainable alternative to fossil fuels, their cultivation related any negative environmental impacts must be avoided. Policies that either encourage and/or mandate BMPs adoption could reduce some of the potential negative environmental impacts, but could involve substantial costs and can quickly erode the profits of the producers or warrant funding from external sources. Research analyzing financial incentives such as fertilizer tax and subsidy to no-tillage production systems have indicated little or no effect to change in crop production practices for biofuel crops, consequently having no impact on mitigating environmental impacts [
32].
Currently, the price of ethanol and the associated subsidies continue to provide incentives to expand biofuel production without consideration of externalities and unintended consequences. While some federal tax credits for ethanol such as Volumetric Ethanol Excise Tax Credit, Cellulosic Biofuel Producer Tax Credit, and Biodiesel Excise Tax Credit, to name a few, expired at the end of 2013, other incentives such as biofuel infrastructure tax credit and biomass feedstock production credits are extended through 2018. Furthermore, several state tax exemptions that apply to ethanol-blended fuels are extended through 2018 [
33].
The evaluation of the BMPs to identify a cost-efficient watershed protection strategy highlights important issues that warrant further analysis. For example, some existing level of BMPs adoption suited to the current operations is expected in any production enterprise. However, due to lack of sufficient information to corroborate any such adoption levels in the Tres-Palacios River watershed, a zero-level existing adoption of the BMPs is assumed. Such an assumption combined with the modeling approach of this research suggest annuity equivalent value of mitigation costs reported through this research could be higher than if fewer acres of BMPs could be deployed to achieve the desired mitigation levels. Similarly, financial incentives such as subsidies and tax breaks (e.g., farm equipment purchase tax break and farm input subsidies) often contribute to a key role in decision‑making process of BMPs adoption, no such incentives are considered in conducting the current economic analysis. Such incentive payments could impact the estimates of the costs of water quality mitigation reported in this paper.


