
Modular PEM Fuel Cell SCADA & Simulator System


Department of Electronic, Computer Science and Automatic Engineering, University of Huelva, Crta. Huelva-Palos de la Frontera s/n, 21819 Palos de la Frontera, Spain
*
Author to whom correspondence should be addressed.
†
The author contributed equally to this work.
Resources 2015, 4(3), 692-712; https://doi.org/10.3390/resources4030692
Submission received: 21 May 2015
/
Revised: 21 July 2015
/
Accepted: 31 July 2015
/
Published: 1 September 2015
(This article belongs to the Special Issue Alternative Energy Sources in Developing and Developed Regions)
Abstract
:The paper presents a Supervision, Control, Data Acquisition and Simulation (SCADA & Simulator) system that allows for real-time training in the actual operation of a modular PEM fuel cell system. This SCADA & Simulator system consists of a free software tool that operates in real time and simulates real situations like failures and breakdowns in the system. This developed SCADA & Simulator system allows us to properly operate a fuel cell and helps us to understand how fuel cells operate and what devices are needed to configure and run the fuel cells, from the individual stack up to the whole fuel cell system. The SCADA & Simulator system governs a modular system integrated by three PEM fuel cells achieving power rates higher than tens of kilowatts.
1. Introduction
The idea of developing a modular fuel cell system based on multiple stacks emerges when the load profile to be fed is not uniform; the option to feed it with a single stack with rate power equal to the maximum demand is not feasible from the point of view of efficiency [1]. Fuel cells supply unregulated power, so they need a power conditioning system. The efficiency of fuel cell systems will be higher at the nominal power for which they were designed, i.e., the net power of the fuel cell. When the stack works below its net power, system performance (stack + power conditioning) decreases relatively to its rated power [2]. Therefore, if the load profile is not uniform, it might be interesting to have a modular fuel cell system comprised of multiple stacks, so that the start-up of each module (one module = one stack) is made taking into account the load demand. Furthermore, by incorporating multiple stacks, damage or loss of one of them (this is the most critical element in a fuel cell system) does not disable the whole modular system, but only entails a reduction in power. The modular fuel cell system allows more degrees of freedom in the design of hybrid systems based on multiple renewable sources when in addition to the fuel cell there are other power sources and backup systems, such as batteries and/or hydrogen storage + electrolyzer [3]. The advantages of this modular fuel cell system are flexibility, scalability, robustness, reliability, and performance [4]. In addition, the modular system architecture simplifies the manufacture, repair, and maintenance.
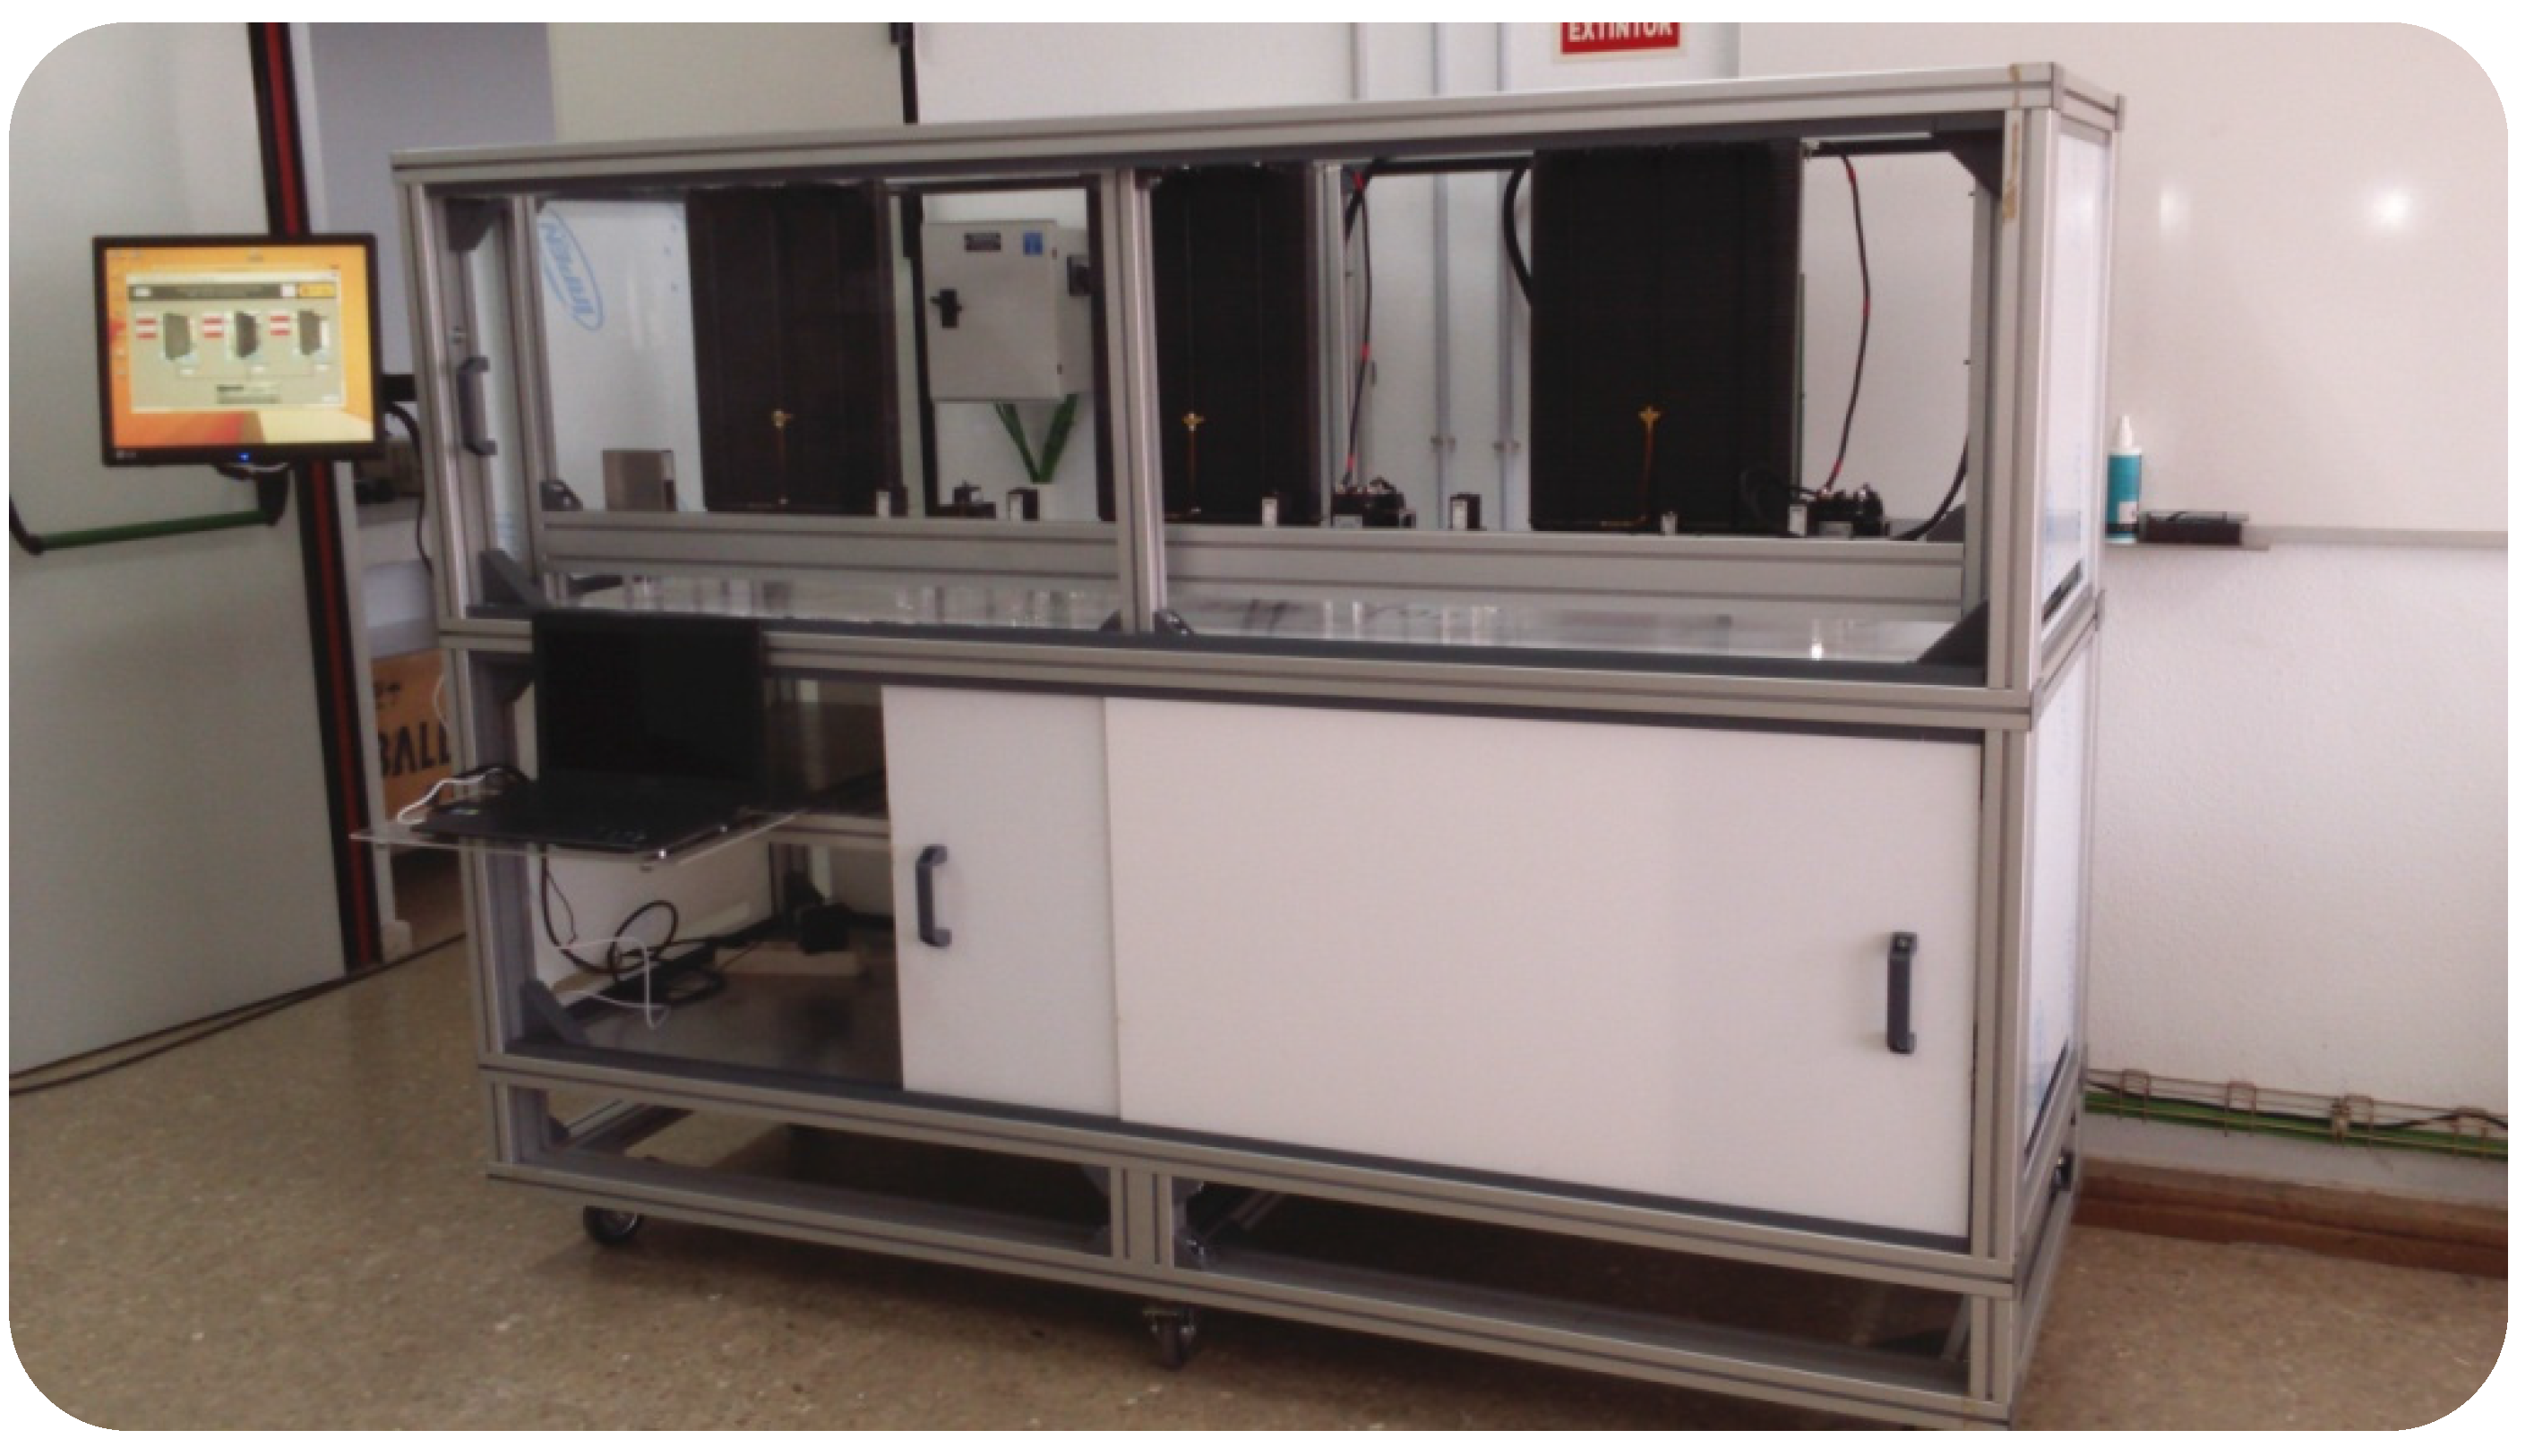
Thus, the aim of the Research Project cited in the Acknowledgements section is to build a modular PEM fuel cell system that consists of three stacks (Figure 1). The whole modular system will need a power management system, and this one must make decisions based on the polarization and power curves of stacks [5]. However, curiously, although the stacks are identical and have been subjected to the same number of start–stop cycles while operating, identical stacks show different results. Probably this is a result that shows that the technology and manufacturing processes for fuel cells are not yet mature enough. The aim of this paper is to show a monitoring and simulation tool developed for checking the performance of the three PEM stacks integrated into the modular system. In this sense, regarding available research works and commercial fuel cell systems, their capability of interacting with the user to assist in learning is varied depending on the manufacturer. Thus, most of them came accompanied by an installation software kit that allows users to interact with the system. In [6] a hybrid drive train simulation tool called LFM was applied to optimize a forklift system by considering system size, efficiency, and hydrogen consumption. References [5,7,8,9] are some examples of recent works from the research side related to simulation tools based on fuel cells. Then, in [6] different power management solutions are applied over hybrid systems where there are several sources to accomplish the load requirements. The work presented in [7] shows the way to control the power supplied by every source in this kind of hybrid systems, particularly the fuel cell. In [8] the fuel cell is controlled by the power conditioner connected to its output and in [9] an electrical model of the fuel cell is proposed. Most of these models can be implemented in simulation software tools used in engineering. Other works like [10,11] present simulation tools for fuel cells to perform studies of time and space variations from the point of view of electrochemical reaction inside the stacks. These cited works can be really useful for a detailed study on fuel cells, but they have two main deficiencies: (1) they don’t include a SCADA system integrated with the simulation tool and (2) they are sometimes lacking as training tools because they do not have a user-friendly interface.
Regarding the market sector, systems like Altergy Freedom Power [12], Fuel Cell S-series [13], Jupiter modules [14], or MGEN series [15] are a sample of commercial fuel cell systems that integrate a supervisory control system for the BoP as well as local/remote monitoring. However, these systems are not suitable for training. Some of them reach power levels hazardous for use in lab classes, and others show the fuel cell as a black box capable of being self-controlled, but that does not allow for looking inside.
Figure 1.
The modular PEM fuel cell system developed.

Therefore, the SCADA & Simulation tool presented in this paper aims to cover the shortcomings authors have found in scientific literature and market sector revision. The developed computer simulation tool can be used for research, teaching/learning, and industry activities. That is, a researcher can use it to analyze experiments with a fuel cell test bench, a teacher or student has at his disposal a tool to teach or learn the fundamentals of fuel cell operation, while a technician will find a tool that introduces him to a real industrial plant with an established operating procedure and with the ability of generating failures, faults, and alarms that the operator must control. For designing this tool, authors start from a real test benchmarked on an air-cooled PEM fuel cell and around it they have built the Balance of Plant (BoP), meticulously following the stack manufacturer’s recommendations, according to Section 2. Once the single fuel cell system (stack + BoP) is built, we developed the control and monitoring system (see Section 3) to guarantee the correct stack’s performance. This section includes a description of the software tool developed for this purpose and a comparison between simulation results and experimental results obtained in the laboratory. Finally, Section 4 shows the main conclusions of the work.
2. BoP: Design and Implementation for Single Stacks
The first step, before the BoP design, is to know the characteristics of the stack in which the BoP will be implemented. In this case, it is the PEM FCgen-1020ACS stack from Ballard [16]. The stack has no liquid parts and produces clean DC power with low thermal and acoustic signature. The stack has 80 cells and is designed to operate over a wide range of power and environmental conditions, and it provides up to 3.4 kW stable non-regulated electrical power with 45.33 V and 75 A. It is air cooled, so no external humidification of the air is required. Moreover, the stack is designed in a dead-ended configuration using dry hydrogen, so no external hydrogen humidification is needed and the inlet hydrogen pressure can vary from 1.16 to 1.56 bars.
Next, once the basic technical characteristics of the stack have been described, we will describe the subsystems needed to configure a PEM fuel cell system as from the stack. These subsystems are Oxidant/Cooling Subsystem, Fuel Subsystem, Electrical Subsystem, and Control Subsystem.
2.1. Oxidant/Cooling Subsystem
The model developed below aims to reflect the real performance of the FCgen-1020ACS commercial stack. This model has been estimated by manufacturer lab tests. Equation (1), which describes the static state electrical performance of each cell of the commercial stack FCgen-1020ACS, results from the contribution of three voltage drops to equilibrium potential [17,18]. In addition, there are scientific works focused on obtaining an extended model for different stack types; in practice, the parameters included in each model must be adjusted to fit the semiempirical model to the real behavior of the stack [2]. In this case, parameters involved in Equation (1) have been adjusted by the manufacturer. The first term is the equilibrium potential, whose value is obtained by the Nernst equation. The logarithmic term yields the electrode kinetic parameters for oxygen reduction in the PEMFC. The linear term represents the resistance, predominantly ohmic, and the exponential term symbolizes the mass-transport effect; i.e., the increase in slope of the pseudolinear region and the subsequent rapid fall-off of the cell potential with increasing current density.
where Vcell is the cell voltage (V) and Is is the stack current (A).
In this stack, according to its manufacturer the relation between stack current Is(A) and optimum stack temperature Topt(°C) follows Equation (2):
This equation shows the steady state optimal operating temperature at which the optimum combination of stack performance and cell stability is achieved. At this temperature, the stack is operating near its optimum humidity point. The optimum temperature varies depending on stack current, so at rated power (75 A), the optimal operation temperature is about 68 °C, according to the manufacturer’s data. From the point of view of stack temperature’s dependence on current density (A/cm2), considering a cell area fixed (in the case of a real stack), we can say that optimal operating temperature increases with current density.
According to the stack manufacturer’s experimental tests, the difference between the optimal stack operating temperature Topt and the actual stack operating temperature Ts causes some losses in nominal cell voltage, as Equation (3) reflects:
In the FCgen-1020ACS stack, the oxidant and coolant flows are combined into a single stream.
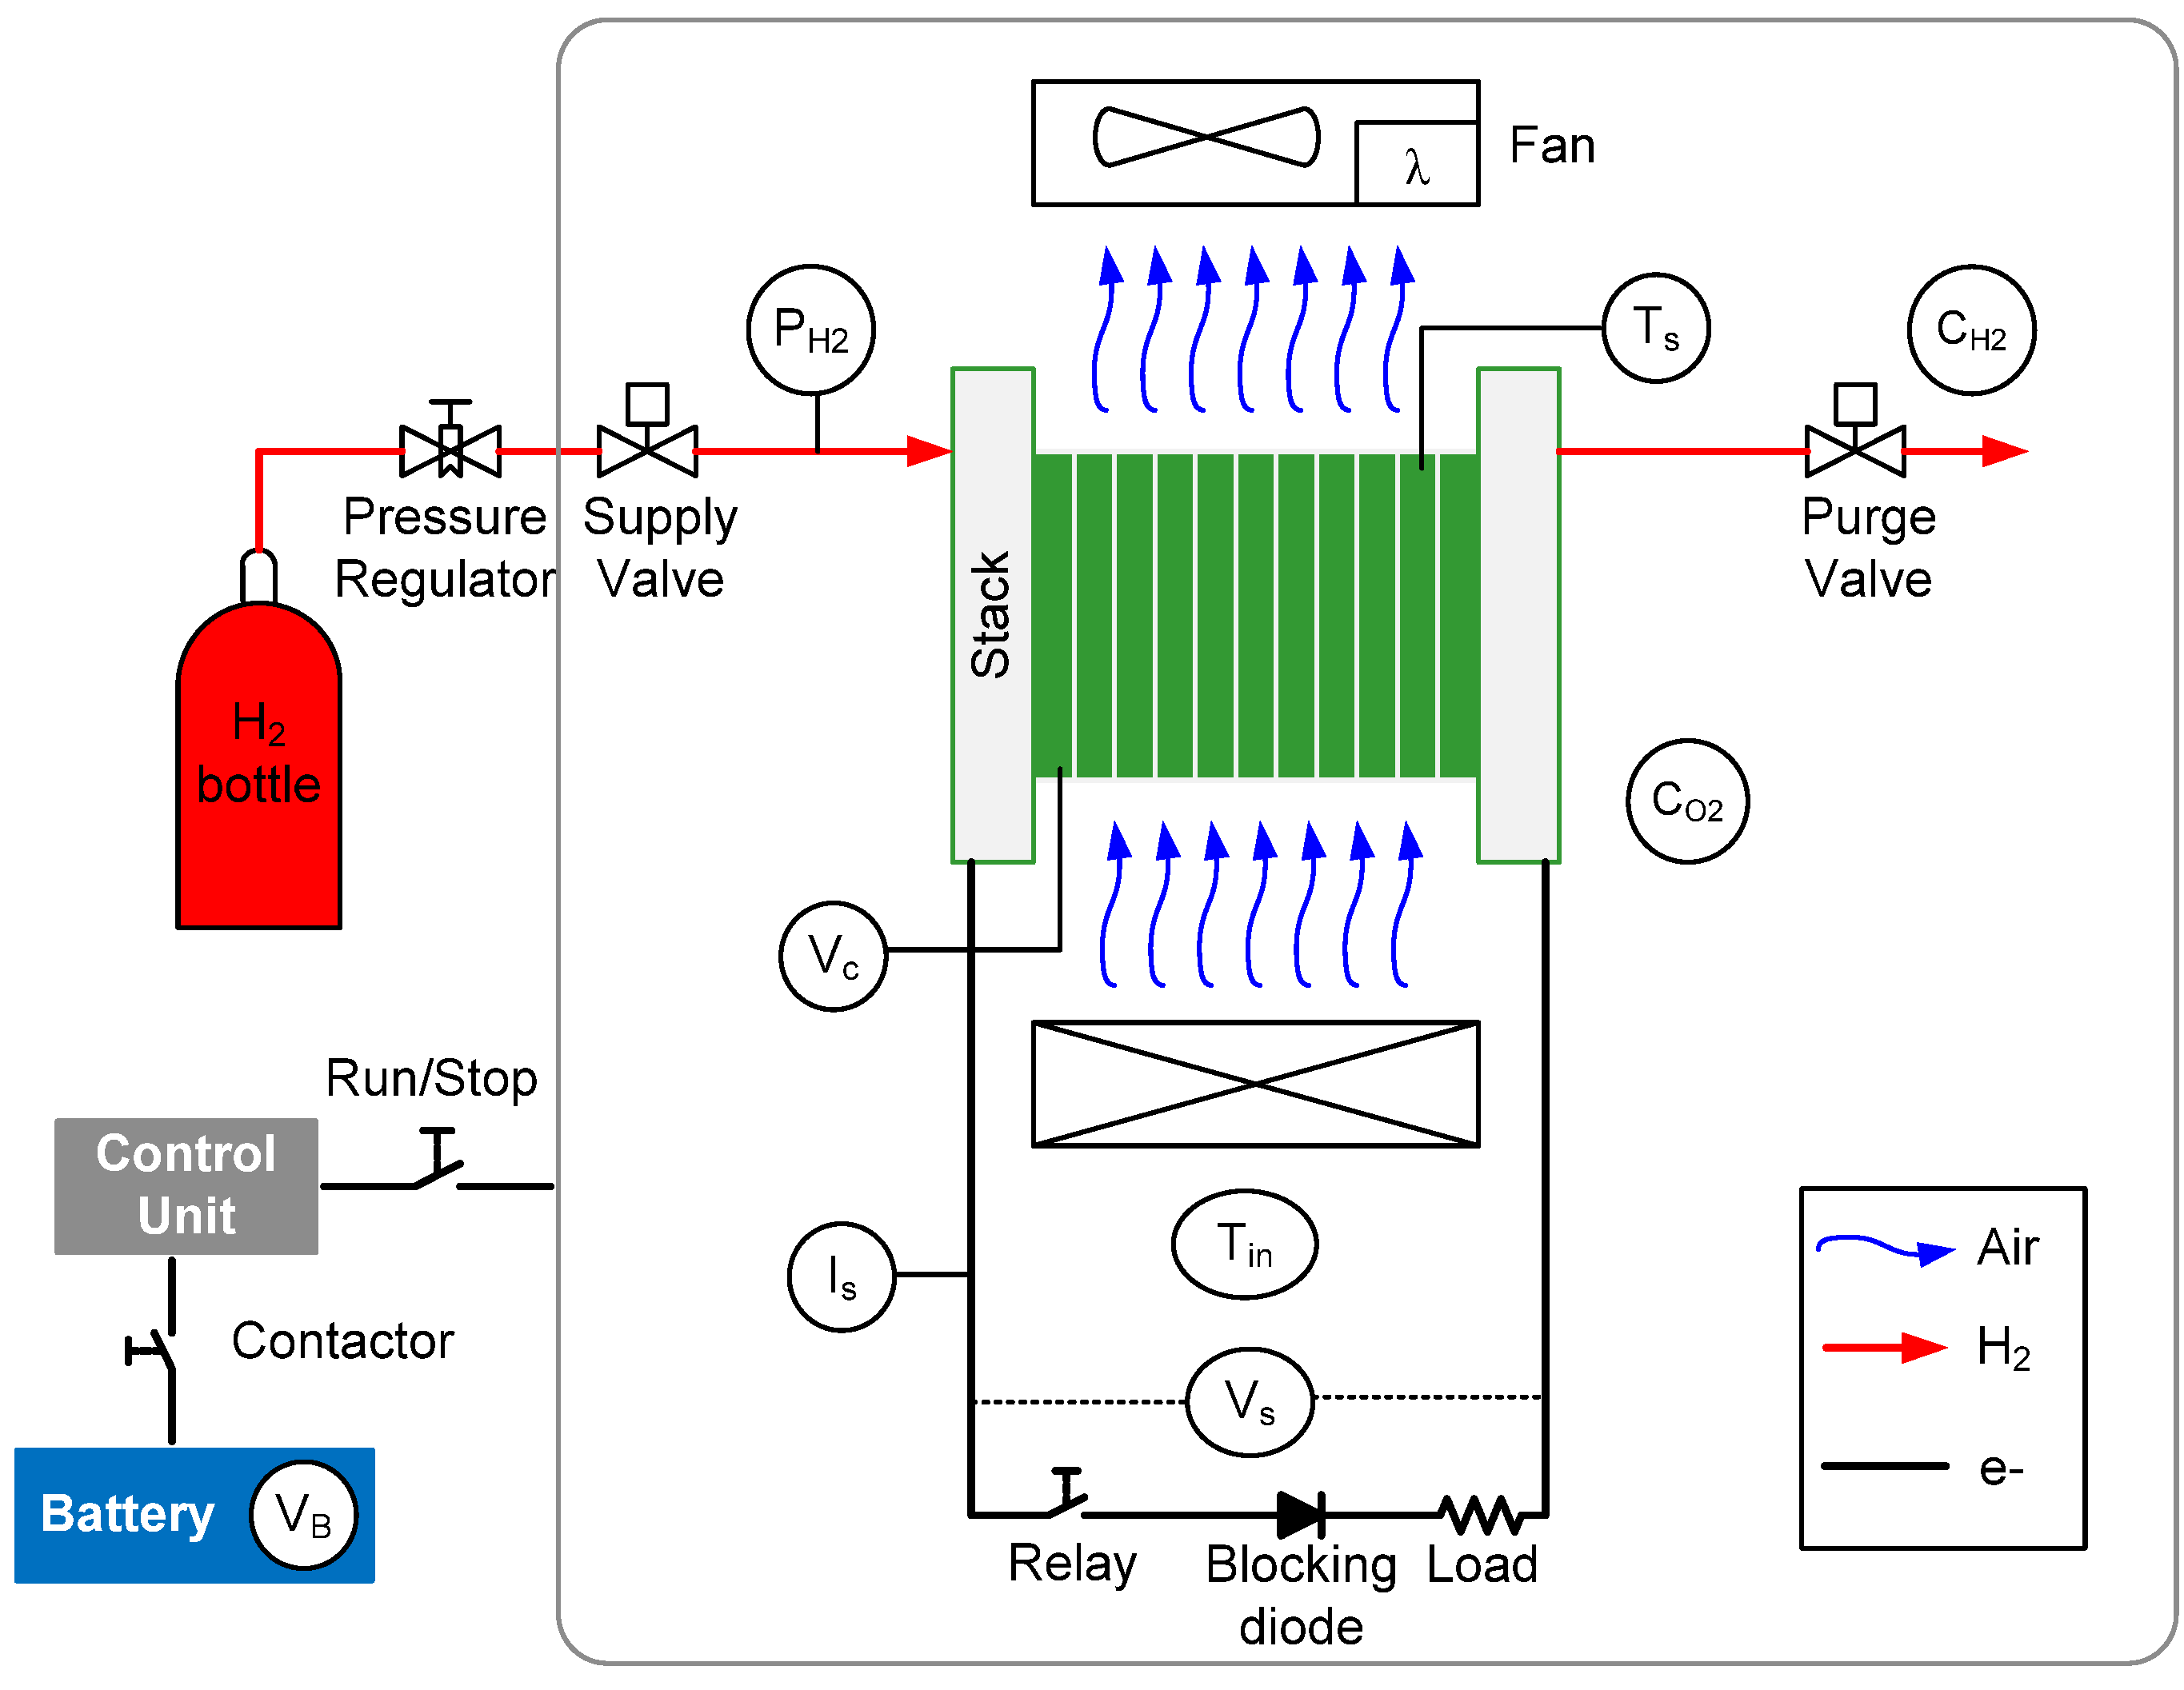
Based on manufacturer’s instructions [16], the oxidant subsystem for the air-cooled 80-cell stack (blue line in Figure 2) delivers the oxidant agent to the stack cathode for the stack reaction and the cooling subsystem maintains the stack at the proper temperature. In this case the cooling and oxidant flows are integrated into a single stream. Stacks under study in this paper provide maximum performance with an oxidant stoichiometry λ (this is the relation between the inlet air flow, Qstack, and the consumed air flow, see Equation (4)) between 50 and 200. There are some performance losses for stoichiometries lower than 50. The losses become more significant if the oxidant stoichiometry is below 20. The stack must have a minimum oxidant stoichiometry of 10 to function. The oxidant stoichiometry can be obtained using Equation (4):
where C is the air consumption, 0.0167 slpm/(A cell).
Figure 2.
Scheme of the fuel cell system built (Stack + BoP).

Then, to configure the Oxidant/Cooling subsystem, the following information should be known: stack operating temperature Ts, inlet air temperature Tin, and the stoichiometric coefficient λ, which is calculated by taking into account the air consumption. Additionally, a concentration oxygen sensor CO2 is included to prevent low concentrations of oxygen in the atmosphere. The blue line in Figure 2 details the oxidant/coolant subsystem configuration.
2.2. Fuel Subsystem
The Fuel subsystem (red line in Figure 2) delivers hydrogen fuel to the stack at the appropriate flow and pressure. Stacks under study are designed for dead-ended operation, that is, all the fuel that enters the anode is used up (fuel stoichiometry: 1). But in practice, water vapor, nitrogen, and other inert gases can be collected in the anode, so this side must be purged periodically.
Two hydrogen lines can be seen: one for hydrogen inlet and another one for hydrogen outlet. The components list for the inlet line includes: the hydrogen bottle to store the fuel, a pressure regulator to condition the high hydrogen bottle pressure downstream to low fuel inlet pressure in the stack, a supply valve to control the hydrogen flow, and a pressure sensor PH2 to measure the stack anode pressure. In the outlet line, a purge valve will be needed to exhaust the hydrogen to environment.
2.3. Electrical Subsystem
In this case, stack current Is and voltage Vs sensors will be connected on electrical terminals, and a cell voltage monitoring system Vc on cells (see the black line in Figure 2). Running the stack above nominal current for long periods contributes to stack degradation. Moreover, the stack voltage sensor and the cell voltage monitoring system ensure that increases in stack current do not drive the cells into reversal. Cell reversal produces heat and can result in a cell-to-cell short and an electrical spark. Additionally, a relay is added to isolate the fuel cell system from the electronic load and a blocking diode to avoid reversal currents.
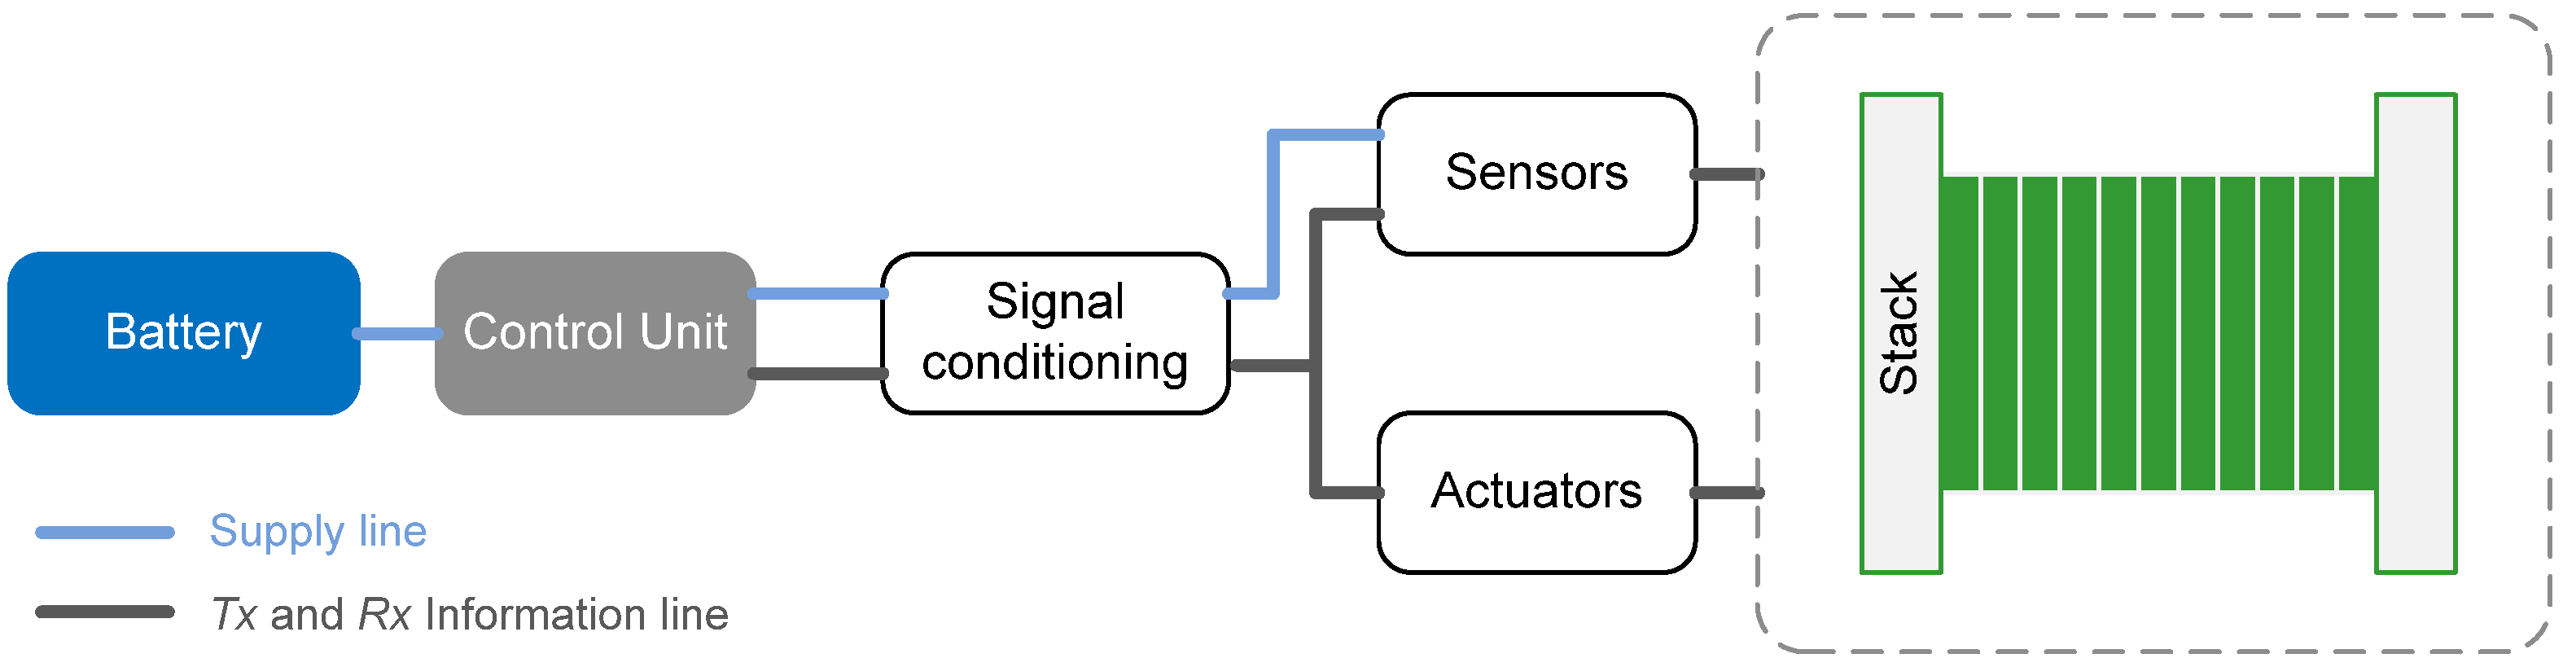
2.4. Control Unit
To get all subsystems working simultaneously and appropriately, a ControlUnit is needed. The significance of the control unit will be justified in the next paragraph and basically it will be responsible for receiving information from all sensors and tell the actuator the correct order (Figure 3). Additionally, an external power source (in this case a battery) will supply all the devices that are included in the BoP. This external electrical source is inherent to the fuel cell system for two reasons: (1) BoP devices should be activated even before the fuel cell system starts running, and (2) the time required for the fuel cell system to reach steady-state performance and deliver rated power is a function of the difference between the stack temperature and the optimal operating temperature, the hydration state of the membrane, and the condition of the catalyst. Therefore it is not instantaneous.
Figure 3.
Connection scheme from battery to fuel cell system.

The main causes of short life and performance degradation have to do with heat and water (in the case of PEM fuel cell systems without air cooling): fuel and oxidant starvation, corrosion, and chemical reactions of cell components [19]. Thermal management is particularly important at cold start-ups, while poor water management can cause dehydration or flooding [20]. Finally, corrosion products and impurities from outside can poison the cells [21]. In this case, the PEM fuel cell system operating procedure has been designed to guarantee performance, durability, and safety. This procedure is established by the Control Unit, and is made up of seven steps, given in Table 1 below (based on [16]): Standby, Start-up (three steps), Warm-up, Run, and Shutdown.
This sequence maintains the fuel cell system illustrated in Figure 2 and Figure 3 through the following relation: in the Standby state, the battery is connected (the contactor is closed), the actuators are in their safe state, and the stack is not consuming reactants. After pressing the Run/Stop switch, the fuel cell system will change to Start-up state. Here the stack will be put into a state where current can be safely drawn from it. The fan is started before the start-up purge to give the fan time to spool up as well as to provide airflow to dilute the start-up purge. Next, the Warm-up state takes the stack from Start-up and puts it into a state where rated power can be safely delivered by the stack. The stack, as has been referenced in [22], is brought up to operating temperature where the membrane is hydrated, and the catalyst performance is increased to enable the stack to deliver rated power. The time during which the stack must keep in this state depends on initial stack temperature and load current demand.

| State | Actuator | Command |
|---|---|---|
| Standby | Fan | 0 |
| Supply valve | Closed | |
| Purge valve | Closed | |
| Load relay | Open | |
| Stack current | 0 | |
| Start-up (Step 1) | Fan | Fan Max |
| Supply valve | Closed | |
| Purge valve | Closed | |
| Load relay | Open | |
| Stack current | 0 | |
| After 3 s | ||
| Start-up (Step 2) | Fan | Fan Max |
| Supply valve | Open | |
| Purge valve | Open | |
| Load relay | Closed | |
| Stack current | Load current = 0 | |
| After 0.2 s | ||
| Start-up (Step 3) | Fan | Fan Min |
| Supply valve | Open | |
| Purge valve | Closed | |
| Load relay | Closed | |
| Stack current | Stack load = 0 | |
| Warm-up | Fan | Fan Min |
| Supply valve | Open | |
| Purge valve | Interval 2300 Amp-Seconds | |
| Load relay | Closed | |
| Stack current | Load current (ramp-up rate = 1 A/s) | |
| Run | Fan | Controlled by temperature |
| Supply valve | Open | |
| Purge valve | Interval 2300 Amp-Seconds | |
| Load relay | Closed | |
| Stack current | Load current | |
| Shutdown | Fan | 0 |
| Supply valve | Closed | |
| Purge valve | Closed | |
| Load relay | Open | |
| Stack current | 0 |
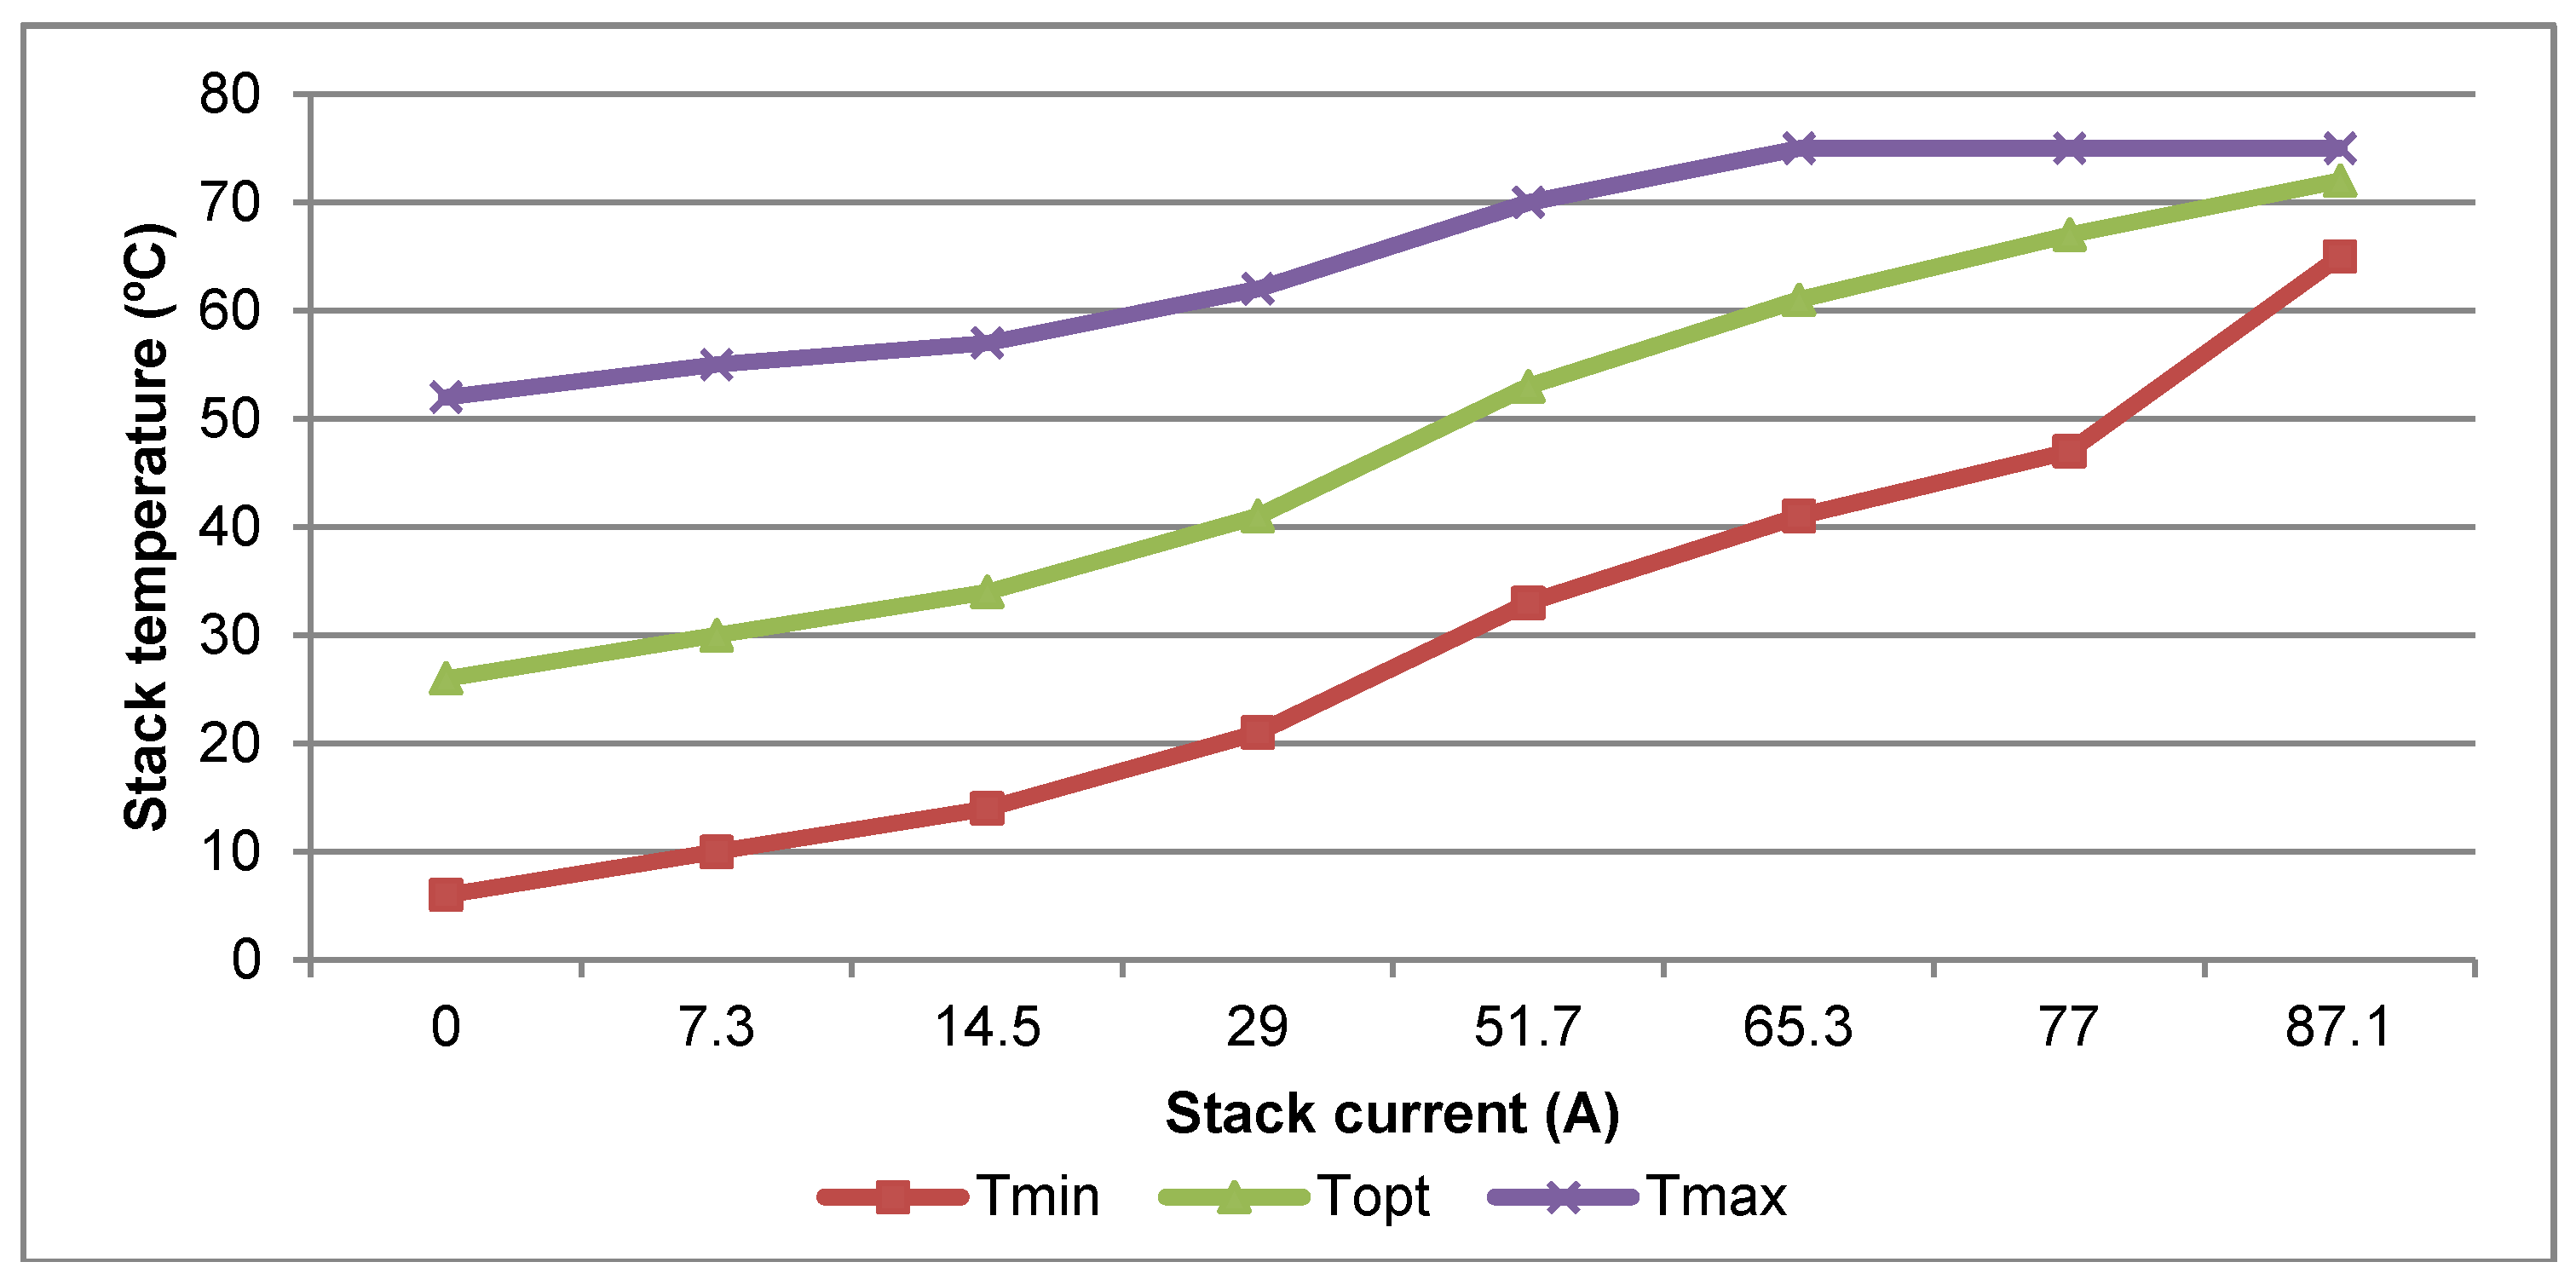
In the Run state the stack is delivering rated power to the load. The fan should be controlled to provide the proper amount of coolant flow to maintain the stack temperature Ts at the stack optimum temperature Topt [23]. Stack temperature can vary from Tmin to Tmax, but outside of this range Contro lUnit must switch off the fuel cell system. Finally Shutdown takes the stack from Run and puts it into Standby.
Once the states’ sequence and therefore what to do with each actuator every time is known, the Control Unit must also know that the variable values measured by the sensors are inside the admissible range to avoid severe stack damage and irreversible performance degradation. If the stack enters an alarm condition, it is necessary to execute a shutdown compulsorily. To avoid excessive shutdowns due to failures that contribute to fuel cell degradation, the Control Unit has a max-min time variable range for each sensor, according to Table 2 [23].
| Alarm | Type | Value | Delay |
|---|---|---|---|
| Stack Temperature | Max | 75 °C | 5 s |
| Max | Tmax (Figure 4) | 60 s | |
| Min | −10 °C | 5 s | |
| Min | Tmin (Figure 4) | 60 s | |
| Anode Pressure | Max | 1.69 bar | 1 s |
| Max | 1.56 bar | 5 s | |
| Min | 1.16 bar | 5 s | |
| Min | 1.07 bar | 1 s | |
| Stack Current | Max | 78 A | 2 s |
| Min | −3 A | 2 s | |
| Stack Voltage | Max | 1.05 V/cell | 1 s |
| Min | Vstack-theorical (1) −10 V | 1 s | |
| Cell Voltage | Min | 0.1 V | 1 s |
| Min | 0 V | 0 s |
Note: (1): ,
Figure 4.
Stack temperature range specification.

Additionally, a detailed description of the signal conditioning needed to communicate sensor and actuator to the Control Unit can be found in [23]. The fuel cell system developed has two particular features: (1) it is open because unlike other fuel cell systems like, for example, that in [22], which are also built from the same stack, in this one the user can access every part; (2) it is all in one because the system is a whole test bench where different load profiles can be applied as well as state monitoring and saving data. Before describing the Monitoring Subsystem, it is worthwhile to summarize the variables and the range of parameters used in Equations (1)–(4) in Table 3.
| Variable | Definition | Range |
|---|---|---|
| Vcell (V) | Cell Voltage | 0.647–1.005 |
| IS (V) | Stack Current | 0–75 |
| Topt (°C) | Optimal Operating Temperature | 26.01–65.76 |
| TS (°C) | Stack Temperature | 6–75 |
| Tin (°C) | Inlet Air Temperature | (−20)–52 |
| Qstack (slpm) | Stack Required Air flow | 0–18656.63 |
| λ | Inlet Air Flow/Consumed Air Flow | 20–200 |
| C (slpm/A cell) | Air Cell Consumption | 0.0167 |
| ncell | Number of cells | 80 |
| PH2 (kPa) | Inlet Hydrogen Pressure | 116–156 |
3. Modular PEM Fuel Cell System SCADA & Simulator
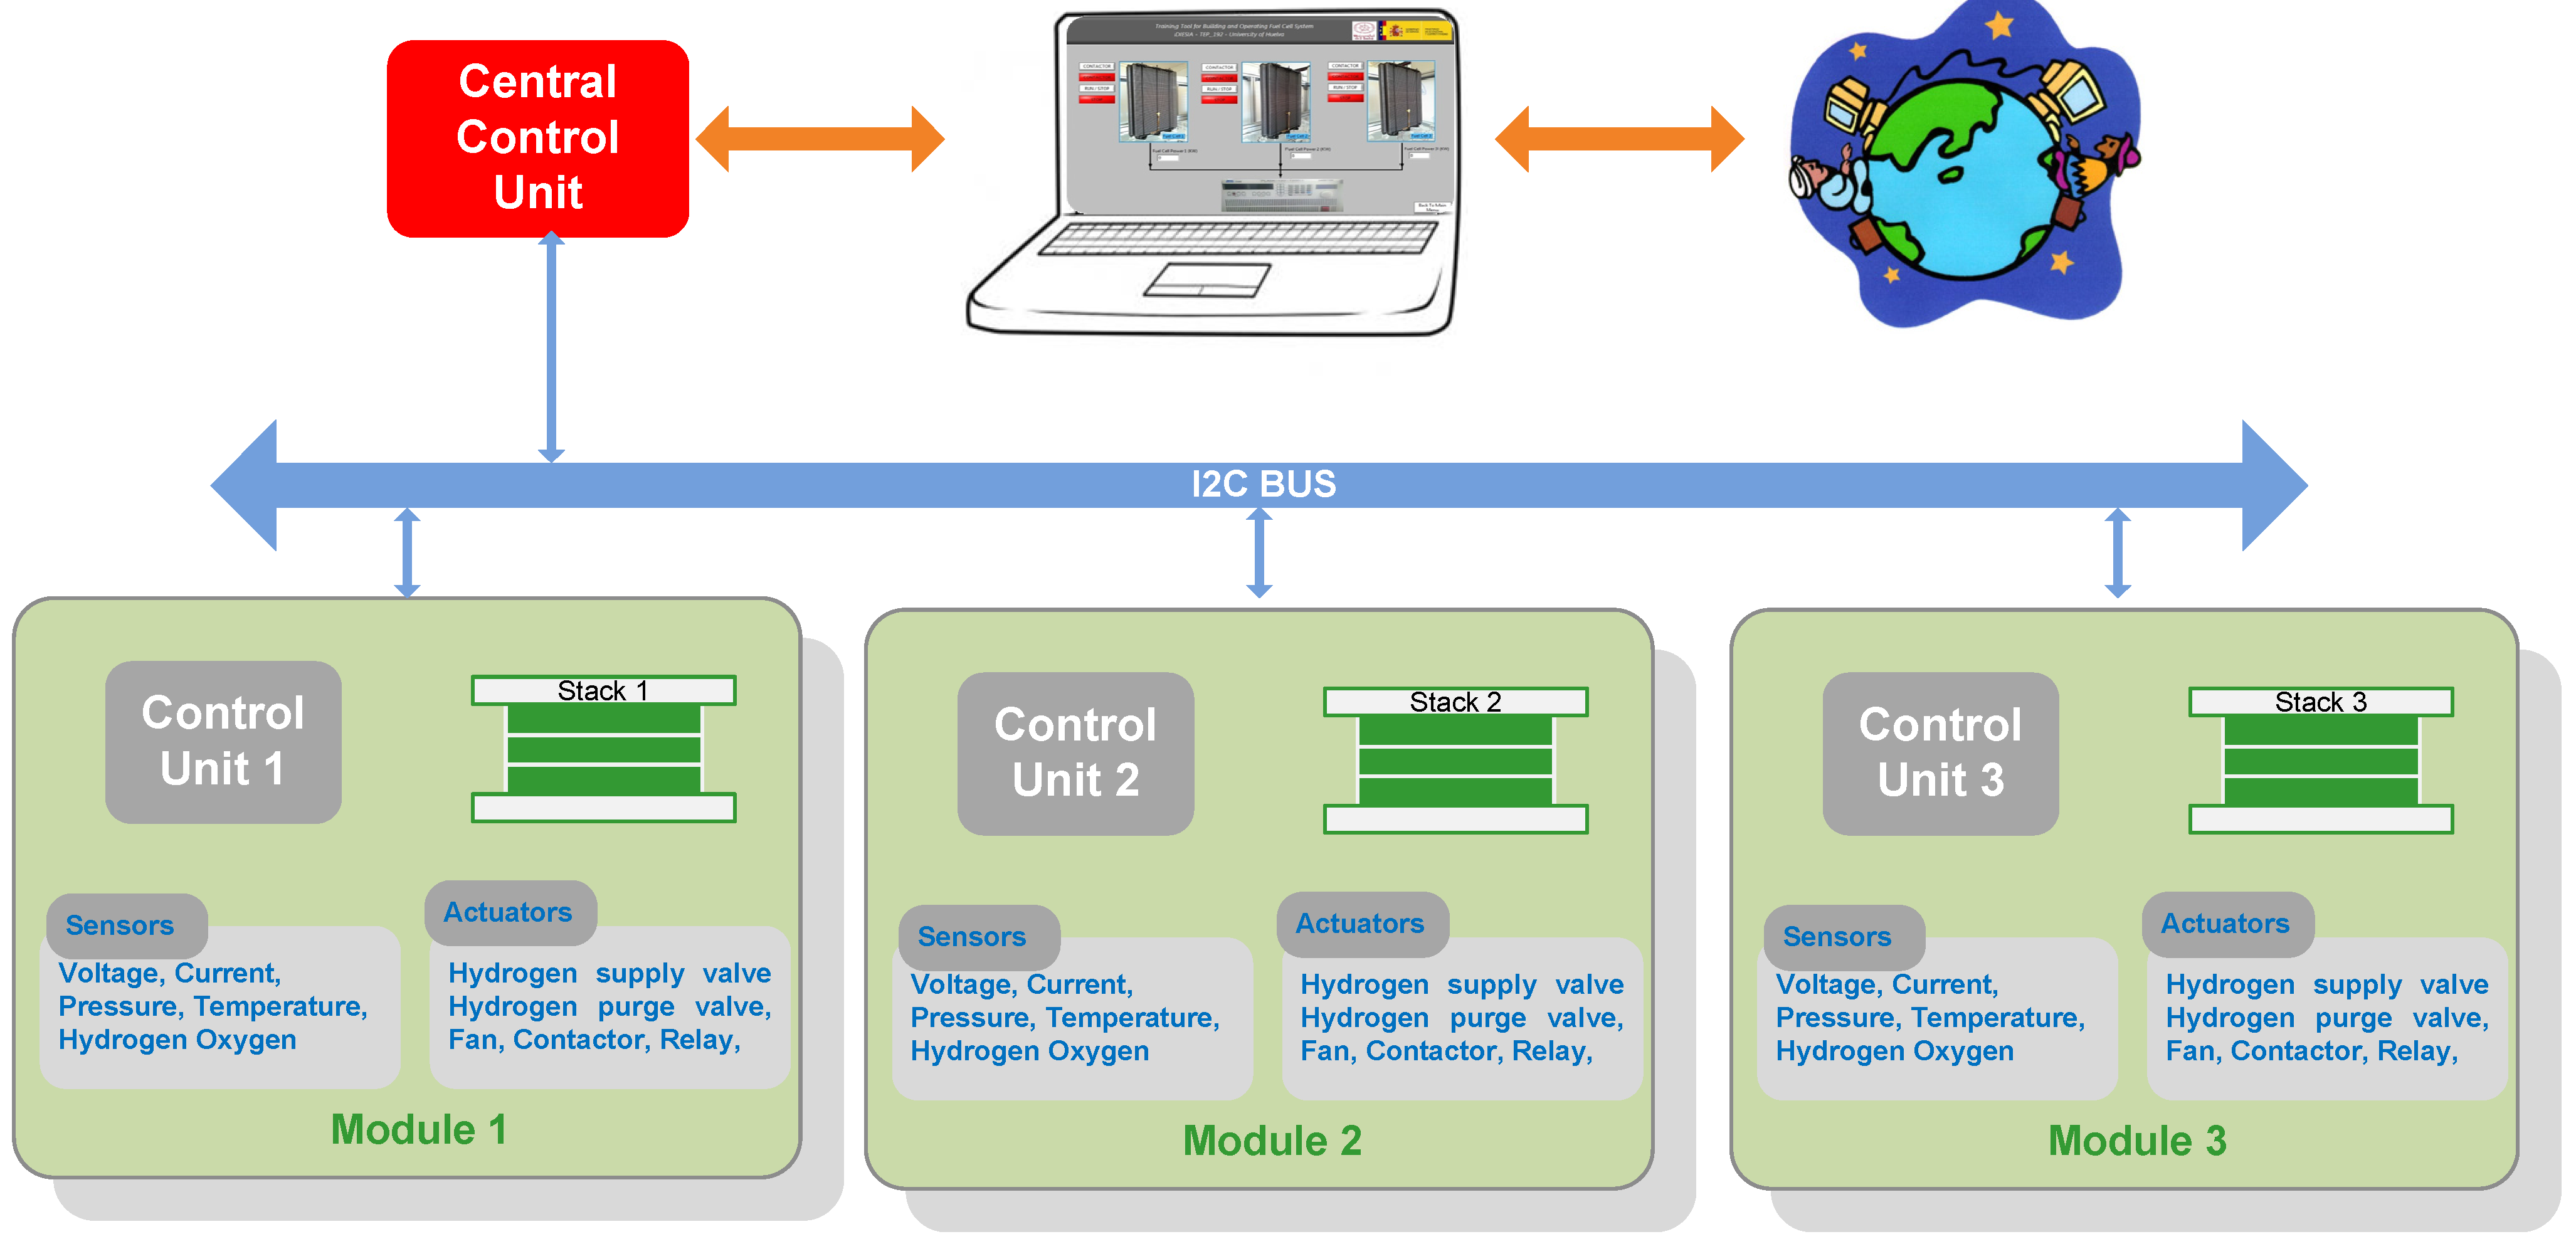
Once the implementation of the Balance of Plant for each single stack has been described, the next step is to connect them for online monitoring. For this purpose (see Figure 5), a Central Control Unit has been developed which communicates with each Local Control Unit by means of an I2C bus. At the same time, this Central Control Unit sends data and receives orders from the SCADA & Simulator system. Finally, via the Internet we will be able to supervise our system anywhere in the world.
Figure 5.
Connection scheme from single modules to online monitoring.

Due to the specialized nature of fuel cell systems and electrified power-train systems, measurement, monitoring, and calibration devices are indispensable. However, it is not easy to find detailed instruments (virtual instruments) focused on showing the real-time performance of a PEM fuel cell system and compare it with the performance recommended by the stack manufacturer. For this reason, in [24] a real-time test bench for the PEM fuel cell engine is introduced. Based on the virtual instrument technology, all the measurement and control tasks are downloaded into the PXI-based system controller (PXI-8110), which is scheduled by LabVIEW RTOS. In [25] the automation of the unit is based on a SCADA system that acquires and monitors the input/output (I/O) signals. In the SCADA system data are organized in a process database (PDB). On the other hand, in [26] the deterioration of three fuel cell city buses serving the Beijing Olympic core area is studied. The monitoring platform is composed of three major components: an upper-level computer, the fuel cell system controller, and non-volatile memory media. The upper-level computer provides a visual parameter access and modification interface based on FreeMaster with serial communication interface.
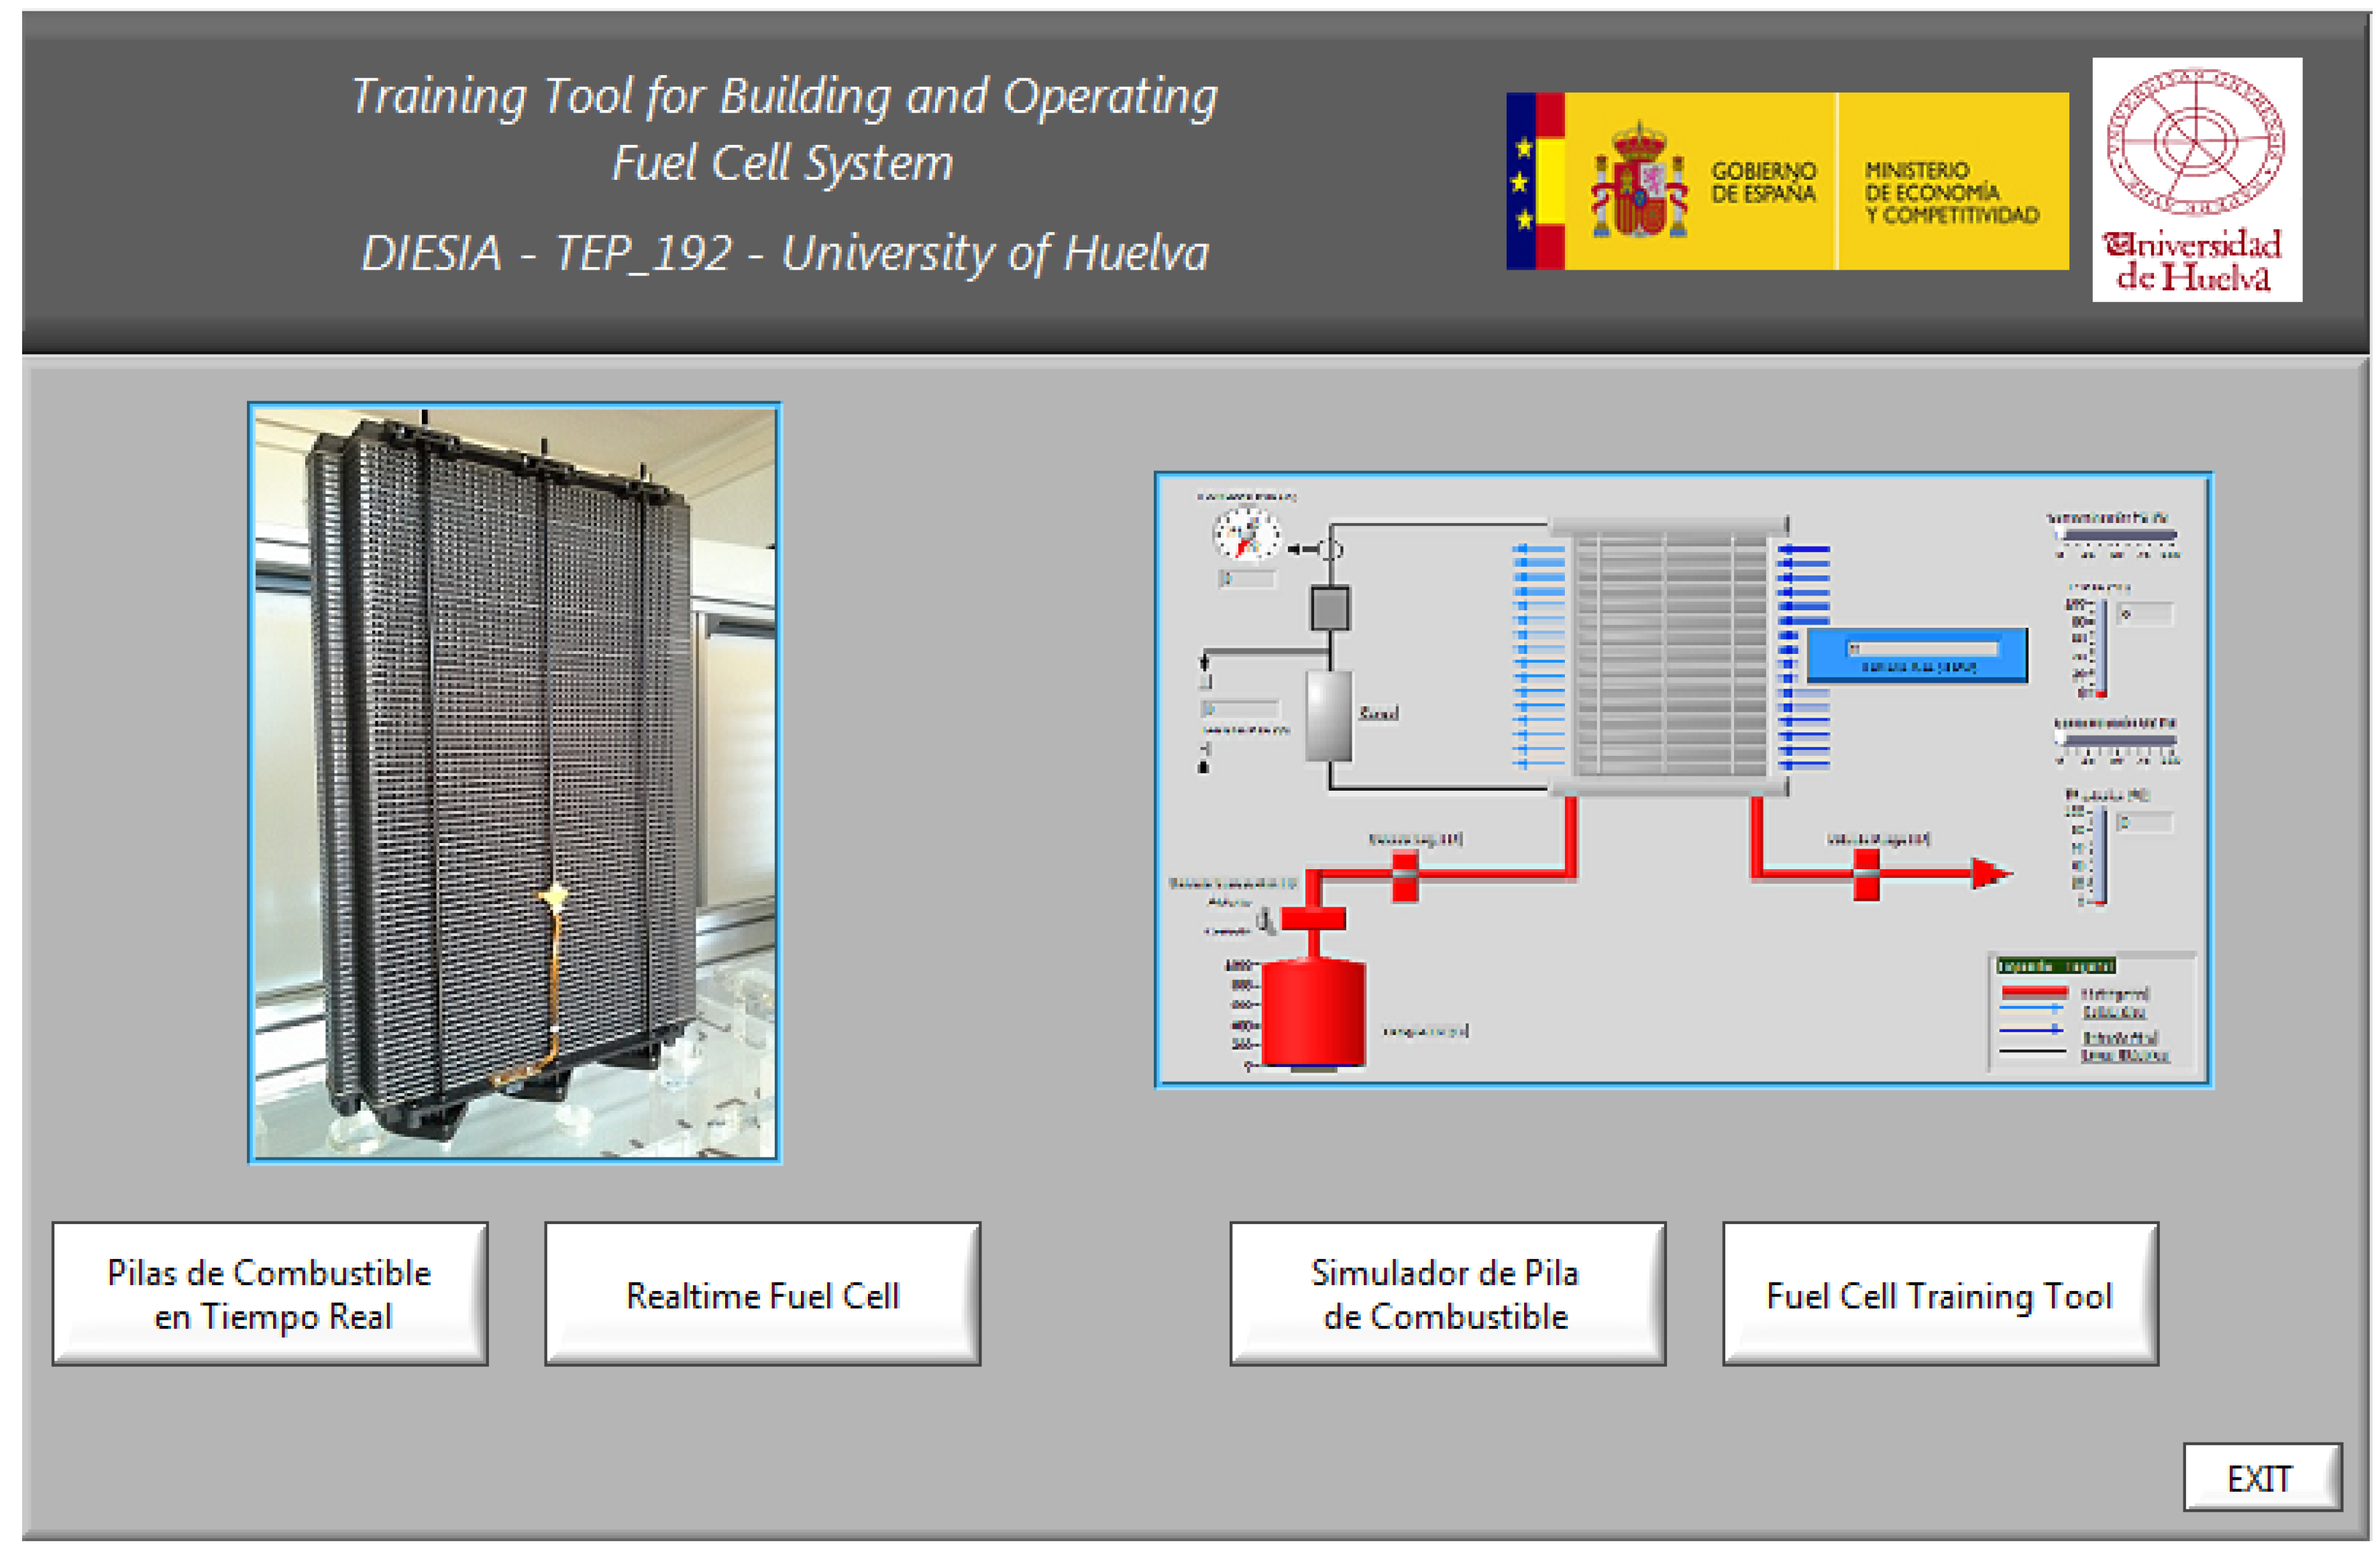
In this case, the SCADA & Simulator system has been developed in a LabView environment and data are organized in a process database, so any user can access the probes already carried out for analyzing them or developing models. The main screen of the SCADA & Simulator system (Figure 6) allows for selecting the way in which the user desires to work: with SCADA or Simulator. Additionally, the Help function links with a content manager where the user can learn how the software tool works and have a detailed description of the PEM fuel cell the software tool is based on: specifications, nominal operating characteristics, optimal process interface, and stack operation.
Figure 6.
Welcome screen of the developed Modular PEM fuel cell SCADA & Simulator system.

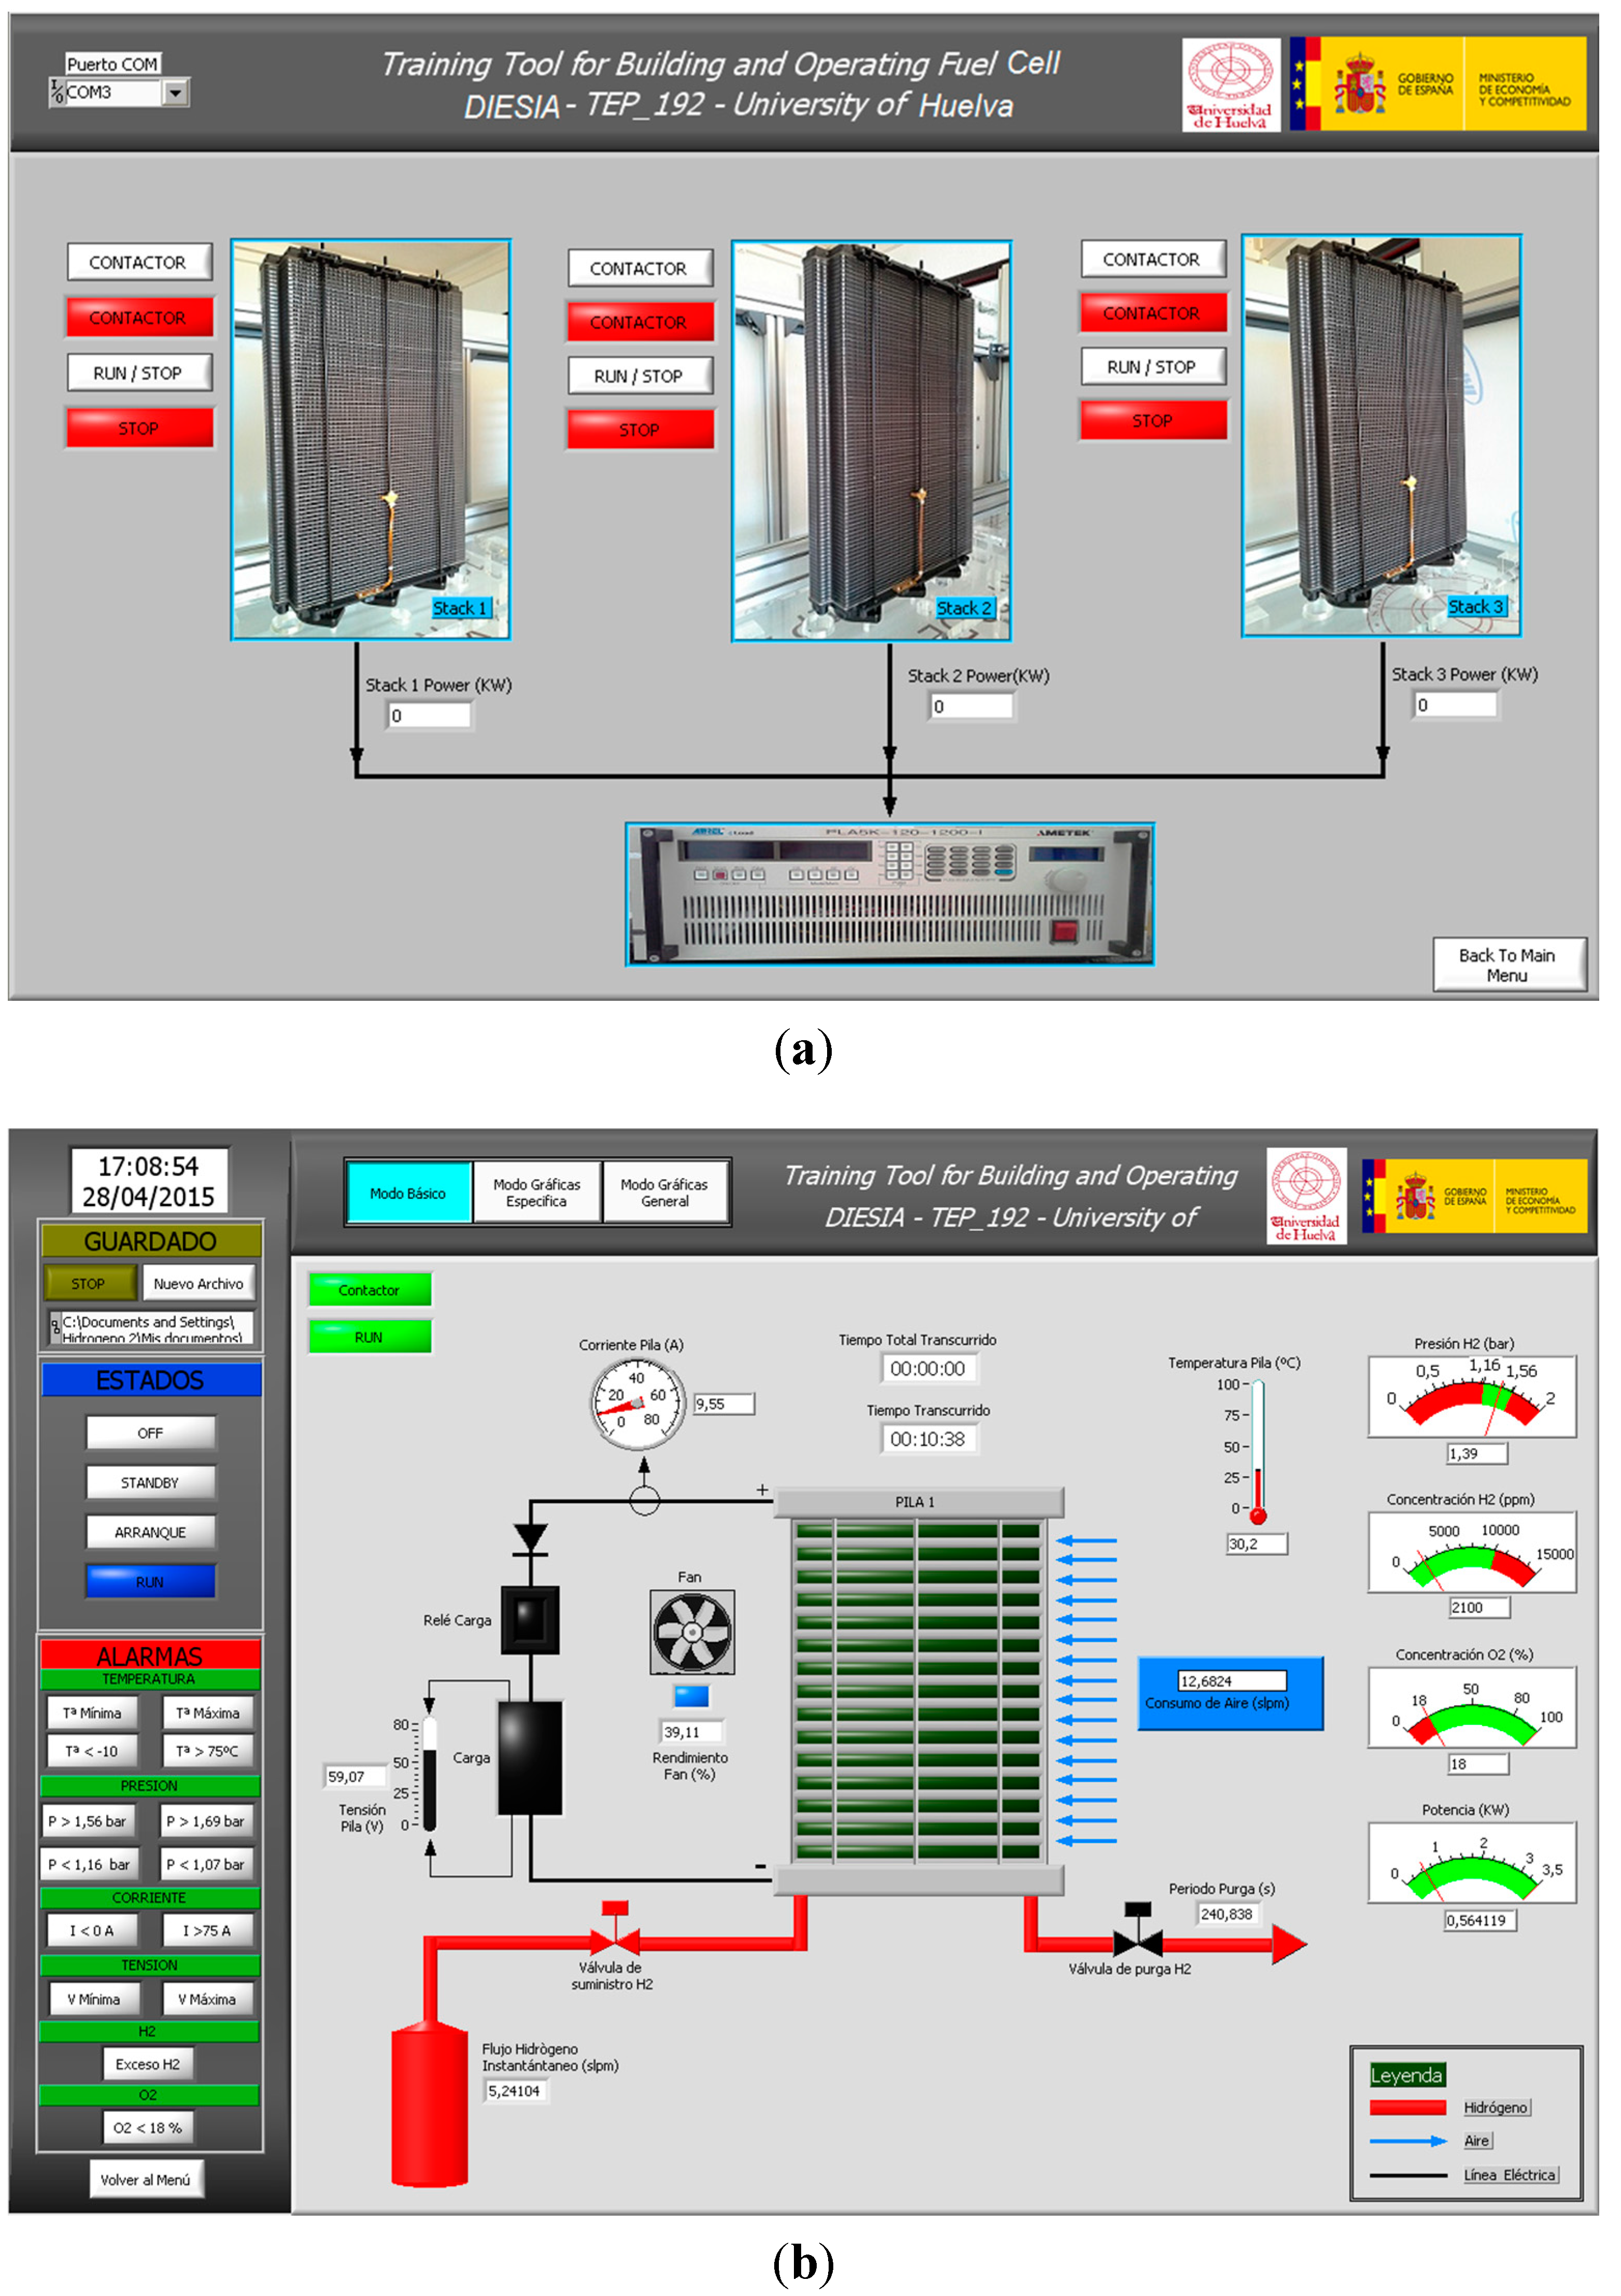
In case the first option is selected (SCADA), the order given by the user, deciding what module/s must be put in place, is sent to a Central Control Unit, which communicates with the selected module (Figure 7a). After that, Local Control Units read local sensors and send the order to local actuators according to the single PEM fuel cell operating procedure described in Section 2; at regular intervals they send information to Central Control Unit to be monitored. Figure 7b shows all the information provided by each single module: sensors and actuators in hydrogen (red), oxygen (blue), and electricity (black) lines, and fuel cell operating state including shutdown by failures.
Figure 7.
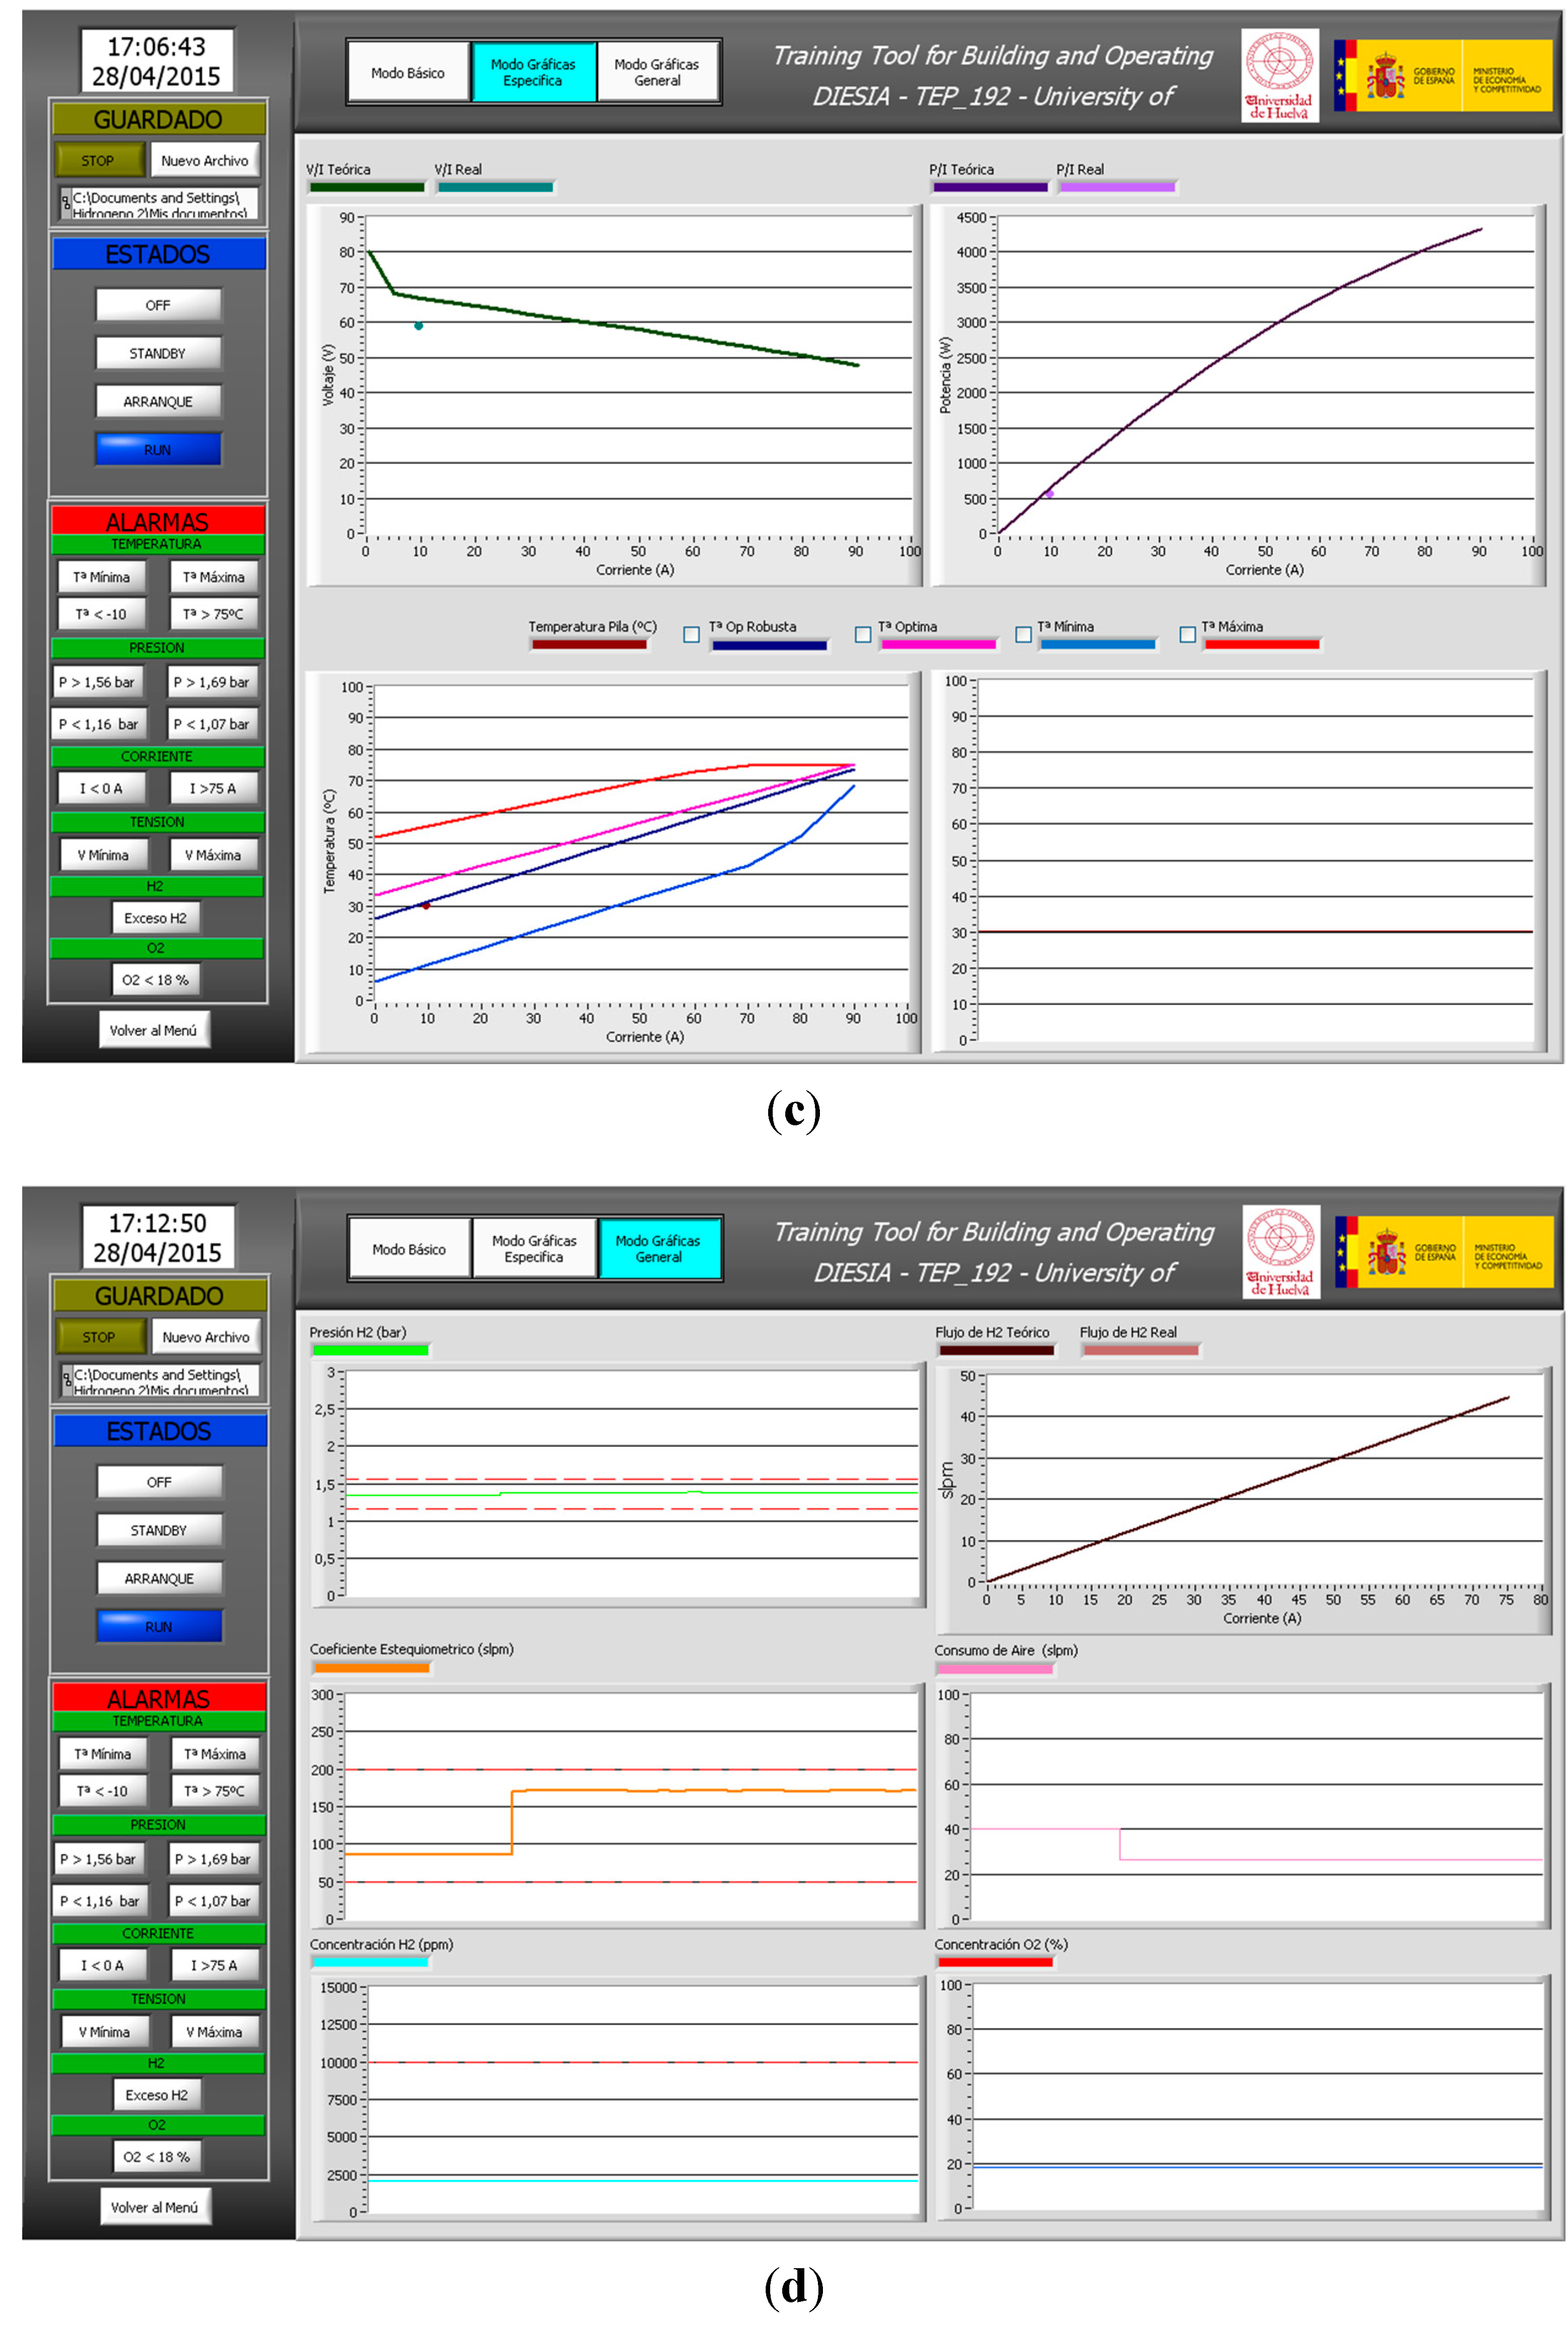
(a) Main screen of the Modular PEM fuel cell SCADA & Simulator system; (b) fuel cell test bench monitoring from the Modular PEM fuel cell SCADA & Simulator system; (c) specific graphic mode for SCADA mode; (d) generic graphic mode for SCADA mode.
Figure 7.
(a) Main screen of the Modular PEM fuel cell SCADA & Simulator system; (b) fuel cell test bench monitoring from the Modular PEM fuel cell SCADA & Simulator system; (c) specific graphic mode for SCADA mode; (d) generic graphic mode for SCADA mode.


Please notice the similarity between the schemes shown in Figure 2 and Figure 7b, so the user can learn the devices needed to implement the BoP of an air-cooled PEM fuel cell. Moreover, the fuel cell operating states described in Table 1 are compiled in Figure 7b, so the user knows the real state of the fuel cell. In case any sensor gives a signal outside of the allowable range (see Table 2), the SCADA system will warn about the origin of the failure.
Detailed information useful for comparing each fuel cell’s performance with the performance guidelines provided by the manufacturer can be found in Figure 7c. In this screen we can compare the real stack voltage with the theoretical (Equation (1)), the real stack power with the theoretical and the real stack temperature with the optimum (Equation (2)), as well as the minimum and maximum values according to the manufacturer’s recommendations (Figure 4). Finally, regarding air flow, Figure 7d shows extra variables related to hydrogen and oxygen supply like hydrogen inlet pressure, hydrogen inlet flow, oxidant stoichiometry (Equation (4)), air consumption, and hydrogen and oxygen concentration. Therefore, the user can verify the proper fuel cell oxygenation by comparing it with data provided in Table 3.
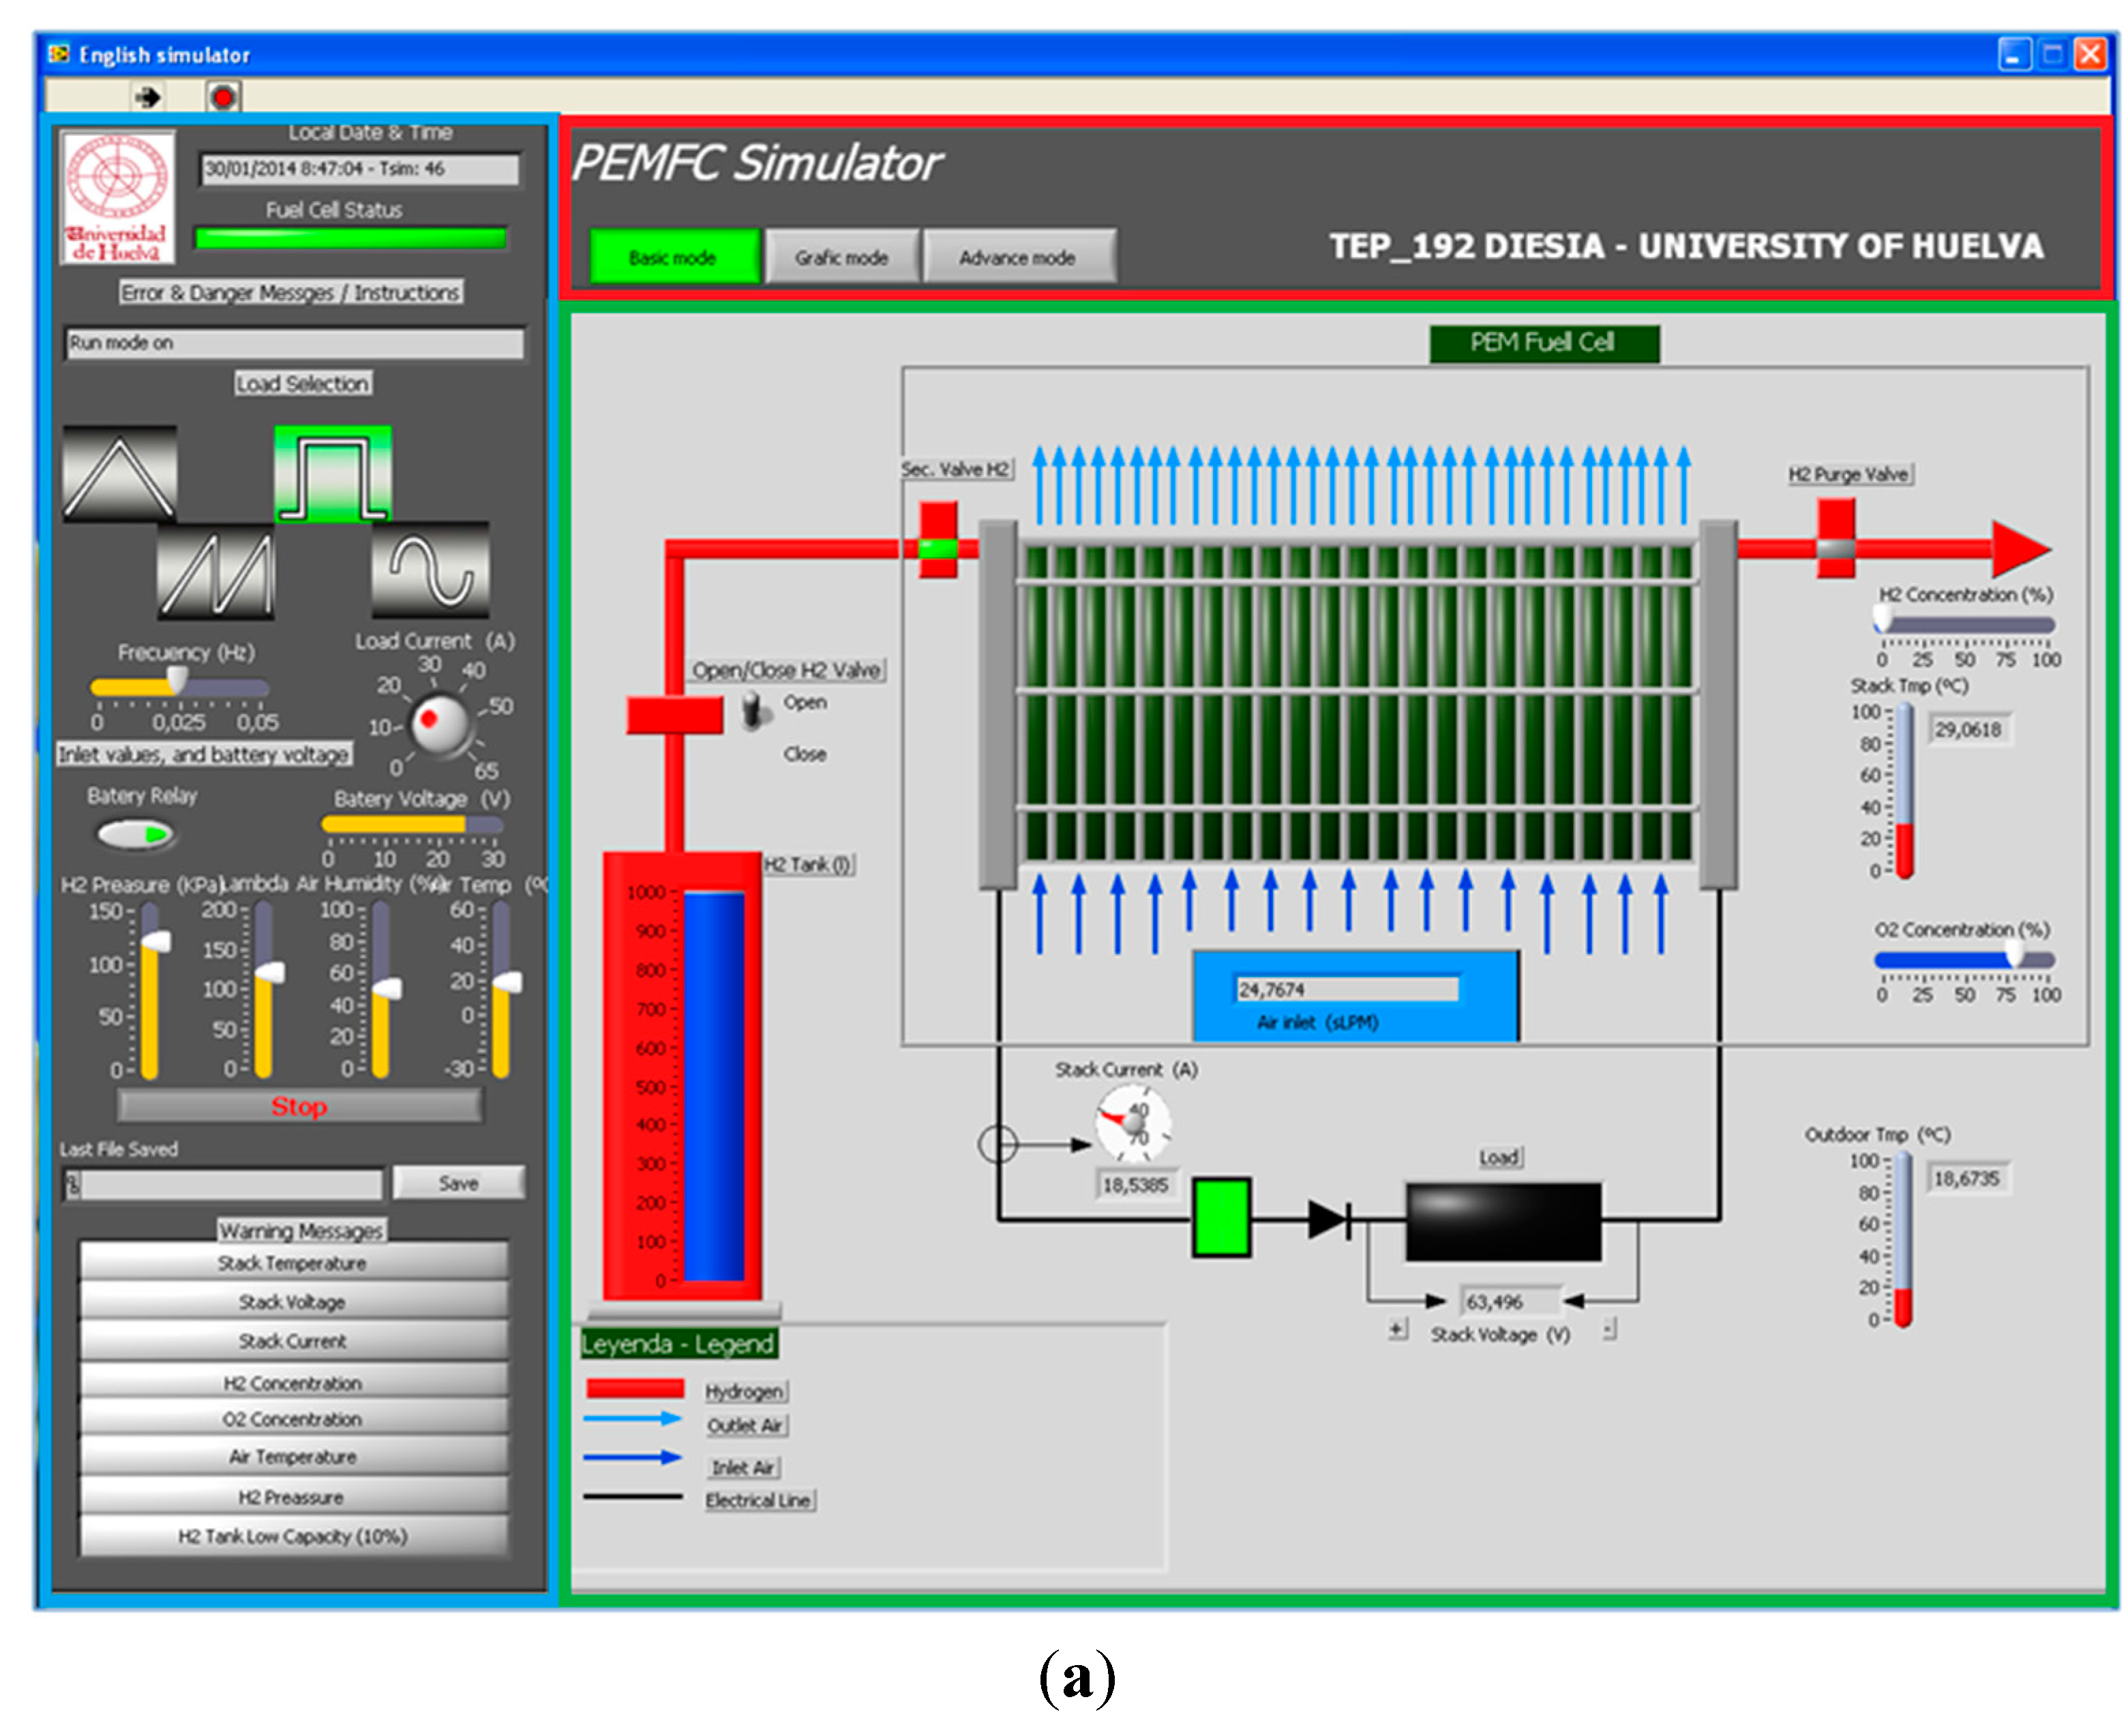
On the other hand, if the user selects the Simulator option, the software tool shows the Main window (Figure 8a). This window has been divided into three panels: one panel (squared in red in the figure), another blue panel on the left, and the panel in green in the center. The red panel is the headboard, which gives some information about the university where the software has been developed and the mode window that the user has selected. The blue panel has been called the order panel. Here the user can select the load profile based on current waveform and range; s/he can also connect the battery (see Figure 2 and Section 2.2) and define its voltage as well as establish some parameter values like inlet hydrogen pressure, oxidant stoichiometry, relative humidity, and inlet air temperature. The green area shows the fuel cell system built up from the stack, the coolant/oxidant subsystem, fuel subsystem, and electrical subsystem (as explained in Section 2) that correspond with the developed test bench.
Figure 8.
(a) Simulator main window and simulator basic mode window; (b) simulator graphic mode; (c) simulator advanced mode.
Figure 8.
(a) Simulator main window and simulator basic mode window; (b) simulator graphic mode; (c) simulator advanced mode.


Initially the fuel cell system is Off (see Table 1). To progress to the Start-up state, all parameters on the order panel must be defined. These parameters (initial conditions) are input variables to the Control Unit. The Control Unit based on these initial conditions defines the fuel cell system operating point, which will be shown on the green panel. Table 4 shows the parameter values selected as examples.
| Variable | Value |
|---|---|
| Stack Current | Square wave: 0–20 A |
| Battery Voltage | 24 V |
| Inlet Hydrogen Pressure | 130 kPa |
| Stoichiometric coefficient (λ) | 120 |
| Relative Humidity | 50% |
| Inlet Air Temperature | 20 °C |
| Hydrogen Concentration | 0% |
| Oxygen Concentration | 80% |
Once the initial conditions are established, the user can press the Start button and the fuel cell system starts working and switches to the Run state. The simulator will now show the Basic Mode window (Figure 8a) where there are some displays that help the user to know the fuel cell system is operating correctly. These displays are the hydrogen tank level (the hydrogen tank level will descend as the fuel cell system operates), the air consumed, the stack operating temperature, the supply and purge valves state, and the current and voltage sensor or load relay state, among others.
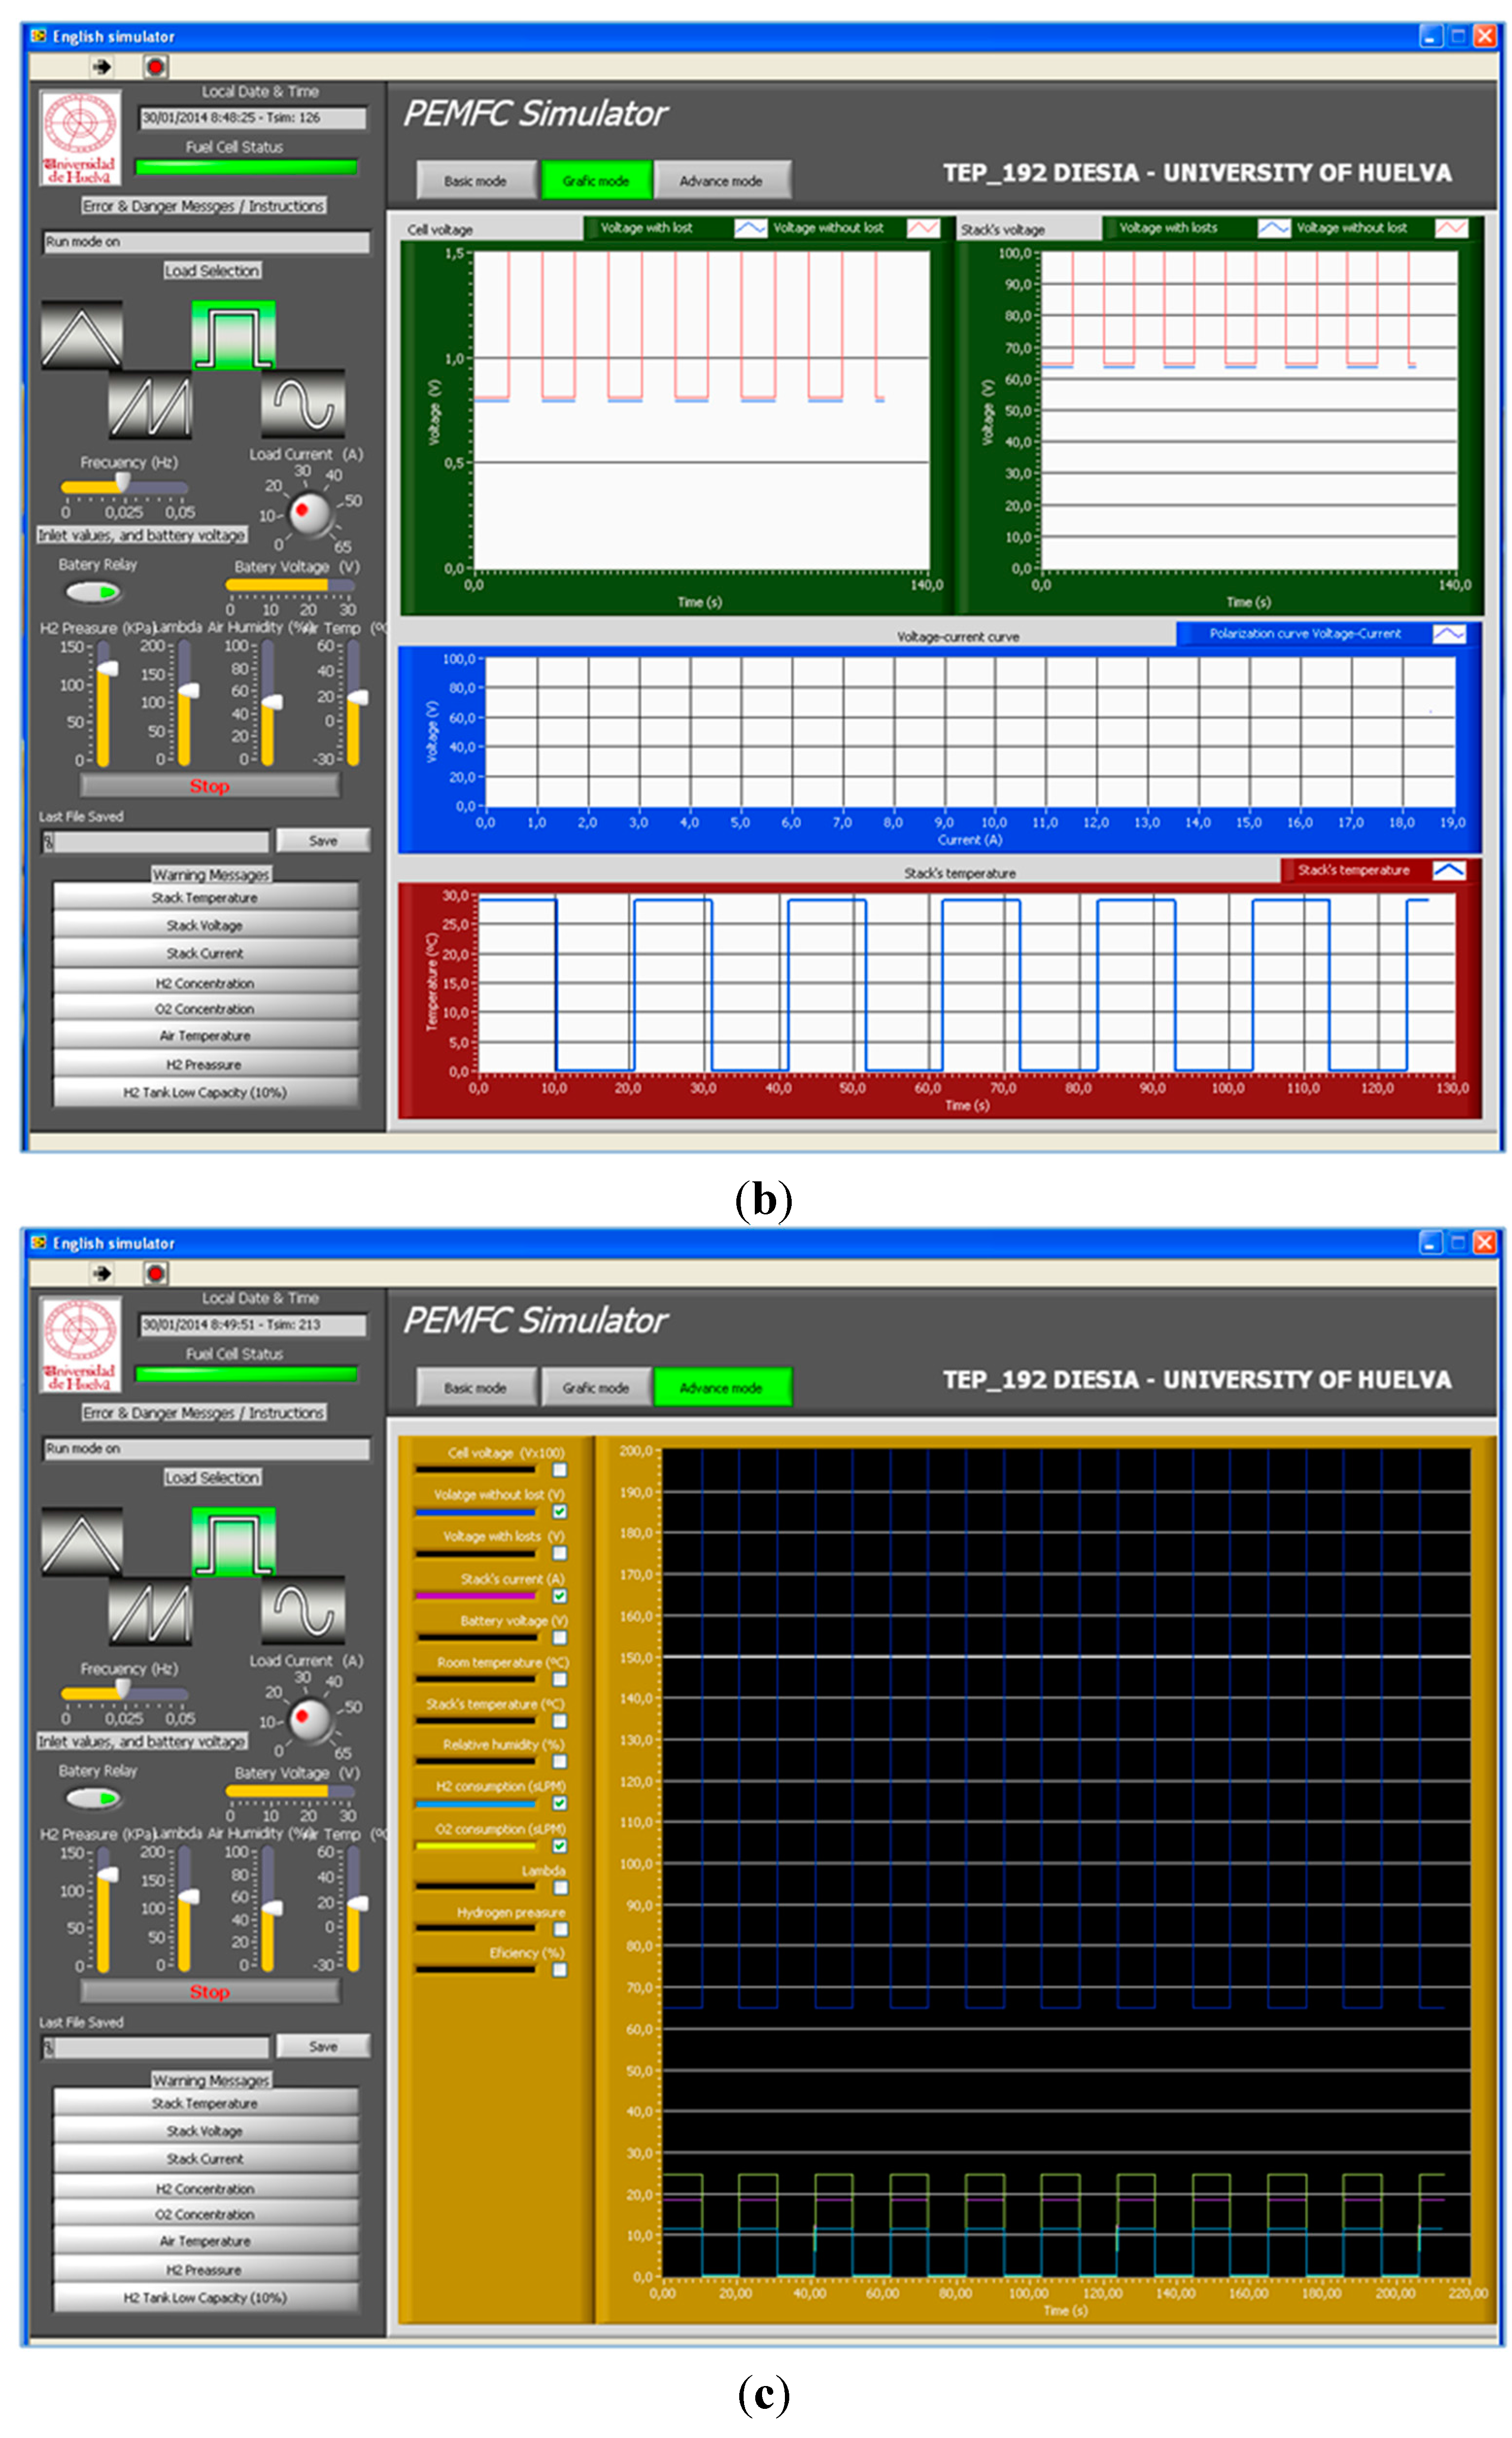
The scheme shown in Basic Mode helps the user to know how a fuel cell system is built (stack and BoP) and how it works, and introduces him to the hydrogen technology. In the Graphic Mode window (Figure 8b) can be found the three main variables to consider in a stack: cell voltage and stack voltage (with and without losses) and the stack operating temperature. Moreover, the polarization curve is also available. These curves can be matched to the manufacturer’s data and can be used to know the fuel cell system performance under normal operation and critical situations before shutdown by failure. In this example, as we have selected a square load profile, both cell and stack voltage follow the square wave according to the fuel cell polarization curve. Consequently, the stack temperature will step between air temperature and operating temperature according to the current load demand. Regarding the stack temperature curve, we would like to clarify that 0 °C on the curve is equivalent to air temperature. Then, if simulation results show 30 °C at stack temperature, the real stack temperature will be 30 °C above the air temperature (where the air temperature is selected on the order panel by the user—Figure 8a and Table 4).
The Advanced Mode window (Figure 8c) completes the graphic mode, giving information about more variables not included in Graphic Mode. The user can select which variables to show. In this case, the set of variables has been extended to voltage battery supply, room air temperature, relative humidity, hydrogen and oxygen consumption, oxidant stoichiometry, hydrogen pressure, and fuel cell system efficiency. With the help of this window, the user could be warned when something goes wrong and what is its cause. In this example we have selected stack voltage without losses (dark blue line), stack current (pink line), hydrogen consumption (blue line), and oxygen consumption (yellow line). We can observe that stack current and hydrogen and oxygen consumptions follow the load profile established by the user in the order panel. Once the user has finished the simulation, he can press the Stop button and the simulation is halted, then the fuel cell system switches to Shutdown state.
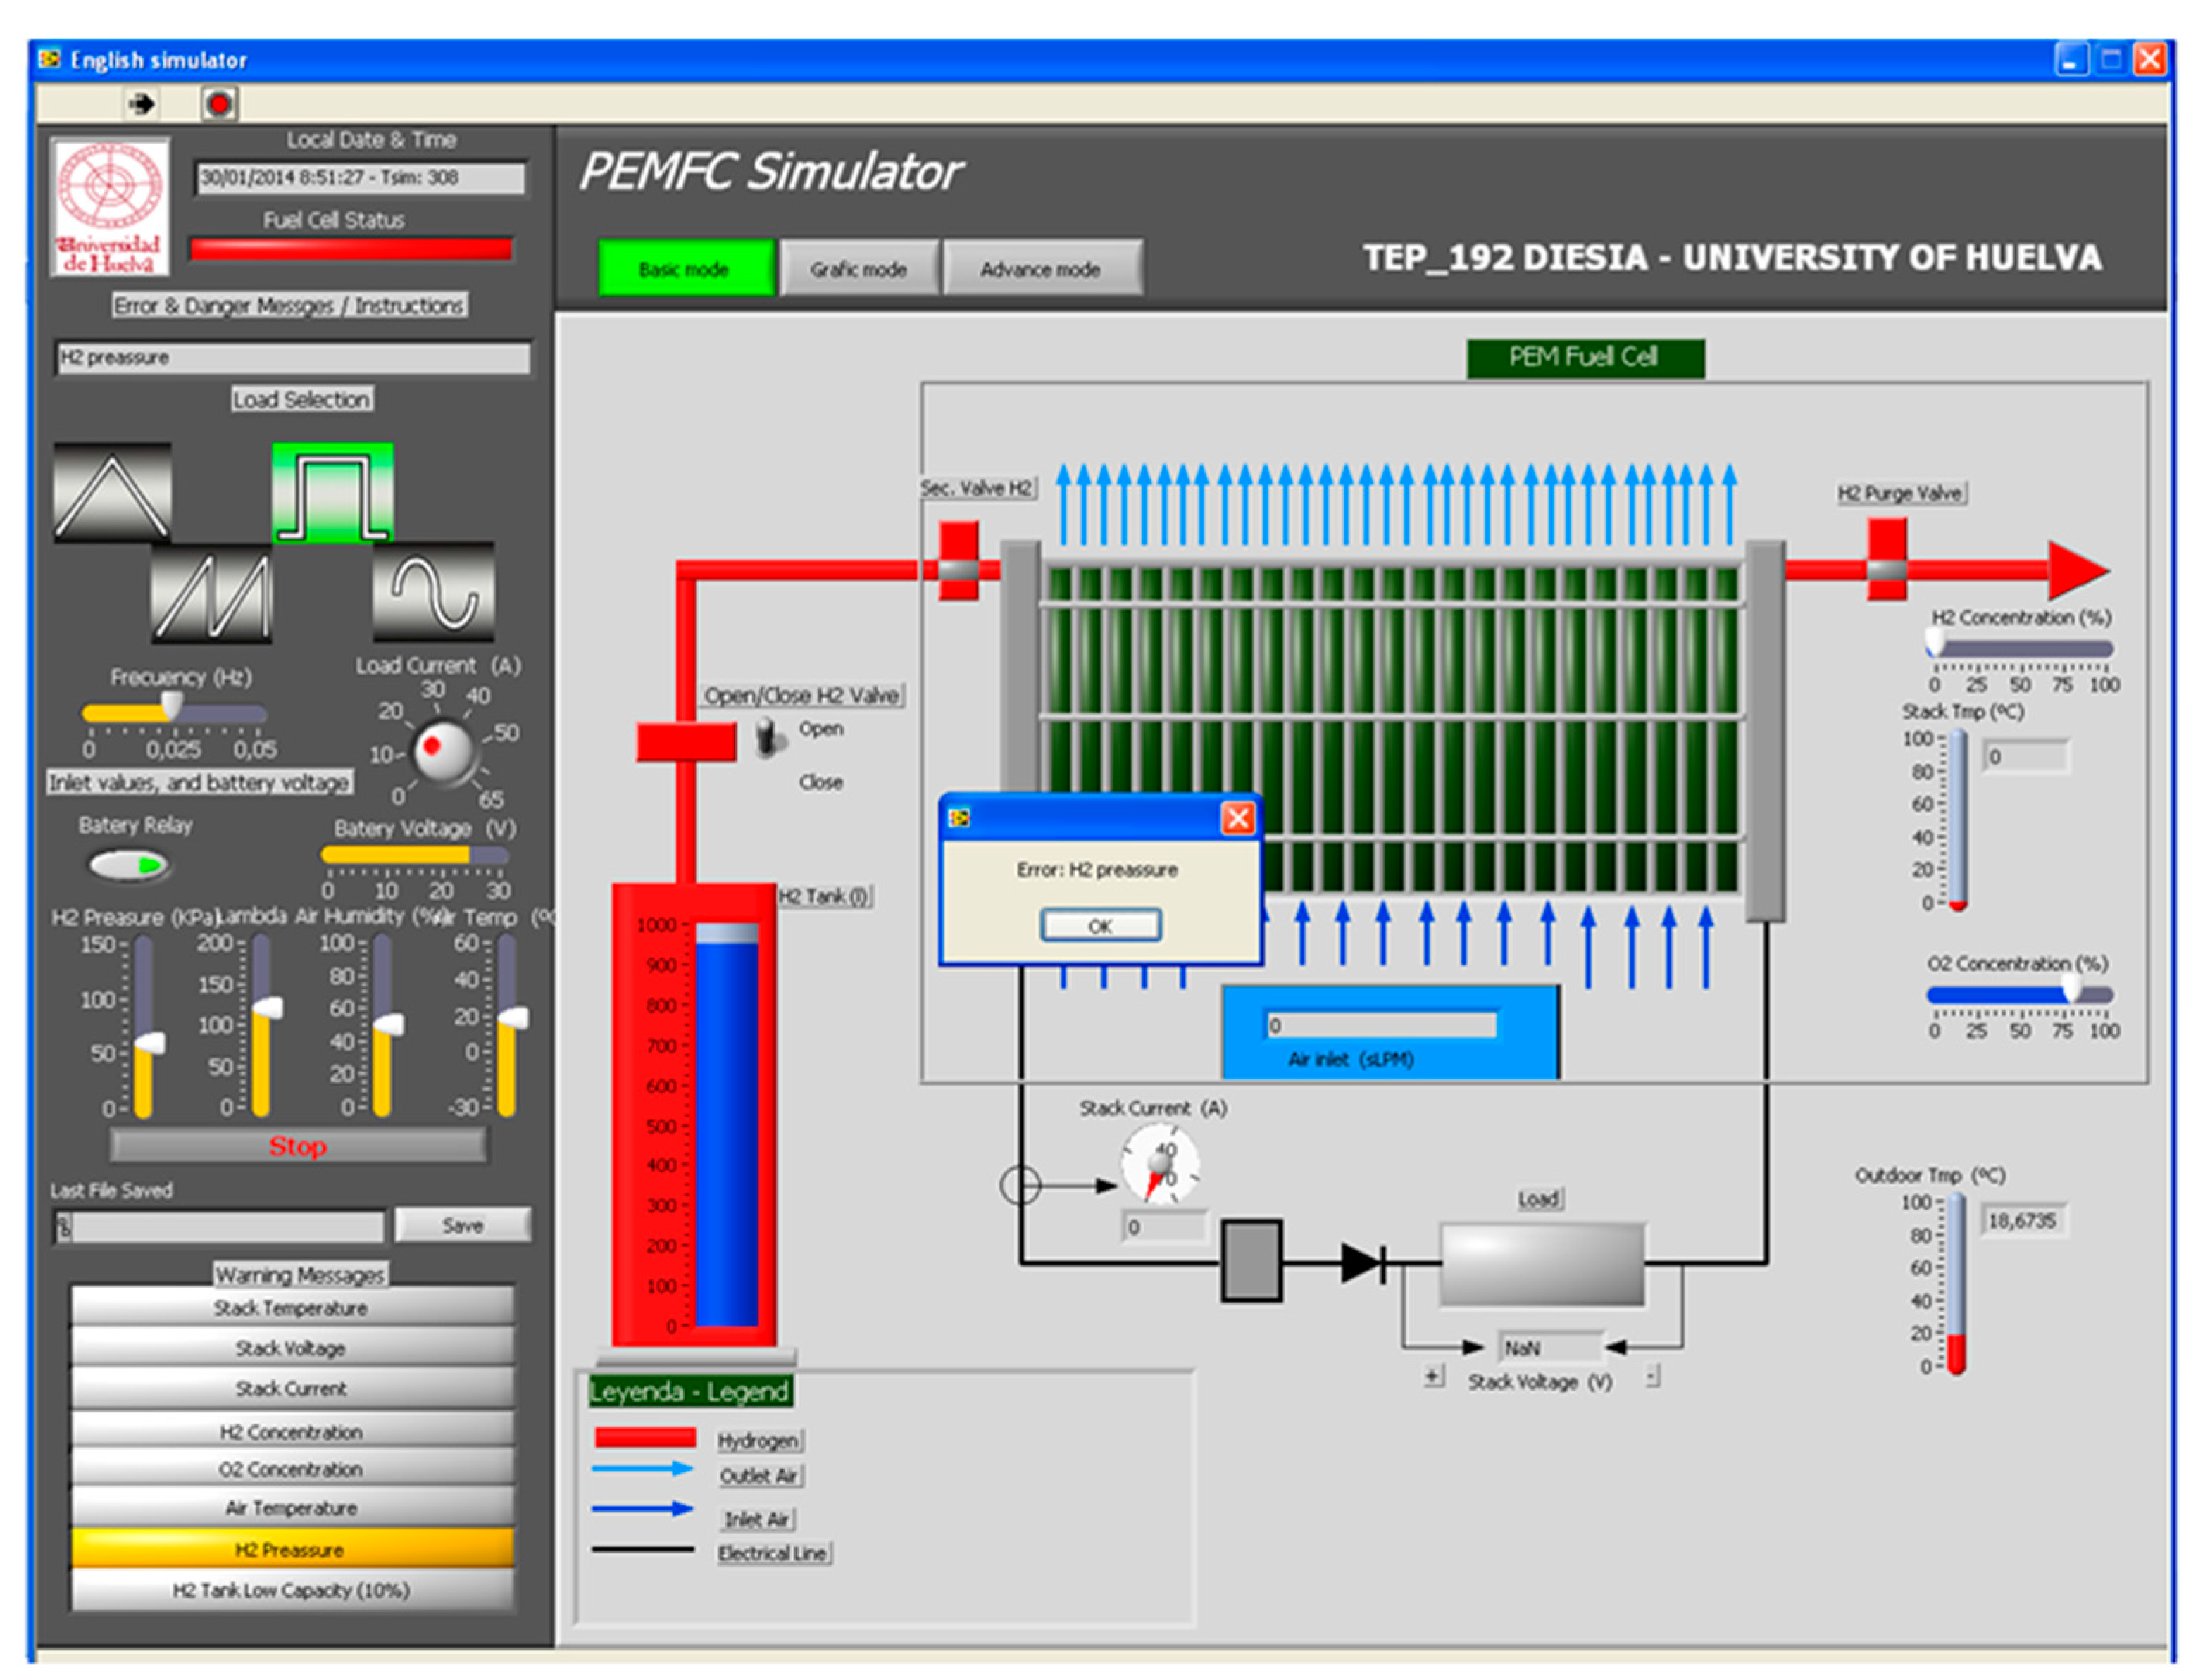
Along the simulation time, the user can know that the fuel cell system is operating correctly regardless of the window mode (Basic, Graphic, or Advanced). The Fuel Cell Status bar in the order panel is lit in green under good operating conditions, but will turn orange or red if any variable enters the warning or failure range (see Table 2). In this simulation example, we are going to modify the initial conditions so that the hydrogen pressure descends to 59 kPa. The hydrogen pressure fall could mean that the hydrogen input valve is closed or there are leaks in the hydrogen input valve on a real system. Then, under this variation, the Control Unit recognizes the new hydrogen pressure value as a failure value, changing the fuel cell status bar to red, and an error message appears explaining the failure origin (Figure 9). The fuel cell system is on Shutdown by failure state and the simulation is aborted.
Figure 9.
Error message under incorrect conditions.

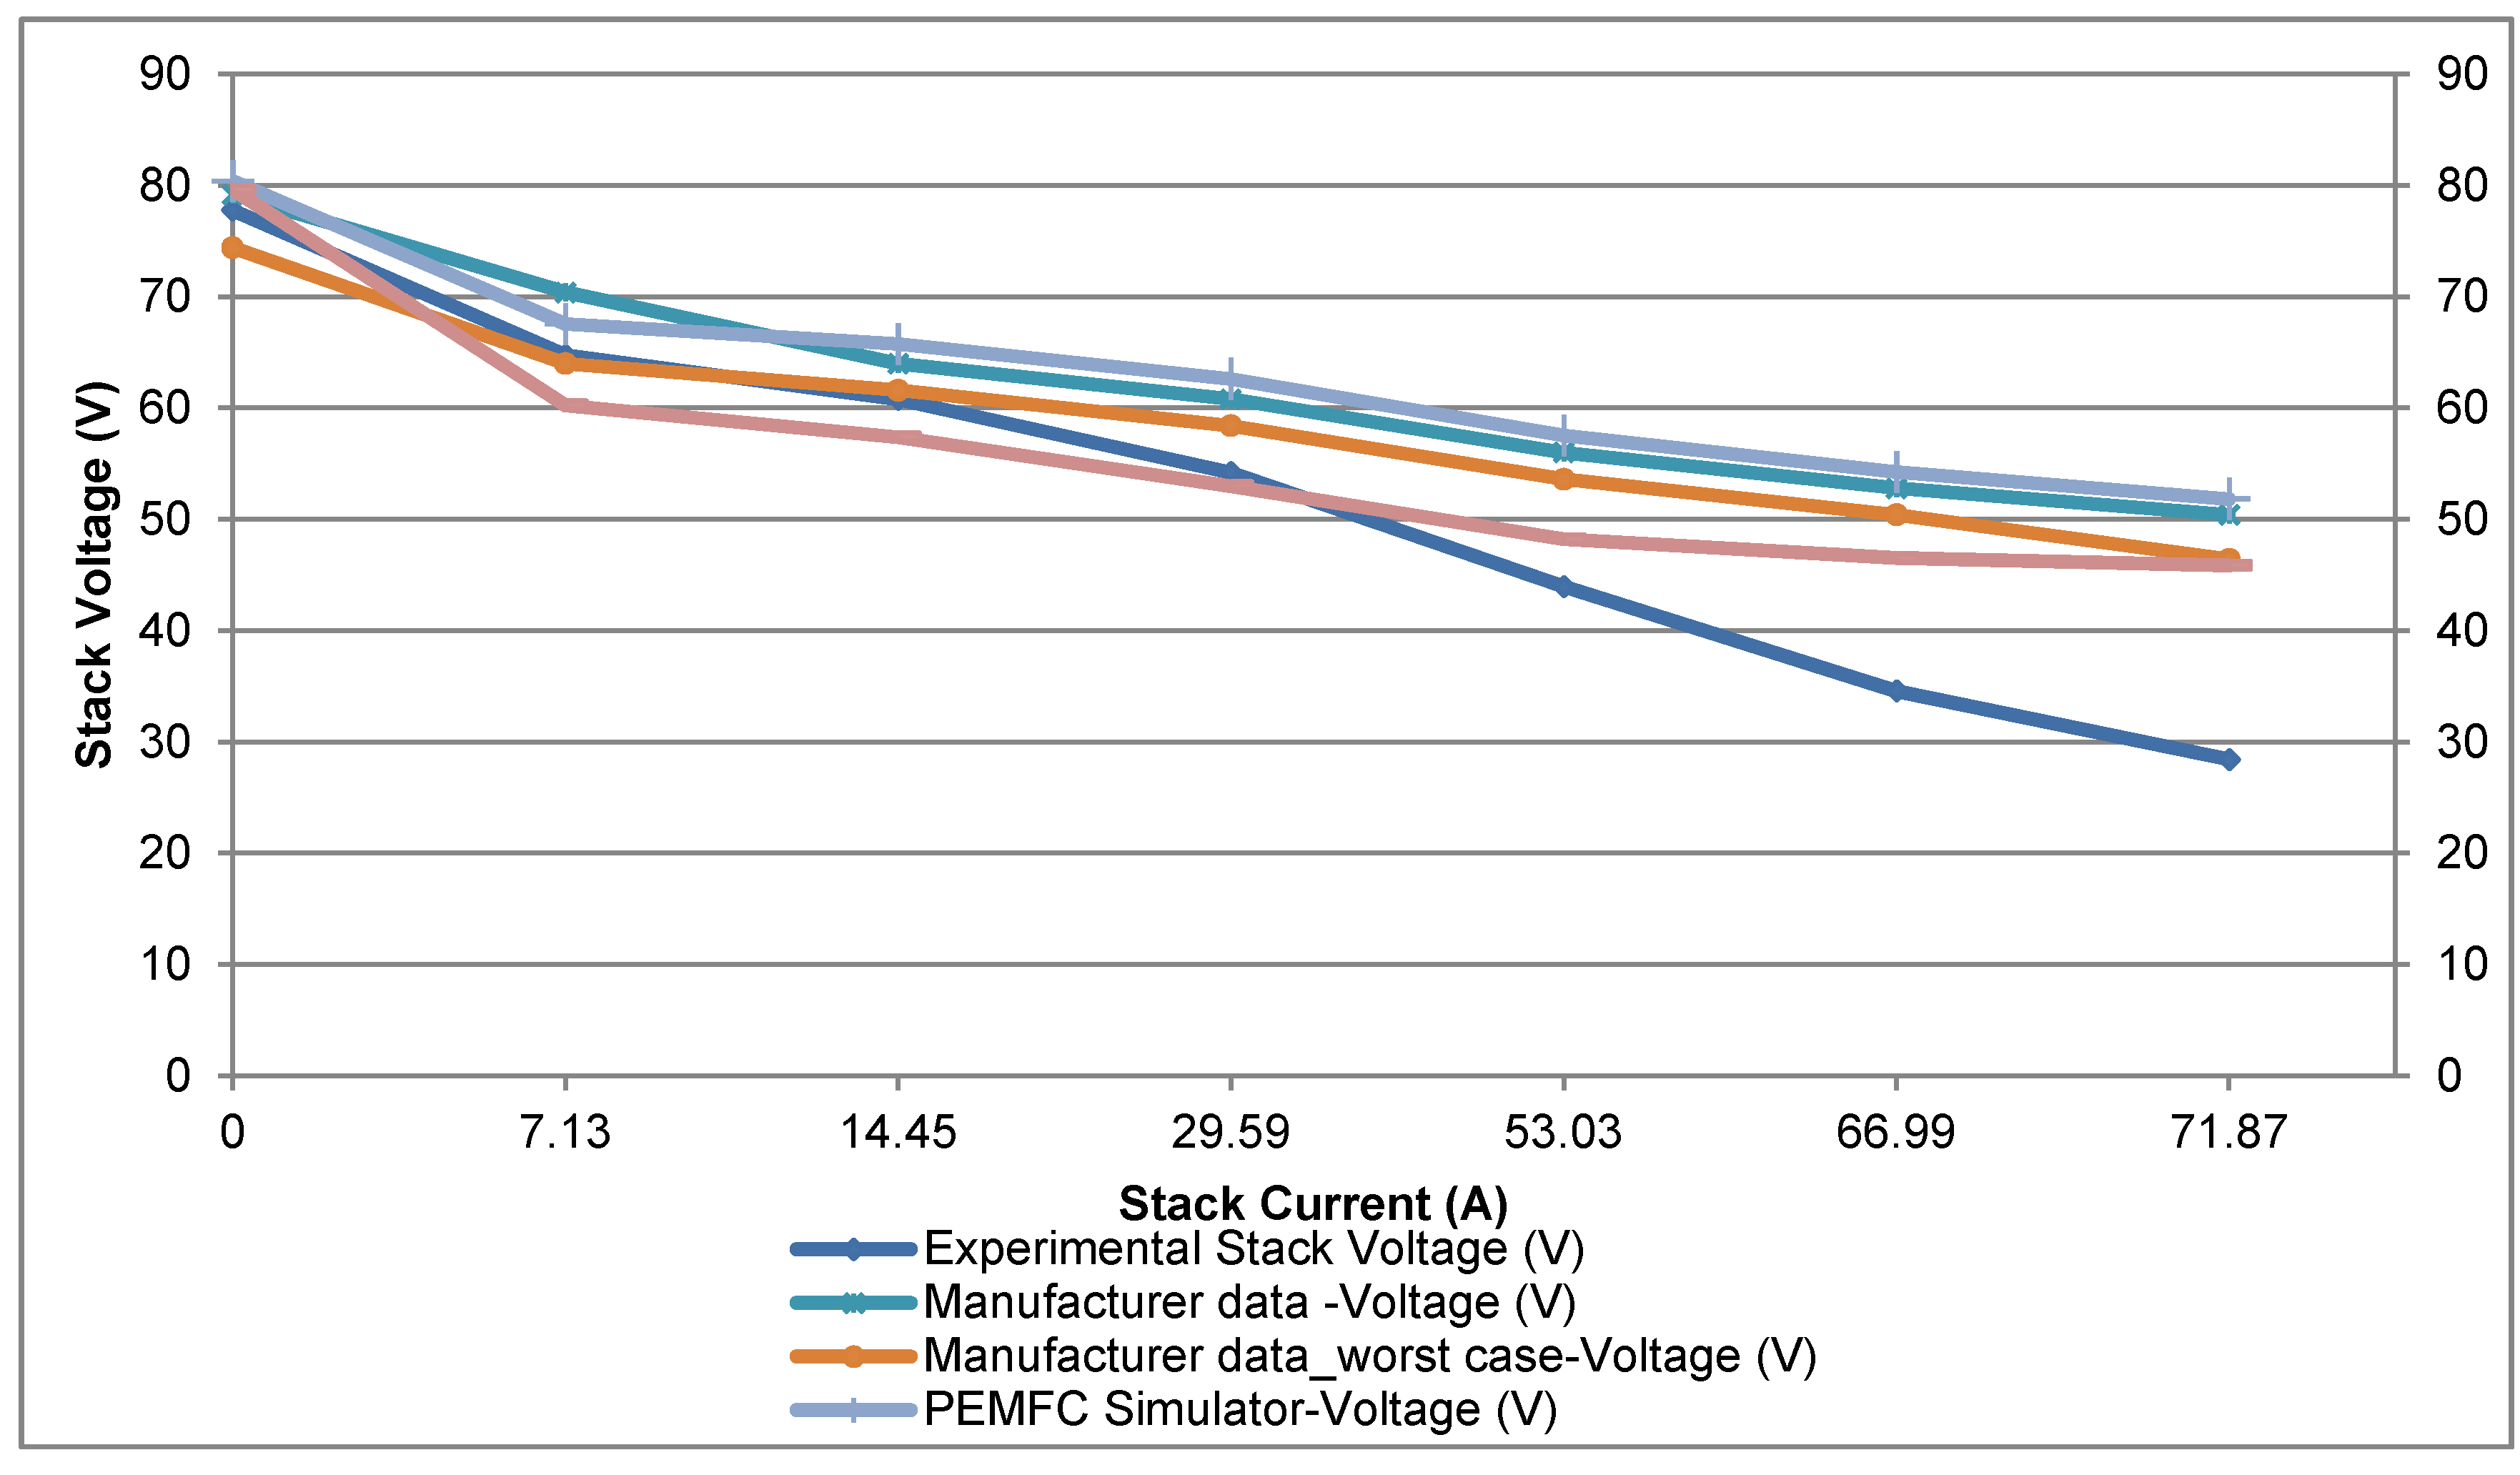
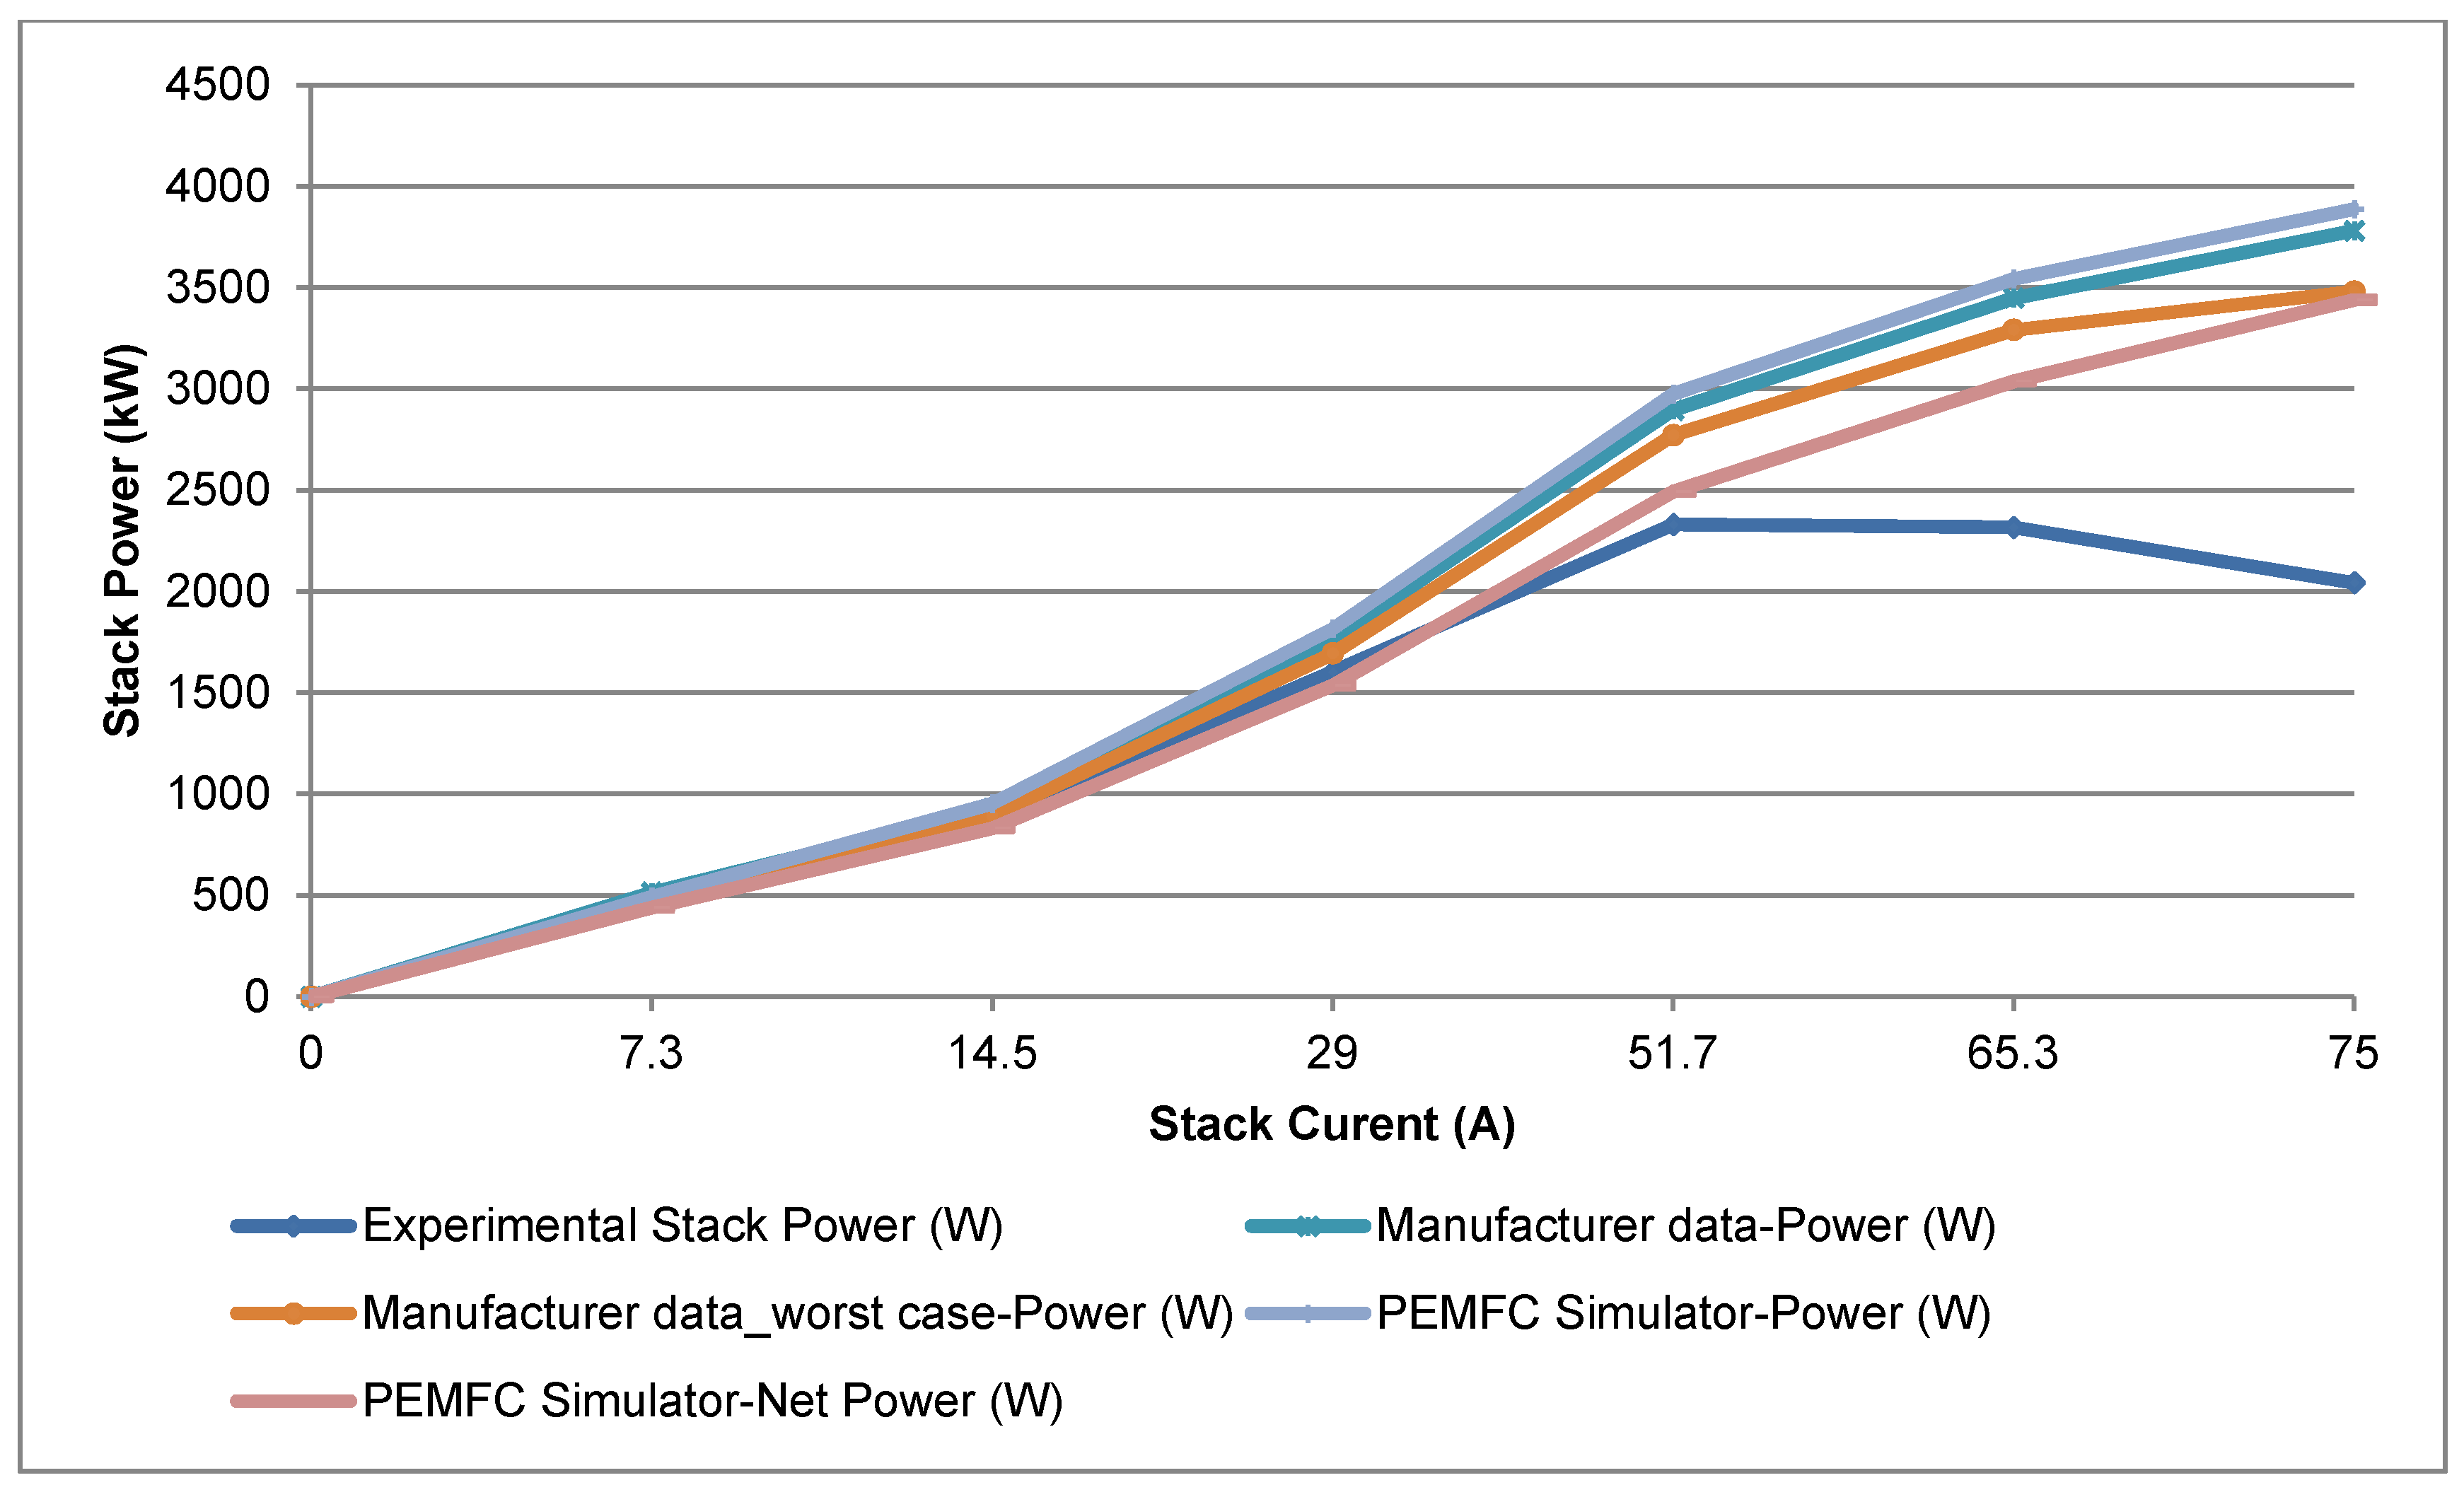
Results obtained by simulation can be compared with the manufacturer’s data and with experimental data obtained by the authors after lab testing of FCgen-1020ACS. For this purpose, experimental data provided by the SCADA system and simulation results obtained from the Simulator system can be saved in additional files. Then these data can be put into the same plot to be compared with the manufacturer’s data. In the test carried out by the authors, the fuel cell was subjected to the same operation conditions. For experimental tests, a programmable electronic load type Amrel PLA5K-120-1200 [27] has been used. In comparison with other kinds of DC loads used for testing renewable energy sources [28], a programmable electronic load is easy, it does not add ripple into the current provided by the source and it also supports the Constant Voltage (CV), Constant Current (CC), Constant Resistance (CR), and Constant Power (CP) modes of operation. For simulation tests, the fuel cell was suppressed to the same load profile as the experimental test, also agreeing with the load profile provided by the stack manufacturer. Figure 10 shows the polarization curve and Figure 11 shows the power curve obtained in either case (PEMFC Simulator with and without losses, manufacturer data-best and worst case, and real experimental data obtained by the authors). We can see that the PEMFC Simulator estimations approximate manufacturer data. On the other hand, PEMFC Simulator estimations approximate experimental results obtained by the authors for current values lower than 50 A. For higher currents the experimental data diverge further from the theoretical data because of mismatching between cells and imperfections derived from manufacturing.
Figure 10.
Polarization curve comparison from PEMFC Simulator, manufacturer data, and experimental lab testing.
Figure 10.
Polarization curve comparison from PEMFC Simulator, manufacturer data, and experimental lab testing.

Figure 11.
Power curve comparison from PEMFC Simulator, manufacturer data, and experimental lab testing.
Figure 11.
Power curve comparison from PEMFC Simulator, manufacturer data, and experimental lab testing.

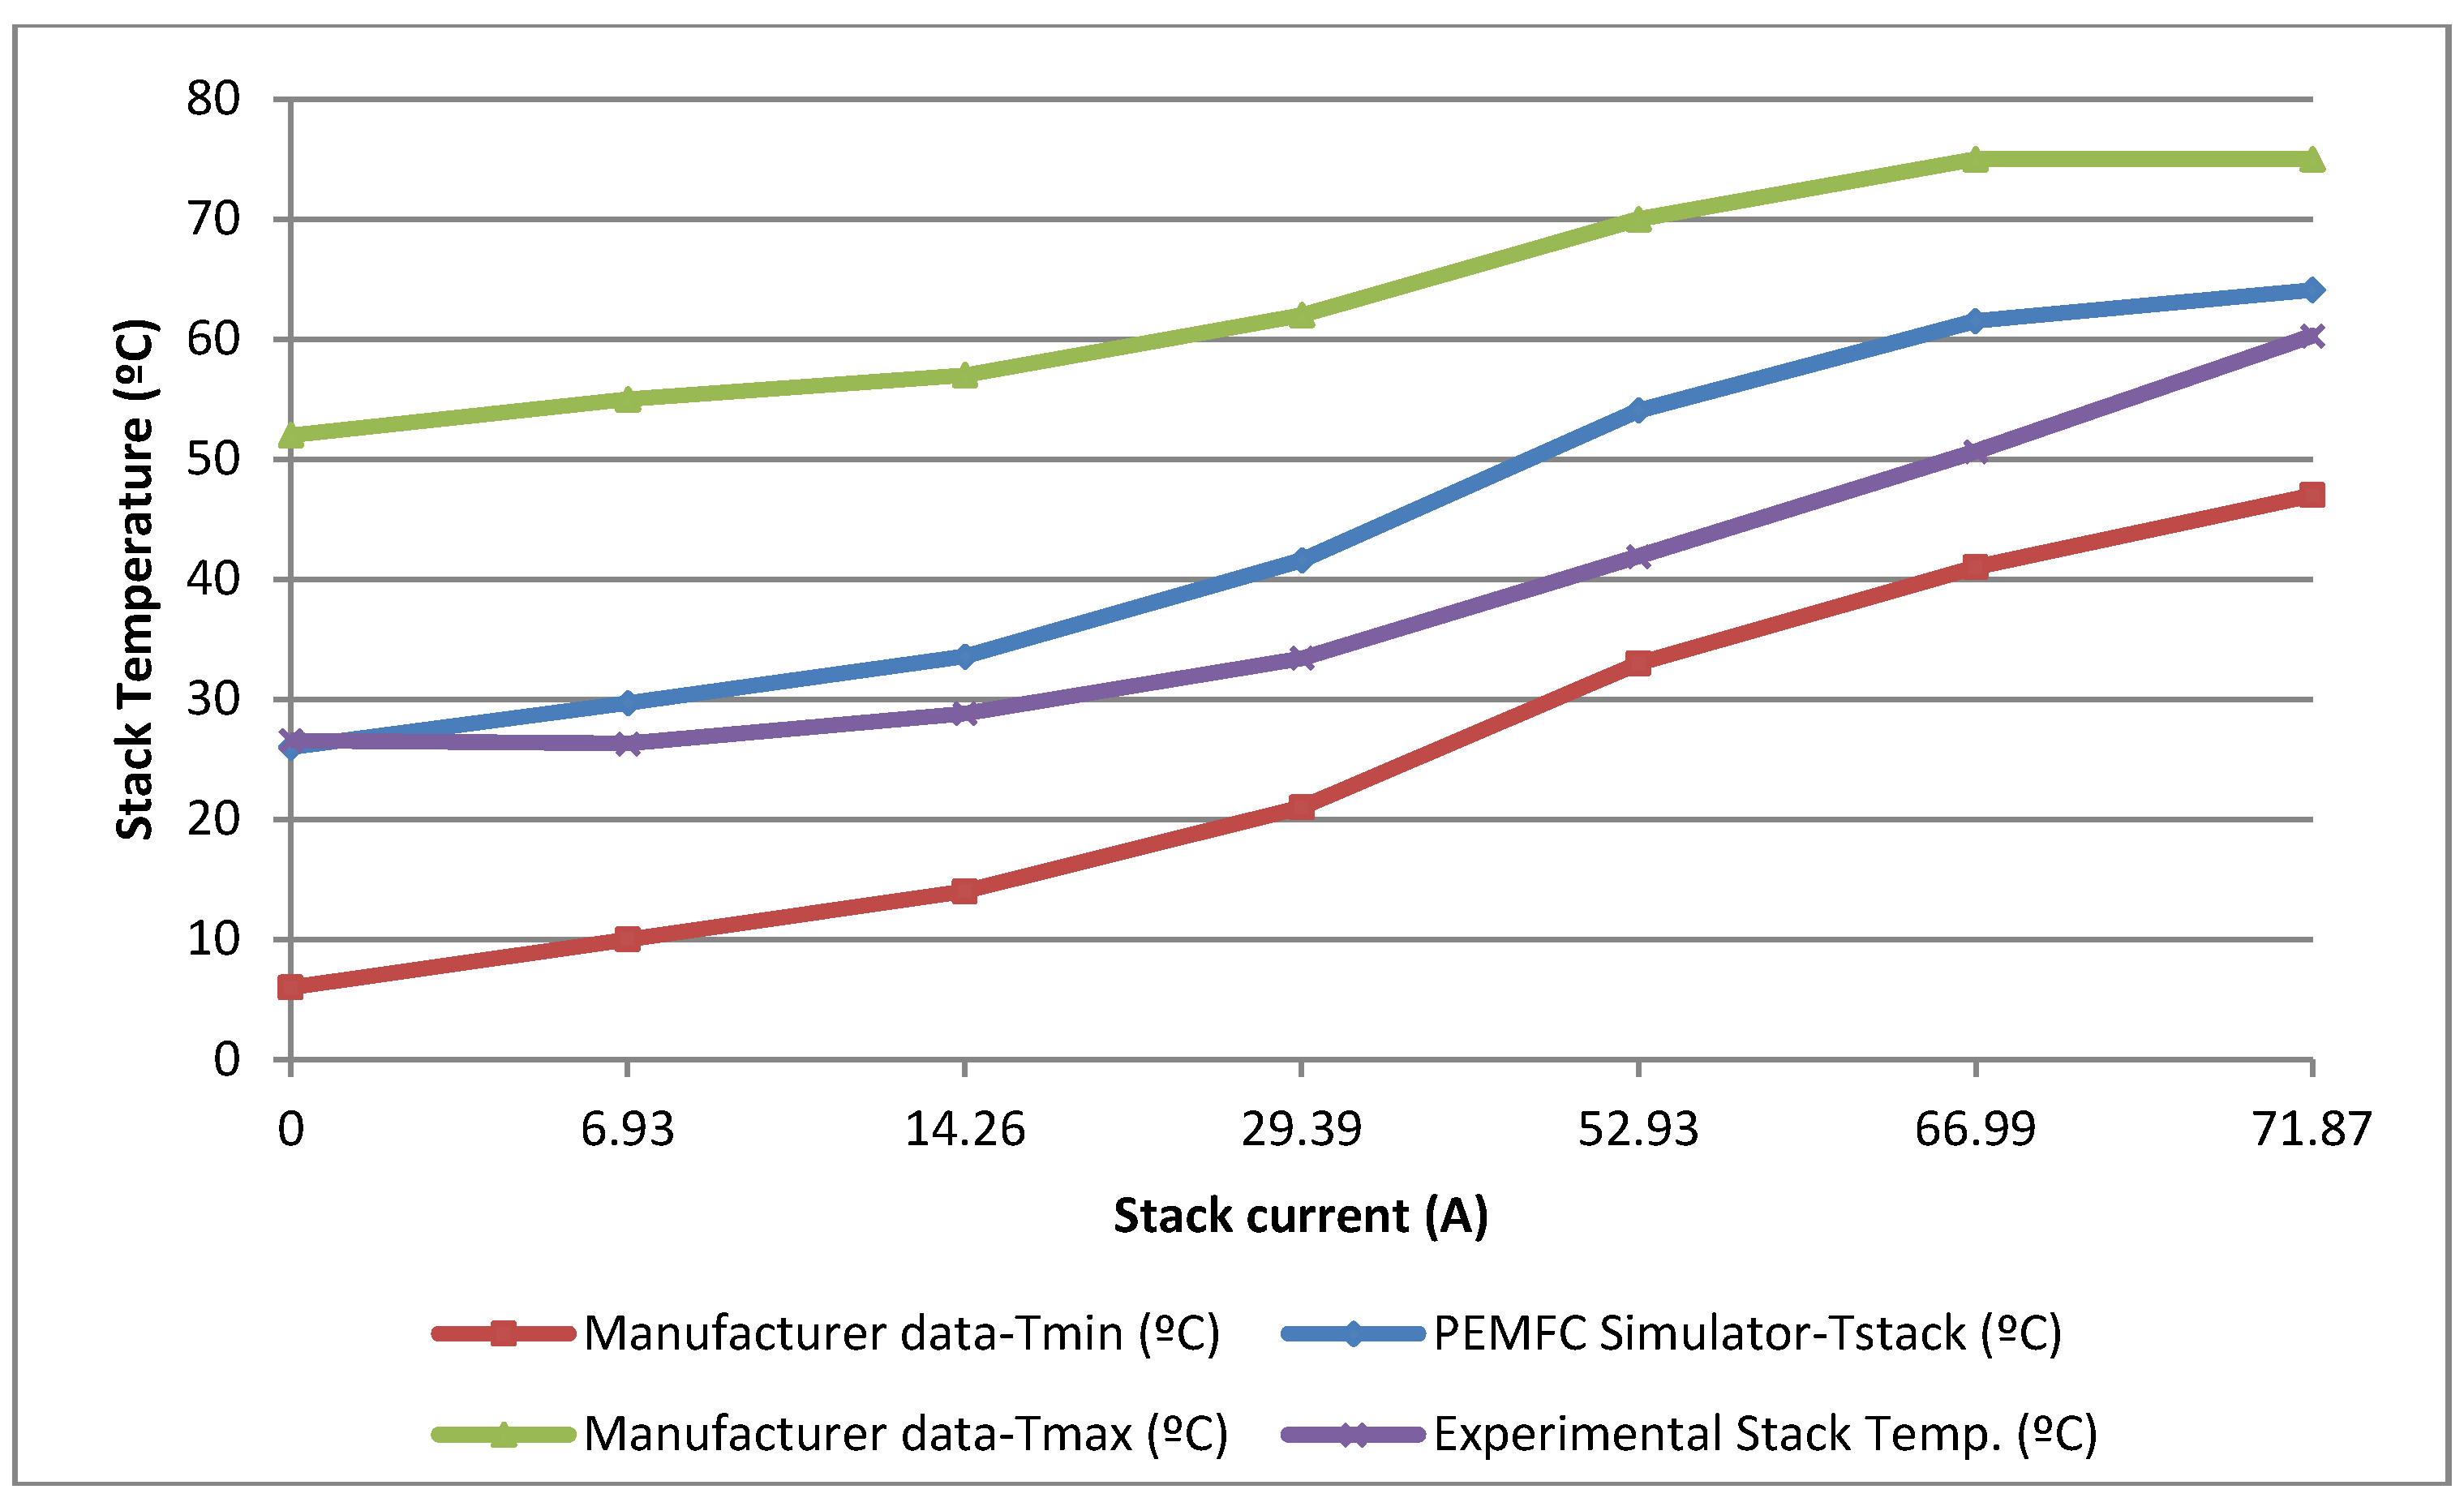
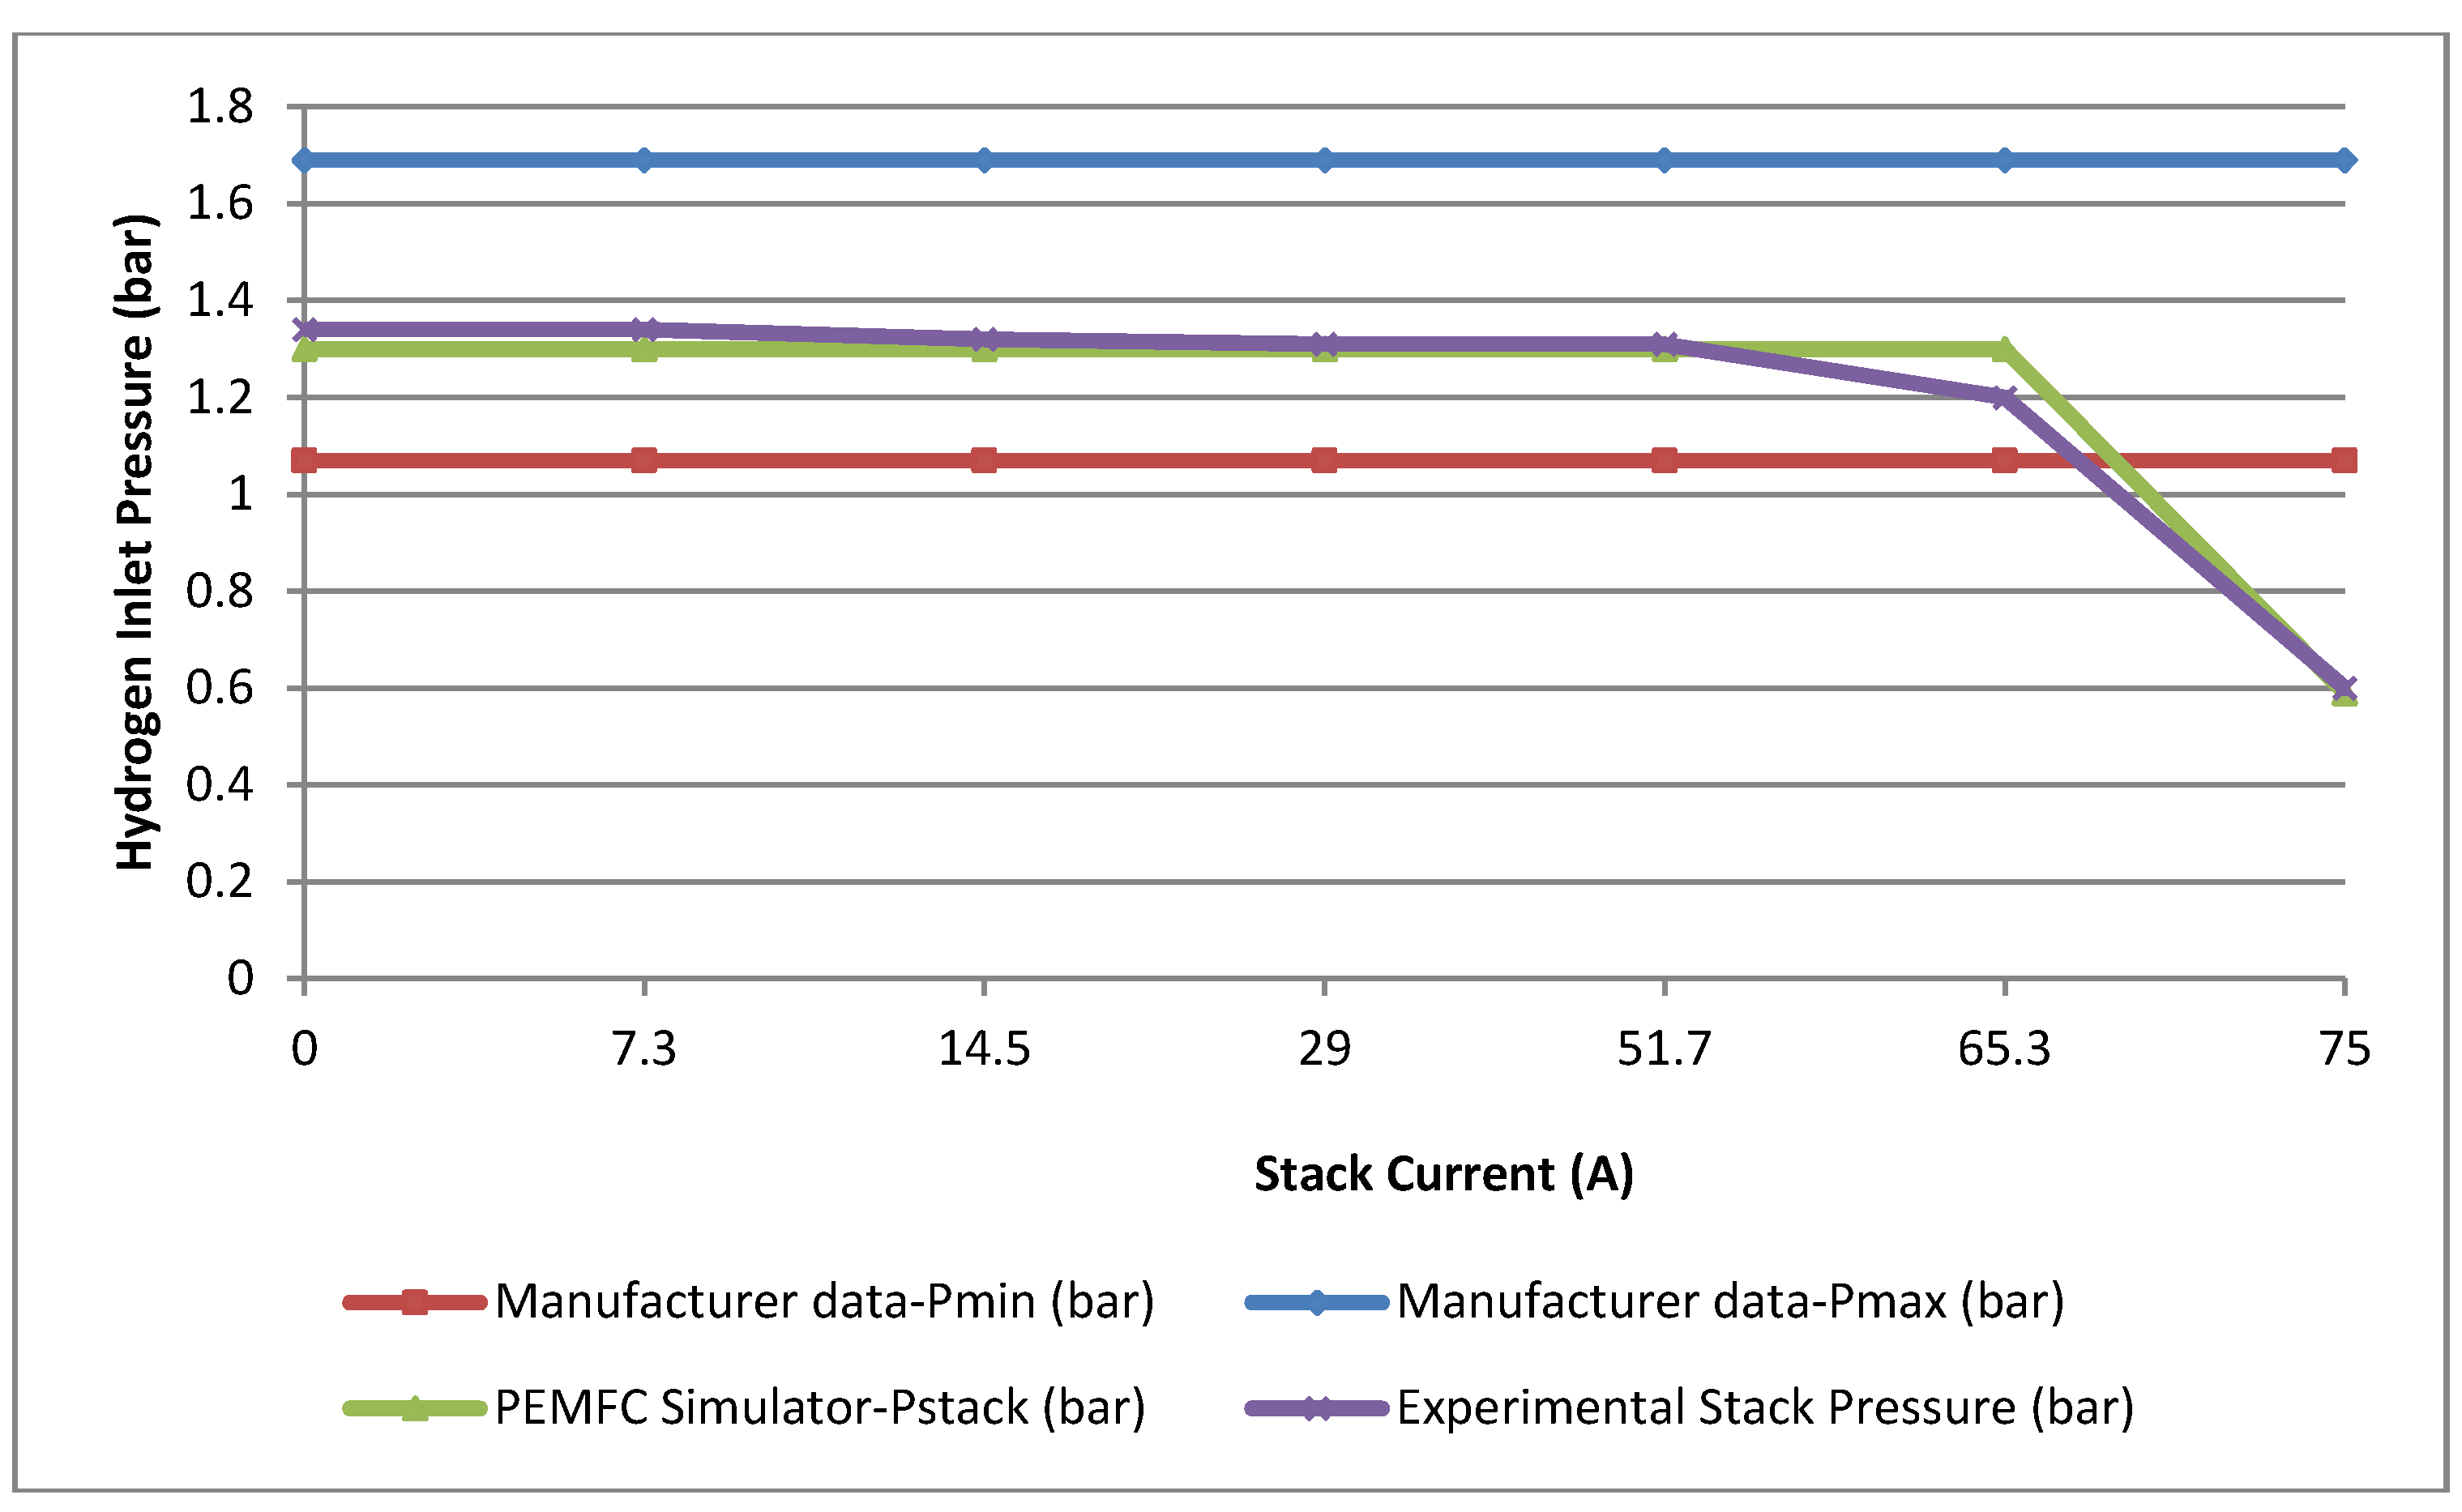
Other variables that can be compared are stack temperature and hydrogen inlet pressure. Figure 12 offers a comparison between temperature values calculated by the simulator and real stack temperature. The difference between them can be justified because in the PEMFC Simulator the stack temperature (Equation (2)) depends on load current and stoichiometric coefficient λ (relation between the inlet air flow and the consumed air flow), which are defined by the user. If, during a simulation, the current is increased but the stoichiometric coefficient is not, the stack temperature will increase linearly. Instead, in the real system the stack is cooled by fans whose speed is adjusted on the basis of the difference between the optimum temperature recommended by the manufacturer and the real operating temperature. At low current values, in experimental tests the speed of the fan is kept to a minimum, so the real stack temperature is similar to that obtained by simulation. At medium and high current values, fan speed increases to keep the temperature near to or below the optimal value. In any case, both simulator results and experimental tests show that the stack temperature remained between the minimum and maximum values recommended by the manufacturer. In relation to hydrogen inlet pressure (Figure 13), in both cases (simulation and experimental tests) this is fixed by user. At the time of simulation and testing it is lowered to 59 kPa (this is the same failure shown in Figure 9), then the fuel cell system is disconnected because the pressure is outside of the range allowable by manufacturer.
The authors would like to add that the PEMFC Simulator has been designed for students, researchers, and technicians interested in fuel cell field. Basic Mode has been developed for beginner users or to give basic information, while Advanced Mode is intended for advanced users interested in knowing additional variables for a thorough study.
The last feature included in the PEMFC Simulator is the data saving ability (the Save button in the order panel). Data to save are those curves shown in Graphical Mode corresponding to current and voltage stack, cell voltage (with and without losses), and operating stack temperature. The data file can be saved as .txt or .xls, to be used in further data mining or spreadsheet applications.
Figure 12.
Temperature curve comparison from PEMFC Simulator, manufacturer data, and experimental lab testing.
Figure 12.
Temperature curve comparison from PEMFC Simulator, manufacturer data, and experimental lab testing.

Figure 13.
Pressure curve comparison from PEMFC Simulator, manufacturer data, and authors’ lab testing.
Figure 13.
Pressure curve comparison from PEMFC Simulator, manufacturer data, and authors’ lab testing.

4. Conclusions
The paper presents a Supervisory, Control and Data Acquisition system and Simulation (SCADA & Simulator system) that allows for real-time training on the actual operation of a modular PEM fuel cell system. This tool consists of free software that allows real-time operating and simulating of real situations like failures and breakdowns in the system. This developed software tool helps us to understand how fuel cells operate and what devices are needed to configure and run fuel cells, from the individual stack to configuring the whole fuel cell system. The software tool is based on a modular system integrated by three PEM fuel cells achieving power rates higher than tens of kilowatts.
The SCADA tool governs the fuel cell system. Users can locate the actual fuel cell operating point inside the manufacturer’s recommendations. With the help of SCADA we can get information about fuel cell system state operation, sensor measurements, actuator orders, and alarm situations.
The Simulator tool has many features that contribute to the fuel cell training task. These features are: (1) users can train online, anytime and anywhere; (2) a large number of users (as many as necessary) can be informed at once; (3) any training center, even without hydrogen-specific physical facilities, can implement a training program on fuel cell systems; (4) laboratories’ schedules can be freed up as the training can be done outside of laboratories; (5) it allows self-learning; (6) the user can learn step-by-step; origin failures are explained and s/he is advised how to correct them; (7) it allows a deeper understanding of actual fuel cell systems’ operation; (8) users practice with an actual fuel cell system, so will see that this system has practical application in their professional future; (9) any user anywhere in the world can download the software; there is no financial restriction on our developed simulator, so it can contribute to the spread of knowledge and interest in fuel cell systems; and (10) the developed simulator can work at different levels of complexity, so it can be useful for a wide range of users including students, teachers, technicians, and/or beginning researchers.
In both cases (SCADA and Simulator modes), saving data is possible too, so users can handle these data for later analysis, study, mining, etc.
Finally, the SCADA & Simulator source code developed under LabView® is at the user’s disposal and they should feel free to contact the corresponding author. The authors will welcome both comments and critiques related to the software tools with the aim of improving it. When the SCADA & Simulator is used, the authors would appreciate it if this paper is cited.
Acknowledgments
This work has been founded by Spanish Government Grants through the project DPI2013-43870-R.
Conflicts of Interest
The authors declare no conflict of interest.
References
- Barrett, S. CISTEM sees modular HT-PEM fuel cell tech for smarter energy. Fuel Cells Bull. 2013, 9, 7. [Google Scholar]
- Andújar, J.M.; Segura, F.; Vasallo, M.J. A Suitable Model Plant for Control of the Set Fuel Cell-DC/DC Converter. Renew. Energy 2008, 33, 813–826. [Google Scholar] [CrossRef]
- Vasallo, M.J.; Andújar, J.M.; García, C.; Brey, J.J. A methodology for sizing backup fuel-cell/battery hybrid power systems. IEEE Trans. Ind. Electron. 2010, 57, 1964–1975. [Google Scholar] [CrossRef]
- Palma, L.; Enjeti, P.N. A modular fuel cell, modular DC–DC converter concept for high performance and enhanced reliability. IEEE Trans. Power Electron. 2009, 24, 1437–1443. [Google Scholar] [CrossRef]
- Segura, F.; Andújar, J.M. Power management based on sliding control applied to fuel cell systems: A further step towards the hybrid control concept. Appl. Energy 2012, 99, 213–225. [Google Scholar] [CrossRef]
- Hosseinzadeh, E.; Rokni, M.; Advani, S.G.; Prasad, A.K. Performance simulation and analysis of a fuel cell/battery hybrid forklift truck. Int. J. Hydrog. Energy 2013, 38, 4241–4249. [Google Scholar] [CrossRef]
- Segura, F.; Andújar, J.M.; Durán, E. Analog Current Control Techniques for Power Control in PEM Fuel-Cell Hybrid Systems: A Critical Review and a Practical Application. IEEE Trans. Ind. Electron. 2011, 58, 1171–1184. [Google Scholar] [CrossRef]
- Segura, F.; Durán, E.; Andújar, J.M. Design, Building and Testing of a Stand Alone Fuel Cell Hybrid System. J. Power Sources 2009, 193, 276–284. [Google Scholar] [CrossRef]
- Noiying, P.; Hinaje, M.; Thounthong, P.; Raël, S.; Davat, B. Using electrical analogy to describe mass and charge transport in PEM fuel cell. Renew. Energy 2012, 44, 128–140. [Google Scholar] [CrossRef]
- Sarmiento-Carnevali, M.; Serra, M.; Batlle, C. Distributed parameter model simulation tool for PEM fuel cells. Int. J. Hydrog. Energy 2014, 39, 4044–4052. [Google Scholar] [CrossRef] [Green Version]
- Kattke, K.J.; Braun, R.J. Characterization of a novel, highly integrated tubular solid oxide fuel cell system using high-fidelity simulation tools. J. Power Sources 2011, 196, 6347–6355. [Google Scholar] [CrossRef]
- Altergy Freedom Power Systems. Available online: http://www.altergy.com/products/default.asp (accessed on 21 July 2015).
- Cellkraft. Fuel Cell. Available online: http://www.cellkraft.se/downloads/S-Series.html (accessed on 21 July 2015).
- FutureE Fuel Cell Solutions GmbH Jupiter Modules. Available online: http://www.heliocentris.com/industry/power-solutions/fuel-cells.html (accessed on 21 July 2015).
- Microcell MGEN Series. Available online: http://www.microcellcorp.com/dataCenters.html (accessed on 21 July 2015).
- FCgen-1020ACS. Fuel Cell from Ballard Power Systems. Available online: http://www.ballard.com/fuel-cell-products/fcgen-1020ACS.aspx (accessed on 14 April 2015).
- Askarzadeh, A. Parameter estimation of fuel cell polarization curve using BMO algorithm. Int. J. Hydrog. Energy 2013, 38, 15405–15413. [Google Scholar] [CrossRef]
- Hou, Y.; Zhou, B.; Zhou, W.; Shen, C.; He, Y. An investigation of characteristic parameter variations of the polarization curve of a proton exchange membrane fuel cell stack under strengthened road vibrating conditions. Int. J. Hydrog. Energy 2012, 37, 11887–11893. [Google Scholar] [CrossRef]
- Schmittinger, W.; Vahidi, A. A review of the main parameters influencing long-term performance and durability of PEM fuel cells. J. Power Sources 2008, 180, 1–14. [Google Scholar] [CrossRef]
- Kahveci, E.E.; Taymaz, I. Experimental investigation on water and heat management in a PEM fuel cell using response surface methodology. Int. J. Hydrog. Energy 2014, 39, 10655–10663. [Google Scholar] [CrossRef]
- Li, H.; Zhang, S.; Qian, W.; Yu, Y.; Yuan, X.; Wang, H.; Jiang, M.; Wessel, S.; Cheng, T.T.H. Impacts of operating conditions on the effects of chloride contamination on PEM fuel cell performance and durability. J. Power Sources 2012, 18, 375–382. [Google Scholar] [CrossRef]
- TB-1000 Hydrogen Fuel Cell Power System. Available online: http://www.tropical.gr/products/fuel-cell-power-generators/1kw-hydrogen-fc-power-generator.html (accessed on 14 April 2015).
- Segura, F.; Andújar, J.M. Step by Step Development of a real Fuel Cell System. Design, Implementation, Control and Monitoring. Int. J. Hydrog. Energy 2015, 40, 5496–5508. [Google Scholar] [CrossRef]
- Wu, W.; Ma, T.; Dong, D. A real time test bench for the PEM fuel cell engine. In Proceedings of the 2011 International Conference on Electric Information and Control Engineering (ICEICE), Wuhan, China, 15–17 April 2011; pp. 2920–2923. [CrossRef]
- Ziogou, C.; Papadopoulou, S.; Georgiadis, M.C.; Voutetakis, S. On-line nonlinear model predictive control of a PEM fuel cell system. J. Process Control 2013, 23, 483–492. [Google Scholar] [CrossRef]
- Hua, J.; Lin, X.; Xu, L.; Li, J.; Ouyang, M. Bluetooth wireless monitoring, diagnosis and calibration interface for control system of fuel cell bus in Olympic demonstration. J. Power Sources 2009, 186, 478–484. [Google Scholar] [CrossRef]
- AMREL PLA 5K-120-1200. Available online: http://www.acdcelectronicloads.com/products/PLA/downloads/M470039-01_Operation_Manual_PLA_PLW.pdf (accessed on 14 April 2015).
- Durán, E.; Andújar, J.M.; Segura, F.; Barragán, A.J. A high-flexibility DC load for fuel cell and solar arrays power sources based on DC-DC converters. Appl. Energy 2011, 88, 1690–1702. [Google Scholar] [CrossRef]
© 2015 by the authors; licensee MDPI, Basel, Switzerland. This article is an open access article distributed under the terms and conditions of the Creative Commons Attribution license (http://creativecommons.org/licenses/by/4.0/).
Share and Cite
MDPI and ACS Style
Segura, F.; Andújar, J.M. Modular PEM Fuel Cell SCADA & Simulator System. Resources 2015, 4, 692-712. https://doi.org/10.3390/resources4030692
AMA Style
Segura F, Andújar JM. Modular PEM Fuel Cell SCADA & Simulator System. Resources. 2015; 4(3):692-712. https://doi.org/10.3390/resources4030692
Chicago/Turabian StyleSegura, Francisca, and José Manuel Andújar. 2015. "Modular PEM Fuel Cell SCADA & Simulator System" Resources 4, no. 3: 692-712. https://doi.org/10.3390/resources4030692