Article

Toward a Framework for Resource Efficiency Evaluation in Industry: Recommendations for Research and Innovation Projects

1
Department of Sustainable Organic Chemistry and Technology (EnVOC), Faculty of Bioscience Engineering, Ghent University—Campus Coupure, Coupure Links 653, B-9000 Ghent, Belgium
2
European Commission—Joint Research Centre, Institute for Environment and Sustainability, Via E. Fermi 2749, 21027 Ispra, Italy
3
Department of Pharmaceutical Technology, Institute of Pharmacy, Friedrich Schiller University Jena, Lessingstr. 8, 07743 Jena, Germany
4
Laboratory of Industrial Water and Ecotechnology (LIWET), Department of Industrial Biological Sciences, Faculty of Bioscience Engineering, Ghent University—Campus Kortrijk, Graaf Karel de Goedelaan 5, 8500 Kortrijk, Belgium
*
Author to whom correspondence should be addressed.
Resources 2017, 6(1), 5; https://doi.org/10.3390/resources6010005
Submission received: 24 October 2016 / Revised: 10 January 2017 / Accepted: 11 January 2017 / Published: 18 January 2017

Abstract

:
The world is facing a tremendous resource supply challenge. One strategy of regions and nations to address this issue is to encourage research and innovation through funding programs. Most of the time, these programs require that research and innovation projects quantify potential increases in resource efficiency achieved by the projects. However, no consensus exists on how to calculate resource efficiency; therefore, a wide range of approaches is followed. As a result, resource efficiency results are not comparable between projects, and because no rules or guidelines exist to help project developers, the approach followed is not always appropriate. This paper aims to discuss the existing approaches and methods used to evaluate resource efficiency. In this context, resource efficiency is defined as the ratio between the benefits obtained from resources and the impact or amount of resources used. The most challenging step is the determination of this ratio’s denominator because a wide range of methods to quantify resource consumption exist and are being used. They can be classified as gate-to-gate or life cycle based methods and can be subdivided into accounting methods and impact assessment methods. Each method considers different aspects of resources; thus, no single method aims to answer the same research questions. Therefore, project developers must make a well informed choice about which method to use. This paper provides recommendations to support this choice, as well as the overall evaluation and the valorization of the resource efficiency ratio in the framework of research and innovation programs.

Graphical Abstract

1. Introduction

Today, many parts of the world face a tremendous challenge related to the supply and efficient use of resources. While the worldwide population is growing, industry faces a globalized, competitive and fluctuating market, which makes it difficult to predict market prices and the availability of valuable resources such as critical raw materials (materials important in the economy and with a high risk of supply disruption). To tackle this challenge, several international, regional and national programs have been implemented around the world, including the UNEP’s Resource Efficiency Program [1], the Japanese Plan for establishing a Sound Material-Cycle Society (SMCS), and the Resource Efficient Scotland program, as summarized by Bahn-Walkowiak and Steger [2]. At the European Union (EU) level, the European Commission (EC) launched the resource-efficient Europe Flagship Initiative in 2011 [3]. This initiative was accompanied by the release of the “Roadmap to an Efficient Europe” [4], which presented several milestones to be achieved by 2020 related to the use of resources such as minerals, metals, water, marine resources, land and soils. To measure progress at the macro-level, a system of indicators called the Resource Efficiency Scoreboard was developed, beginning with “Resource Productivity”, which was defined as the ratio between Gross Domestic Product (GDP) and Domestic Material Consumption (DMC). This indicator was further disaggregated into macro- and thematic indicators, including water productivity and energy intensity, among others (see Section 3.2 for definitions) [5].
Research and innovation of new technologies at the micro-level play a key role in increasing the resource efficiency (RE) in existing programs worldwide. In the EU, support for research and innovation is one of the four pillars identified as part of the 2011 “Roadmap to a Resource Efficient Europe” [4] to help transform the economy, while RE was identified as one of the five societal challenges to be addressed by innovation partnerships in the “Innovation Union” strategy [6]. Consequently, the EC introduced several calls in its Horizon 2020 funding program on RE, including one focusing on the Processing Industry via the Public Private Partnership (PPP) Sustainable Process Industry through Resource Efficiency (SPIRE). This PPP focuses on eight process industry sectors. It is designed to contribute to the Roadmap and defines its own RE targets. Primarily, it aims to reduce non-renewable primary raw materials and fossil energy intensities by 30% and 20% by 2030, respectively [7]. The SPIRE goals are translated into objectives in individual innovation projects. Examples of objectives listed in the Horizon 2020 project calls are the “reduction of at least 30% in the material usage” (FoF-2-2014), an increase in “the resource and energy efficiency for the process industries by at least 20%” (SPIRE-3-2014), and “gains in productivity, in material and energy efficiency” (WASTE-1-2014). However, whereas the RE indicators are clearly defined at the macro-level, the measurement of RE of research and innovation actions, often conducted at the process level, is difficult for the broader community to understand, which has led to large variations in interpretations and approaches followed in individual projects. This confusion is a major bottleneck to know and benchmark how projects can effectively contribute to RE. Project evaluation is a key step to help public authorities and PPPs to better evaluate and define resource efficiency targets, and outline a related strategic agenda. A proper evaluation of project outcomes would help orientating the focus of future calls towards the most resource efficient fields of research.
Certain ongoing initiatives have proposed a method to measure RE at the process level. One example is the ESSENZ method (Integrated method to assess/measure resource efficiency), which combines a set of 21 indicators divided into three main dimensions to consider a broad range of aspects related to resource use: availability (physical availability, based on the Abiotic Depletion Potential (ADP) indicator, and socio-economic availability, based on 11 indicators), social acceptance and environmental impacts [8]. Another project, the TOP-REF project, proposes a set of indicators divided into headline indicators (material efficiency, direct primary energy consumption, gross and net water use, and an exergy-based indicator) and complementary indicators (12 emission-oriented environmental impacts indicators) [9]. Even though each initiative thrives for objectivity and universality, they all follow their own approach, which may not always be adapted to the innovation project in question. Therefore, project developers still make their own methodological choices to evaluate RE. Rather than a new set of indicators, a framework to help project developers make their own choices and thus harmonize the way these choices are made when evaluating RE in research and innovation projects is needed.
One paper will not completely solve this problem as a broader consensus within the political, scientific and industrial communities is required [10]. However, with the increasing number of initiatives aiming to improve the resource efficiency of industrial processes (see the recent Special Volume “Improved resource efficiency and cascading utilisation of renewable materials” of the Journal of Cleaner Production, Geldermann, et al. [11]), there is an urgent need for project developers to have a better understanding of how to evaluate the resource efficiency of their project. Therefore, this paper aims to provide a basis for discussion by elaborating on the existing concepts and guidelines for the evaluation of RE in research and innovation projects in industry such as those in the EU context. First, resources and RE are defined, and the different choices to be made when calculating RE are presented. Then, the authors present points for consideration related to innovation projects and give initial recommendations to improve and value RE calculations in the context of PPPs, such as SPIRE, the Horizon 2020 funding program and other innovation programs worldwide.

2. Methodological Approach

The first part of the paper aims to present the existing understandings of “resource efficiency” concepts and the approaches available in the scientific literature. This section is based on a review of the scientific literature on resource consumption and management and a state of the art of resource accounting and impact assessment methods in the field of sustainability evaluation. The literature review was based on web search tools such as Web of Science and Google Scholar using keywords such as “resource efficiency”, “resource management”, “resource consumption” coupled with “gate-to-gate”, “life cycle assessment” and “process level”. In Section 4, the drawbacks and limitations of these approaches are discussed. The discussion is based on a review of the outcomes of case studies found in literature and aiming to evaluate the resource efficiency of industrial processes as well as discussions held during three workshops. The SPIRE Workshop on Resource Efficiency Monitoring, Assessment and Optimization was organized by A.SPIRE and gathered SPIRE project developers and representatives of the European process industry and of academia. The two other workshops were organized in the framework of the Horizon 2020 project MEASURE (“Metrics for Sustainability Assessment in European Process Industries”) in Kortrijk (Belgium) and in London (UK). During these two workshops, the authors presented the current state of resource efficiency evaluation to representatives of the European process industry and policy makers and the current concepts and understandings were discussed. First recommendations were derived from these discussions and the analysis of the literature. The recommendations were presented during the final workshop of the MEASURE project in Berlin, during which representatives of the European process industry and stakeholders involved in the management of research and innovation projects provided feedback. This feedback was incorporated in this study.
The combination of a literature review of methodological papers and case studies and expert involvement during several workshops allowed summarizing the challenges and potential ways to improve resource efficiency evaluation in research and innovation projects. The role of different stakeholders (e.g., project developers, who are in charge of conducting the research and innovation projects, and stakeholders in charge of writing the calls) could also be suggested.

3. Setting the Framework

3.1. Definition of Resources

In the context of the resource-efficient Europe Flagship initiative, resource consumption is limited to the “environmental” context and thus labour, capital, time, etc. are not considered as resources in the RE evaluation. Within the environmental dimension, a general distinction can be made between resources in the broad sense and the strict sense [12]. The former considers resources as “inputs” into a system and the environment itself as a sink and accounts for its role in absorbing emissions. Resources defined in the strict sense only consider “inputs” entering an anthropogenic system. While the former definition of resources is primarily used in a policy context (macro-level), the second definition is mainly used in industry and engineering, as resource consumption is the starting point for all economic production and consumption activities [10]. Moreover, the impacts of process emissions are covered by other specific policy actions, (e.g., see the EU Directive on industrial emissions [13]), and by separate monitoring processes to evaluate their impact (e.g., see the report on the impact of policy measures on Europe’s air quality [14]). Therefore, the latter viewpoint on resource definition is used as a basis in this paper.
Even when considering this viewpoint, several definitions of resources in the strict sense exist, differing primarily in the number and types of resources considered. For example, SPIRE defines resources as “energy, raw materials and water” [7]. Another definition defines resources as “objects of nature which are extracted by man from nature and taken as useful input to man-controlled processes, mostly economic processes” [15]. Similarly, the OECD defines natural resources as “natural assets (raw materials) occurring in nature that can be used for economic production or consumption”. Because “objects of nature” and “natural assets” are very broad terms and because the process industry also uses waste (i.e., “substances or objects which the holder intends or is required to dispose of” [16]) as a resource, we focus on the SPIRE definition, which allows considering waste energy, raw materials and water as resources. Moreover, water is a key resource in the process industry [17], and this definition explicitly considers it as a resource. Atmospheric resources and elements present in water bodies are also considered as resources in the scientific literature [18]. However, they are abundant in their media and do not necessarily represent a major challenge for the industry today. Land, on the other hand, is generally considered a key natural resource in literature (see for example the classification of natural resources in Klinglmair, et al. [19] and Giljum, et al. [20]) and work is ongoing on how to better account for this resource in sustainability evaluations and especially in LCA (e.g., see Taelman, et al. [21]). However, land is missing in the SPIRE definition. In conclusion, land, energy, primary and secondary raw materials and water are considered relevant resources within the scope of this paper.

3.2. Definition of Resource Efficiency

The resource efficiency platform of the EC defines RE as “using the Earth’s limited resources in a sustainable manner while minimizing impacts on the environment” [22]. This definition does not reflect a concrete formula but does contain two essential ingredients: the use of resources and their impact. When focusing on the calculation procedure, efficiency is defined as the ratio between the benefits obtained from a process or system, i.e., all the indirect benefits to mankind obtained out of resources or their derived products, and the “efforts” put into this process or system:
Resource   efficiency   ( RE )   =   Benefits   from   resources ( Impact   from )   Resources   used
As an example, the aforementioned “Resource Productivity” is defined by the EC as an RE indicator at the EU level. In this indicator, the benefits from resource use are expressed in monetary terms (GDP). However, the benefits from resource use can also be expressed in terms of the function provided by the product or the quantity of product produced (e.g., health benefits of one medical treatment [23] and of one nutritional value [24]). Often confused with this, but actually the inverse of RE is resource intensity:
Resource   intensity   =   ( Impact   from )   Resources   used Benefits   from   resources
The fact that RE and any (production) efficiency in general are ratios can be easily agreed upon by the policy, industry and scientific communities.

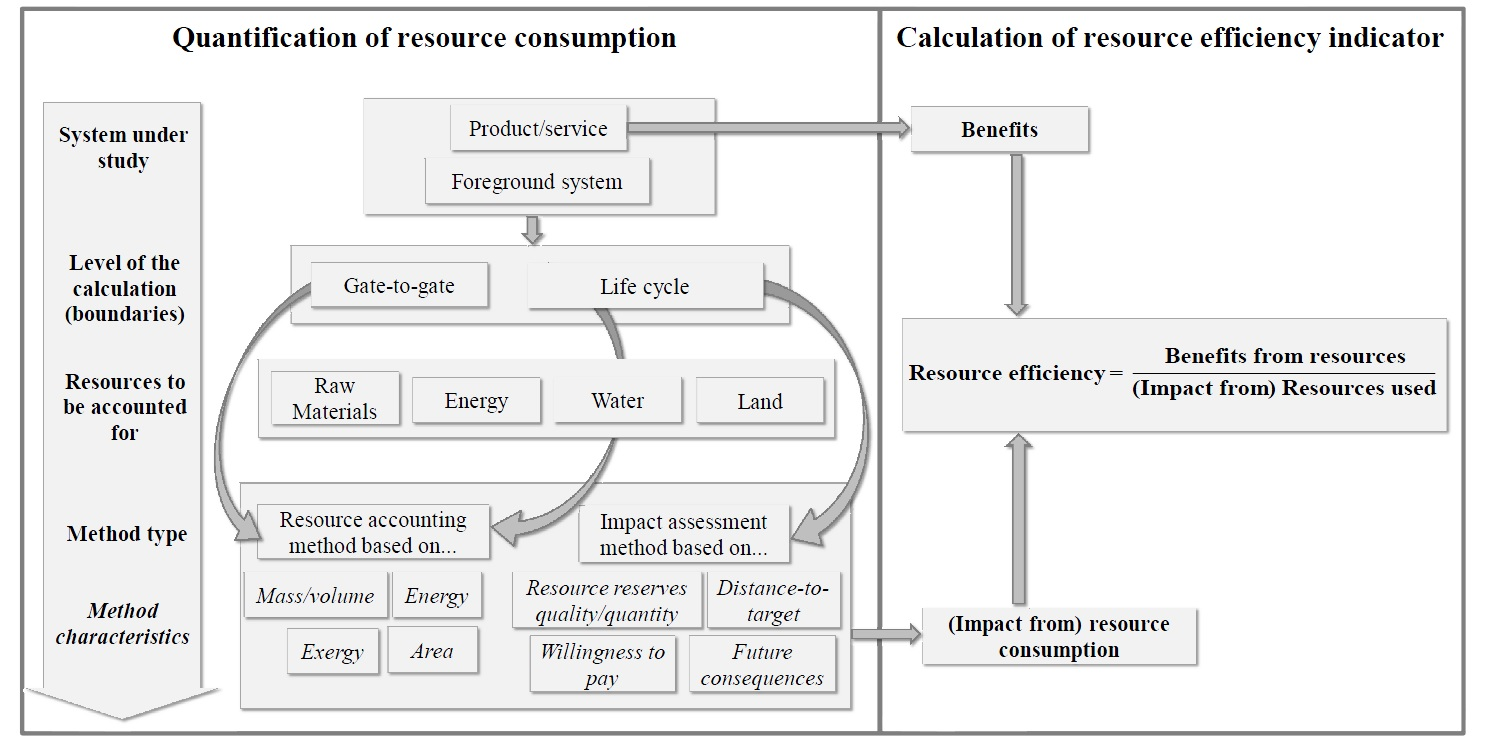
3.3. Goal and Scope of the Calculation

RE calculations also depend on the type of system under study. RE can be calculated at different levels, from a single process unit to a production plant, an industrial sector or a country/region. This system is called the foreground system. It is an entity within the entire industrial production system and is often “controlled” by the persons in charge of the study. It consumes both resources directly extracted from the natural environment and processed natural resources, and it delivers products and services to end users [16] (Figure 1).
At the different levels of analysis, one can choose to focus on the foreground system itself, thus only considering the resources directly entering and leaving the system in the denominator, without taking the resources used in the upstream and downstream steps into account. This is the case with the EC indicator “Resource Productivity”, which only considers inputs of materials entering the EU but does not consider upstream or downstream resource inputs in the denominator. Such analyses are often called “gate-to-gate” analyses (the term “gate-to-gate” is often used in the context of LCA: gate-to-gate analyses are conducted to build life cycle inventories found in databases such as ecoinvent; however, they themselves do not follow a life cycle approach). Another option calculates the denominator at the industrial production system level by following a life cycle perspective. In such analyses, all direct and indirect resources consumed upstream and downstream along with, in some cases, the resource consumption avoided by the delivery of services or products to the market are considered. Depending of the chosen scope and level of analysis, different databases can be used to quantify/obtain the consumed resources. These databases include input-output tables at the country or sector level (macro level) (e.g., Exiobase [25]; the World Input-Output database [26]), and life cycle assessment (LCA) databases at the product or process level (micro-level) such as ecoinvent [27], ELCD [28] or Gabi [29]. Such analyses can be called “life cycle-based” (LC-based) analyses and encompass the so-called cradle-to-gate (from resource extraction to production) and cradle-to-grave (from resource extraction to disposal) analyses.
Gate-to-gate and LC-based analyses do not consider resources in the same way. In a gate-to-gate analysis, processed natural resources, direct natural resources and waste-as-resources, are considered equally:
Resource   efficiency   ( gate-to-gate  base )   = Benefits   from   resources Processed   natural   resources   +   Direct   natural   resources   +  Waste-as-resources
This means that their use is considered in the foreground system only and that resource consumption that occurs elsewhere is not included. Gate-to-gate analysis methods account for consumed resources but typically do not characterize the impact of resource consumption.
When calculating life cycle-based RE, waste as a resource used as an input in a process is generally not accounted for and is seen as gratuitous (approach also called the “zero burden assumption”; Ekvall, et al. [30]). Waste is indirectly accounted for by a decrease in natural resource consumption, but is not taken into account on its own. The inclusion of waste production in LCA is subject to debate within the LCA community. As waste streams are increasingly seen as resources with economic values, some studies argue that the environmental burdens from waste production should be included in LC-based analyses and some approaches attribute part of the environmental impact of the production of waste to this product as well. For example, Oldfield and Holden [31] recommend to consider the impact of food waste production in food waste LCA studies. Similarly, following the revision of the status of waste by the EU regulation and to improve the way to account for the impact/benefits of treating waste, Chen, et al. [32] compares the environmental impact of cement waste treatment with and without allocating the environmental burdens of primary cement production to the waste. The ecoinvent allocation at the point of substitution approach also follows this approach and allocates the environmental burden of primary production to the waste [33]. However, this approach is quite novel and not yet common practice. Thus, RE is calculated in LC-based analyses using the following ratio:
Resource   efficiency   ( life   cycle   base )   = Benefits   from   resources ( Impact   from )   Indirect   and   direct   natural   resources   +   ( ( Impact   from )  Waste-as-resources )
In this case, resources consumed by the foreground and background systems are included. The resources consumed by the foreground system can be directly and/or indirectly extracted from the natural environment. In Equation (4), the indirect natural resources refer to the direct natural resources processed in the background system and then consumed in the foreground system. The brackets in Equation (4) indicate the choices that can be made to account for resources at the life cycle level: account or not for waste-as-resources (see previous paragraph) and consider resources in terms of their quantity or their impact (see Section 3.4).

3.4. Methods Available to Quantify Resources

The numerator of the RE equation, i.e., the benefits obtained from resources, is often easier to quantify than the denominator, as benefits are generally delivered to end users and can often be expressed in tangible units: kg, MJ, money, etc. However, this is not always the case, especially when benefits have a social function. The denominator requires additional calculations and discussion. It has been subject to debate since the mid-nineties [34] and Zhong, et al. [35] showed that the interest of the scientific community for natural resource accounting has grown rapidly during the last fifteen years. Recently, Klinglmair, et al. [19] and Swart, et al. [36] proposed a classification of methods to evaluate resource use in LCA. As a basis for a better understanding of Section 4 and Section 5, this section summarizes the outcome of these two studies on existing methods to evaluate the denominator of the resource efficiency ratio. It can be calculated according to two principles:
  • A physical accounting of resources: the quantity of resources consumed by the studied system is systematically accounted for based on a physical property (mass or volume, energy, exergy or area).
  • An assessment of the impact from resource use: this is done by considering one of the following elements: the amount of resources available in the Earth’s crust, predefined targets, future consequences of resource extraction, or willingness-to-pay (WTP).
Resources can be classified as renewable or non-renewable and as biotic or abiotic (Table 1). Renewable resources are able to regenerate within a human lifetime but can be exhausted if consumed beyond their regeneration capacity [37]. They can be biotic (i.e., “derived from presently living organisms”; e.g., wood) or abiotic (i.e., a “product of past biological or physical/chemical processes”; e.g., wind energy) [36]. On the contrary, non-renewable resources cannot be renewed in the natural environment or can be renewed but not within a human lifetime (e.g., metals or natural gas, respectively). The methods used to quantify resources do not all consider these resource sub-categories in the same way.

3.4.1. Resource Accounting Method

Resource accounting methods can be used in both gate-to-gate and LC-based analyses. Each method accounts for resources based on a specific physical property. Four main properties are considered by existing methods: mass/volume, energy, exergy and area. Because all resources do not have the same properties, resource accounting methods do not necessarily account for the same resources. For example, energy-based methods do not account for water and land, whereas exergy-based methods do account for these resources [38]. Similarly, area-based methods neither account for non-renewable material resources nor for abiotic renewable energy resources. However, some area-based methods, such as the Ecological footprint, account for bio-productive land necessary to absorb CO2 emissions, as well as for the amount of consumed nuclear energy carrier [39]. Moreover, some methods are only able to account for a fraction of a resource “category”. For example, mass accounting methods are not able to account for all energy carriers, typically wind energy and electricity. Current exergy-based methods account for the largest number of resources.

3.4.2. Impact Assessment Methods

Impact assessment methods are only applicable in LC-based analyses (Table 1). Similarly to gate-to-gate analyses, they do not all cover the same resources (e.g., some cover nuclear energy whereas other do not). Following the classifications from Klinglmair, et al. [19] and Swart, et al. [36], most developed methods can be classified as based on the quantity/quality of reserves, distance-to-target, future consequences and willingness-to-pay.
  • Methods based on the quantity/quality of reserves: these methods consider that the quantity and/or quality of resources available in the natural environment is decreasing and thus that the consumption of resources has an impact on resource availability. Some methods such as the Ore Requirement Indicator [55] or the Ore Grade Decrease methods [56] consider the decrease of ore grade as an indicator of resource availability in the natural environment, while other methods such as the ADP method [46] put the amount of resources consumed in perspective with the reserves remaining in the natural environment relative to those of a reference species (e.g., antimony in the ADP method). The last approach is most common in the literature because most associated methods were developed prior to other approaches and are available in most LCA software tools. Methods based on the quantity/quality of reserves are only able to account for non-renewable resources and are heavily discussed by the scientific community and the industry sector [57].
  • Methods based on distance-to-target: these methods compare the quantity of resources consumed to previously defined targets. The most used distance-to-target LCA method is the Ecological Scarcity method [52], which puts the quantity of consumed resources in perspective with a critical flow of resources based on political targets or international policy.
  • Methods based on willingness-to-pay: these methods estimate the amount of money people are ready to invest to restore damages caused to natural resources. The main LCA method that follows this approach in its weighting step is the EPS 2000 method [53].
  • Methods based on future consequences: these methods consider the impact of current resource consumption on future parameters as a result of a decrease in the quality of ore in the natural environment. The most used parameters are the surplus energy (e.g., Impact 2002+ [48]) or surplus costs (e.g., ReCiPe Endpoint [41]; further developed by Vieira, et al. [58]) necessary to extract the same amount of resources in the future as today.

4. Points to Consider When Determining the Resource Efficiency Ratio’s Numerator and Denominator

In the previous section, we described and clarified the possible ways to calculate RE and the choices to be made by project developers to calculate this ratio. In the next section, some typical bottlenecks and drawbacks related to specific choices made during the evaluation of RE of innovation projects in industry are discussed.

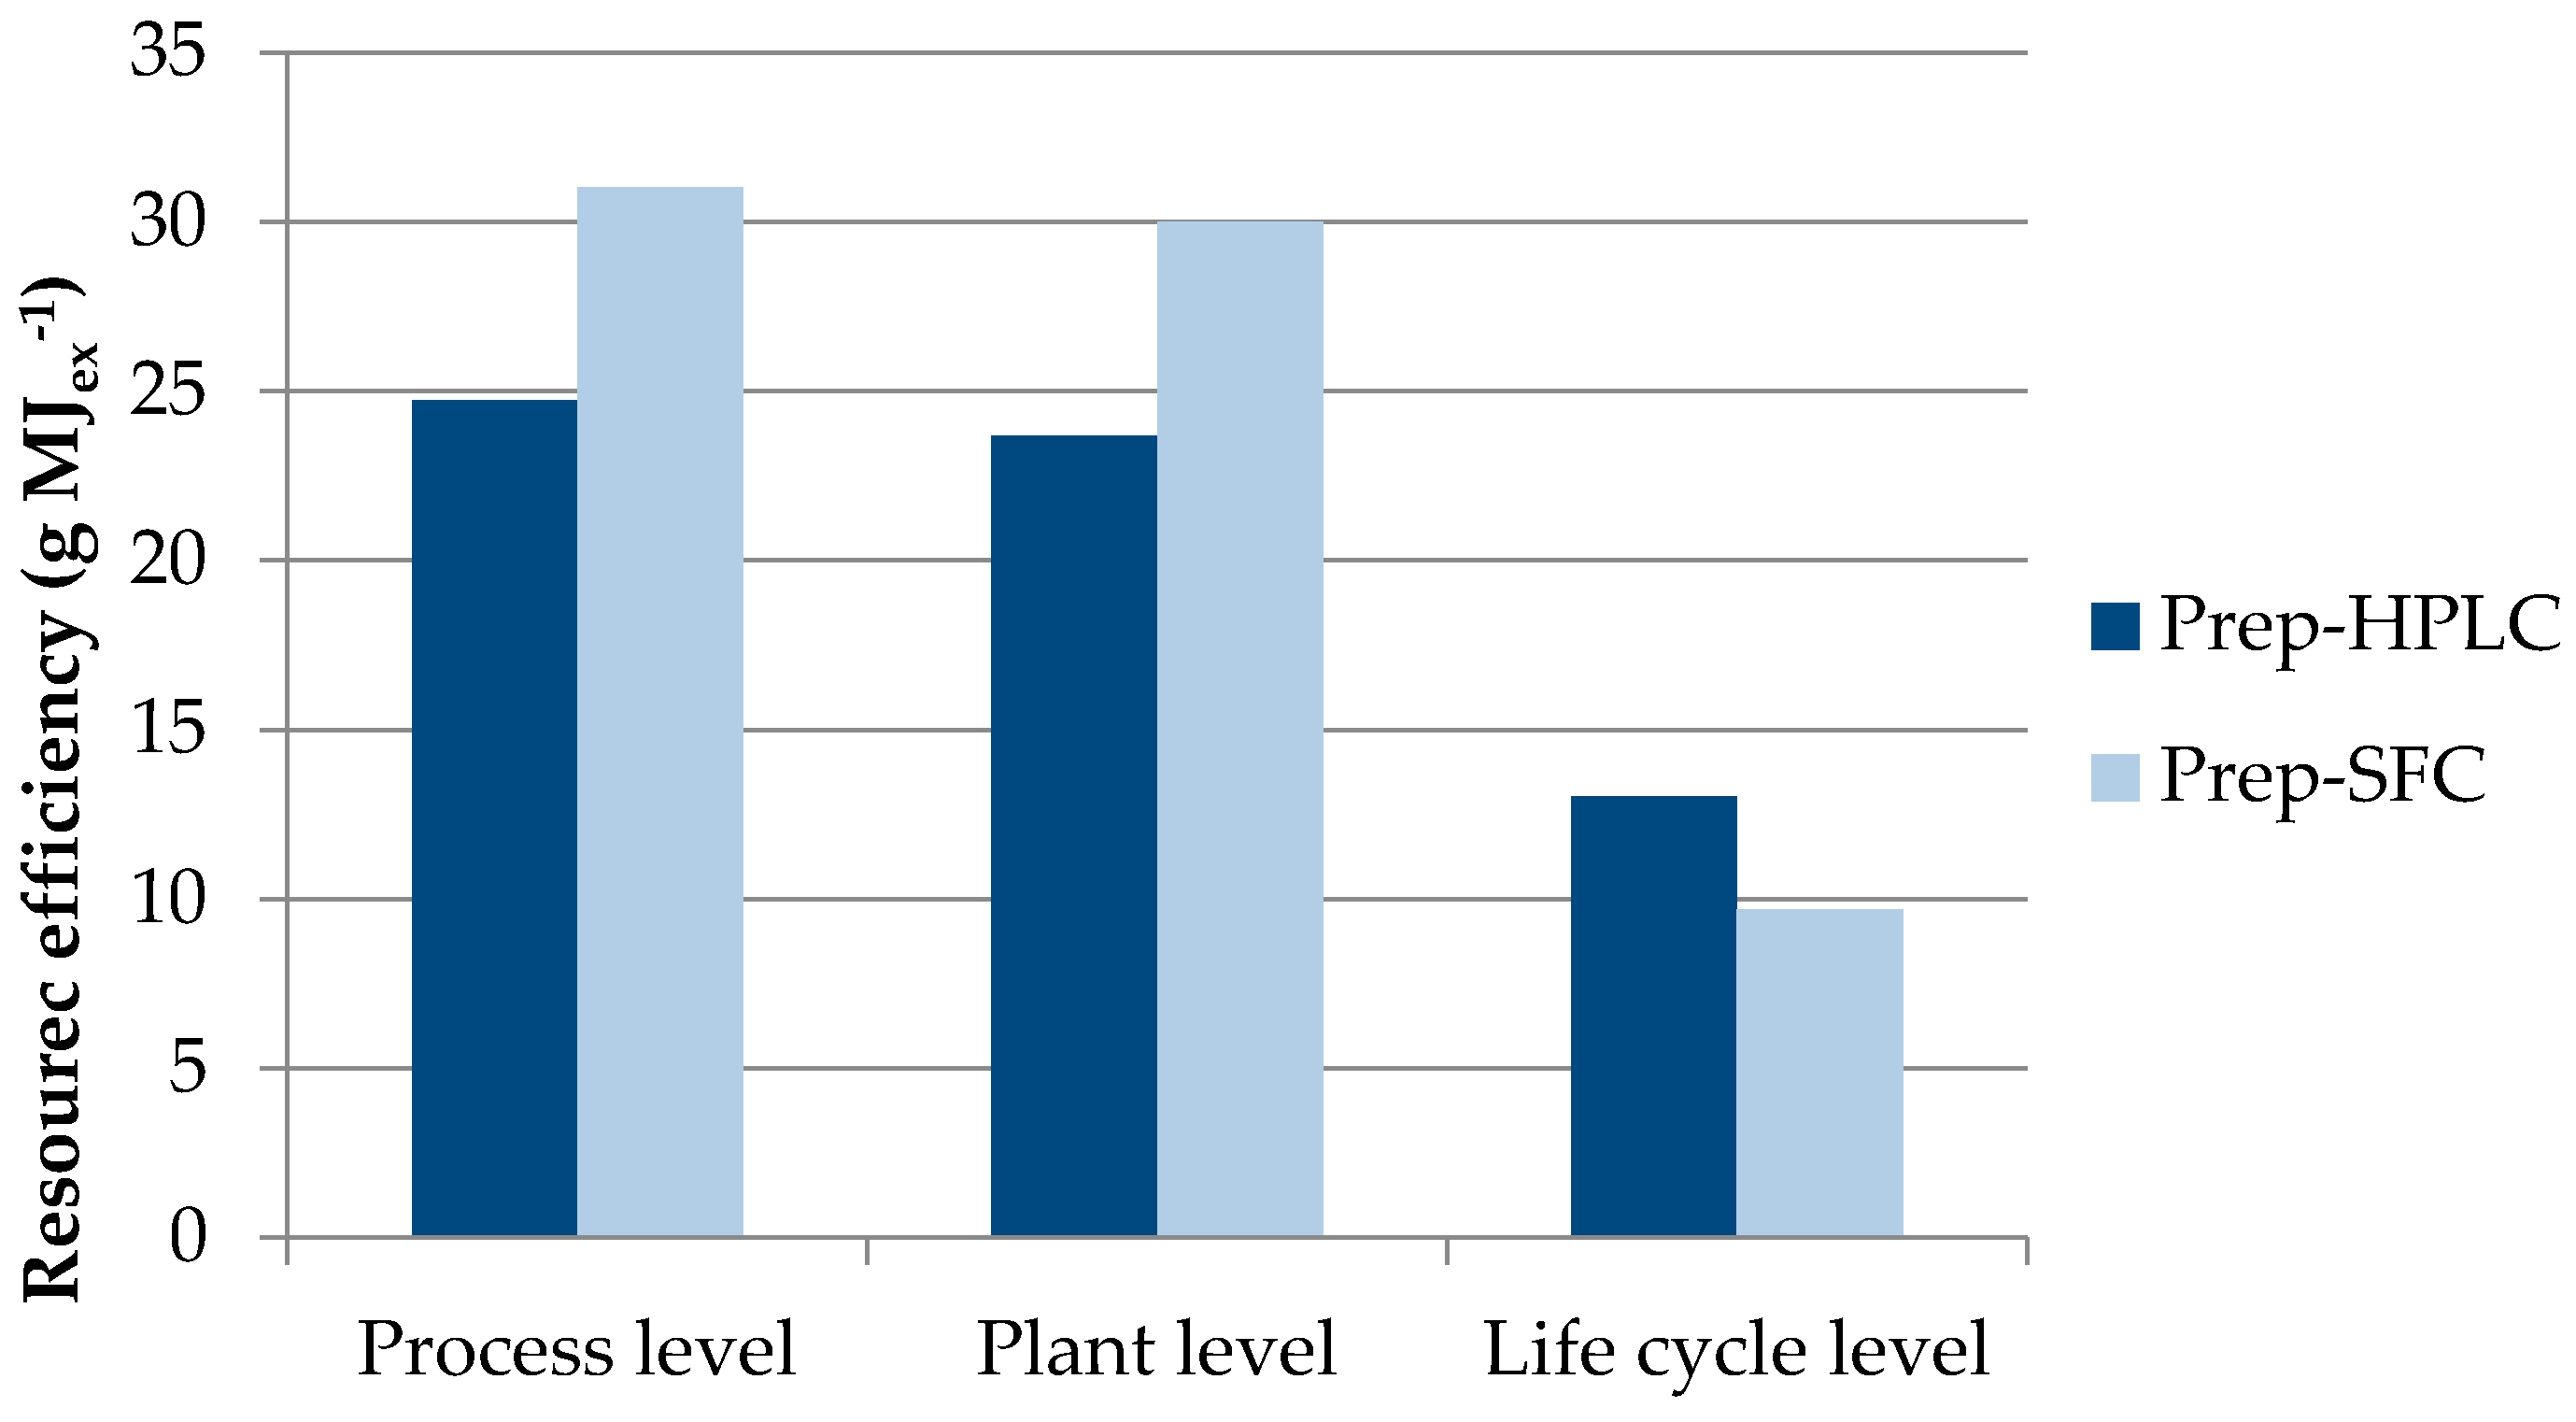
4.1. Gate-to-Gate vs. Life Cycle Analysis

As aforementioned, a gate-to-gate analysis provides information on the conversion efficiency of a process, but is not able to identify the displacement of resource consumption within the larger industrial production system. This can be a particular issue in the analysis of bio-feedstock processing, as biomass production often contributes to the upstream consumption of high amounts of natural resources such as fossil fuels, land and water [59] and the replacement of fossil-based material by bio-based material can introduce a competitive use of resources already consumed by other sectors (e.g., agriculture and energy) [11]. Even if increasing RE at the gate-to-gate level will most probably induce the same effect at the life cycle level, there is no guarantee that RE can be improved without an increase in resource consumption upstream and downstream. Moreover, when comparing one process or plant with a benchmark system, it may have a higher RE at the gate-to-gate level but a lower efficiency at the life cycle level (see De Soete, et al. [60] and the example in Section 4.1.1). Therefore, because gate-to-gate analyses have the advantage of being less time and data intensive (and thus also less costly), project developers could use such approach as a screening tool prior to further analysis or during the design of innovations. Gate-to-gate material- and energy-based indicators are particularly relevant for resource recovery technologies or nutrients extraction processes from raw materials. For example, the carbon conversion efficiency applied to one gasification process [61] and the phosphorus utilization efficiency calculated for the production of phosphorus-based chemicals [62] have proven to be valuable indicators to identify losses of resources along the process chain, and to compare the strengths and weaknesses of process alternatives. Nevertheless, the completeness of an analysis based on life cycle thinking to evaluate and compare RE should also be pursued.
Another difference between these approaches is that the methods applied in gate-to-gate analyses account for waste as a resource but do not evaluate the impacts and benefits of delivering secondary products to the economy. In contrast, methods applied in LC-based analyses do not generally account for waste as a resource, but they are able to consider the impacts and benefits of delivering secondary products to the economy when the system expansion approach is followed.

4.1.1. Resource efficiency of two chiral separation techniques

Van der Vorst, et al. [63] compared the resource consumption of two chiral separation techniques in the field of fine chemicals and the pharmaceutical industry: the preparative supercritical fluid chromatography (Prep-SFC) and the preparative high performance liquid chromatography (Prep-HPLC). Resource consumption by these processes was evaluated at three levels: process, plant and life cycle. At the process and plant levels, a gate-to-gate exergy analysis was conducted, while at the life cycle level, the Cumulative Exergy Extracted from the Natural Environment (CEENE) was estimated.
At the process and plant levels, the resource efficiency of prep-HPLC is lower than prep-SFC (20% and 21% lower, respectively) (Figure 2). However, at the life cycle level, prep-HPLC becomes more favourable and its resource efficiency becomes 34% higher than the prep-SFC method. The authors explain this difference primarily by the large amount of energy required to produce supercritical CO2, which is not taken into account at the process or plant levels.

4.2. Accounting vs. Impact Assessment

At the life cycle level, resource accounting and impact assessment methods have both advantages and limitations. One of the main advantages of resource accounting methods in the context of RE is their ability to allow the expression of RE as an unitless value; in many cases, the amount of a product can be expressed in terms of mass/volume, energy or exergy. However, this can be difficult when analysing systems that produce services or when the method chosen is based on area. Moreover, there is greater consensus about the different resource accounting methods than the LCIA methods in the scientific community. A main disadvantage of these methods is that they do not assess the indirect impacts of resource extraction. The main advantage of LCIA methods is their ability to evaluate the impact of resource consumption. However, methods based on future consequences and willingness-to-pay, even if relevant from a business perspective, do not always reflect the quantity of resources consumed and are associated with high uncertainty. Both types of methods allow the aggregation of results from different impact categories into a single score, which leaves project developers the choice to analyse aggregated or disaggregated results.

4.3. Resource Coverage of Life Cycle-Based Methods

Recently, Finnveden, et al. [64] showed that at the life cycle level, choosing different methods to evaluate abiotic resource use leads to different results. One reason is that resource accounting and impact assessment methods do not all cover the same resources. The resource categories covered by the chosen LCIA method should always be listed by project developers in order to avoid the exclusion of sub-categories. Indeed, lowering the consumption of one specific natural resource can induce higher consumption of another one (see example in Section 4.3.1). Therefore, project developers should choose the method that covers the widest number of resource categories to avoid burden shifting.
Even if several methods cover a same resource category, not all methods consider the same set of resources within a given category. For example, some methods include peat within fossil fuels, whereas others do not. This might be an issue when evaluating energy systems in countries such as Finland, where peat represents a significant share of the country’s energy mix. Thus, special attention should be paid to the coverage of all resource categories considered by the chosen LCIA method in order to identify possible trade-offs between resource consumption and avoid the involuntary exclusion of one resource and its associated potential impacts [65].
Considering the broadest number of resources in the denominator also means considering abiotic renewable resources. Including such resources in an RE evaluation will likely decrease the RE of the studied process, although these resources can be considered inexhaustible. Thus, projects in which fossil fuels are replaced by abiotic renewable resources might show lower RE than fossil-based projects if such resources are taken into account [66]. In these cases, results should differentiate between biotic and abiotic renewable resources. Moreover, technologies that consume abiotic renewable resources might require specialty metals and should therefore always be included in the analysis.
Special attention should be paid to the differences in categorization if two different LCIA methods are used to quantify fossil fuels and metals/minerals because some methods may account for resources differently, e.g., uranium as abiotic non-renewable energy (e.g., Impact 2002+ [48]) or as a metal (e.g., ReCiPe Midpoint [41]).
Another important aspect concerns the coverage of metals and minerals by LCIA methods. Metals and minerals provide services to society (e.g., wastewater treatment plants, power grids) and may still be usable when these structures reach the end of their lifetime. This anthropogenic resource stock is currently not covered by LC-based methods. A first attempt was made by the Anthropogenic stock extended Abiotic Depletion Potential (AADP) method, which tries to include this stock in the evaluation of RE [67], but data are still largely unavailable, and the method is not yet fully operational. Another approach has recently been proposed by van Oers and Guinee [68]. The authors propose to consider resource depletion as a dilution problem, i.e., that the issue related to the availability of resources is more related to the dilution of resources in the environment (e.g., via leaking from landfill) than to a transfer of resources from the natural stock to the anthropogenic stock. The work from van Oers and Guinee [68] shows that the issues related to resource availability and the impact from resource use are still under discussion. Part of these discussions is related to the definition of the so-called Areas of Protection.

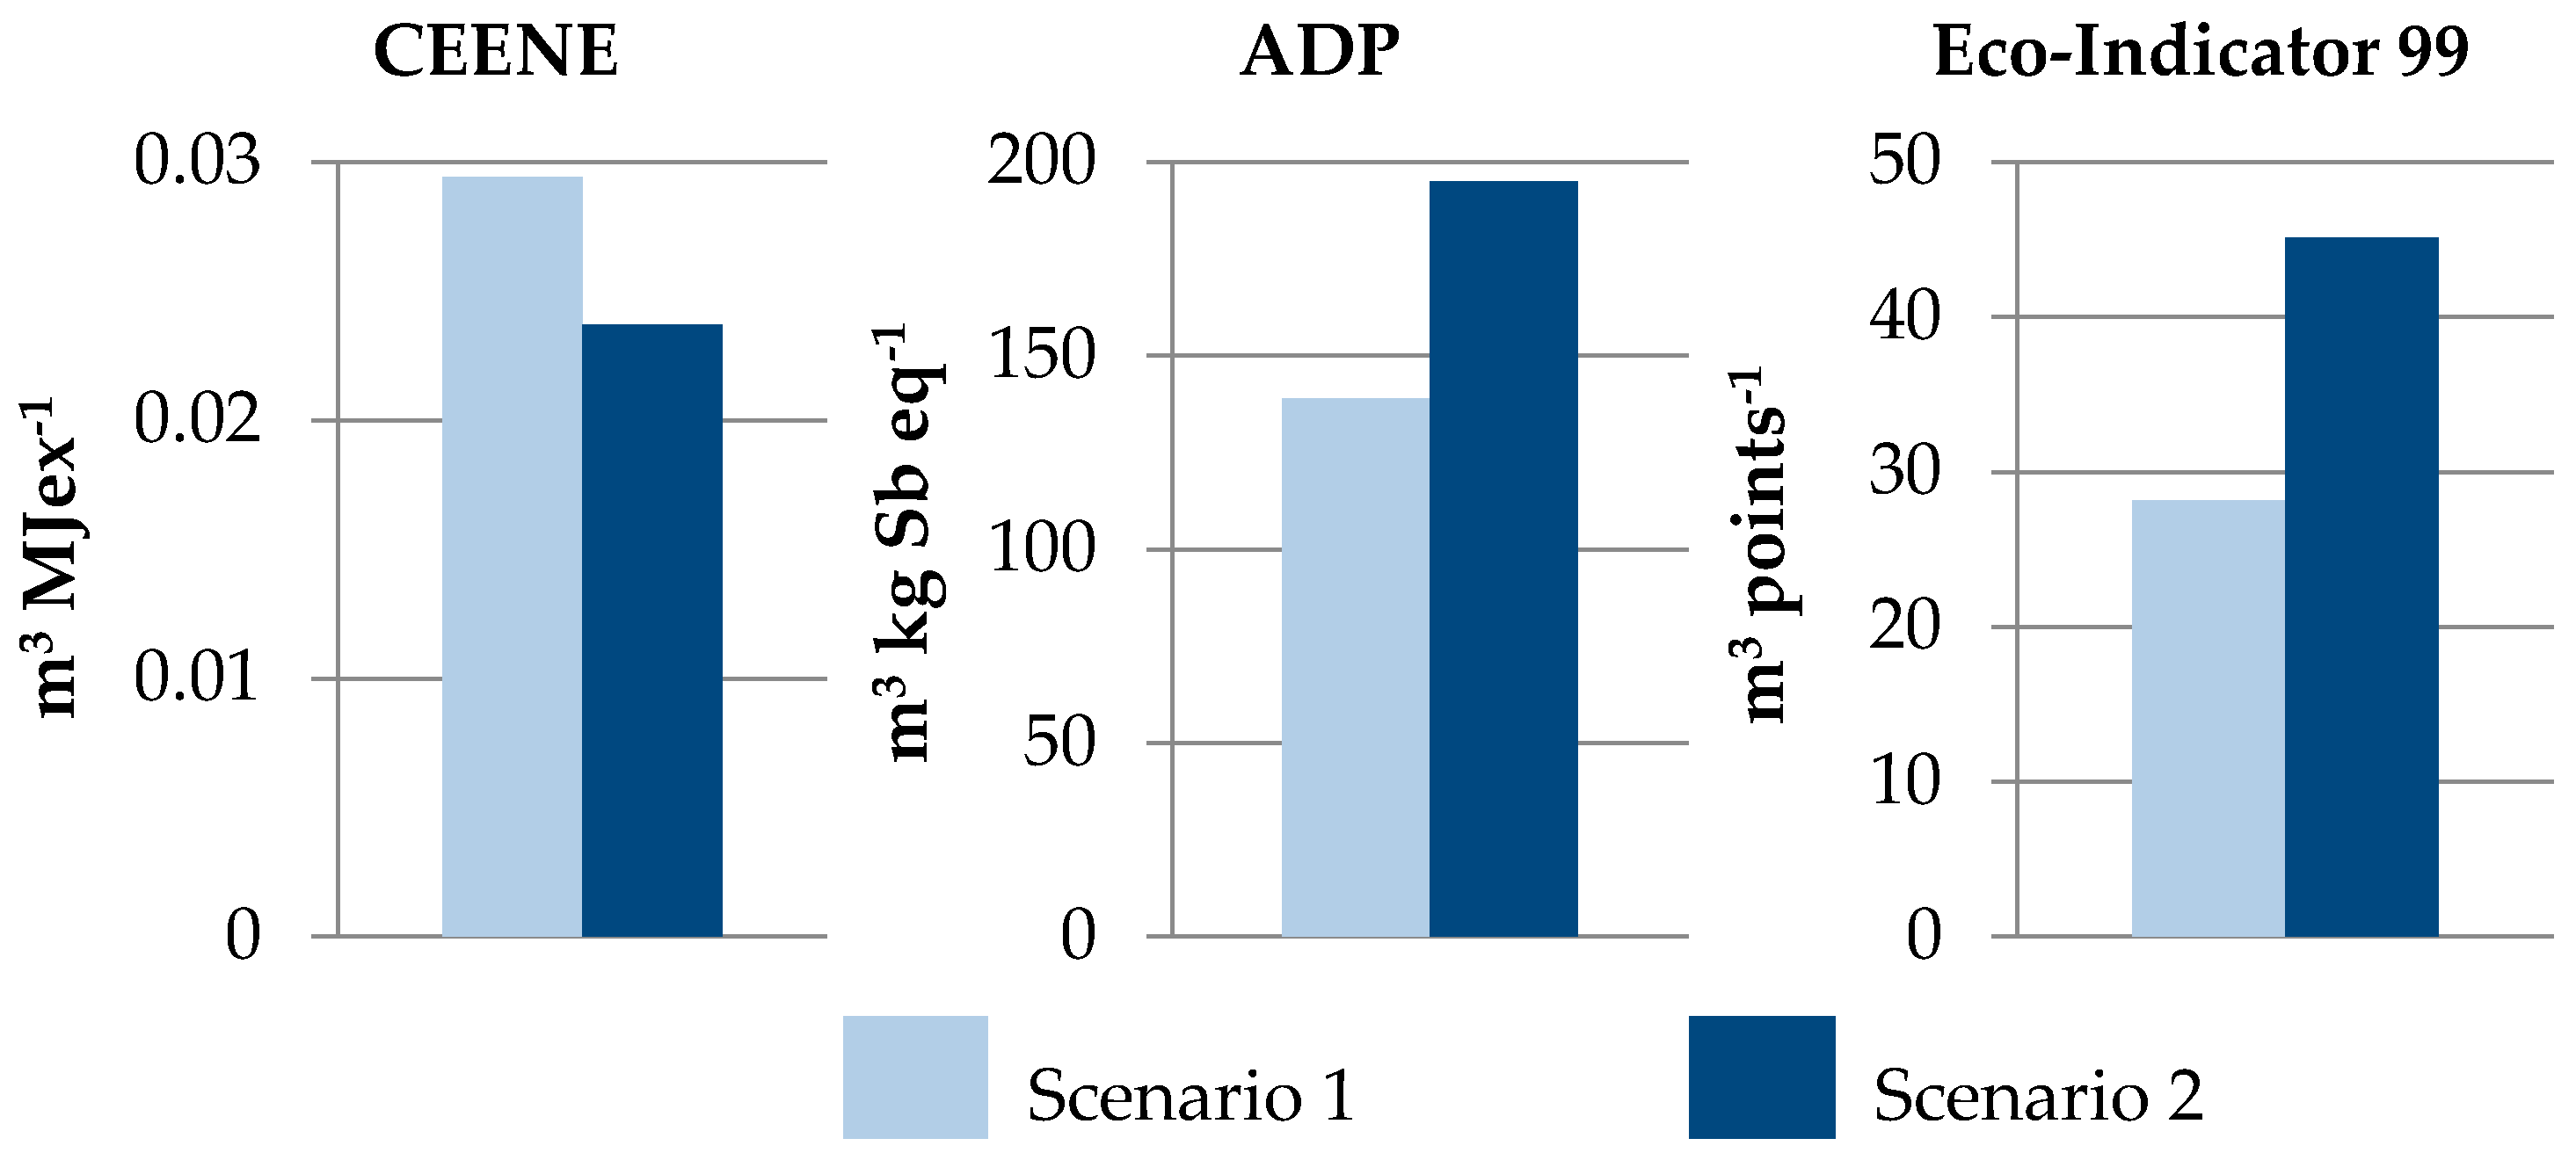
4.3.1. Case Study: Resource Efficiency of Two Valorization Pathways for Algae Grown in Wastewater

In the framework of the Seventh Framework Programme (FP7) project EnAlgae, Sfez, et al. [66] compared the potential environmental burdens of two valorization pathways for algae grown on aquaculture wastewater: valorization as shrimp feed (scenario 1) and valorization as biogas via anaerobic digestion (scenario 2). Sfez, et al. [66] used the CEENE method to calculate the resource footprint of the two scenarios. Based on data available in this paper and its supporting information, the resource efficiency of the two scenarios studied in Sfez, et al. [66] were calculated using two other methods: ADP and Eco-indicator 99 (end-point indicator “Resources”). While the CEENE method accounts for land use, the two other methods do not.
Different results are obtained when using these methods and lead to different conclusions regarding the most favourable valorization pathway for algae (Figure 3). Because valorizing algae into shrimp feed replaces the consumption of wheat [66], it also avoids the use of land associated with wheat production. This benefit cannot be shown by methods that do not consider land as a resource, here the ADP and Eco-indicator 99 methods.

4.4. Entities Impacted by Resource Consumption

In the field of LCA, Areas of Protection (AoPs) are defined as “entities that we want to protect” [69]. Therefore, LCIA methods aim to evaluate the impact of life cycle inventories on these entities. The three main AoPs in LCA are “Human Health”, “Ecosystem Quality” and “Natural Resources” [70]. Several LCA methods consider the impact of resources on an AoP other than “Natural Resources”. For example, some LCA methods account for land use but consider its impact on biodiversity, which is considered in the AoP “Ecosystem Quality” today. Discussions are ongoing about whether the AoP “Natural Resource” should be maintained as such or rethought. This new debate can be illustrated by the recently published work from Dewulf, et al. [70] who proposes to divide the AoP “Natural Resource” into five safeguard subjects including environmental, economic and social aspects, and the presentations of the 55th Discussion Forum on LCA in Zürich, during which the definition of the AoP “Natural Resource” was addressed as a key question [65]. Indeed, there is no agreement in the scientific community on the nature of the impact caused by resource consumption: while the AoP “Natural Resources” has been defined in the framework of environmental LCA and thus assumes that natural resource consumption is an environmental issue, the idea that resource consumption also considers other (provisioning) capacity of resources to fulfil humans needs is emerging [70]. The unclear definition of this AoP can partly explain the wide range of approaches followed by LCIA methods concerning the evaluation of resource consumption and the lack of consensus around which method to use. Therefore, a clearer definition of the AoP “Natural Resources” is a key step to improve the consideration of resources in LCA and thus to improve the calculation of RE. In the meantime, project developers should be aware that some methods consider the impact of resource use on AoPs other than Natural Resources and thus reflect different sustainability issues.

4.5. Functionality of the Output Products (Benefits)—How to Account for Recycling?

The functionality of a process’s output is more often discussed within LC-based analyses (when choosing the functional unit) than within gate-to-gate analyses. However, the functionality of output products should be well defined for both types of analyses and can be done by taking into account the quality and the lifetime of the products. Such aspects can be defined based on an analysis of the physical, chemical and mechanical properties of the materials and their resistance to environmental conditions [71]. This is in line with the EU’s Action Plan for the Circular Economy, which aims to more systematically introduce circular economy requirements, e.g., on product durability and quality, among others [72]. Another challenge is the fact that the benefits from resource use can be qualitative. Typical examples of qualitative benefits from innovative products are related to human health and human welfare (e.g., “improvement of the patient’s health”, “increase in leisure or resting time”). A way to overcome this challenge is to assign a numerical value to these benefits. For example, the effect of an innovative medical treatment on the health of the patients can be semi-quantified by putting the answers of questionnaires evaluating the health state of the patients in perspective with the ranked preferences of patients regarding different health states. These preferences are evaluated using semi-quantitative methods such as the paired-comparison and the category rating methods, which allow to rate and rank the different health states of patients and/or healthy individuals [23]. Such an approach can be time consuming as it is usually based on surveys which require a panel large enough to ensure statistical representativeness. Another approach is to express the benefits of a product on human health in terms of Disability Adjusted Life Years (DALYs). This approach has been applied by Stylianou, et al. [24], who evaluated the environmental burdens but also the health effect of milk with regard to its nutritional value. However, the cause-effect chains of innovations on human health are not always known and more work is needed to define them.
Defining functionality is not a straightforward task, especially when evaluating processes using waste as a resource, which aim to contribute to the switch from a linear to a circular economy. On the other hand, waste treatment projects also aim to protect the environment by safely treating waste and therefore have a double function. For example, the benefits obtained from a recycling process can be defined as the recycled product itself, or as the environmental savings achieved from recycling waste. Thus, the quantification of the benefits obtained from waste valorization is complex. The choice of benefits has a significant impact on the results of the calculation and should be communicated to allow for a comparison between processes. Considering the benefits of recycling in LCA is particularly complex and is the subject of a wide range of approaches. The differences between these approaches are typically reflected in the substitution ratio and the stakeholders to which the benefits are allocated. Given the extent to which LCA results depend on these choices, specific attention should be paid to end-of-life modelling. From a project developer’s perspective, a sensitivity analysis of the end-of-life parameters is a key way to strengthen the conclusions of the RE evaluation. In addition to the strictly defined RE ratio, other metrics highlighting the environmental savings associated with waste valorization should be considered. For example, the Recyclability Benefit Rate (RBR), defined by Ardente and Mathieux [73] as the ratio of the potential environmental savings achieved from recycling over the environmental burdens of virgin production followed by disposal better identifies these benefits than does the RE ratio. This indicator was further developed by Huysman, et al. [74] to account for the potential substitution of different materials. From the viewpoint of program developers, it is important to stress this fact within project calls and to provide insights to help select the most suitable approach, e.g., as done by Allacker, et al. [75] in the framework of product policies support.
A portion of the innovation projects funded aim to develop new applications (e.g., materials with new functional properties). Given this, the choice of a benchmark process or product can be challenging, particularly because such a process or product might not yet exist. However, project developers may find existing applications replaced by newly developed processes or products, and several functionalities may need to be considered. In such a case, a “basket” of products or services should be considered. This is also the case for animal feed based on a new feedstock, the composition of which should be detailed to define the functional unit (e.g., to provide certain amounts of fat, fiber, and minerals).

4.6. Criticality in the Evaluation of Resource Efficiency

Today, LC-based methods for evaluating resource availability only consider availability issues resulting from the physical extraction of resources. However, it has been shown that resource availability highly depends on socio-economic parameters such as geopolitical issues, market stability and international regulations [37]. These considerations can only be accounted for in a criticality assessment, which is typically conducted outside of the LCA framework. The criticality of a resource is defined by its importance in the economy and the risk of a resource supply disruption [76]. A criticality assessment can thus be conducted for non-renewable as well as biotic renewable resources. The EC conducted such an assessment for six platinum group metals (PGMs), seventeen rare earth elements (REEs) and three biotic resources [76]. Such information should be considered by project developers when evaluating the RE of process or product design alternatives under development. However, the current state of method development does not yet allow this assessment to be considered in the RE ratio, and criticality indicators can only be considered, in our opinion, as additional indicators. The main drawback of criticality is that it depends significantly on socio-economic parameters, which vary over time and therefore should not be considered as a standalone aspect. Although recent attempts have been made [77,78], a framework made available to a large public to assess criticality at the life cycle level is still lacking.

4.7. Dealing with Data Availability and Representativeness
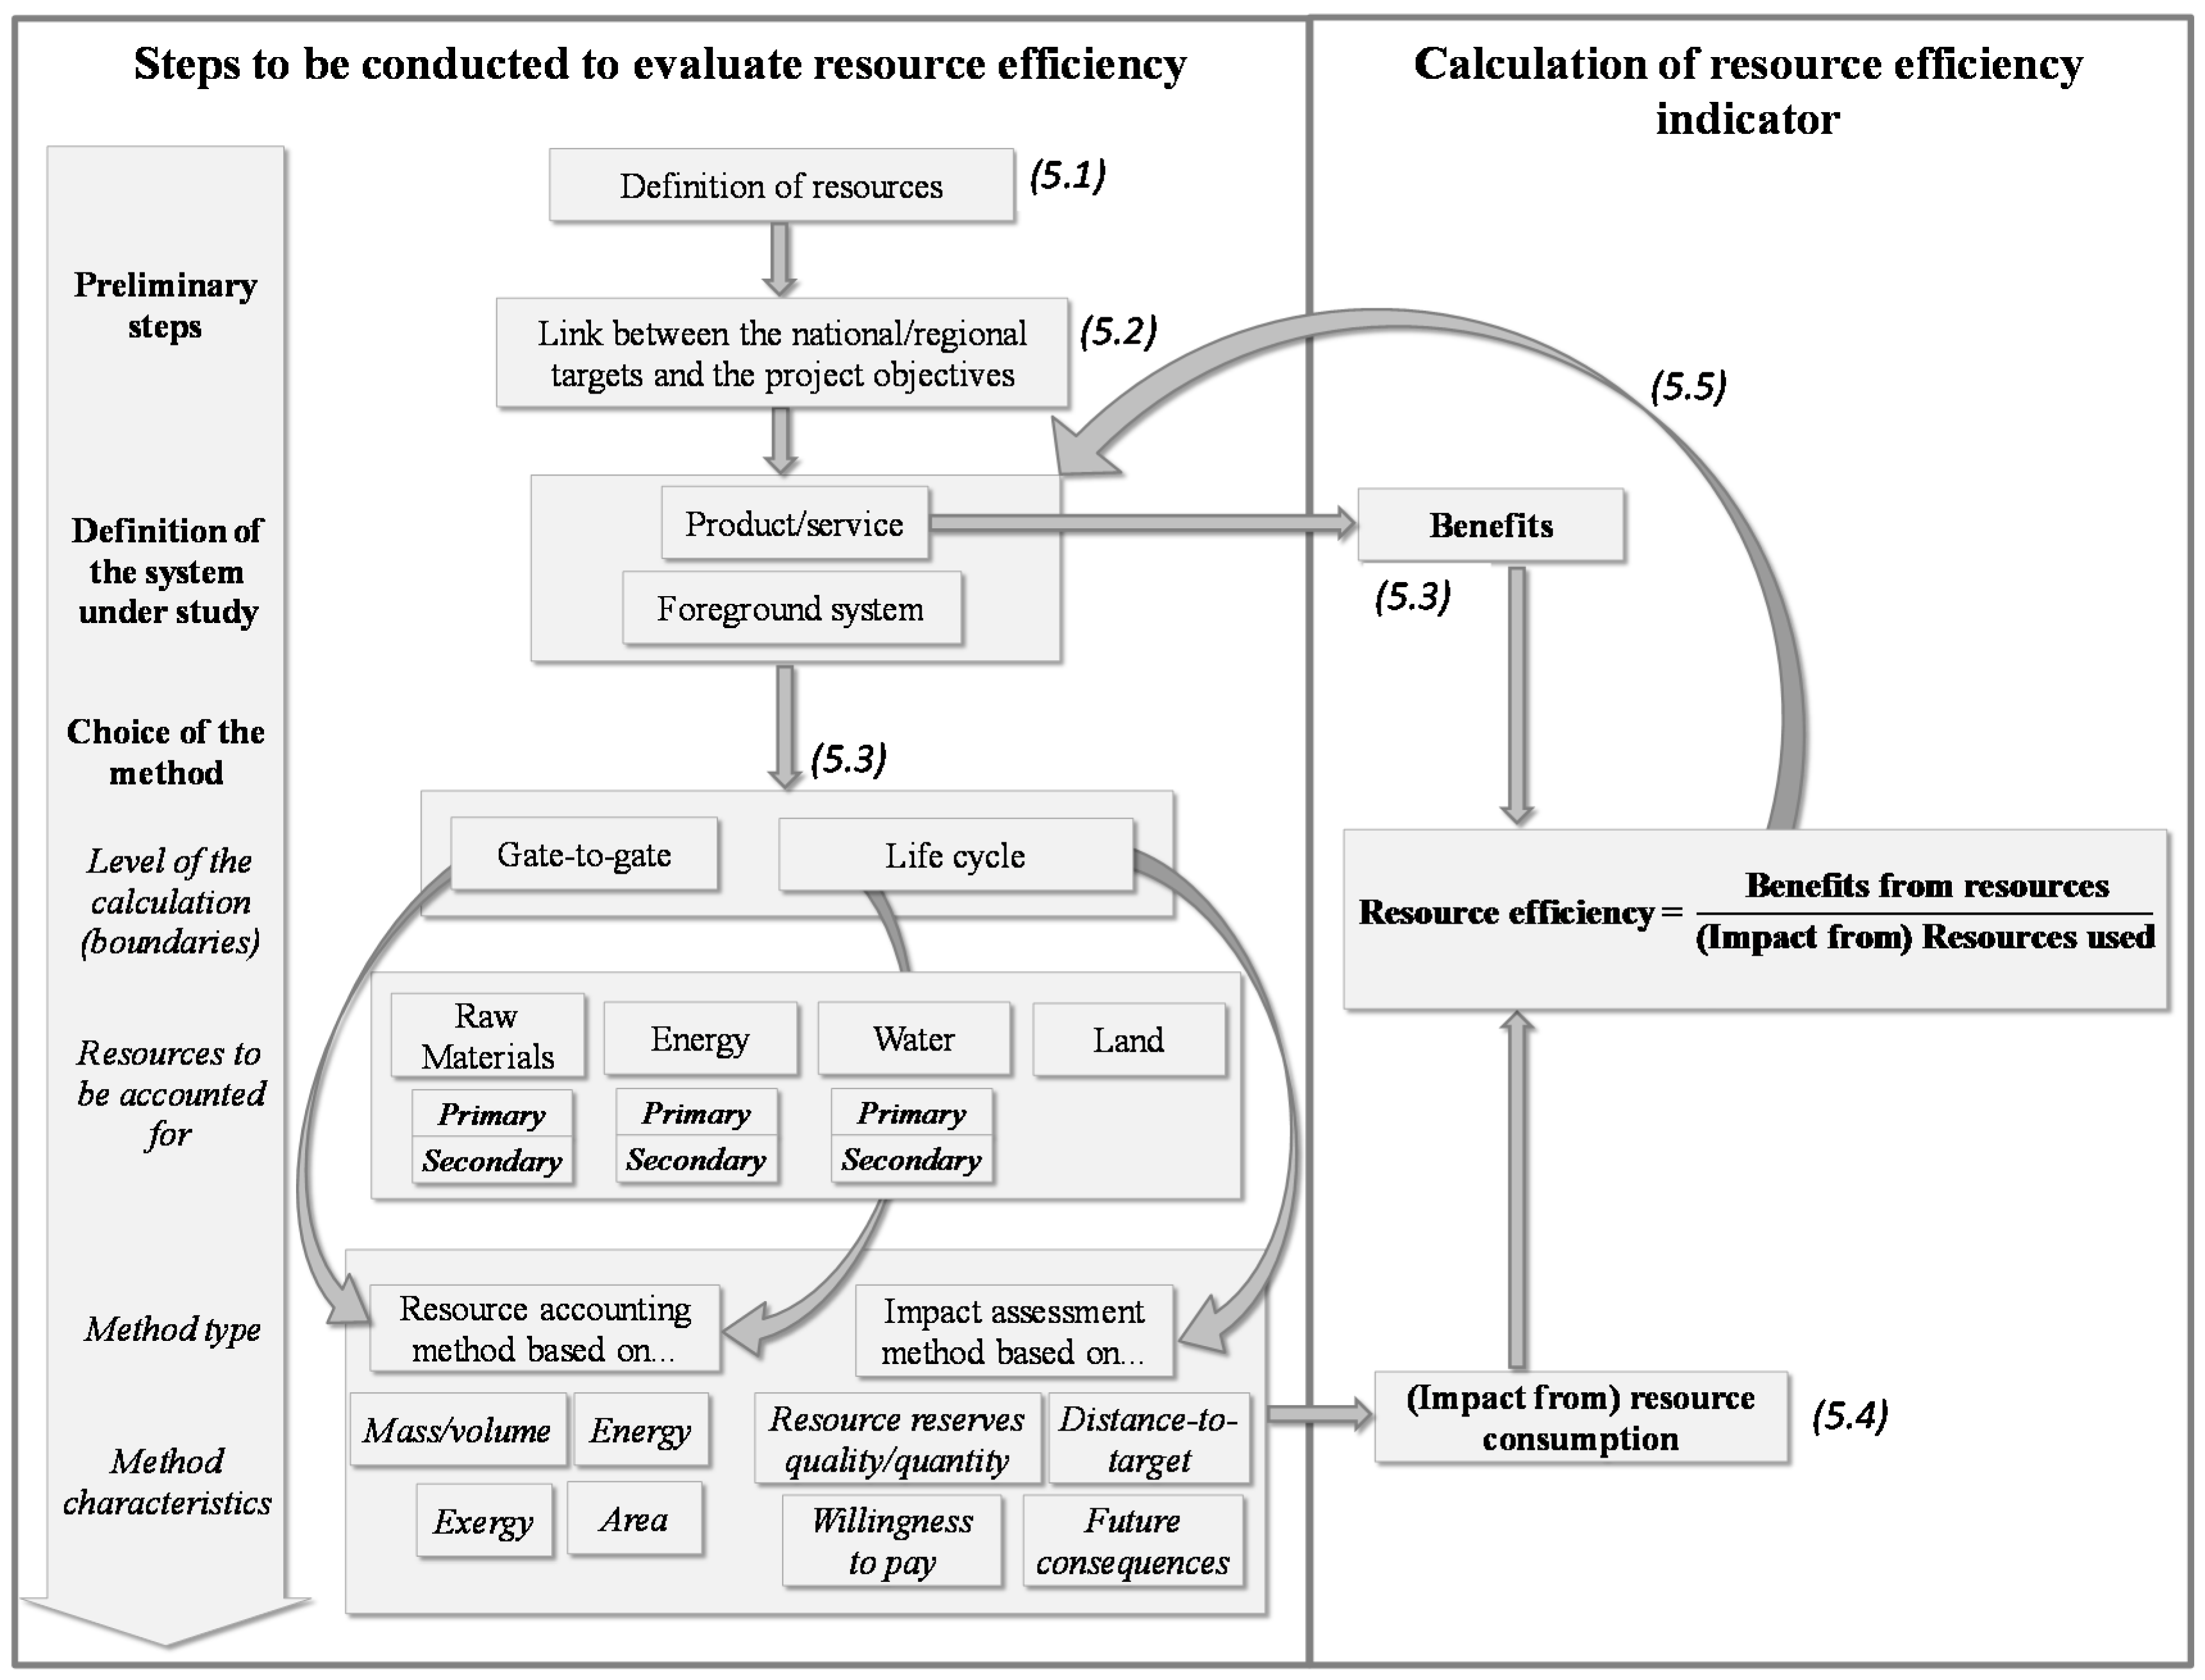
The availability of data at the stage of research and innovation is often a limiting factor to conduct an LCA. For example, chemical processes with a Technology Readiness Level (TRL) between 0 and 3 are most probably at a small lab scale without continuous equipment operating and without sensoring. Primary data gathered at this scale can be those of oversized or non-adapted equipment with process conditions still to be optimized and thus are not representative of the final eventual processes. In those cases, a complete LCA study is difficult to conduct, and simple process efficiency indicators (e.g., atom efficiency of the chemical reaction) up to gate-to-gate indicators might be used. However, a life cycle thinking approach (which does not necessarily implies exact quantification) is still possible, for example by estimating the potential effects of the sourcing of the materials and the energy requirements (e.g., heating of the reaction) on resource efficiency, or quantitatively by already checking the Life Cycle Impact of the utility. For higher TRLs, data on the use phase of the product can still be lacking, e.g., data on the shelf life and consumers’ behaviour. Moreover, when conducting an LCA, the location where the technology is assumed to be implemented can have a large effect on the RE ratio, as some key processes such as the electricity mix and the waste management scheme are spatially dependent. To deal with the different reasons for the lack of data while the research and innovation process is progressing, scenarios analysis should be conducted, for example by considering a worst case (e.g., landfilling) and a best case scenario (e.g., recycling as end-of-life stage). Those scenario analyses provide a better, more holistic understanding of hot-spots of the current process under development and key drivers for improvement. All in all, they can provide valuable decision support.
Often, those studied processes are compared with benchmark products or processes that are themselves already implemented at industrial scale. In those cases, it is even more important to carefully ensure representativeness and comparability of the scale. As highlighted by Shibasaki, et al. [79] and Gavankar, et al. [80], one way to deal with this issue and account for the potential economy of scale is to model an upscaled system. Assumptions on upscaled data need to be made, for example based on experts and manufacturers consultation, process simulation or the review of literature and databases (e.g., see [80,81,82]). Moreover, the future resource efficiency of a process can be estimated based on learning curves, as already done for house appliances [83], to estimate future energy savings when implementing energy-efficient technologies in the US iron and steel industry [84] and to estimate the scaling effect of heat pump and biomass furnace technologies on environmental impacts [85].

5. Paths Forward

The RE of a process is the ratio of the benefits obtained from this process divided by the amount or the impact of the resources consumed. While this concept is well accepted, it is not consistently applied. Furthermore, numerous approaches are followed to calculate the numerator and denominator of this ratio. Other projects have proposed various sets of indicators to evaluate the resource efficiency of a process. However, their flexibility to the specificities of research and innovation projects is limited, e.g., because they are data intensive. Moreover, they can lead to neglect resources that are not considered in the indicators set but are key resources for some technologies (e.g., land for biomass processing). This paper stresses the need to conduct RE evaluation based on an informed choice of the evaluation method from call managers and project developers.
Several recommendations can be drawn to harmonize and improve the approach followed to evaluate the resource efficiency of innovation projects. These recommendations can be implemented either in the project calls or by project developers. Some calls are specific to a sector or to an application. In these cases, most of the recommendations mentioned below can be implemented as requirements in the call itself (e.g., choice of the method and resources considered). Other project calls are more general, and specific RE evaluation requirements may not be as easy to provide. In these cases, the call should require project developers to follow the recommendations given below and to clearly define and justify the choices made in the proposal to evaluate RE within their project.
Figure 4 summarizes the main steps to be followed when evaluating the RE of research and innovation projects. These steps are developed hereafter.

5.1. Toward a More Consistent Vocabulary and Definitions

The vocabulary used to discuss resources in research and innovation program documents is not always consistent and can be confusing for project developers. For example, the lead indicator defined by the EC in the framework of the resource-efficient Europe Flagship Initiative, GDP/DMC, includes both fossil fuels and non-energy carriers; however, programs such as SPIRE define targets for raw materials and energy intensities separately. Similar confusion can be found when comparing policy documents from national or regional programs. Thus, the terms used to set targets or define project goals in research and innovation program documents and their associated calls should be clarified. Definitions and arguments in support of these terms are provided in Section 3.2. Consistent definitions are also important when choosing the method used to quantify targets, as some methods consider fossil fuels to be materials and some separate both resources. We are in favour of shifting fossil fuels from the raw materials category into the energy carriers category, as it would allow for a more detailed analysis of resource consumption and also enhance the consideration of abiotic renewable resources, which cannot be considered in the raw materials category [37].

5.2. Linking Resource Efficiencies at the Micro- and Macro-Levels

Innovation programs should contribute to overall policy goals. However, these projects are generally conducted at the micro-level (process, factory, product). Today, there is no direct link between RE indicators calculated at the micro-level and RE targets such as those defined at the EU level. If targets are set, level and scope at which these targets are valid should be noted. This would allow for more systematic calculations and more readily link these goals to macro-level policies. As mentioned above, this link can be defined in the call itself or by the project developers in project proposals when calls are more general. This information would help evaluating the most promising projects contributing to the increase of the resource efficiency of the country or region. For example, the outcomes of research and innovation projects with a low Technology Readiness Level (TRL) could be compared, the most promising technologies in terms of RE could be identified and defined as the focus of the next calls aiming to implement technologies at higher TRLs.
One key aspect to define the link between resource efficiencies at micro- and macro-levels is the market share of the new product or service. Indeed, a small increase in a process’s RE when that process is associated with large markets can contribute more to an increase in the overall national or regional RE than a large increase in RE in processes associated with niche markets. Different scenarios regarding the substitution of the current product/service by the alternative can be analyzed, as done by Rohn, et al. [86] who evaluated the resource saving potential of several alternative products by extrapolating the resource consumption of products at micro-level to the national level. For technologies with a low TRL, project developers should model an upscaled system to allow a fair comparison between the new and the benchmark technologies.

5.3. Toward a More Informed Choice of the Numerator and Denominator of the Resource Efficiency Ratio

The benefits of resource use (numerator) should be defined based on the function of the output product or service and thus should also account for their lifetime. The definition of these benefits is key to identifying the benchmark product(s) or service(s) to which the studied product/service can be compared (see Section 4.5).
A wide range of methods exists to quantify resource consumption (denominator), and several choices are necessary to select the most appropriate method(s). Based on the discussion above (see Section 4.1 and Section 4.3), we propose the following recommendations as a basis for future RE evaluations in research and innovation projects:
  • To calculate the denominator, an LCA should be performed. If constraints concerning money, time or data availability are too high, a life cycle approach (i.e., not necessarily including quantification) should be followed, at least based on gate-to-gate data. A gate-to-gate analysis is a limited approach but can be very useful in the calculation of intermediary indicators in order to promote continuous process improvements and provide details about the studied process.
  • One or several methods covering all resource categories should be selected. When dealing with abiotic renewable resources, a method that allows the presentation of results without considering these resources should also be considered.
  • Only a gate-to-gate approach is able to consider waste as an input in the denominator. If an LC-based method is used to calculate the RE of a recycling process, the use of metrics other than those defined in the RE ratio here should be considered (e.g., RBR).
  • An ideal assessment of RE and the impact of resource consumption that could be universally used in all research and innovation projects does not yet exist, and further research is needed [11]. Various methods exist and address different aspects of RE, such as specific resource properties or specific issues related to the impact of resource consumption. The limitations of each method should be kept in mind and accounted for as much as possible via a sensitivity analysis on key methodological choices. The challenges related to resource efficiency evaluation for specific process types or sectors could be discussed in each sector, as done by Ardashkin, et al. [87], who reviewed the approaches for RE evaluation followed in the foundry sector and discussed potential ways to improve this evaluation.
These recommendations can be used as a unified basis for RE evaluation. Then, the project developers will have to adapt this evaluation to the specificities of their project. For example, for technologies with low TRLs, a full LCA is difficult to conduct because of low data availability, and gate-to-gate indicators will have to be coupled to a qualitative analysis of the life cycle impact of the product.

5.4. Aggregation vs. a Set of Individual Scores

Most methods used to quantify resource consumption allow project developers to obtain a single result as the denominator of the RE ratio. The benefit of this is that the provision of a single number is easy to communicate. However, single scores do not inform project developers of the amount of each resource consumed or the ability of a project to reach specific targets, such as those set by the SPIRE roadmap for raw materials and energy intensities. Therefore, these resources should be accounted for separately, ideally with the option to aggregate them at a later time. This may require additional work, as some LCA software tools do not provide disaggregated data for certain methods’ characterization factors into different categories. Project targets should specify which resources require an increase in efficiency.

5.5. Toward the Integration of Resource Efficiency Considerations during the Project Lifetime

RE indicators are calculated to evaluate the impact of research and innovation projects. They offer a major opportunity for policy makers to measure progress within innovation programs and can be indirectly used to calculate a return on investment. Currently, there is too much confusion to allow such a systematic approach. Furthermore, these calculations are usually conducted at the end of a given innovation project and are often considered a constraining and subsidiary step to fulfil the call’s requirements. However, a more systematic integration of RE considerations during the course of these projects could help project developers achieve higher RE goals. As with the integration of LCA in product development projects debated by Hauschild, et al. [88] and Millet, et al. [89], and successfully applied by Kralisch, et al. [82] and Ott, et al. [90], the integration of RE assessments early in a project would be useful to exclude bad options [91]. Integration of RE evaluations at later stages may be easier but can only contribute to the optimization of the already chosen solution. Thus, the enhancement of an iterative RE evaluation throughout a given innovation project, beginning with a preliminary index that leads to more elaborate indicators at the end of the project, is recommended. Gate-to-gate analyses are easier to conduct at the early stages of process development as they require less time and data but life cycle thinking is also required at the early stages of process design, especially to account for the potential impacts of use phase and end-of-life on resource consumption. Other types of indicators and indices beyond the overall RE indicator are encouraged during process design, including the Reusability/Recyclability/Recoverability rates [73]. These may be less time consuming and data intensive as a preliminary analysis than the overall RE calculation. Moreover, RE ratios simultaneously represent the benefits and (impacts from) resource use but a closer look at the denominator—(impact from) resource use—to identify hotspots, especially for process developers, may be useful.
Further work is necessary to make the framework more operational for project developers, especially to harmonize the way methodological choices are made. Two examples of aspects to be further tailored are the calculation of the market share and the upscaling of the studied system to estimate the potential contribution of a new technology to the RE of the nation or region as a whole. Working groups could be formed to recommend the methods to follow when conducting these two steps. They can follow the same approach as when forming the technical working groups in charge of writing the Product Environmental Footprint Category Rules (PEFCRs) in the framework of the Product Environmental Footprint pilots, or the Reference Document on Best Available Techniques (BREFs) developed under the IPPC and the Industrial Emissions Directives. In parallel of the calls, working group focusing on the market share calculation could be formed per types of products (e.g., feed and energy) and provide guidelines, for example to choose the period under which the market is described and the potential penetration percentage of the new product/technology. Working groups focusing on upscaling could be formed per type of process (e.g., extrusion and stirring processes) and provide guidelines on the effect of upscaling on resource use. For example, in the framework of the FP7 project EnAlgae (see Section 4.3.1), Sfez, et al. [66] estimated the resource footprint of an algae pond treating wastewater and the potential savings that could be made when upscaling the system. The assumptions made to evaluate the effect of upscaling on stirring energy consumption and material types were based on time intensive expert discussions and internet research. A guideline providing databases on the materials used per type of application in industry (e.g., for heating water circulation) or known upscaling effects on energy consumption would facilitate the upscaling of the studied process and thus encourage to add this analysis to the results of the RE evaluation.

6. Conclusions

The challenges related to increasing RE are numerous. By developing innovative technologies, the process industry can participate in tackling the issue of decreasing resource availability. This should be monitored, benchmarked and encouraged by setting targets at the process as well as national or regional levels and by providing methods and tools to measure potential improvements and induce the integration of RE considerations into each process’s design. The discussion presented in this study highlights the need for a framework and proposes basic recommendations to assess RE in research and innovation projects. Today, project developers follow a wide range of methods to evaluate RE and do not always follow a life cycle perspective while the aim of public funding programs is to contribute to increase the overall RE at the regional or national level. One major recommendation is thus to follow a life cycle perspective, when possible by conducting an LCA study. Moreover, the approach followed to choose the RE evaluation method should be transparent and based on a deep understanding of the concepts behind each method. The potential of an innovative product or technology to contribute to the RE of the nation/region as a whole should be estimated, e.g., based on a market analysis and/or the upscaling of the technology or product under development.
Work is still needed to further develop the framework and allow its implementation in research and innovation projects. Guidelines on specific methodological choices such as the ones made when upscaling should be provided to the project developers. Some recommendations can already be implemented as new requirements in calls (e.g., in the proposal, project developers should describe the method to evaluate resource efficiency and estimate the market potential-) and tested during the launch of a future call to see how consortia deal with these requirements and if the outcomes are more valuable than without considering the recommendations. This testing step could help better identify specific harmonization needs. As demonstrated recently by Baldassarri, et al. [92] for the integration of LC-based assessment at the heart of a technological research project, effectively addressing new cross-cutting perspectives such as RE in research and innovation projects requires non negligible dedicated resources. It is knowledge and time intensive. Call managers and project developers should be aware of this and should be ready to secure appropriate resources until best practices for integrating RE considerations into research projects are well established.

Acknowledgments

This work was funded by the Horizon 2020 Framework program and conducted within the projects “Metrics for Sustainability Assessment in European Process Industries” (MEASURE; Grant agreement No. 636816) and Resource Management in Peri-urban Areas: Going Beyond Urban Metabolism (REPAIR; Grant agreement No. 688920). The authors declare that this paper is not compromised by any commercial or financial interests.

Author Contributions

Steven De Meester, Jo Dewulf and Sophie Sfez conceived and designed the research. Dana Kralisch, Wouter De Soete, Fabrice Mathieux and Thomas Schaubroeck supported the writing process, gave suggestions and discussed the content of the manuscript. Sophie Sfez wrote the manuscript.

Conflicts of Interest

The views expressed in the article are personal and do not necessarily reflect an official position of the European Commission.

References

  1. United Nations Environment Programme (UNEP). UNEP’s Resource Efficiency Programme. Available online: http://www.unep.org/resourceefficiency/Home/UNEPsResourceEfficiencyProgramme/tabid/55552/Default.aspx (accessed on 29 April 2016).
  2. Bahn-Walkowiak, B.; Steger, S. Resource Targets in Europe and Worldwide: An Overview. Resources 2015, 4, 597–620. [Google Scholar] [CrossRef]
  3. European Commission (EC). A Resource-Efficient Europe—Flagship Initiative under the Europe 2020 Strategy; COM(2011) 21; European Commission: Brussels, Belgium, 2001. [Google Scholar]
  4. European Commission (EC). Roadmap to a Resource Efficient Europe; COM(2011) 571 Final; European Commission: Brussels, Belgium, 2011. [Google Scholar]
  5. European Commission (EC). Resource Efficiency Scoreboard Highlights 2014; European Commission: Brussels, Belgium, 2014. [Google Scholar]
  6. European Commission: European Union (EC). Europe 2020 Flagship Initiative—Innovation Union; COM(2010) 546 Final; European Commission: Brussels, Belgium, 2010. [Google Scholar]
  7. Sustainable Process Industry through Resource and Energy Efficiency (SPIRE). SPIRE Roadmap; A.SPIRE: Brussels, Belgium, 2013; Available online: https://www.spire2030.eu/uploads/Modules/Publications/spire-roadmap_december_2013_pbp.pdf (accessed on 18 October 2016).
  8. Bach, V.; Berger, M.; Henßler, M.; Kirchner, M.; Leiser, S.; Mohr, L.; Rother, E.; Ruhland, K.; Schneider, L.; Tikana, L.; et al. Integrated method to assess resource efficiency—ESSENZ. J. Clean. Prod. 2016, 137, 118–130. [Google Scholar] [CrossRef]
  9. BIO by Deloitte; CIRCE. Development and Definition of Key Resource Indicators; TOP-REF Deliverable 2.3; European Union: Brussels, Belgium, 2014; Available online: http://toprefproject.eu/?p=13681 (accessed on 9 January 2017).
  10. Huysman, S.; Sala, S.; Mancini, L.; Ardente, F.; Alvarenga, R.A.F.; De Meester, S.; Mathieux, F.; Dewulf, J. Toward a systematized framework for resource efficiency indicators. Resour. Conserv. Recycl. 2015, 95, 68–76. [Google Scholar] [CrossRef] [Green Version]
  11. Geldermann, J.; Kolbe, L.M.; Krause, A.; Mai, C.; Militz, H.; Osburg, V.S.; Schobel, A.; Schumann, M.; Toporowski, W.; Westphal, S. Improved resource efficiency and cascading utilisation of renewable materials. J. Clean Prod. 2016, 110, 1–8. [Google Scholar] [CrossRef]
  12. Berger, M.; Finkbeiner, M. Correlation analysis of life cycle impact assessment indicators measuring resource use. Int. J. Life Cycle Assess. 2010, 16, 74–81. [Google Scholar] [CrossRef]
  13. European Commission (EC). Directive 2010/75/EU on Industrial Emissions; Official Journal of the European Union: Brussels, Belgium, 2010. [Google Scholar]
  14. Europe Environment Agency (EEA). Impact of Selected Policy Measures on Europe’s Air Quality; Report No. EEA 8/2010; Europe Environment Agency: Copenhagen, Denmark, 2010. [Google Scholar]
  15. Udo de Haes, H.; Jolliet, O.; Finnveden, G.; Hauschild, M.; Krewitt, W.; Müller-Wenk, R. Best available practice regarding impact categories and category indicators in life cycle impact assessment. Int. J. Life Cycle Assess. 1999, 4, 167–174. [Google Scholar] [CrossRef]
  16. International Organization for Standardization (ISO). ISO 14040: Environmental Management—Life Cycle Assessment—Principles and Framework; ISO: Geneva, Switzerland, 2006. [Google Scholar]
  17. European Commission (EC). Eurostat. Available online: http://ec.europa.eu/eurostat/statistics-explained/index.php/Water_use_in_industry (accessed on 18 October 2016).
  18. Dewulf, J.; Bösch, M.E.; Meester, B.D.; Vorst, G.V.D.; Langenhove, H.V.; Hellweg, S.; Huijbregts, M.A.J. Cumulative Exergy Extraction from the Natural Environment (CEENE): A comprehensive Life Cycle Impact Assessment method for resource accounting. Environ. Sci. Technol. 2007, 41, 8477–8483. [Google Scholar] [CrossRef] [PubMed]
  19. Klinglmair, M.; Sala, S.; Brandao, M. Assessing resource depletion in LCA: A review of methods and methodological issues. Int. J. Life Cycle Assess. 2014, 19, 580–592. [Google Scholar] [CrossRef]
  20. Giljum, S.; Burger, E.; Hinterberger, F.; Lutter, S.; Bruckner, M. A comprehensive set of resource use indicators from the micro to the macro level. Resour. Conserv. Recycl. 2011, 55, 300–308. [Google Scholar] [CrossRef]
  21. Taelman, S.E.; Schaubroeck, T.; De Meester, S.; Boone, L.; Dewulf, J. Accounting for land use in life cycle assessment: The value of NPP as a proxy indicator to assess land use impacts on ecosystems. Sci. Total Environ. 2016, 550, 143–156. [Google Scholar] [CrossRef] [PubMed]
  22. EC-OREP. Eurostat. Available online: http://ec.europa.eu/environment/resource_efficiency/re_platform/index_en.htm (accessed on 18 October 2016).
  23. Debaveye, S.; De Soete, W.; De Meester, S.; Vandijck, D.; Heirman, B.; Kavanagh, S.; Dewulf, J. Human health benefits and burdens of a pharmaceutical treatment: Discussion of a conceptual integrated approach. Environ. Res. 2016, 144, 19–31. [Google Scholar] [CrossRef] [PubMed]
  24. Stylianou, K.S.; Heller, M.C.; Fulgoni, V.L.; Ernstoff, A.S.; Keoleian, G.A.; Jolliet, O. A life cycle assessment framework combining nutritional and environmental health impacts of diet: A case study on milk. Int. J. Life Cycle Assess. 2016, 21, 734–746. [Google Scholar] [CrossRef] [Green Version]
  25. Tukker, A.; Poliakov, E.; Heijungs, R.; Hawkins, T.; Neuwahl, F.; Rueda-Cantuche, J.M.; Giljum, S.; Moll, S.; Oosterhaven, J.; Bouwmeester, M. Towards a global multi-regional environmentally extended input-output database. Ecol. Econ. 2009, 68, 1928–1937. [Google Scholar] [CrossRef]
  26. Dietzenbacher, E.; Los, B.; Stehrer, R.; Timmer, M.; de Vries, G. The construction of world input-output tables in the WIOD project. Econ. Syst. Res. 2013, 25, 71–98. [Google Scholar] [CrossRef]
  27. Frischknecht, R.; Rebitzer, G. The ecoinvent database system: A comprehensive web-based LCA database. J. Clean. Prod. 2005, 13, 1337–1343. [Google Scholar] [CrossRef]
  28. Joint Research Center. The European Life Cycle Database. Available online: http://eplca.jrc.ec.europa.eu/?page_id=126 (accessed on 18 October 2016).
  29. GaBi Software, Software Solution; PE International: Stuttgart, Germany, 2013.
  30. Ekvall, T.; Assefa, G.; Björklund, A.; Eriksson, O.; Finnveden, G. What life-cycle assessment does and does not do in assessments of waste management. Waste Manag. 2007, 27, 989–996. [Google Scholar] [CrossRef] [PubMed]
  31. Oldfield, T.; Holden, N.M. An evaluation of upstream assumptions in food-waste life cycle assessments. In Proceedings of the 9th International Conference on Life Cycle Assessment in the Agri-Food Sector, San Francisco, CA, USA, 8–10 October 2014; pp. 926–933.
  32. Chen, C.; Habert, G.; Bouzidi, Y.; Jullien, A.; Ventura, A. LCA allocation procedure used as an incitative method for waste recycling: An application to mineral additions in concrete. Resour. Conserv. Recycl. 2010, 54, 1231–1240. [Google Scholar] [CrossRef]
  33. Weidema, B.P.; Bauer, C.; Hischier, R.; Mutel, C.; Nemecek, T.; Reinhard, J.; Vadenbo, C.O.; Wernet, G. Overview and Methodology. Data Quality Guideline for the Ecoinvent Database, version 3; Ecoinvent Report 1(v3); Swiss Centre for Life Cycle Inventories: St. Gallen, Switzerland, 2013. [Google Scholar]
  34. Heijungs, R.; Guinée, J.B.; Huppes, G. Impact Categories for Natural Resources and Land Use: Survey and Analysis of Existing and Proposed Methods in the Context of Environmental Life Cycle Assessment; CML: Leiden, The Netherlands, 1997. [Google Scholar]
  35. Zhong, S.; Geng, Y.; Liu, W.; Gao, C.; Chen, W. A bibliometric review on natural resource accounting during 1995–2014. J. Clean. Prod. 2016, 139, 122–132. [Google Scholar] [CrossRef]
  36. Swart, P.; Alvarenga, R.A.F.; Dewulf, J. Abiotic Resource Use. In LCA Compendium—The Complete World of Life Cycle Assessment; Klöpffer, W., Curran, M.A., Eds.; Springer: Dordrecht, The Netherlands, 2015; pp. 247–269. [Google Scholar]
  37. Dewulf, J.; Mancini, L.; Blengini, G.A.; Sala, S.; Latunussa, C.; Pennington, D. Toward an Overall Analytical Framework for the Integrated Sustainability Assessment of the Production and Supply of Raw Materials and Primary Energy Carriers. J. Ind. Ecol. 2015, 19, 963–977. [Google Scholar] [CrossRef] [Green Version]
  38. Alvarenga, R.A.F.; Dewulf, J.; Van Langenhove, H.; Huijbregts, M.J. Exergy-based accounting for land as a natural resource in life cycle assessment. Int. J. Life Cycle Assess. 2013, 18, 939–947. [Google Scholar] [CrossRef]
  39. Huijbregts, M.A.J.; Hellweg, S.; Frischknecht, R.; Hungerbühler, K.; Hendriks, A.J. Ecological footprint accounting in the life cycle assessment of products. Ecol. Econ. 2008, 64, 798–807. [Google Scholar] [CrossRef]
  40. Brunner, P.H.; Rechberger, H. Practical Handbook for Material Flow Analysis—Advanced Methods in Resource and Waste Management; Lewis Publishers: Boca Raston, FL, USA, 2003. [Google Scholar]
  41. Goedkoop, M.; Heijungs, R.; De Schryver, A.; Struijs, J.; van Zelm, R. ReCiPe 2008. A LCIA Method Which Comprises Harmonised Category Indicators at the Midpoint and the Endpoint Level; Report I: Characterisation; Ministerie van VROM: Den Haag, The Netherlands, 2009. [Google Scholar]
  42. Hauschild, M.Z.; Wenzel, H. Environmental Assessment of Products Volume 2: Scientific Background; Chapman & Hall/Kluwer Academic Publishers: London, UK; Hingham, MA, USA, 1998. [Google Scholar]
  43. Ritthoff, M.; Rohn, H.; Liedtke, C. Calculating MIPS. Resource Productivity of Products and Services; Wuppertal Institute for Climate, Environment and Energy: Wuppertal, Germany, 2002. [Google Scholar]
  44. Bullard, C.W.; Penner, P.S.; Pilati, D.A. Energy Analysis: Handbook for Combining Process and Input-Output Analysis; U.S. Energy Research and Development Administration: Springfield, IL, USA, 1976.
  45. Hischier, R.; Weidema, B.; Althaus, H.-J.; Doka, G.; Dones, R.; Frischknecht, R.; Hellweg, S.; Humbert, S.; Jungbluth, N.; Loerincik, Y.; et al. Implementation of Life Cycle Impact Assessment Methods; Final Report Ecoinvent V2.1; Swiss Centre for Life Cycle Inventories: St. Gallen, Switzerland, 2009; Volume 3. [Google Scholar]
  46. Guinée, J.B.; Heijungs, R. A proposal for the definition of resource equivalency factors for use in product life-cycle assessment. Environ. Toxicol. Chem. 1995, 14, 917–925. [Google Scholar] [CrossRef]
  47. Van Oers, L.; de Koning, A.; Guinée, J.B.; Huppes, G. Abiotic Resource Depletion in LCA; Leiden University: Leiden, The Netherlands, 2002. [Google Scholar]
  48. Jolliet, O.; Margni, M.; Charles, R.; Humbert, S.; Payet, J.; Rebitzer, G.; Rosenbaum, R. IMPACT 2002+: A new life cycle impact assessment methodology. Int. J. Life Cycle Assess. 2003, 8, 324–330. [Google Scholar] [CrossRef]
  49. Szargut, J.; Morris, D.R.; Steward, F.R. Exergy Analysis of Thermal, Chemical, and Metallurgical Processes; Hemisphere Publishing: New York, NY, USA, 1987; p. 400. [Google Scholar]
  50. Bösch, M.; Hellweg, S.; Huijbregts, M.J.; Frischknecht, R. Applying cumulative exergy demand (CExD) indicators to the ecoinvent database. Int. J. Life Cycle Assess. 2007, 12, 181–190. [Google Scholar] [CrossRef]
  51. Global Footprint Network. Ecological Footprint Standards 2009; Global Footprint Network: Oakland, CA, USA, 2009. [Google Scholar]
  52. Frischknecht, R.; Büsser Knöpfel, S. Swiss Eco-Factors 2013 according to the Ecological Scarcity Method. Methodological Fundamentals and Their Application in Switzerland; Environmental Studies No. 1330; Federal Office for the Environment: Bern, Switzerland, 2013. [Google Scholar]
  53. Steen, B. A Systematic Approach to Environmental Priority Strategies in Product Development (EPS) Version 2000—General System Characteristics; CPM Report 1999:4; Centre for Environmental Assessment of Products and Material Systems: Göteborg, Sweden, 1999. [Google Scholar]
  54. Goedkoop, M.; Spriensma, R. The Eco-Indicator 99. A Damage Oriented Method for Life Cycle Impact Assessment, 3rd ed.; Methodology Report; Pré Consultants: Amersfoort, The Netherlands, 2000. [Google Scholar]
  55. Swart, P.; Dewulf, J. Quantifying the impacts of primary metal resource use in life cycle assessment based on recent mining data. Resour. Conserv. Recycl. 2013, 73, 180–187. [Google Scholar] [CrossRef]
  56. Vieira, M.; Goedkoop, M.J.; Storm, P.; Huijbregts, M.A.J. Ore Grade Decrease As Life Cycle Impact Indicator for Metal Scarcity: The Case of Copper. Environ. Sci. Technol. 2012, 46, 12772–12778. [Google Scholar] [CrossRef] [PubMed]
  57. Drielsma, J.A.; Russell-Vaccari, A.J.; Drnek, T.; Brady, T.; Weihed, P.; Mistry, M.; Simbor, L.P. Mineral resources in life cycle impact assessment-defining the path forward. Int. J. Life Cycle Assess. 2016, 21, 85–105. [Google Scholar] [CrossRef]
  58. Vieira, M.; Ponsioen, T.; Goedkoop, M.; Huijbregts, M. Surplus Cost Potential as a Life Cycle Impact Indicator for Metal Extraction. Resources 2016, 5. [Google Scholar] [CrossRef]
  59. United Nations Environment Programme (UNEP). Assessing the Environmental Impacts of Consumption and Production. Priority Products and Materials. A Report of the Working Group on the Environmental Impacts of Products and Materials to the International Panel for Sustainable Resource Management. 2010. Available online: http://www.unep.org/resourcepanel/Portals/24102/PDFs/PriorityProductsAndMaterials_Report.pdf (accessed on 9 January 2017).
  60. De Soete, W.; Dewulf, J.; Cappuyns, P.; Van der Vorst, G.; Heirman, B.; Aelterman, W.; Schoeters, K.; Van Langenhove, H. Exergetic sustainability assessment of batch versus continuous wet granulation based pharmaceutical tablet manufacturing: A cohesive analysis at three different levels. Green Chem. 2013, 15, 3039–3048. [Google Scholar] [CrossRef]
  61. Arena, U.; Di Gregorio, F.; Amorese, C.; Mastellone, M.L. A techno-economic comparison of fluidized bed gasification of two mixed plastic wastes. Waste Manag. 2011, 31, 1494–1504. [Google Scholar] [CrossRef] [PubMed]
  62. Ma, S.J.; Hu, S.Y.; Chen, D.J.; Zhu, B. A case study of a phosphorus chemical firm’s application of resource efficiency and eco-efficiency in industrial metabolism under circular economy. J. Clean. Prod. 2015, 87, 839–849. [Google Scholar] [CrossRef]
  63. Van der Vorst, G.; Van Langenhove, H.; De Paep, F.; Aelterman, W.; Dingenen, J.; Dewulf, J. Exergetic life cycle analysis for the selection of chromatographic separation processes in the pharmaceutical industry: Preparative HPLC versus preparative SFC. Green Chem. 2009, 11, 1007–1012. [Google Scholar] [CrossRef]
  64. Finnveden, G.; Arushanyan, Y.; Brandão, M. Exergy as a Measure of Resource Use in Life Cycle Assessment and Other Sustainability Assessment Tools. Resources 2016, 5. [Google Scholar] [CrossRef]
  65. Vadenbo, C.; Rørbech, J.; Haupt, M.; Frischknecht, R. Abiotic resources: New impact assessment approaches in view of resource efficiency and resource criticality. In Proceedings of the 55th Discussion Forum on Life Cycle Assessment, Zurich, Switzerland, 11 April 2014; Springer: Berlin/Heidelberg, Germany, 2014; pp. 1686–1692. [Google Scholar]
  66. Sfez, S.; Van Den Hende, S.; Taelman, S.E.; De Meester, S.; Dewulf, J. Environmental sustainability assessment of a microalgae raceway pond treating aquaculture wastewater: From up-scaling to system integration. Bioresour. Technol. 2015, 190, 321–331. [Google Scholar] [CrossRef] [PubMed]
  67. Schneider, L.; Berger, M.; Finkbeiner, M. The anthropogenic stock extended abiotic depletion potential (AADP) as a new parameterisation to model the depletion of abiotic resources. Int. J. Life Cycle Assess. 2011, 16, 929–936. [Google Scholar] [CrossRef]
  68. Van Oers, L.; Guinee, J. The Abiotic Depletion Potential: Background, Updates, and Future. Resources 2016, 5. [Google Scholar] [CrossRef]
  69. Finnveden, G.; Hauschild, M.Z.; Ekvall, T.; Guinée, J.; Heijungs, R.; Hellweg, S.; Koehler, A.; Pennington, D.; Suh, S. Recent developments in Life Cycle Assessment. J. Environ. Manag. 2009, 91, 1–21. [Google Scholar] [CrossRef] [PubMed]
  70. Dewulf, J.; Benini, L.; Mancini, L.; Sala, S.; Blengini, G.A.; Ardente, F.; Recchioni, M.; Maes, J.; Pant, R.; Pennington, D. Rethinking the Area of Protection “Natural Resources” in Life Cycle Assessment. Environ. Sci. Technol. 2015, 49, 5310–5317. [Google Scholar] [CrossRef] [PubMed]
  71. Al-Oqla, F.M.; Sapuan, S.M.; Ishak, M.R.; Nuraini, A.A. A Model for Evaluating and Determining the Most Appropriate Polymer Matrix Type for Natural Fiber Composites. Int. J. Polym. Anal. Charact. 2015, 20, 191–205. [Google Scholar] [CrossRef]
  72. European Commission (EC). Closing the Loop. An EU Action Plan for the Circular Economy; COM(2015) 614/2; European Commission: Brussels, Belgium, 2015. [Google Scholar]
  73. Ardente, F.; Mathieux, F. Identification and assessment of product’s measures to improve resource efficiency: The case-study of an Energy using Product. J. Clean. Prod. 2014, 83, 126–141. [Google Scholar] [CrossRef]
  74. Huysman, S.; Debaveye, S.; Schaubroeck, T.; Meester, S.D.; Ardente, F.; Mathieux, F.; Dewulf, J. The recyclability benefit rate of closed-loop and open-loop systems: A case study on plastic recycling in Flanders. Resour. Conserv. Recycl. 2015, 101, 53–60. [Google Scholar] [CrossRef] [Green Version]
  75. Allacker, K.; Mathieux, F.; Manfredi, S.; Pelletier, N.; De Camillis, C.; Ardente, F.; Pant, R. Allocation solutions for secondary material production and end of life recovery: Proposals for product policy initiatives. Resour. Conserv. Recycl. 2014, 88, 1–12. [Google Scholar] [CrossRef]
  76. European Commission (EC). Report on Critical Raw Materials for the EU. Report of the Ad Hoc Working Group on Defining Critical Raw Materials; European Union: Brussels, Belgium, 2014; Available online: http://mima.geus.dk/report-on-critical-raw-materials_en.pdf (accessed on 9 January 2017).
  77. Sonnemann, G.; Gemechu, E.D.; Adibi, N.; De Bruille, V.; Bulle, C. From a critical review to a conceptual framework for integrating the criticality of resources into Life Cycle Sustainability Assessment. J. Clean. Prod. 2015, 94, 20–34. [Google Scholar] [CrossRef]
  78. Virtual Desktop Infrastructure (VDI). Resource Efficiency—Evaluation of the Use of Raw Materials; VDI-Gesellschaft Energie und Umwelt: Düsseldorf, Germany, 2016; Available online: http://www.vdi.eu/nc/guidelines/entwurf_vdi_4800_blatt_2-ressourceneffizienz_bewertung_des_rohstoffaufwands_/ (accessed on 20 December 2015).
  79. Shibasaki, M.; Warburg, N.; Eyerer, P. Upscaling effect and Life Cycle Assessment. In Proceedings of the 13th CIRP International Conference on Life Cycle Engineering, Leuven, Belgium, 31 May–2 June 2006.
  80. Gavankar, S.; Suh, S.; Keller, A.A. The Role of Scale and Technology Maturity in Life Cycle Assessment of Emerging Technologies: A Case Study on Carbon Nanotubes. J. Ind. Ecol. 2015, 19, 51–60. [Google Scholar] [CrossRef]
  81. Taelman, S.E.; De Meester, S.; Roef, L.; Michiels, M.; Dewulf, J. The environmental sustainability of microalgae as feed for aquaculture: A life cycle perspective. Bioresour. Technol. 2013, 150, 513–522. [Google Scholar] [CrossRef] [PubMed]
  82. Kralisch, D.; Staffel, C.; Ott, D.; Bensaid, S.; Saracco, G.; Bellantoni, P.; Loeb, P. Process design accompanying life cycle management and risk analysis as a decision support tool for sustainable biodiesel production. Green Chem. 2013, 15, 463–477. [Google Scholar] [CrossRef]
  83. Weiss, M.; Junginger, H.M.; Patel, M.K. Learning Energy Efficiency: Experience Curves for Household Appliances and Space Heating, Cooling, and Lighting Technologies; Utrecht University: Utrecht, The Netherlands, 2008; Available online: http://dspace.library.uu.nl/handle/1874/32937 (accessed on 16 December 2016).
  84. Karali, N.; Park, W.Y.; McNeil, M.A. Using Learning Curves on Energy-Efficient Technologies to Estimate Future Energy Savings and Emission Reduction Potentials in the US Iron and Steel Industry; Ernest Orlando Lawrence Berkeley National Laboratory, International Energy Studies Group Energy Analysis and Environmental Impacts Division: Berkeley, CA, USA, 2015. Available online: https://eetd.lbl.gov/sites/all/files/lbnl-184179.pdf (accessed on 20 December 2016).
  85. Caduff, M.; Huijbregts, M.A.J.; Koehler, A.; Althaus, H.-J.; Hellweg, S. Scaling Relationships in Life Cycle Assessment. J. Ind. Ecol. 2014, 18, 393–406. [Google Scholar] [CrossRef]
  86. Rohn, H.; Pastewski, N.; Lettenmeier, M.; Wiesen, K.; Bienge, K. Resource efficiency potential of selected technologies, products and strategies. Sci. Total Environ. 2014, 473–474, 32–35. [Google Scholar] [CrossRef] [PubMed]
  87. Ardashkin, I.B.; Yakovlev, A.N.; Martyushev, N.V. Evaluation of the Resource Efficiency of Foundry Technologies: Methodological Aspect. In High Technology: Research and Applications; Bogdan, A., Martyushev, N., Eds.; Trans Tech Publications Ltd.: Stafa-Zurich, Switzerland, 2014; Volume 1040, pp. 912–916. [Google Scholar]
  88. Hauschild, M.Z.; Jeswiet, J.; Alting, L. Design for Environment—Do We Get the Focus Right? CIRP Ann. Manuf. Technol. 2004, 53, 1–4. [Google Scholar] [CrossRef]
  89. Millet, D.; Bistagnino, L.; Lanzavecchia, C.; Camous, R.; Poldma, T. Does the potential of the use of LCA match the design team needs? J. Clean. Prod. 2007, 15, 335–346. [Google Scholar] [CrossRef]
  90. Ott, D.; Kralisch, D.; Dencic, I.; Hessel, V.; Laribi, Y.; Perrichon, P.D.; Berguerand, C.; Kiwi-Minsker, L.; Loeb, P. Life Cycle Analysis within Pharmaceutical Process Optimization and Intensification: Case Study of Active Pharmaceutical Ingredient Production. ChemSusChem 2014, 7, 3521–3533. [Google Scholar] [CrossRef] [PubMed]
  91. Kralisch, D.; Minkov, N.; Manent, A.; Rother, E.; Mohr, L.; Schowanek, D.; Sfez, S.; Lapkin, A.; Jones, M.; De Meester, S.; et al. Roadmap for Sustainability Assessment in European Process Industries; MEASURE Final Deliverable; Friedrich Schiller University Jena: Jena, Germany, 2016; Available online: https://www.spire2030.eu/measure/ (accessed on 9 January 2017).
  92. Baldassarri, C.; Mathieux, F.; Ardente, F.; Wehmann, C.; Deese, K. Integration of environmental aspects into R&D inter-organizational projects management: Application of a life cycle-based method to the development of innovative windows. J. Clean. Prod. 2016, 112, 3388–3401. [Google Scholar]
Figure 1. Simplified system diagram of resource use in processing industries (emissions of waste from end users and the industrial production system into the natural environment are not depicted).
Resources 06 00005 g001
Figure 2. Comparison of exergy efficiency in the prep-HPLC and prep-SFC methods at the process, plant and life cycle levels, expressed in grams of isolated enantiomer per MJex consumed (based on [63]).
Resources 06 00005 g002
Figure 3. Resource efficiency of two valorization pathways for algae grown in wastewater using different life cycle level resource accounting and impact assessment methods, expressed in m3 of treated water per (impact from) resource used.
Resources 06 00005 g003
Figure 4. Steps required to advance the evaluation of resource efficiency of innovative products and processes (the numbers on the diagram refer to the paragraphs of this part).
Resources 06 00005 g004
Table 1. Existing methods to quantify resource consumption and examples (based on Swart, et al. [36] and Klinglmair, et al. [19]; empty cells: resources not covered by the method; “biotic resources” are repeated for “Materials and substances” and for “Energy” as they can be materials or energy carriers; (X): Indirectly accounted for).
Methods Based on...Examples of MethodsScopeResource Classification
WaterLandMaterials and SubstancesEnergy
Non-RenewableBiotic RenewableNon-RenewableAbiotic RenewableBiotic Renewable
Gate-to-GateLife CycleAtmospheric ResourcesMetals and MineralsBiomassFossil EnergyNuclear EnergyFlow Energy ResourcesBiomass
Accounting methodsMass or volumeMaterial flow analysis (a)X X XXXX X
ReCiPe Midpoint—Water depletion (b) XX
EDIP 97/2003—renewable resources (c) X X 1 X 1
Material Input Per Service Unit (d) X XX 2XX X 2
EnergyEnergy analysis (e)X XXXXX
CED/PED (f,g) X X 3XXXX 3
ADP—fossil fuels (h,i) X X
Impact 2002+—non-renewable energy (j) X X 4XX X 4
ReCiPe Midpoint—Fossil depletion (b) X X
ExergyExergy analysis (k)X X XXXXXXX
CEENE (l) XX(X)XXX 4XXXX 4
CexD (m) XX XXX 4XXXX 4
AreaDirect land accountingX X
Ecological Footprint (n) X X (X)(X)(X) (X)
Impact assessment methodsResource reserves quality/quantityADP (h,i) X X X
EDIP 97/2003—non-renewable resources (c) X X XX
Distance to targetEcological Scarcity (o) XX(X) XX4XXXX 4
Willingness-to-payEPS2000—land occupation and abiotic stock resources (p) X X X XX
Future consequencesImpact 2002+ (j) X X
Eco-Indicator 99 (q) X X X
ReCiPe Endpoint—resources (b) X X XX
1 Wood; 2 Plant biomass from cultivation and biomass from uncultivated areas; 3 Energy from wood and biomass from primary forest, and wood, food products, and biomass from agriculture; 4 Energy from biomass and biomass from primary forest; (a) Brunner and Rechberger [40]; (b) Goedkoop, et al. [41]; (c) Hauschild and Wenzel [42]; (d) Ritthoff, et al. [43]; (e) Bullard, et al. [44]; (f) Hischier, et al. [45]; (g) PE International [29]; (h) Guinée and Heijungs [46]; (i) van Oers, et al. [47]; (j) Jolliet, et al. [48]; (k) Szargut, et al. [49]; (l) Dewulf, et al. [18]; (m) Bösch, et al. [50]; (n) Global Footprint Network [51]; (o) Frischknecht and Büsser Knöpfel [52]; (p) Steen [53]; (q) Goedkoop and Spriensma [54].

