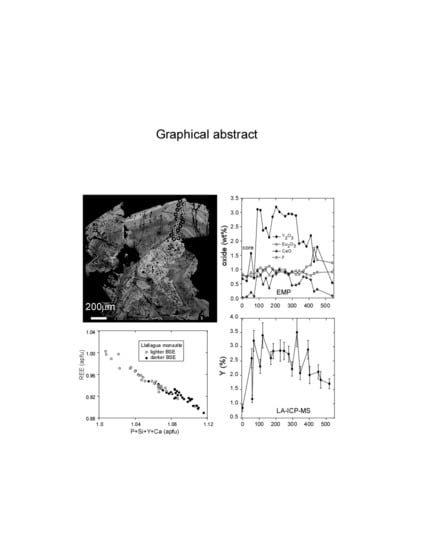
Speculations Linking Monazite Compositions to Origin: Llallagua Tin Ore Deposit (Bolivia)


Department of Geological Sciences, Jackson School of Geosciences, The University of Texas at Austin, 1 University Sta. C9000, EPS 1.130, Austin, TX 78712, USA
*
Author to whom correspondence should be addressed.
Resources 2017, 6(3), 36; https://doi.org/10.3390/resources6030036
Submission received: 3 May 2017
/
Revised: 24 July 2017
/
Accepted: 25 July 2017
/
Published: 29 July 2017
(This article belongs to the Special Issue Criticality of the Rare Earth Elements: Current and Future Sources and Recycling)
Abstract
:Monazite [(Ce,Th)PO4] from the Llallagua tin ore deposit in Bolivia is characterized by low radiogenic element contents. Previously reported field evidence and mineral associations suggest the mineral formed via direct precipitation from hydrothermal fluids. Monazite compositions thus may provide insight into characteristics of the fluids from which it formed. Chemical compositions of three Llallagua monazite grains were obtained using Electron Probe Microanalysis (EPMA, n = 64) and laser ablation mass spectrometry (LA-ICP-MS, n = 56). The mineral has higher amounts of U (123 ± 17 ppm) than Th (39 ± 20 ppm) (LA-ICP-MS, ±1σ). Grains have the highest amounts of fluorine ever reported for monazite (0.88 ± 0.10 wt %, EPMA, ±1σ), and F-rich fluids are effective mobilizers of rare earth elements (REEs), Y, and Th. The monazite has high Eu contents and positive Eu anomalies, consistent with formation in a highly-reducing back-arc environment. We speculate that F, Ca, Si and REE may have been supplied via dissolution of pre-existing fluorapatite. Llallagua monazite oscillatory zoning is controlled by an interplay of low (P + Ca + Si + Y) and high atomic number (REE) elements. We suggest monazite compositions provide insight into fluid geochemistry, mineral reactions, and tectonic settings of ore deposits that contain the mineral.
1. Introduction
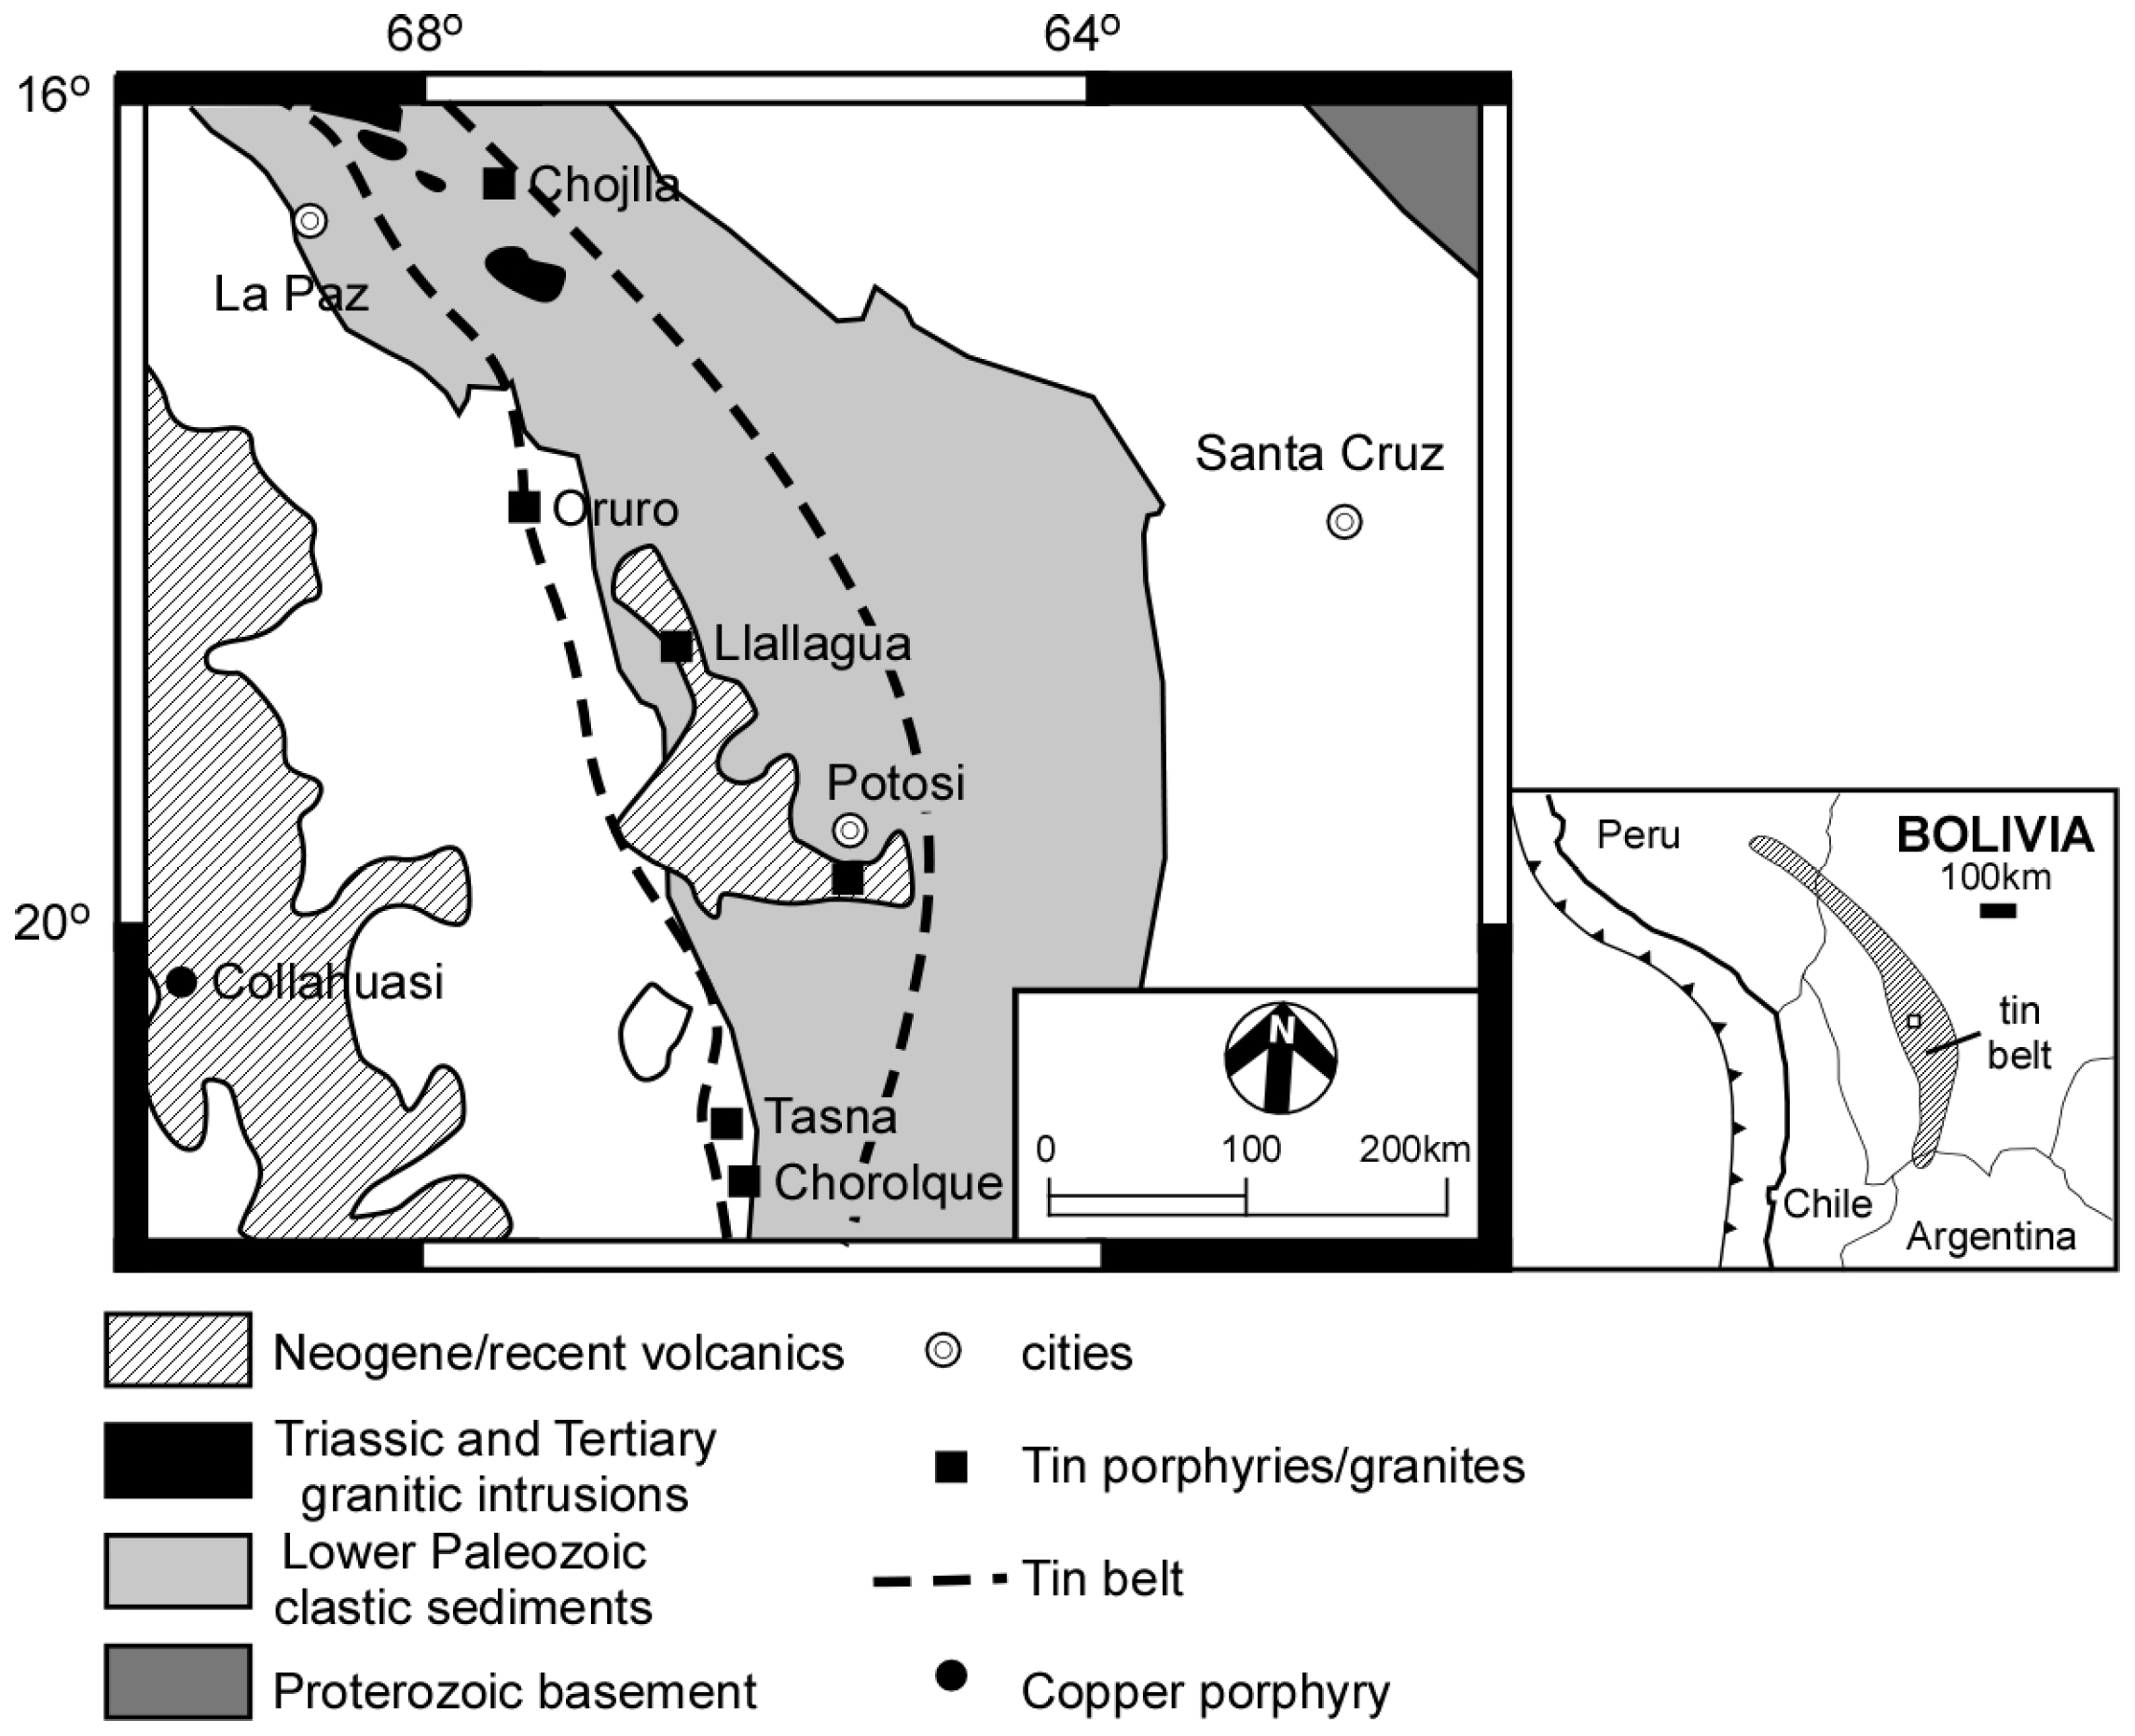
The Llallagua ore deposit is part of the tin belt that extends from southern Peru to northern Argentina (Figure 1) (e.g., [1,2]). The region was once considered one of the largest hard-rock tin deposits in the world, and produced more than 0.5 million tons of metallic tin [3,4,5,6,7]. The richest ore deposits are located within a zone where the belt makes a sharp curve (Figure 1) and are commonly found in association with intrusive igneous rocks [1,2,4,5,6,7,8,9,10].
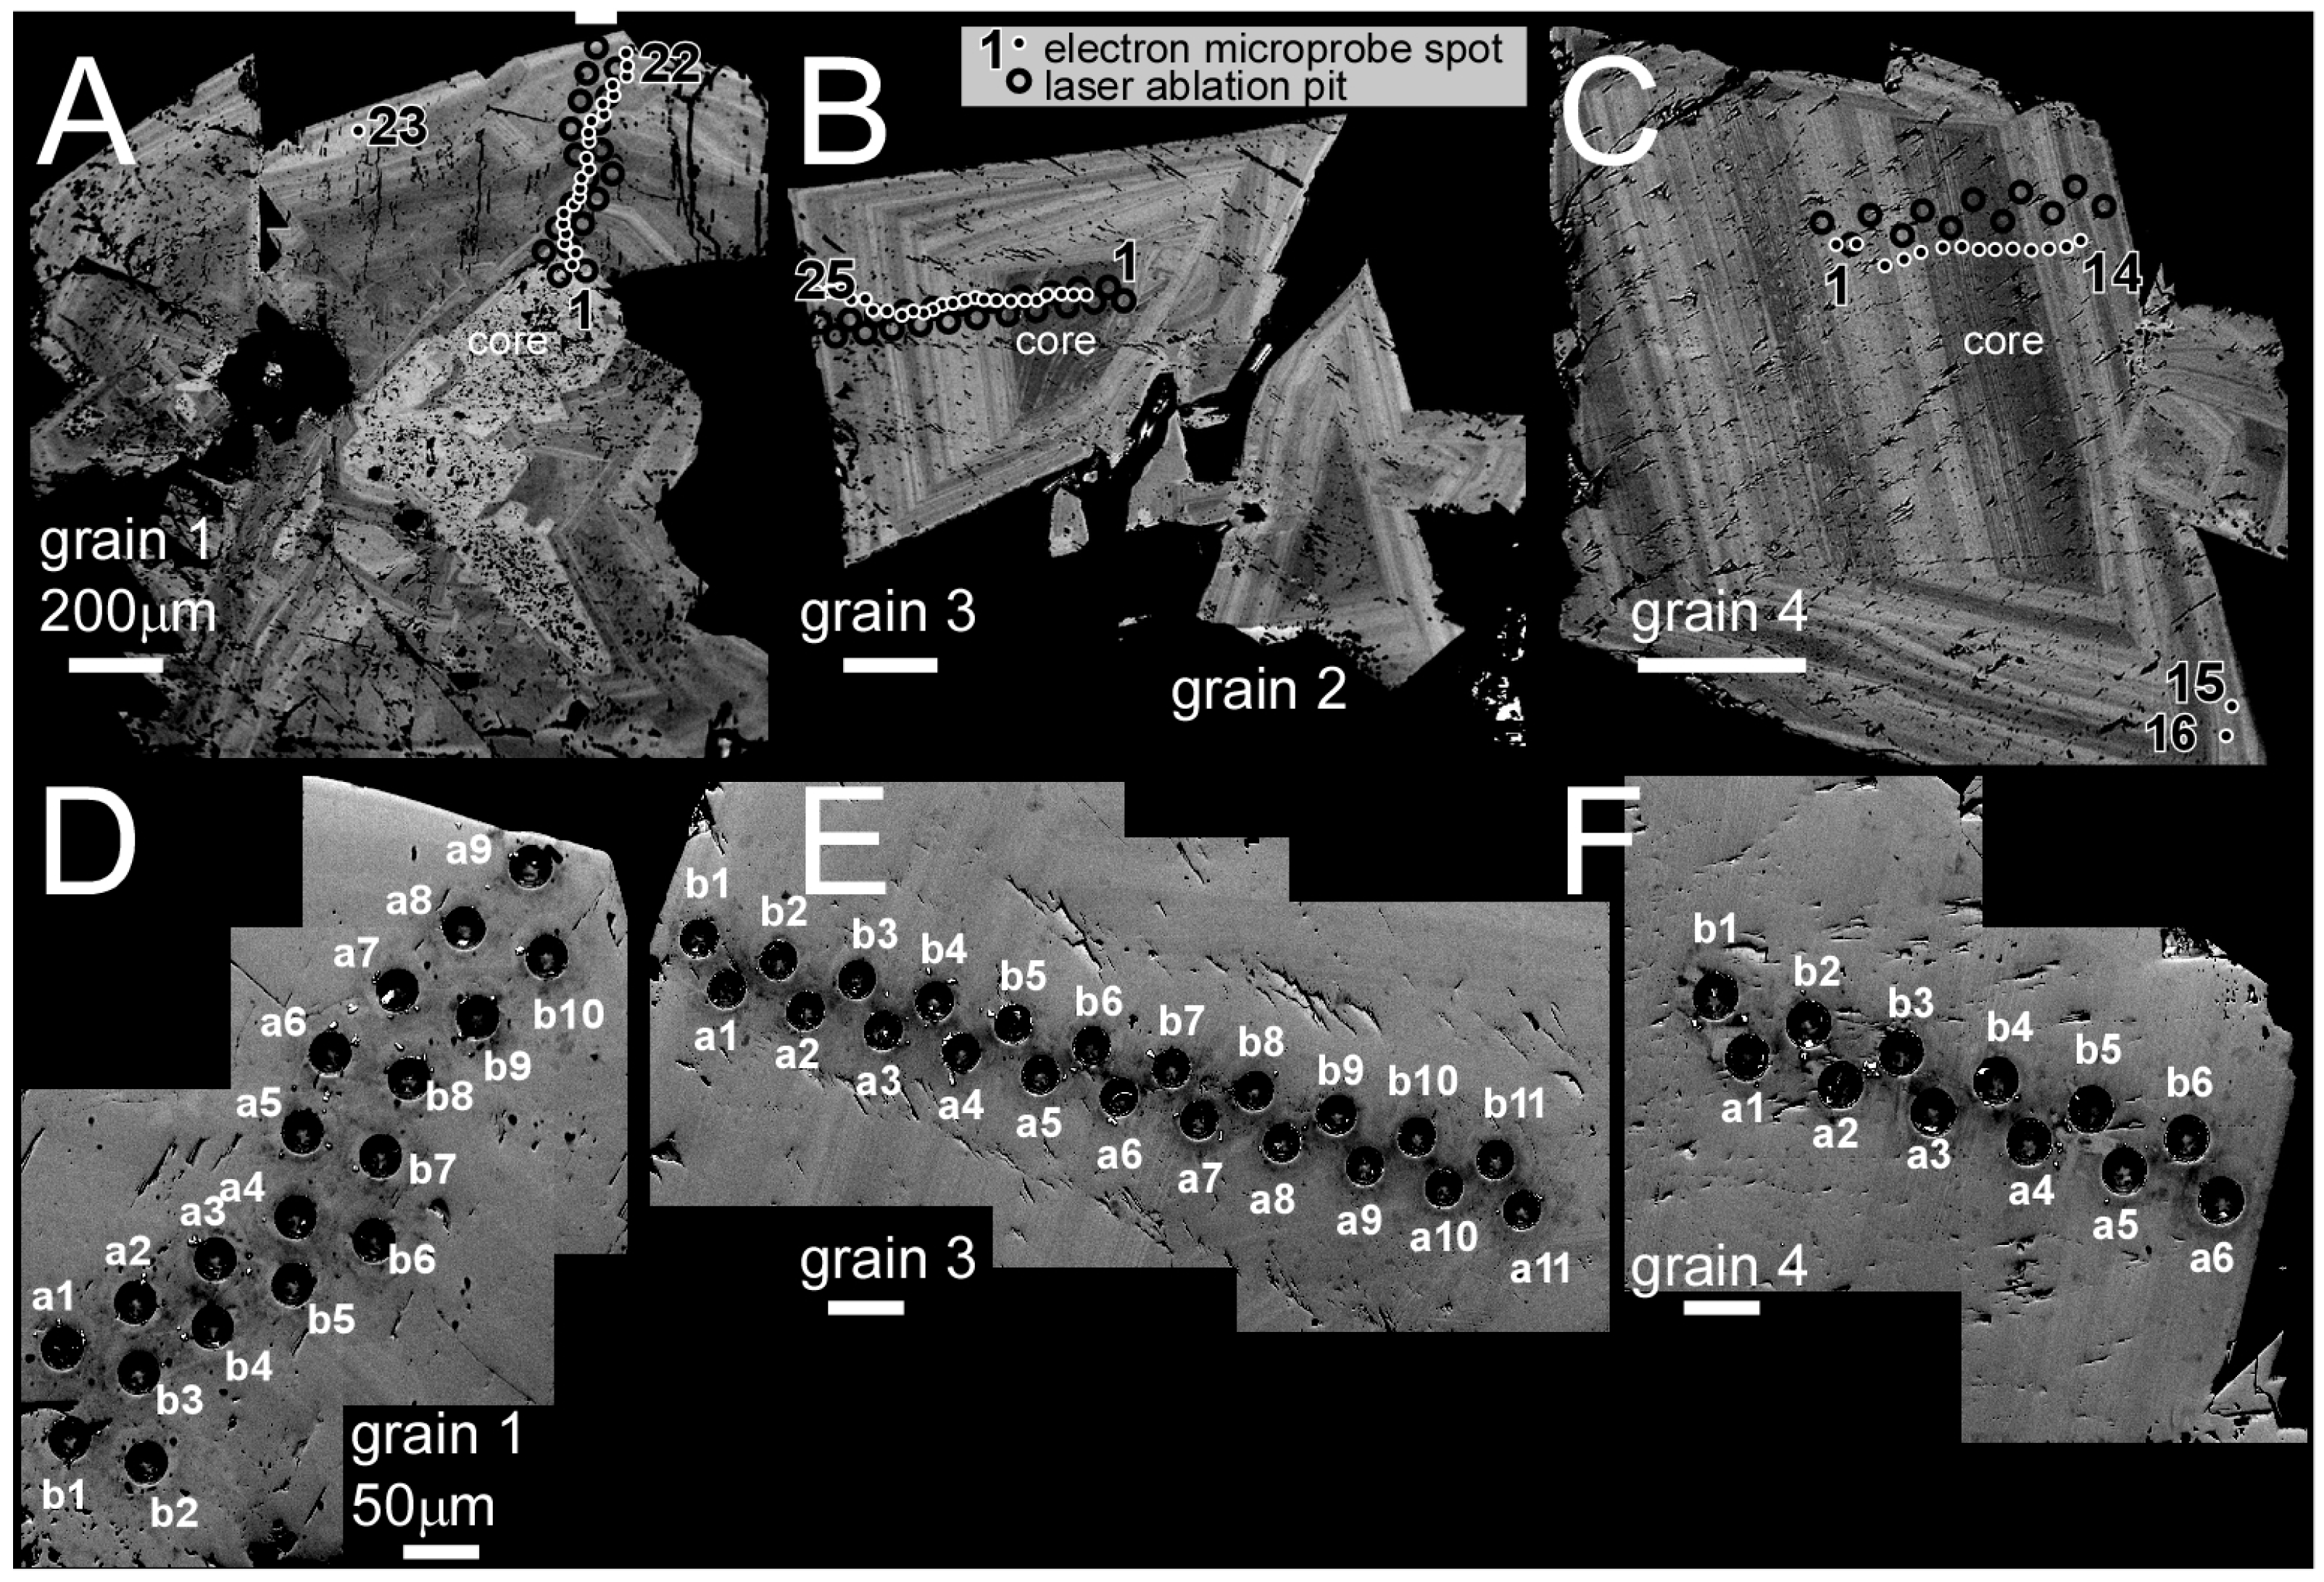
Monazite [(Ce,Th)PO4] is found in almost every vein system in the Llallagua deposit in association with quartz, cassiterite, tourmaline in veins and vugs, and embedded in pyrite and marcasite [5]. The mineral occurs as prismatic or pyramidal crystals with contact or penetration twinning [6]. The Llallagua monazite is also known for oscillatory zoning in backscattered electrons (BSE) (Figure 2) [7,11]. This type of zoning is considered rare for the mineral, which is more commonly seen as sector zoned in BSE [12,13,14].
Numerous studies describing the mineralogy of the Llallagua mine have noted the importance of fluids in the formation of the Llallagua monazite (e.g., [5,6,15]) and its composition has the potential to provide important insight into the geochemistry of the fluids that formed the deposit.
The origin of the Bolivian tin belt is suggested to be a series of compressional events between the Farallon/Nazca oceanic plate and the South American continent, which generated peraluminous magmas that equilibrated with graphite-rich, metapelitic sources [4,17]. The environment is characterized by low oxygen fugacity and high dissolved concentrations of tin (see review in [2]). The region was part of a back-arc basin for most of its history, but two major metallogenic episodes are recorded during the late Triassic-early Jurassic and late Oligocene-early Miocene [18,19]. Based on its ages, the Llallagua monazite analyzed in this study belongs to the second event.
Monazite from the Llallagua deposit contains minor Th, U [5,7,11,15,20] and up to 99.9% common 206Pb [7]. Monazite is thought to exclude common Pb during crystallization (e.g., [20,21,22,23]). Despite this issue, monazite from the Llallagua mine has been dated using U-Pb methods and yields Miocene results at 23.4 ± 2.2 Ma [7] and 19.0 ± 1.6 Ma [11]. These results are in-line with Miocene K-Ar ages of “partially altered” [24] Llallagua quartz latite porphyry minerals (20.6 ± 0.4 Ma, K-feldspar; and 21.6 ± 0.4 Ma, biotite) [17]. However, they are much younger than Eocene crystallization ages reported from the same locality [15,24,25]. The reason for the wide range of ages is problematic because a genetic link between tin ore mineralization and proximal igneous intrusions has yet to be established. The composition and timing of fluids transporting and depositing the ore is important information for evaluation and exploitation of this deposit and others like it (e.g., [26,27]).
Here we present detailed compositional analyses from three Llallagua monazite grains to understand how it reflects on its tectonic setting and controls on zoning. Because monazite can incorporate a wide variety of elements into its structure, and thus may have variable stoichiometry, generating high quality compositional data from monazite can be challenging [28,29,30]. We apply both electron probe microanalysis (EPMA) and laser ablation-inductively coupled plasma mass spectrometry (LA-ICP-MS) to constrain what elements are present in its structure. The grains were obtained from a vein in the Llallagua tin-ore porphyry deposit, provided by Alfredo Petrov (mindat.org [6]) from a sample dated by [11]. Our only geological context is that the grains were collected from a vein in a tin mine in the Potosi Department (Figure 1). Although the sample set is small (n = 3), we obtained a large amount of high-quality chemical analyses (n = 120) and the monazite themselves have previous age constraints [11]. The monazite compositions have the potential to allow insight into mineral reactions that may have occurred as the tin deposit formed. The Llallagua region is a historically important mining district, and the data is used to compare to those from other important monazite ore-producing localities to explore its potential as a resource for rare earth element (REEs).
2. Analytical Approaches
2.1. Sample Preparation and Imaging
The analyses were taken using the same standards and approach described in [28]. We followed a sample preparation protocol that would be typical for instruments that require polished monazite grains in a mounted environment (i.e., EPMA, ion microprobe, LA-ICP-MS). Individual grains were placed on dual-sided tape. A 1-inch diameter Teflon ring was placed around the grains and epoxy (Beuhler, EpoxiCure 2 Epoxy System) was poured around the grains to a depth of ~10 mm. After the epoxy cured, rings were broken away from the tape and grains polished using sand paper and Mother’s Billet Metal Polish. The back of the plug was cut using a high-precision saw to a thickness of ~5 mm. During this process, grains were exposed to Allied Low Speed Cutting Fluid. Mounts were cleaned in a sonicator bath with distilled water and an ultrasonic cleanser for 5 min and followed by three sessions of 5 min each in pure distilled water to remove traces of the cleanser or other impurities.
2.2. Llallagua Monazite Electron Probe MicroAnalyses (EPMA)
Mounts were coated in carbon and imaged using the University of Oklahoma Cameca SX50 electron probe micro-analyzer equipped with five wavelength-dispersive X-ray spectrometers, integrated energy-dispersive X-ray analyzer, standard Secondary Electron Microscope (SEM) imaging capabilities. The instrument operated at a 20 μkV accelerating voltage, 20 nA current and a 2 μm spot size. These conditions were also maintained for the compositional analyses. Grains were imaged in backscattered electrons (BSE) to understand their zoning, potential compositional variations, and to select regions for quantitative analysis using EPMA and laser techniques (Figure 2). Analytical protocols followed methods developed by [30] and G. Morgan (personal communication) for xenotime with the exception that Pb was analyzed using the Mα emission rather than Mβ, as the Mα line was slightly better at resolving interferences. The element, X-ray emissions and diffracting crystals for analyses are listed in Table 1.
Standards for REEs were ternary rare earth orthophosphates (REP) described by [30]. Durango fluorapatite [31] was used for Ca, galena for Pb, and synthetic ThO2 and depleted pure uranium metal (C.M. Taylor Corp.) was used for Th and U. Natural and synthetic crystalline solids were used for remaining elements. Note that phosphate standards are not available for all desired elements, thus we relied on a variety of standards. Counting times were 30 s on peak for all elements, except Mg and Si, which were 60 s each. Each background was counted for half the time of the peak, therefore total time on background equaled that of the peak. An overlap correction was applied for the Pr Lα emission on the Eu Lα line using the Pr-bearing Rare Earth Phosphate standard-2 (REP2) and analytical methods exactly the same as for Eu Lα. Each analysis required ~15 min. Standards analyzed as unknowns were only measured at the beginning of the analytical session because the beam current did not drift more than 0.2 nA, the laboratory temperature is stable (±1 °F), and compositional data fit the monazite formula (Table 2, Figure 3).
2.3. Llallagua Monazite LA-ICP-MS Analyses
LA-ICP-MS major, minor, and trace element transects of monazite grains were performed at the University of Texas at Austin using a New Wave UP193fx (193 nm, 4–6 ns pulse width) excimer laser coupled to an Agilent 7500ce ICP-MS. Tracks for the laser pits were positioned proximal and parallel to the previously measured EPMA grain transects (Figure 2). Laser ablation parameters optimized from monazite test ablations were 45 s ablations using a 25 μm diameter spot size at 45% power (fluence of ~4.9 J/cm2), 10 Hz repetition rate, and a He cell flow of 250 mL/min. Pulse-to-pulse laser power variation was <3.5% over the analysis period. All spots were pre-ablated for 2 s using a 75 μm spot, 20% laser power, and 10 Hz repletion rate to remove surface contamination (i.e., EPMA carbon coat). The quadrupole time-resolved method involved measurement of 22 analytes at one point per spectral peak, using the integration times of 10 ms (31P and 89Y), 20 ms (23Na, 27Al, 47Ti, 55Mn, 57Fe, 75As, 137Ba, 153Eu, 157Gd, 159Tb, 163Dy, 165Ho, 166Er, 169Tm, 172Yb, and 175Lu) or 30 ms (204Pb, 208Pb, 232Th, and 238U). The resulting sampling period (0.5062 s) corresponded to >90% detection time, enabling 118 measurements to be made within the dwell interval (60 s), conditions suitable for robust measurement [32]. A 45 s gas blank interval was used between all laser measurements.
Monazite analyses were bracketed hourly by triplicate analyses of laser ablation standards NIST-612 and NIST-610 [33] and USGS MAPS-4. See [34,35] for evaluations of the quality of the NIST-612 and NIST-610 glasses. Elemental concentrations were derived with the Iolite software [36] using MAPS-4 as the primary calibration standard and 31P as the internal standard reference. Monazite P concentrations were assigned based on EPMA P2O5 analyses. MAPS-4 is a synthetic trace element-doped Ca3(PO4)2 precipitate [37] with a P content (16.7 ± 1.7 wt %) reasonably similar to the monazite (11.94 wt % from EPMA). Average analyte recoveries were better for NIST-610 (128%) than NIST-612 (156%), but we consider these to be worst case estimates of accuracy considering that the P contents of these standards are ~5000 and ~30,000 times lower than MAPS-4. Analyte concentrations for monazite ablations were predominantly 100 to 1000 times higher than estimated detection limits, and signals for 204Pb were 40 to 155 times higher than detection limits.
Both the EPMA and LA-ICP-MS targeted a wide range of possible elements present in the monazite structure, and both approaches report As, Th, U, Al, Y, Pb, Eu, Gd, Tb, Fe, Mn, and Na contents. A direct comparison of the chemical data for these elements obtained using both LA-ICP-MS and EPMA is inappropriate, however, as significant differences exist in terms of sampling region and detection limits. The EPMA approach relies on the analysis of oxides and halides from the surface of the monazite using X-ray element lines emitted from the mineral structure as a region of the grain was targeted with a 2 μm electron beam, whereas the LA-ICP-MS obtained chemical data sputtered from a 25 μm-diameter circular spot following pre-ablation, and thus data arises from a deeper levels of the mineral not visible in BSE. In some cases, the laser spot overlaps zones of varying brightness or regions where more than one EPMA analysis was obtained (Figure 2). It is appropriate, however, to search for systematic variations. All compositional data and coordinates are available in Supplementary Materials, File S1
Following LA-ICP-MS, grains were re-imaged in secondary electrons (SE) using a JEOL JSM-6490LV SEM at the University of Texas at Austin, Dept. of Geological Sciences. This instrument operated at low vacuum mode, 15 kV accelerating voltage, and a 2 μm spot size. The goal was to identify any ablation craters that intersected secondary alteration features, deformation textures, or microcracks (defined as >5 μm in width). Regions that contain microcracks were examined to compare pre- and post-ablation to ascertain if their origin was due to the laser or are intrinsic to the grain. All imaged spots are seen in Figure 2D–F.
3. Results
3.1. Llallagua Monazite EPMA
Each grain shows oscillatory zoning in BSE (Figure 2), but grain 1 has a bright core, whereas grains 3 and 4 have darker cores. Note that what we define as the mineral core is our best approximation that represents the center of the grains, which may not be precisely exposed. The Llallagua monazite EPMA analyses support stoichiometry close to the ideal mineral formula (Figure 3A,B). The mineral contains Ce2O3 > La2O3 > Nd2O3 > Pr2O3 > Y2O3> Sm2O3 > Eu2O3 > Gd2O3 > Tb2O3 (wt %). As expected, concentrations of ThO2 and UO2 (wt %) are below detection limits with the EPMA methods used (0.18 and 0.13 wt %, respectively). Other oxides present at or below detection are As2O5, TiO2, Al2O3, SO3, PbO, FeO, MnO, MgO, Na2O, and Cl (Table 2).
Silicon is present in the Llallagua samples at levels <0.2 wt % SiO2 (Table 2). The huttonite substitution mechanism for the incorporation of Th in monazite involves Si (ThSiREE-1P-1) [38]. However, this mechanism is inappropriate for these grains, as the Llallagua monazite contains undetectable amounts of radiogenic elements. Additionally, the monazite contains 0.58 ± 0.37 wt % CaO (Table 2; Figure 4A–C) suggesting a slight modification of the brabanite exchange vector (Ca3REE-2 vs. CaThUREE-2) (Figure 3B). This substitution occurs in apatite with a vacancy [39]. Other substitutions that occur in apatite that also appear relevant to this monazite include CaPREE-1Si-1 and CaSiREE-2 (Figure 3C,D).
We detected higher amounts of fluorine in the monazite (average 0.88 ± 0.10 wt %) (Table 2, Figure 4A–C), an element commonly found in apatite [40,41,42]. We found no clear relationship between the amount of F and any cations, perhaps due to its substitution in the anion site or interstitial sites in the monazite structure, creating a degree of disorder. The amount of F does not vary significantly across the monazite grains (Figure 4A–C). We exclude the possibility that F is an analytical artifact, as a monazite grain from the Amelia pegmatite was analyzed using the exact procedure and did not detect F, which would be expected if problematic conditions arose with standards or choice of background and peak [28]. Note that using the TAP monochromator, the F Kα line is effectively free of any overlaps among the analyzed elements.
Oscillatory zoning in the Llallagua monazite is seen using high contrast BSE and is controlled by an interplay of high Z and low Z elements (Figure 5). Darker regions are dominated by higher amounts of P, Si, Y, and Ca, whereas lighter regions contain higher amounts of REE. We found no correlation between a single specific element and brightness of zones within the grains. Although most monazite zoning in BSE is due to the higher atomic masses of Th and U, the Llallagua monazite BSE zoning appears controlled by REE contents. If monazite has REE/P + Si + Y + Ca < 0.85, the region appears darker on the BSE image. If it contains REE/P + Si + Y + Ca > 0.85, the area appears brighter.
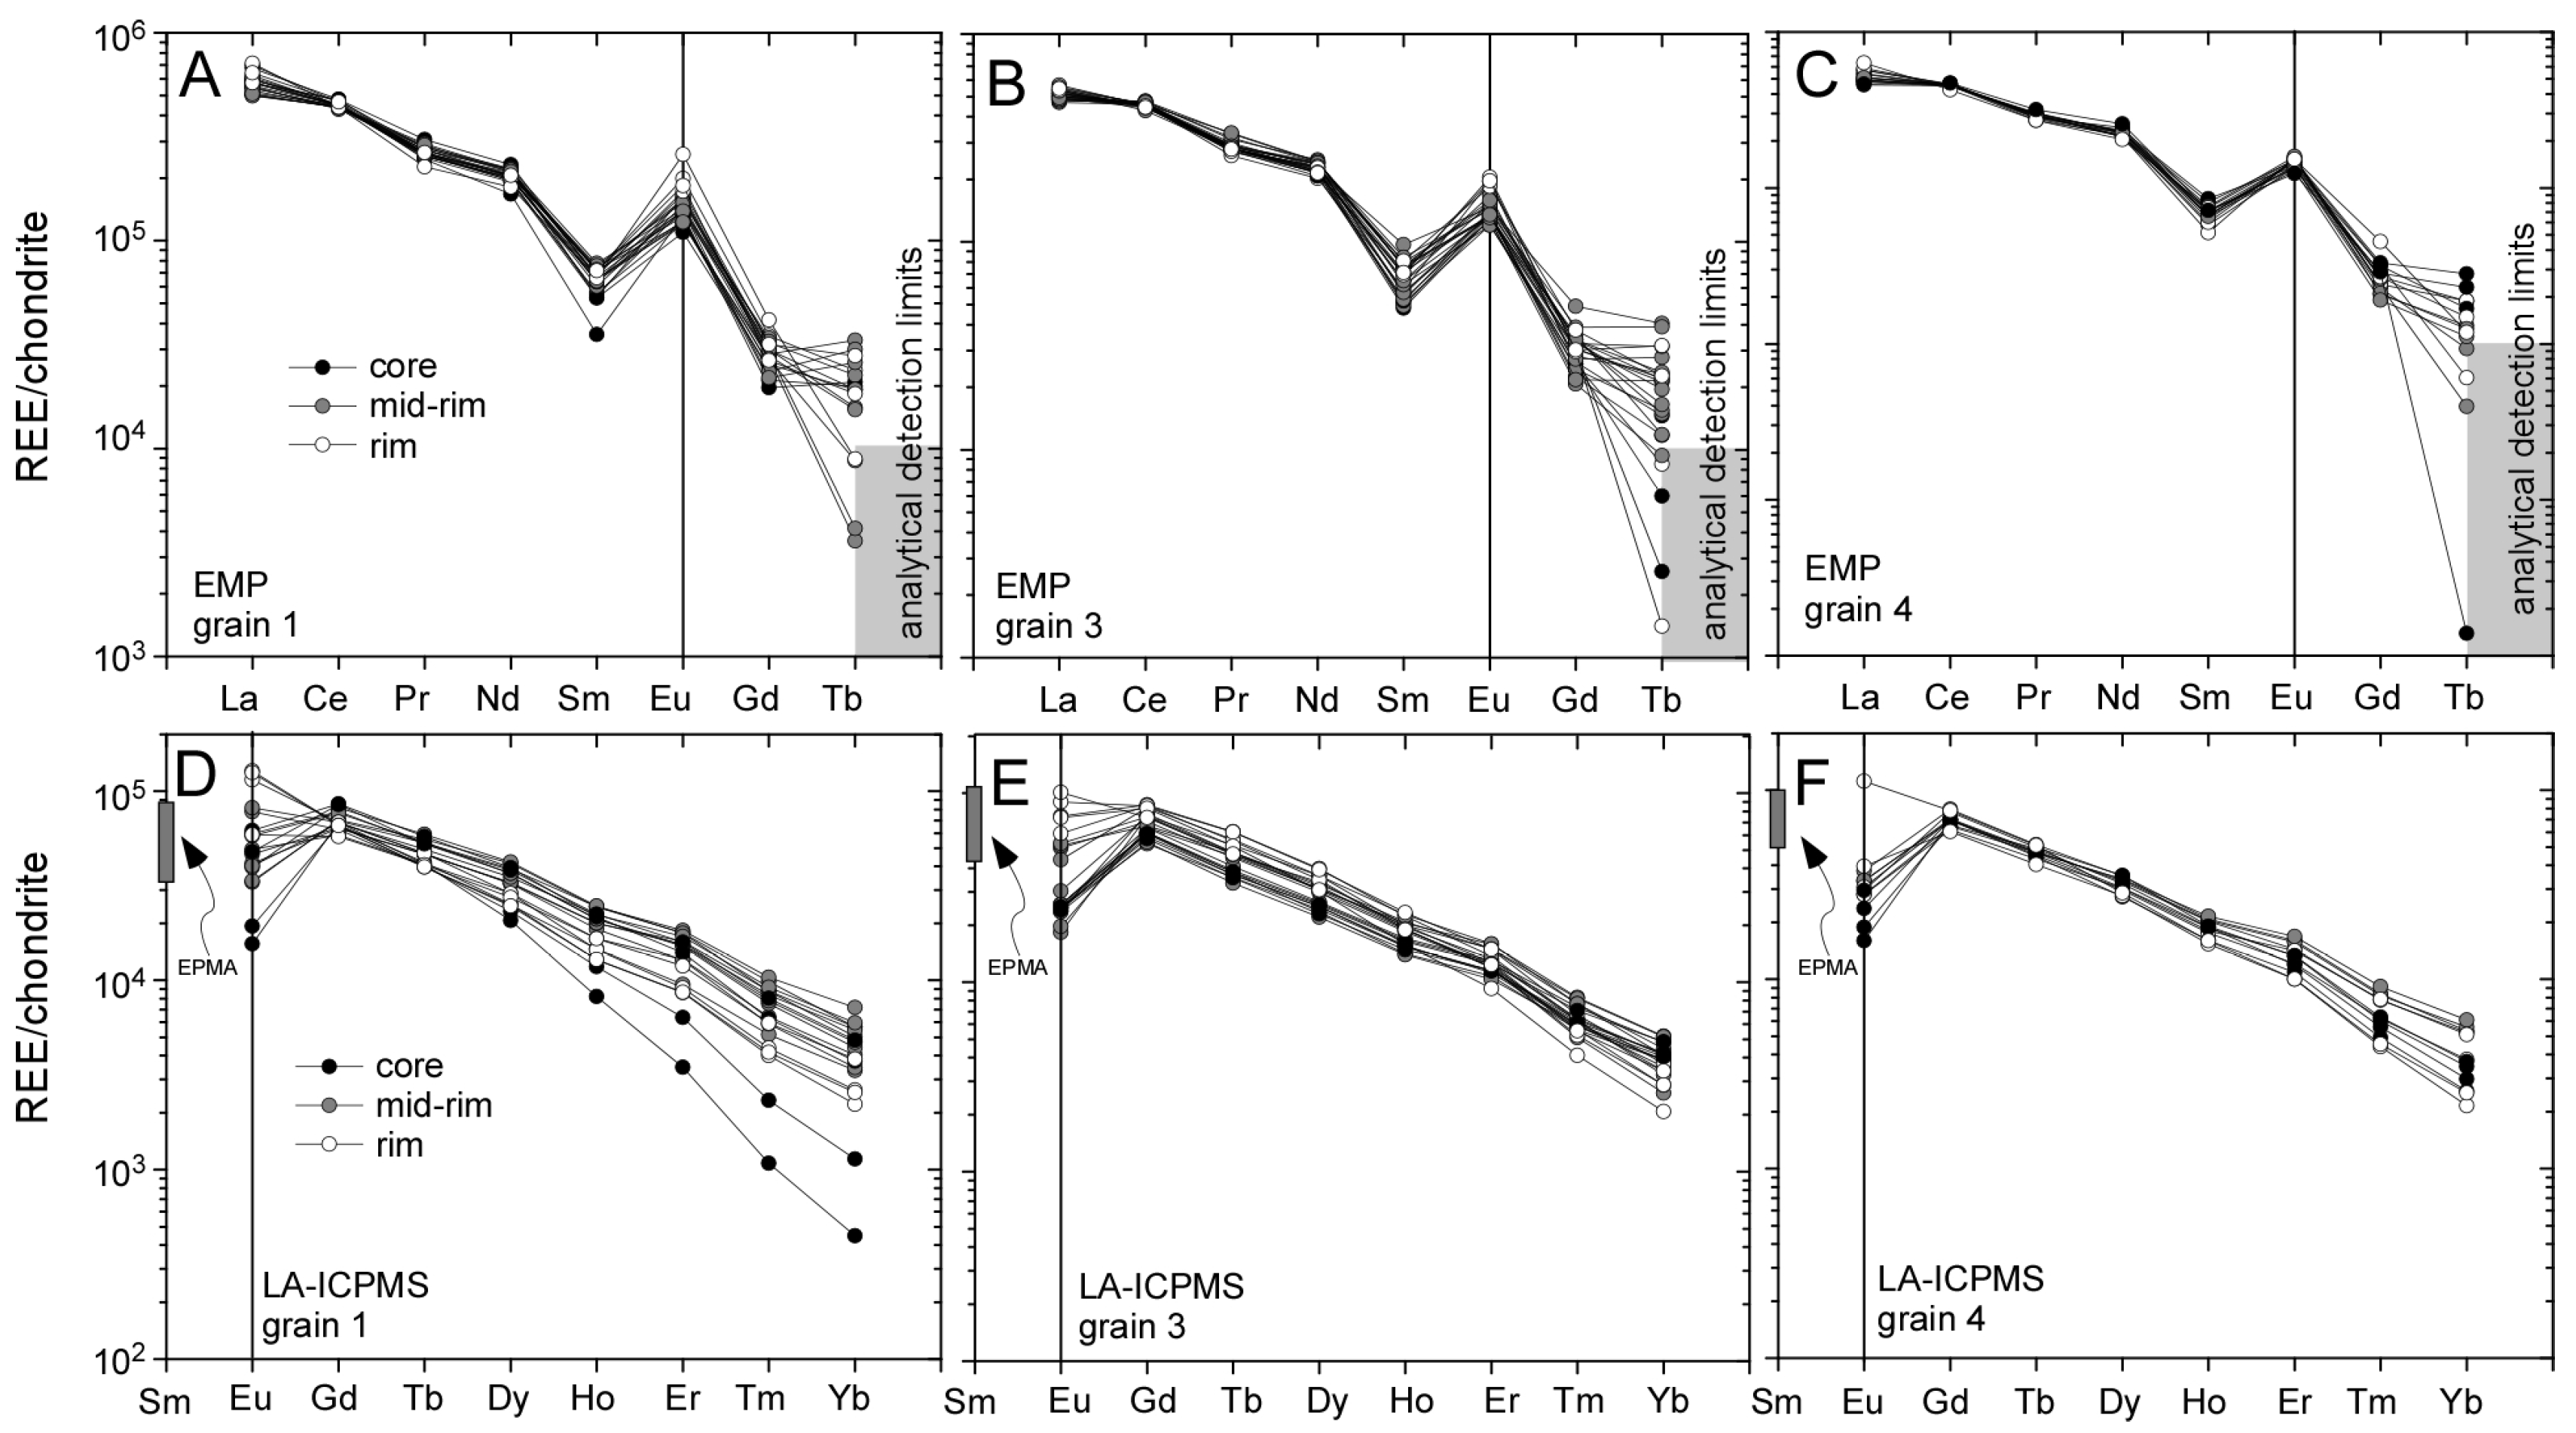
Using the electron microprobe compositions, the Llallagua monazite has CeN < LaN and a positive Eu anomaly (Figure 6A–C). Apatite from the Llallagua deposit also shows a positive Eu anomaly that has been linked to crystallization in a reservoir enriched in Eu [43]. Other monazite grains with positive Eu anomalies and low radiogenic elements have been suggested to be indicative of significant hydrothermal contribution [44]. The amount of Eu2O3 (0.99 ± 0.17 wt %, Table 2, Figure 4A–C) is present at levels similar to the amount of F. We see a slight increase in Eu2O3 from core to rim across the grains, which is not seen in other REEs or Y2O3 (Figure 4A–C).
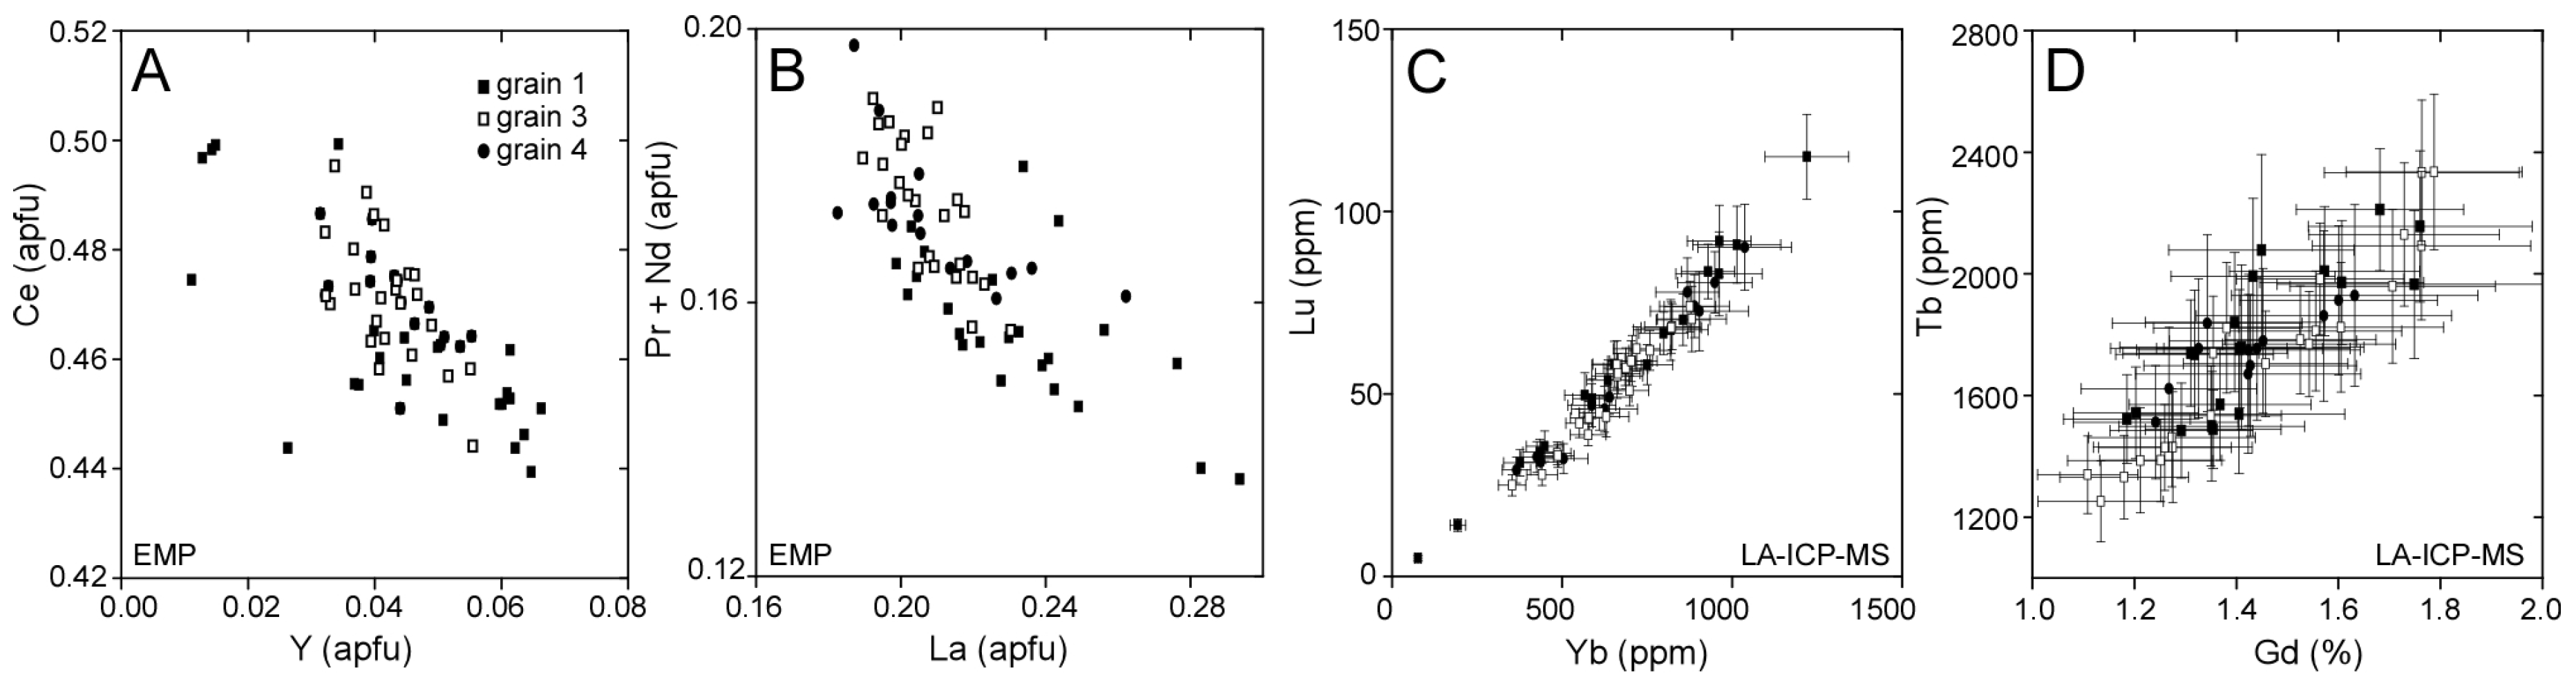
No correlation exists between the chondrite-normalized REE patterns or REE contents of the Llallagua monazite and zoning in BSE. We explored numerous trends with REE compositional data and found general relationships between decreasing Y and increasing Ce, and decreasing La and increasing Nd + Pr (Figure 7A,B). This is likely due to ionic radii of these elements, with Y and heavier REE showing lower affinities for the monazite structure [46,47].
3.2. Llallagua Monazite LA-ICP-MS Analyses
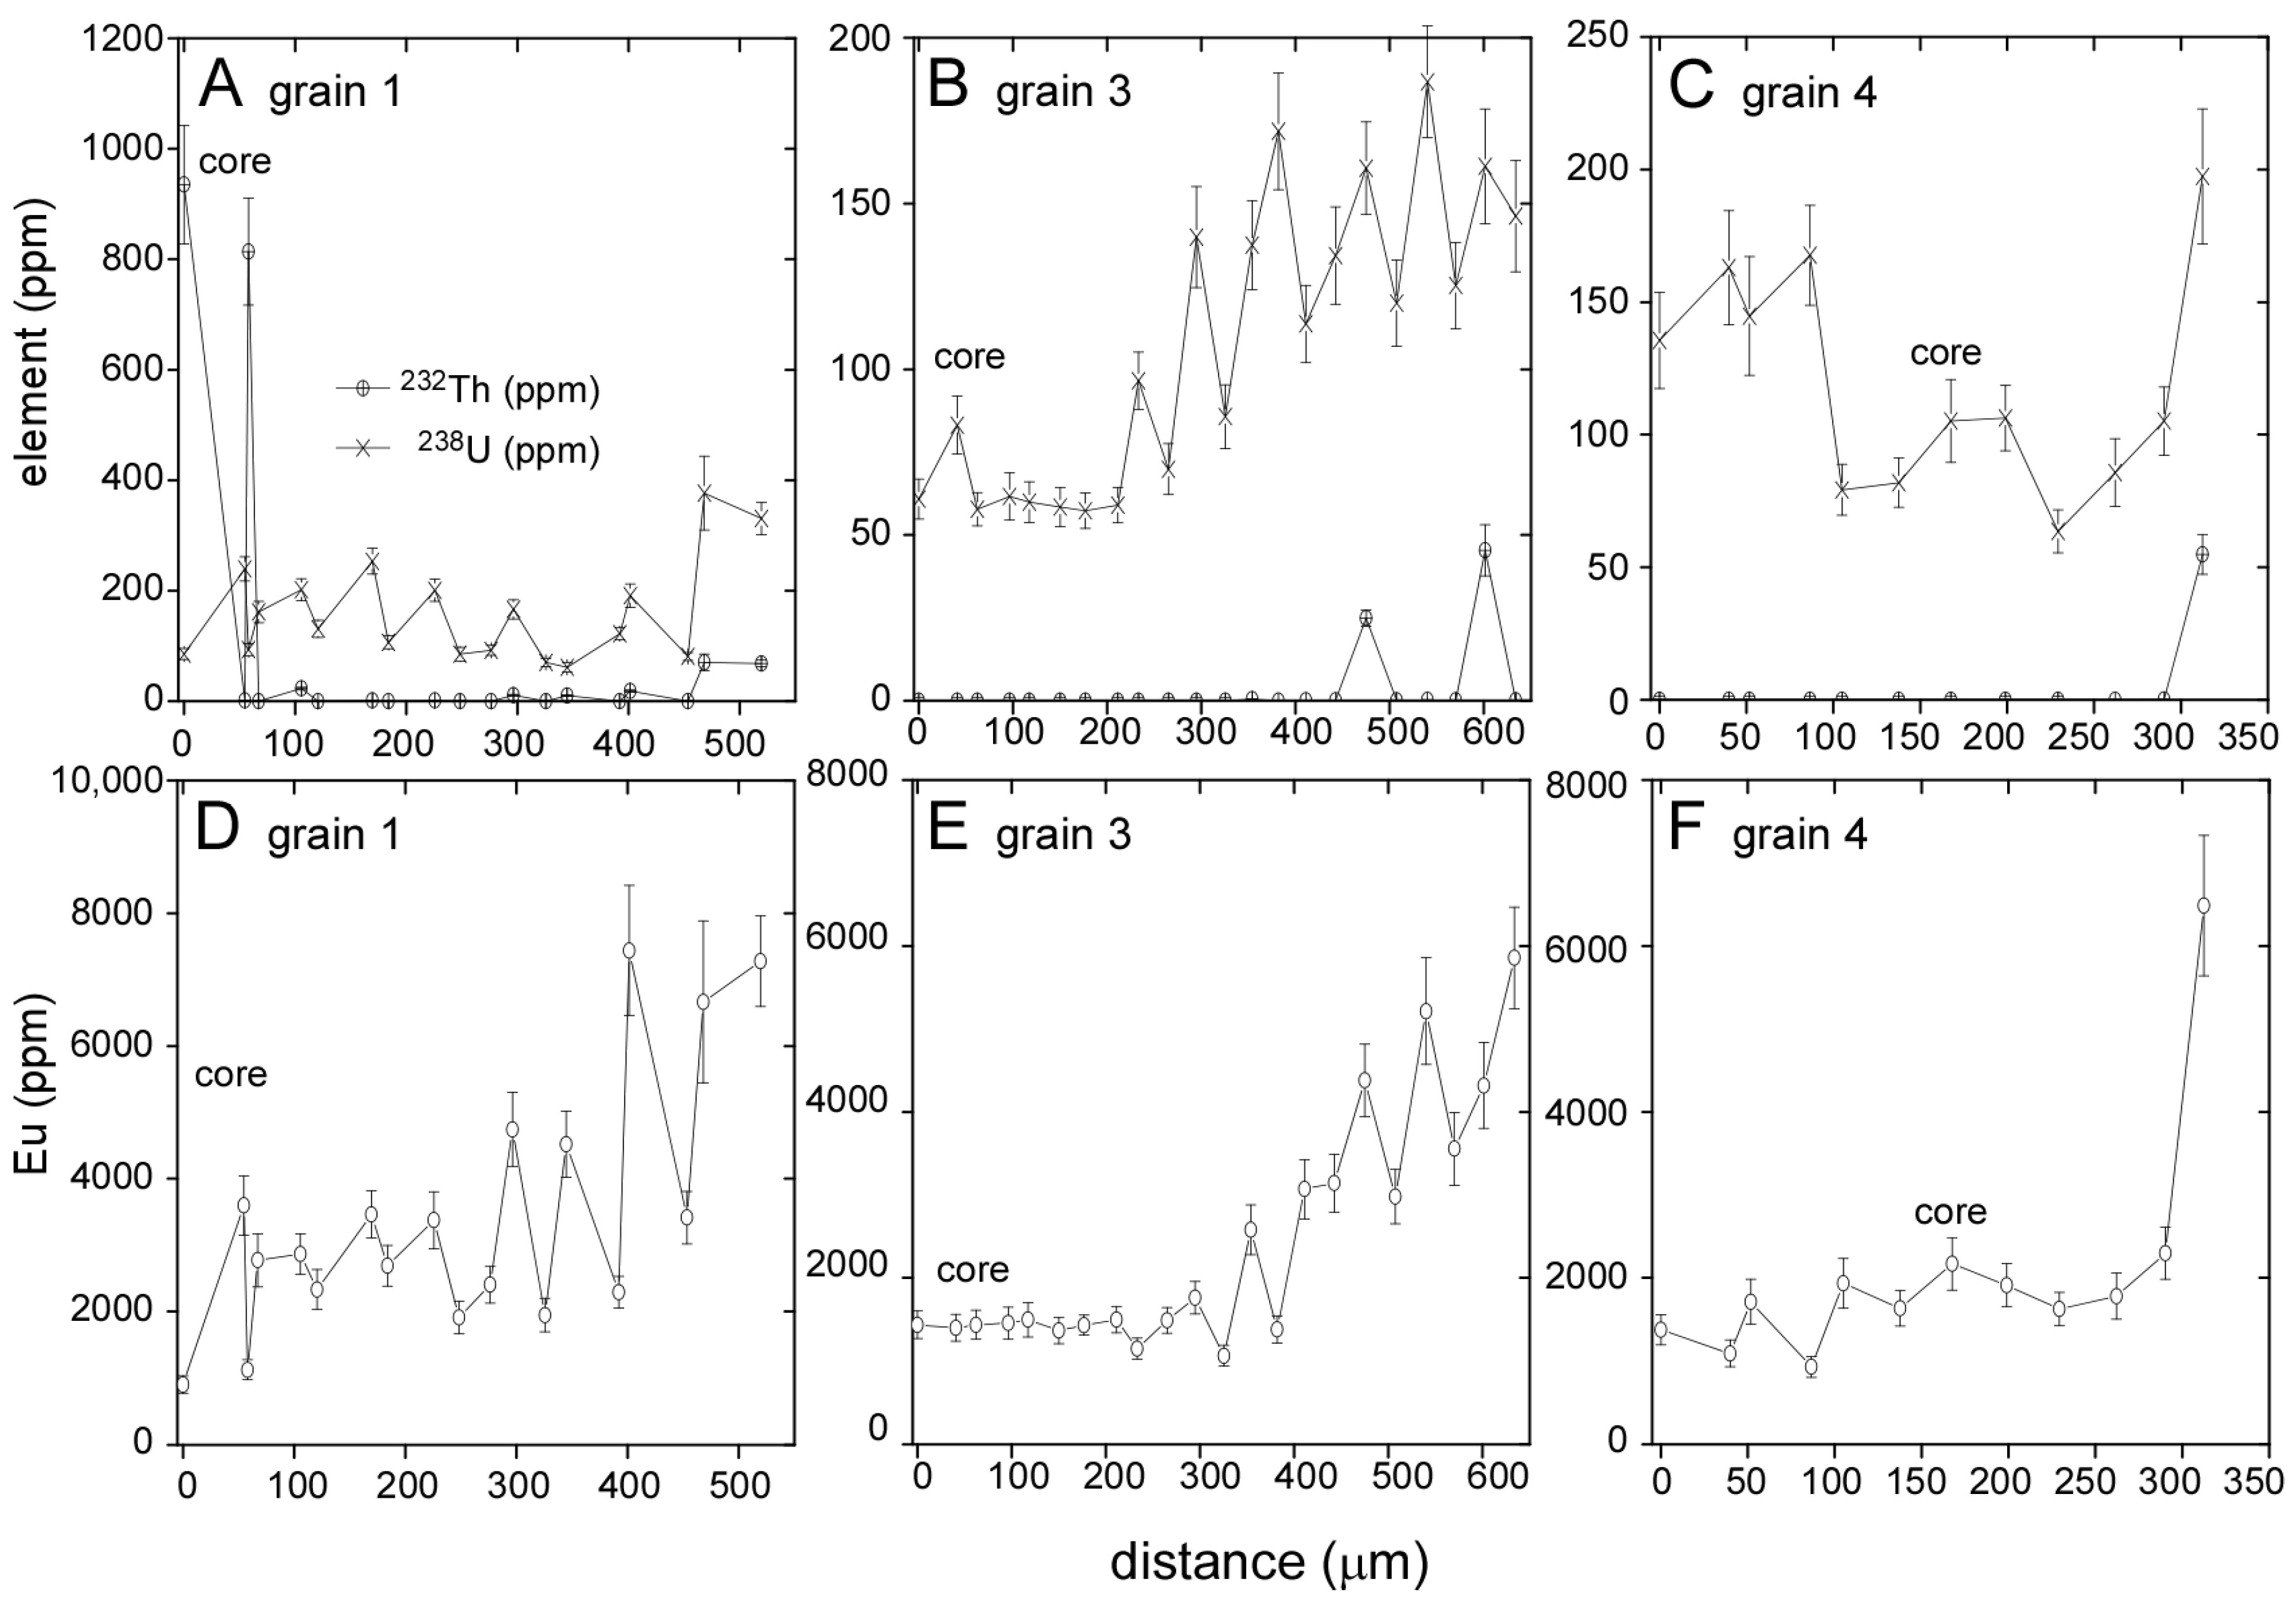
Using LA-ICP-MS, we find the Llallagua monazite shows a wide range of concentrations for many minor and trace elements. The grains contain higher amounts of 238U (123 ± 17 ppm) compared to Th (39 ± 20 ppm) (average of 56 analyses, including uncertainty, ±2σ; Table 3; Figure 8A–C), but a few spots do contain higher Th. The highest Th content we measured is located in the core of grain 1 (935 ± 107 ppm with 85.4 ± 9.9 ppm U, see Supplementary Materials, File S1; ±2σ, Figure 8A). This is also the brightest region in BSE seen in the monazite (Figure 2). We speculate that the higher % common Pb reported for the Llallagua monazite is likely due to the small amounts of radiogenic elements present in the mineral, and thus a lower amount of detectable radiogenic Pb (average 208Pb is 0.5 ± 0.2 ppm) (see also [11]). Other approaches (Secondary Ion Mass Spectrometry) may be able to detect common Pb, and confirm this hypothesis. Other elements present below detection limits are 23Na, 27Al, 47Ti, 55Mn, 57Fe, and 137Ba. Arsenic-75 is present in the monazite at 195 ± 23 ppm (average of 56 analyses, including uncertainty, ±2σ, Table 3). This element has been correlated to monazite S contents [48], but SO3 was not detected using the electron microprobe and not measured using LA-ICP-MS. In addition, the tectonic setting may lend itself to higher amounts of common Pb.
In terms of REE, we find the LA-ICP-MS analyses show Gd > Dy > Eu > Er > Tb > Ho > Yb > Tm > Lu (ppm; Table 3). This differs from the EMP analyses, which yield Eu2O3 > Gd2O3 (wt %). This is likely due to difference in the area sampled during analysis and different detection limits for each approach. The general trends of EPMA and LA-ICP-MS results show overall similar patterns and are consistent with what is expected for the behavior or REE, lending confidence in the LA-ICP-MS results. For example, the amount of Lu (ppm) increases with increasing amounts of Yb (ppm) and Gd (ppm) increases with increasing amounts of Tb (ppm), a function of the atomic radii of these cations (Figure 7C–D). Transects in Y2O3 (wt %) and Y (ppm) (Figure 4) and Eu2O3 (wt %) and Eu (ppm) (Figure 4A–C and Figure 8D–F) show the same general trends. Overall, the amount of Eu (ppm) and U (ppm) increases from core to rim across the grains (Figure 8).
A major difference between the LA-ICP-MS and EPMA is seen with Eu (Figure 6). It is difficult to evaluate the Eu anomaly using LA-ICP-MS data, as we did not measure Sm. If we include Sm data from the EPMA with the LA-ICP-MS HREE data, the results suggests Eu anomaly is negative for core analyses and non-existent to positive at the rim (Figure 6D–F). The approaches do differ in terms of volume of material sampled and thus this trend may not be real. Eumeasured/Euchondrite obtained using LA-ICP-MS increases from core or mid-rim to rim for all grains.
4. Discussion and Conclusions
4.1. Evidence for Hydrothermal Origin
We speculate that the Llallagua monazite precipitated directly from a fluid [15] or via the fluid-mediated replacement of apatite [49]. An alternative origin for these grains is either a primary igneous origin or metamorphism of pre-existing grains. Radiogenic element contents, geochemical signatures, local abundance, and common association with hydrothermal mineral assemblages have been suggested as a means to identify monazite that crystallized from hot, aqueous fluids [50]. We do not have direct field context from these grains, but the role of fluids in the formation of these monazites is supported by field observations by others [5,6,20]. Numerous other phosphate minerals have been reported from the deposit, including xenotime, pyromorphite, vanadinite, vivianite, wavelite, vauxite, paravauxite, metavauxite, augelite, childrenite, diadochite, and florencite-Ce [5,6,15]. Based on their textural relationships observed by others in hand-sample, most of these phosphates are thought to have formed on the large scale via supergene solutions [15]. Monazite and florencite-Ce appear to be the only major sinks for REE in the Llallagua system [5,6], with radiogenic elements likely hosted primarily by zircon and thorite [6].
In addition, monazite grains with low U and/or Th are common in rocks that have experienced significant fluid involvement, including authigenic precipitation (e.g., [27,51,52,53]) or retrograde reactions [54,55,56]. These types of monazites are also found as hydrothermal precipitates [57,58,59] or in carbonatites (e.g., [60,61,62,63]). We would anticipate higher ThO2 content in igneous monazite (3 to >5 wt % ThO2) compared to hydrothermal (0–1 wt % ThO2) [50] or authigenic grains (e.g., 0.63 wt % ThO2, <0.18 wt % UO2) [52]. Although the bright core in monazite grain 1 (Figure 2A) suggests a different origin from the rest of the grain, its sieve-like texture is commonly observed in monazite that has experienced significant fluid involvement [52]. This core may be the result of secondary alteration, but the oscillatory zoning that parallels its boundaries suggests it may be a primary feature. Oscillatory-zoned monazite is also reported primarily from igneous and/or fluid-rich systems (e.g., [12,13,64,65,66]). In both cases, its composition reflects local feedback between the monazite’s growth surface and the fluid supply of elements (e.g., [64]).
4.2. Insight from Compositional Data
The Llallagua monazite contains some of the highest amounts of F reported for the mineral (0.88 ± 0.10 wt % F, Table 2, Figure 4A–C). Fluorine is an unusual element to be found in monazite, with higher amounts being reported in grains affected by secondary fluid-mediated alteration (0.3–0.6 wt %) [67] as well as those found in rare metal ore deposits (0.48 ± 0.07 wt %) [68]. Fluorine is used to charge balance the huttonite substitution [69] and is thought to play a factor in the enrichment of high-Th monazites [70]. Fluorine-rich fluids are an effective medium for transporting Y and REE in a variety of geologic environments [67,68,71,72,73], and appear to have no effect on monazite stability [74]. These types of fluids appear to enhance the mobility of Th compared to U and contribute common Pb to monazite [75]. The Llallagua grains show both higher U/Th ratios and common 206Pb, consistent with this observation. We find F does not vary in concentration from core to rim across the grains (Figure 4A–C).
Fluorapatite is common in the Llallagua mine [5,6,15], and some have speculated that the presence of F in the Llallagua monazite may be due in part of the decomposition of fluorapatite during the final stages of hydrothermal deposition [6,66,76]. Phosphates suggested to form during the dissolution of apatite include wavellite, paravauxite, and childrenite [6]. This process wherein apatite plays a role in the formation of monazite is commonly observed in ore deposits world-wide and can yield monazite with distinctly low amounts of radiogenic elements and higher U/Th, as is observed in these samples [77,78,79,80,81,82]. Alternatively, the presence of F in monazite may be due to early stage crystallization in the presence of F-rich fluids. In the grains we analyzed, we do not see evidence for the direct replacement of apatite in the monazite textures or zoning.
Monazite BSE zoning is controlled by an interplay of high atomic number (Z, REE) and low Z (Si + Ca + P + Y) elements (Figure 5) and cannot be attributed to a single control. The bright core of monazite grain 1 (Figure 2A) has low CaO (0.2–0.4 wt %), which would not be expected if the grain directly replaced existing apatite. The darker cores in grains 3 and 4 have 1.30–1.05 wt % CaO and are surrounded by oscillatory zoning (Figure 2B,C), suggesting precipitation from a fluid containing in this phase. Monazite and apatite in the Llallagua deposit share substitution mechanisms, including Ca3REE-2, CaPREE-1Si-1, and CaSiREE-2 (Figure 3). Their SiO2 (0.17 ± 0.03 wt %) and REE contents may also have been derived from apatite, which is seen in other settings (e.g., [77,78,79,83]). An Eocene Sm-Nd apatite age [24] is ~20 m.y. older than the monazite [7,11], lending support for the hypothesis of monazite precipitation via the dissolution of pre-existing apatite. Apatite and monazite have been shown to yield similar ages in metamorphic and igneous rocks with any age discrepancies associated with fluid-induced retrogression [84].
Apatite and monazite from the Llallagua deposit share positive Eu anomalies seen in the EPMA data set (Figure 6) [43]. If plagioclase was present in the system during a phase of apatite crystallization, the mineral would likely not show this characteristic [85]. Rare plagioclase phenocrysts are found in the volcanic porphyry, but are often replaced by tourmaline, sercite, quartz, kaolinite, cassiterite or pyrite [6,86]. The LA-ICP-MS data are difficult to evaluate due to the lack of the Sm measurement, but the electron microprobe results suggest the grains record a positive Eu anomaly. Monazite with positive Eu anomalies has been reported from banded iron formations [44], carbonatites [87], lower crustal rocks [88,89], and in metamorphic rocks as inclusions in plagioclase [90]. Fluids with strongly positive Eu anomalies are characteristic of highly reducing conditions [91,92,93,94], including back arc basin settings like the Llallagua deposit [95].
Both the EPMA and LA-ICP-MS analyses show the amount of Eu overall in the Llallagua monazite increases from core to rim (Figure 4 and Figure 8), suggesting the mineral sequestered this element from the fluids in which it crystallized. The Eu contents of the monazite grains are high (0.99 ± 0.17 wt % Eu2O3, 2719 ± 400 ppm Eu; Table 2 and Table 3) compared to those from metamorphic settings (<0.5 wt %) [90].
Overall, the monazite compositions reported here can constrain elements of the fluid chemistry, assist with tectonic interpretations, and suggest mineral reactions. We do not have key field or mineralogical contexts for the grains collected, and our comments regarding its tectonic setting should therefore be interpreted with caution. Despite this, the monazite chemistry reported here provides some clues that are useful for interpreting its origin and the origin of others like it. The results are consistent with the Llallagua monazite forming in a highly reducing environment via the direct precipitation of F- and Eu-rich hydrothermal fluids. These elements may have been supplied by the dissolution of flourapatite that formed during an earlier tectonic episode. The positive Eu anomalies seen in the grains lend support for reducing conditions.
Monazite is an important REE ore [96,97,98,99]. Numerous technological devices are reliant on REE components and demand for these elements is projected to increase [99,100,101]. Identifying and characterizing known and potential REE sources are important issues facing the public and policy makers [101,102]. Most monazite ore deposits that are economically viable rare earth resources are placer [97,101,103], with rare primary deposits, which include the Van Rhynsdorp and Naboomspruit in South Africa [104], Front Range in Colorado [105], Mountain Pass in California [106], and Bayan Obo in China [107]. Comparisons of our compositional data with those from major monazite ore localities indicate the grains share characteristics (20–30% Ce2O3; 10% to 40% La2O3, significant amounts of Nd, Pr, and Sm, lesser amounts of Dy, Er, and Ho) [97]. A major environmental concern with the extraction of REEs from monazite is the presence of radiogenic elements [103,108,109,110,111]. Compositional analyses and attempts to date the Llallagua monazite have consistently reported its minor U and Th contents (this study, [5,7,11,15,20]). The low radiogenic element content of the Llallagua monazite may help minimize issues associated with waste management.
Supplementary Materials
The following are available online at https://www.mdpi.com/2079-9276/6/3/36/s1, Excel file of EPMA and LA-ICP-MS analyses of the monazite grains.
Acknowledgments
Source of funding for the study was the UT Austin Jackson School of Geosciences Advisory Council Centennial Teaching Fellowship, which was also used to cover costs to publish with open access. We thank Alfredo Petrov (mindat.org) for supplying the monazite grains analyzed in this study and Isis Garber for analytical assistance. We appreciate analytical assistance and discussions with George Morgan at the University of Oklahoma Electron Microprobe Laboratory. We appreciate editorial handling by Ms. Renee Li, and reviews of the manuscript from Dan Harlov, Gleb Pokrovski, and three anonymous reviewers. We also appreciate assistance from the Jackson School of Geosciences’ Writer-In-Residence, Adam Papendieck.
Author Contributions
E.J.C. conceived and designed the experiments; N.R.M. performed the experiments; E.C. and N.M. analyzed the data; and E.C. wrote the paper.
Conflicts of Interest
The authors declare no conflict of interest. The founding sponsors had no role in the design of the study; in the collection, analyses, or interpretation of data; in the writing of the manuscript, and in the decision to publish the results.
References
- Ahlfeld, F. Zoning in the Bolivian Tin Belt. Econ. Geol. Bull. Soc. Econ. Geol. 1941, 36, 569–588. [Google Scholar] [CrossRef]
- Mlynarczyk, M.J.; Williams-Jones, A.E. The role of collisional tectonics in the metallogeny of the Central Andean tin belt. Earth Planet. Sci. Lett. 2005, 240, 656–667. [Google Scholar] [CrossRef]
- Ahfeld, F.; Schneider-Scherbina, A. Los Yacimientos Minerales y de Hidrocarburos de Bolivia; Ministry of Mines and Petroleum: La Paz, Bolivia, 1964; p. 388.
- Sillitoe, R.H.; Halls, C.C.; Grant, J.N. Porphyry tin deposits in Bolivia. Econ. Geol. Bull. Soc. Econ. Geol. 1975, 70, 913–927. [Google Scholar] [CrossRef]
- Bandy, M.C. Mineralogy of Llallagua, Bolivia. Tucson Gem and Mineral Society: Tucson, AZ, USA, 1976; p. 67. [Google Scholar]
- Hyrsl, J.; Petrov, A. Llallagua, Bolivia. Miner. Rec. 2006, 37, 117–162. [Google Scholar]
- Kempe, U.; Lehmann, B.; Wolf, D.; Rodionov, N.; Bombach, K.; Schwengfelder, U.; Dietrich, A. U/Pb SHRIMP geochronology of Th-poor, hydrothermal monazite: an example from the Llallagua tin porphyry deposit, Bolivia. Geochem. Cosmochim. Acta 2008, 72, 4352–4366. [Google Scholar] [CrossRef]
- Ahlfeld, F. The tin ores of Uncia-Llallagua, Bolivia. Econ. Geol. Bull. Soc. Econ. Geol. 1931, 26, 241–257. [Google Scholar] [CrossRef]
- Turneaure, F.S. The tin deposits of Llallagua, Bolivia. Econ. Geol. Bull. Soc. Econ. Geol. 1935, 30, 14–60. [Google Scholar] [CrossRef]
- Turneaure, F.S. A comparative study of major ore deposits of central Bolivia. Econ. Geol. Bull. Soc. Econ. Geol. 1960, 55, 217–254. [Google Scholar] [CrossRef]
- Kohn, M.J.; Vervoort, J.D. U-Th-Pb dating of monazite by single-collector ICP-MS: Pitfalls and potential. Geochem. Geophys. Geosys. 2008, 9, Q04031. [Google Scholar] [CrossRef]
- Hawkins, D.P.; Bowring, S.A. U-Pb systematics of monazite and xenotime: Case studies from the Paleoproterozoic of the Grand Canyon, Arizona. Contrib. Miner. Pet. 1997, 127, 87–103. [Google Scholar] [CrossRef]
- Crowley, J.L.; Brown, R.L.; Gervais, F.; Gibson, H.D. Assessing inheritance of zircon and monazite in granitic rocks from the Monashee complex Canadian cordillera. J. Pet. 2008, 49, 1915–1929. [Google Scholar] [CrossRef]
- Catlos, E.J. Generalizations about monazite: Implications for geochronologic studies. Am. Mineral. 2013, 98, 819–832. [Google Scholar] [CrossRef]
- Gordon, S.G. The mineralogy of the tin mines of Cerro de Llallagua, Bolivia. Proc. Acad. Nat. Sci. Phila. 1944, 96, 279–359. [Google Scholar]
- Long, K.; Ludington, S.; du Bray, E.; Andre-Ramos, O.; McKee, E.H. Geology and mineral deposits of the La Joya District, Bolivia. Soc. Econ. Geol. News 1992, 10, 13–16. [Google Scholar]
- Grant, J.N.; Halls, C.C.; Avila Salinas, W.W.; Snelling, N.J. K-Ar ages of igneous rocks and mineralization in part of the Bolivian tin belt. Econ. Geol. Bull. Soc. Econ. Geol. 1979, 74, 838–851. [Google Scholar] [CrossRef]
- Lehmann, B. Petrochemical factors governing the metallogeny of the Bolivian tin belt. In Tectonics of the Southern Central Andes, Structure and Evolution of an Active Continental Margin; Reutter, K.J., Scheuber, E., Wigger, P., Eds.; Springe: Berlin, Germany, 1994; pp. 317–326. [Google Scholar]
- Jimenez, N.; Lopez Velasquez, S. Magmatism in the Huarina Belt, Bolivia, and its geotectonic implications. Tectonophys 2008, 459, 85–106. [Google Scholar] [CrossRef]
- Gordon, S.G. Thorium-free monazite from Llallagua, Bolivia. In Academy of Natural Sciences, Philadelphia, Notulae Naturae; The Academy of Natural Sciences: Philadelphia, PA, USA, 1939; Volume 2, pp. 1–7. [Google Scholar]
- Corfu, F. Differential response of U-Pb systems in coexisting accessory minerals, Winnipeg River Subprovince, Canadian Shield: Implications for Archean crustal growth and stabilization. Contrib. Miner. Pet. 1988, 98, 312–325. [Google Scholar] [CrossRef]
- Parrish, R.R. U-Pb dating of monazite and its application to geological problems. Can. J. Earth Sci. 1990, 27, 1431–1450. [Google Scholar] [CrossRef]
- Seydoux-Guillaume, A.; Paquette, J.; Wiedenbeck, M.; Montel, J.; Heinrich, W. Experimental resetting of the U-Th-Pb systems in monazite. Chem. Geol. 2002, 191, 165–181. [Google Scholar] [CrossRef]
- Rakovan, J.; McDaniel, D.K.; Reeder, R.J. Use of surface-controlled REE sectoral zoning in apatite from Llallagua, Bolivia, to determine a single-crystal Sm-Nd age. Earth Planet. Sci. Lett. 1997, 146, 329–336. [Google Scholar] [CrossRef]
- Wolf, D.; Schwengfelder, U.; Bombach, K.; Kempe, U.; Lehmann, B.; Dietrich, A. Pb/Pb single zircon evaporation dating at the Sn porphyry of Llallagua, Bolivia. Terra Nostra 2003, 2, 87. [Google Scholar]
- Dominy, S.C.; Annels, A.E.; Camm, G.; Wheeler, P.; Barr, S. Geology in the resource and reserve estimation of narrow vein deposits. Explor. Min. Geol. 1997, 6, 317–333. [Google Scholar]
- Dominy, S.C.; Camm, G.S. Tin mineralization in south-west England: Nature of veins and controls on ore localization. Proc. Ussher Soc. 1997, 9, 19. [Google Scholar]
- Catlos, E.J.; Miller, N.R. Ion microprobe 208Th-208Pb ages from high common Pb monazite, Morefield Mine, Amelia County, Virginia: Implications for Alleghanian tectonics. Am. J. Sci. 2016, 316, 470–503. [Google Scholar] [CrossRef]
- Montel, J.; Foret, S.; Veschambre, M.; Nicollet, C.; Provost, A. Electron microprobe dating of monazite. Chem. Geol. 1996, 131, 37–53. [Google Scholar] [CrossRef]
- Hetherington, C.J.; Jercinovic, M.J.; Williams, M.L.; Mahan, K. Understanding geologic processes with xenotime: composition, chronology, and a protocol for electron probe microanalysis. Chem. Geol. 2008, 254, 133–147. [Google Scholar] [CrossRef]
- Young, E.; Myers, A.; Munson, E.; Conklin, N. Mineralogy and geochemistry of fluorapatite from Cerro de Mercado, Durango, Mexico. US Geol. Surv. Prof. Pap. 1969, 650, D84–D93. [Google Scholar]
- Longerich, H.P.; Jackson, S.E.; Günther, D. Laser ablation inductively coupled plasma mass spectrometric transient signal data acquisition and analyte concentration calculation. J. Anal. Atom. Spectr. 1996, 11, 899–904. [Google Scholar] [CrossRef]
- Jochum, K.P.; Weis, U.; Stoll, B.; Kuzmin, D.; Yang, Q.; Raczek, I.; Jacob, D.E.; Stacke, A.; Birbaum, K.; Frick, D.A.; Gunther, D.; Enzweiler, J. Determination of reference values for NIST SRM 610—617 glasses following ISO guidelines. Geostand. Geoanal. Res. 2011, 35, 397–429. [Google Scholar] [CrossRef]
- D’Oriano, C.; Da Pelo, S.; Podda, F.; Cioni, R. Laser-ablation inductively coupled plasma mass spectrometry (LA-ICP-MS): setting operating conditions and instrumental performance. Period. Di Miner. 2008, 77, 65–74. [Google Scholar]
- Xu, P.; Guan, H.; Sun, M.; Malps, J. Methodology of trace element in situ analyses using laser ablation inductively coupled plasma mass spectrometry. Yanshi Xuebao Acta Petrol. Sin. 2000, 16, 291–304. [Google Scholar]
- Hellstrom, J.C.; Paton, C.; Woodhead, J.D.; Hergt, J. Iolite: Software for spatially resolved LA-(quad and MC) ICPMS analysis. Miner. Soc. Can. Short Course 2008, 40, 343–348. [Google Scholar]
- Jochum, K.P.; Stoll, B.; Weis, U.; Jacob, D.E.; Mertz Kraus, R.; Andreae, M.O. Non-matrix-matched calibration for the multi-element analysis of geological and environmental samples using 200 nm Femtosecond LA-ICP-MS: A comparison with nanosecond lasers. Geostand. Geoanal. Res. 2014, 38, 265–292. [Google Scholar] [CrossRef]
- Della Ventura, G.; Mottana, A.; Parodi, G.C.; Raudsepp, M.; Bellatreccia, F.; Caprilli, E.; Rossi, P.; Fiori, S. Monazite-huttonite solid-solutions from the Vico volcanic complex, Latium, Italy. Mineral. Mag. 1996, 60, 751–758. [Google Scholar] [CrossRef]
- Ronsbo, J.G. Coupled substitutions involving REEs and Na and Si in apatites in alkaline rocks from the Ilimaussaq intrusion, South Greenland, and the petrologic implications. Am. Mineral. 1989, 74, 896–901. [Google Scholar]
- Stormer, J.C.; Carmichael, I.E. Fluorine-hydroxyl exchange in apatite and biotite: A potential igneous geothermometer. Contrib. Miner. Petrol. 1971, 31, 121–131. [Google Scholar] [CrossRef]
- Smith, M.P.; Yardley, B.W.D. Fluid evolution during metamorphism of the Otago schist, New Zealand: (II) Influence of detrital apatite on fluid salinity. J. Metamorph. Geol. 1999, 17, 187–193. [Google Scholar] [CrossRef]
- Pyle, J.M.; Spear, F.S.; Wark, D.A. Electron microprobe analysis of REE in apatite, monazite and xenotime: Protocols and pitfalls. Rev. Miner. Geochem. 2002, 48, 337–362. [Google Scholar] [CrossRef]
- Roeder, P.L.; MacArthur, D.; Ma, X.; Palmer, G.R.; Mariano, A.N. Cathodoluminescence and microprobe study of rare-earth elements in apatite. Am. Mineral. 1987, 72, 801–811. [Google Scholar]
- Bowins, R.J.; Crocket, J.H. Monazite, xenotime and REE minerals in Archean banded iron-formation from the Sherman and Adams mines, Ontario, Canada. Can. Mineral. 2011, 49, 749–763. [Google Scholar] [CrossRef]
- Sun, S.-S.; McDonough, W.F. Chemical and isotopic systematic of ocean basalts: Implications for mantle composition and processes. Geol. Soc. Lond. Special Pub. 1989, 42, 313–345. [Google Scholar] [CrossRef]
- Mohr, D.W. Zoned porphyroblasts of metamorphic monazite in the Anakeesta Formation, Great Smoky Mountains, North Carolina. Am. Mineral. 1984, 69, 98–103. [Google Scholar]
- Spear, F.S.; Pyle, J.M. Apatite, monazite, and xenotime in metamorphic rocks. Rev. Miner. Geochem. 2002, 48, 293–335. [Google Scholar] [CrossRef]
- Uher, P.; Ondrejka, M.; Broska, I. S and As in accessory monazite: A role of “clinoanhydrite” and gasparite substitution. In Proceedings of the European Geosciences Union, Research Abstracts, Vienna, Austria, 15–20 April 2007; Volume 9, p. 09146. [Google Scholar]
- Betkowski, W.B.; Harlov, D.E.; Rakovan, J. Hydrothermal mineral replacement reactions for an apatite-monazite assemblage in alkali-rich fluids. In Proceedings of the Goldschmidt Conference, Sacramento, CA, USA, 8–13 June 2014; p. 193. [Google Scholar]
- Schandl, E.S.; Gorton, M. A textural and geochemical guide to the identification of hydrothermal monazite: Criteria for selection of samples for dating epigenetic hydrothermal ore deposits. Econ. Geol. Bull. Soc. Econ. Geol. 2004, 99, 1027–1035. [Google Scholar] [CrossRef]
- Cabella, R.; Lucchetti, G.; Marescotti, P. Authigenic monazite and xenotime from pelitic metacherts in pumpellyite-actinolite-facies conditions, Sestri-Voltaggio zone, central Liguria, Italy. Can. Mineral. 2001, 39, 717–727. [Google Scholar] [CrossRef]
- Čopjaková, R.; Novak, M.; Francu, E. Formation of authigenic monazite-(Ce) to monazite-(Nd) from upper carboniferous graywackes of the drahany upland: Roles of the chemical composition of host rock and burial temperature. Lithos 2011, 127, 373–385. [Google Scholar] [CrossRef]
- Alipour-Asll, M.M.; Mirnejad, H.H.; Milodowski, A.E. Occurrence and paragenesis of diagenetic monazite in the Upper Triassic black shales of the Marvast region, South Yazd, Iran. Miner. Petrol. 2012, 104, 197–210. [Google Scholar] [CrossRef]
- Dahl, P.S.; Terry, M.P.; Jercinovic, M.J.; Williams, M.L.; Hamilton, M.A.; Foland, K.A.; Clement, S.M.; Friberg, L.M. Electron probe (Ultrachron) microchronometry of metamorphic monazite: Unraveling the timing of polyphase thermotectonism in the easternmost Wyoming Craton (Black Hills, South Dakota). Am. Mineral. 2005, 90, 1712–1728. [Google Scholar] [CrossRef]
- Gasser, D.; Bruand, E.; Rubatto, D.; Stuewe, K. The behaviour of monazite from greenschist facies phyllites to anatectic gneisses: An example from the Chugach metamorphic complex, southern Alaska. Lithos 2012, 134–135, 108–122. [Google Scholar] [CrossRef] [PubMed]
- Rasmussen, B.; Muhling, J.R. Reactions destroying detrital monazite in greenschist facies sandstones from the Witwatersrand Basin, South Africa. Chem. Geol. 2009, 264, 311–327. [Google Scholar] [CrossRef]
- Torab, F.M.; Lehmann, B.B. Magnetite-apatite deposits of the Bafq district, central Iran: Apatite geochemistry and monazite geochronology. Mineral. Mag. 2007, 71, 347–363. [Google Scholar] [CrossRef]
- Mercadier, J.; Skirrow, R.G.; Cross, A.J. Uranium and gold deposits in the Pine Creek Orogen (North Australian Craton): a link at 1.8 Ga? Precamb. Res. 2013, 238, 111–119. [Google Scholar] [CrossRef]
- Pandey, M.; Pant, N.C.; Kumar, S. Criteria to distinguish between regional and contact zone monazite: A case study from Proterozoic north Delhi fold belt (NDFB), India. Episodes 2013, 36, 275–289. [Google Scholar]
- Wall, F.; Mariano, A.N. Rare earth minerals in carbonatites: A discussion centered on the Kangankunde Carbonatite, Malawi. In Rare Earth Minerals: Chemistry, Origin and ore Deposits; Jones, A.P., Wall, F., Williams, T.C., Eds.; Chapman and Hall, Mineralogical Society Series: London, UK, 1996; pp. 193–225. [Google Scholar]
- Cressey, G.G.; Wall, F.; Cressey, B.A. Differential REE uptake by sector growth of monazite. Mineral. Mag. 1999, 63, 813–828. [Google Scholar] [CrossRef]
- Pilipiuk, A.N.; Ivanikov, V.V.; Bulakh, A.G. Unusual rocks and mineralisation in a new carbonatite complex at Kandaguba, Kola Peninsula, Russia. Lithos 2001, 56, 333–347. [Google Scholar] [CrossRef]
- Catlos, E.J.; Dubey, C.S. Sivasubramanian, Monazite ages from carbonatites and high-grade assemblages along the Kambam Fault Southern Granulite Terrain, South India. Am. Mineral. 2008, 93, 1230–1244. [Google Scholar] [CrossRef]
- Shore, M.; Fowler, A.D. Oscillatory zoning in minerals: A common phenomenon. Can. Mineral. 1996, 34, 1111–1126. [Google Scholar]
- Schaltegger, U.; Fanning, C.M.; Günther, D.; Maurin, J.C.; Schulmann, K.; Gebauer, D. Growth, annealing and recrystallization of zircon and preservation of monazite in high-grade metamorphism: Conventional and in situ U–Pb isotope, cathodoluminescence and microchemical evidence. Contrib. Mineral. Petrol. 1999, 134, 186–201. [Google Scholar] [CrossRef]
- Couëslan, C.G.; Pattison, D.M.; Dufrane, S. Paleoproterozoic metamorphic and deformation history of the Thompson nickel belt, Superior boundary zone, Canada, from in situ U-Pb analysis of monazite. Precamb. Res. 2013, 237, 13–35. [Google Scholar] [CrossRef]
- Hetherington, C.J.; Harlov, D.E. Metasomatic thorite and uraninite inclusions in xenotime and monazite from granitic pegmatites, Hidra anorthosite massif, southwestern Norway: Mechanics and fluid chemistry. Am. Mineral. 2008, 93, 806–820. [Google Scholar] [CrossRef]
- Sheard, E.R.; Williams-Jones, A.E.; Heiligmann, M.; Pederson, C.; Trueman, D.L. Controls on the concentration of zirconium, niobium, and the rare earth elements in the Thor Lake rare metal deposit, Northwest Territories, Canada. Econ. Geol. Bull. Soc. Econ. Geol. 2012, 107, 81–104. [Google Scholar] [CrossRef]
- Kucha, H. Continuity in the monazite-huttonite series. Mineral. Mag. 1980, 43, 1031–1034. [Google Scholar] [CrossRef]
- Watt, G.R. High-thorium monazite-(Ce) formed during disequilibrium melting of metapelites under granulite-facies conditions. Mineral. Mag. 1995, 59, 735–743. [Google Scholar] [CrossRef]
- Keppler, H. Influence of fluorine on the enrichment of high field strength trace elements in granitic rocks. Contrib. Mineral. Petrol. 1993, 114, 479–488. [Google Scholar] [CrossRef]
- Papoutsa, A.D.; Pe-Piper, G. The relationship between REE-Y-Nb-Th minerals and the evolution of an A-type granite, Wentworth Pluton, Nova Scotia. Am. Mineral. 2013, 98, 444–462. [Google Scholar] [CrossRef]
- Tropper, P.P.; Harlov, D.E.; Manning, C.E. Ce-monazite and Y-xenotime solubilities in H2O-NaF at 800 °C, 1 GPa: Implications for REE transport. Mineral. Mag. 2013, 77, 2358. [Google Scholar]
- Duc-Tin, Q.; Keppler, H. Monazite and xenotime solubility in granitic melts and the origin of the lanthanide tetrad effect. Contrib. Mineral. Petrol. 2015, 169. [Google Scholar] [CrossRef]
- Didier, A.A.; Bosse, V.V.; Boulvais, P.P.; Bouloton, J.J.; Paquette, J.L.; Montel, J.M.; Devidal, J.L. Disturbance versus preservation of U-Th-Pb ages in monazite during fluid-rock interaction: Textural, chemical and isotopic in situ study in microgranites (Velay Dome, France). Contrib. Mineral. Petrol. 2013, 165, 1051–1072. [Google Scholar] [CrossRef]
- Harlov, D.E.; Förster, H. Fluid-induced nucleation of (Y+REE)-phosphate minerals within apatite: Nature and experiment. Part II, Fluorapatite. Am. Mineral. 2003, 88, 1209–1229. [Google Scholar] [CrossRef]
- Pan, Y.Y.; Fleet, M.E.; MacRae, N.D. Oriented monazite inclusions in apatite porphyroblasts from the Hemlo gold deposit, Ontario, Canada. Mineral. Mag. 1993, 57, 697–707. [Google Scholar] [CrossRef]
- Harlov, D.E.; Förster, H. High-grade fluid metasomatism on both a local and a regional scale: The Seward Peninsula, Alaska, and the Val Strona di Omegna, Ivrea-Verbano Zone, Northern Italy. Part II: Phosphate mineral chemistry. J. Petrol. 2002, 43, 801–824. [Google Scholar] [CrossRef]
- Harlov, D.E.; Andersson, U.B.; Förster, H.; Nystrom, J.; Dulski, P.; Broman, C. Apatite-monazite relations in the Kiirunavaara magnetite-apatite ore, northern Sweden. Chem. Geol. 2002, 191, 47–72. [Google Scholar] [CrossRef]
- Ziemann, M.A.; Förster, H.; Harlov, D.E.; Frei, D. Origin of fluorapatite-monazite assemblages in a metamorphosed, sillimanite-bearing pegmatoid, Reinbolt Hills, East Antarctica. Eur. J. Miner. 2005, 17, 567–579. [Google Scholar] [CrossRef]
- Finger, F.F.; Krenn, E.E. Three metamorphic monazite generations in a high-pressure rock from the Bohemian Massif and the potentially important role of apatite in stimulating polyphase monazite growth along a PT loop. Lithos 2007, 95, 103–115. [Google Scholar] [CrossRef]
- Bonyadi, Z.; Davidson, G.J.; Mehrabi, B.; Meffre, S.; Ghazban, F. Significance of apatite REE depletion and monazite inclusions in the brecciated Se-Chahun iron oxide-apatite deposit, Bafq district, Iran: Insights from paragenesis and geochemistry. Chem. Geol. 2011, 281, 253–269. [Google Scholar] [CrossRef]
- Ayres, M.; Harris, N. REE fractionation and Nd-isotope disequilibrium during crustal anatexis: Constraints from Himalayan leucogranites. Chem. Geol. 1997, 139, 249–269. [Google Scholar] [CrossRef]
- Berger, M.; Braun, I. Pb-Pb dating of apatite by a stepwise dissolution technique. Chem. Geol. 1997, 142, 23–40. [Google Scholar] [CrossRef]
- Cawthorn, R.G. Rare earth element abundances in apatite in the Bushveld Complex: A consequence of the trapped liquid shift effect. Geology 2013, 41, 603–606. [Google Scholar] [CrossRef]
- Hyrsl, J.; Petrov, A. Pseudomorphs from Bolivia a review. Rocks Miner. 1998, 73, 410–414. [Google Scholar] [CrossRef]
- Kim, S.; Lee, H.; Yin, J.; Park, J. Chemistry and origin of monazites from carbonatite dikes in the Hongcheon-Jaeun district, Korea. J. Asian Earth Sci. 2005, 25, 57–67. [Google Scholar] [CrossRef]
- Dumond, G.; Williams, M.; Goncalves, P.; Jercinovic, M. Monazite as a monitor of melting, garnet growth, and feldspar recrystallization in continental lower crust: Athabasca granulite terrane, western Canadian Shield. In Proceedings of the Geological Society of America Annual Meeting, Houston, TX, USA, 5 October 2008; p. 206. [Google Scholar]
- Goncalves, P.; Trap, P.; Dumond, G.; Marquer, D.; Feybesse, J.; Paquette, J. Monazite as a monitor of melting in continental crust. In Proceedings of the Geological Society of America Annual Meeting, Minneapolis, MN, 9–12 October 2011; p. 330. [Google Scholar]
- Zhu, X.K.; O’Nions, R.K. Monazite chemical composition: Some implications for monazite geochronology. Contrib. Miner. Petrol. 1999, 137, 351–363. [Google Scholar] [CrossRef]
- Moeller, E. Eu anomalies in hydrothermal minerals: Kinetic versus thermodynamic interpretation. In Proceedings of the Ninth Quadrennial IAGOD Symposium, Beijing, China, 12–18 August 1994; Schweizerbart science publishers: Stuttgart, Germany, 1998; Volume 9, pp. 239–246. [Google Scholar]
- Wood, S.A. The geochemistry of rare earth elements and yttrium in geothermal waters. Special Pub. Soc. Econ. Geol. 2003, 10, 133–158. [Google Scholar]
- Bao, S.; Zhou, H.; Peng, X.; Ji, F.; Yao, H. Geochemistry of REE and yttrium in hydrothermal fluids from the Endeavour segment, Juan de Fuca Ridge. Geochem. J. 2008, 42, 359–370. [Google Scholar] [CrossRef]
- Schmidt, K.K.; Garbe-Schonberg, D.D.; Bau, M.M.; Koschinsky, A.A. Rare earth element distribution in >400 degrees C hot hydrothermal fluids from 5 degrees S, MAR: The role of anhydrite in controlling highly variable distribution patterns. Geochim. Cosmochim. Acta 2010, 74, 4058–4077. [Google Scholar] [CrossRef]
- Douville, E.; Charlou, J.L.; Oelkers, E.H.; Bienvenu, P.P.; Jove Colon, C.F.; Donval, J.P.; Fouquet, Y.; Prieur, D.; Appriou, P. The Rainbow Vent fluids (36°14′N, MAR): The influence of ultramafic rocks and phase separation on trace metal content in Mid-Atlantic Ridge hydrothermal fluids. Chem. Geol. 2002, 184, 37–48. [Google Scholar] [CrossRef]
- Xu, Y. Magnetically recoverable rare-metal-rich rutile and monazite in ore and tailings of the Climax and Henderson molybdenum mines. Master’s Thesis, Purdue University, West Lafayette, IN, USA, 1992. [Google Scholar]
- Gupta, C.K.; Krishnamurthy, N. Extractive Metallurgy of Rare Earths; CRC Press: Boca Raton, FL, USA, 2004; p. 504. [Google Scholar]
- Long, K.R.; Van Gosen, B.S.; Foley, N.K.; Cordier, D. The Principal Rare Earth Elements Deposits of the United States—A Summary of Domestic Deposits and a Global Perspective; USGS Scientific Investigations Report 2010-5220; USGS: Reston, VA, USA, 2010; p. 96.
- Chakhmouradian, A.R.; Wall, F. Rare earth elements: Minerals, mines, magnets (and more). Elements 2012, 8, 333–340. [Google Scholar] [CrossRef]
- Lambert, I.; Miezitis, Y.; Mackowski, S.; McKay, A. Australia’s rare earth resources in global context. In International Geological Congress, Abstracts—Congres Geologique International, Resumes; International Geological Congress: Oslo, Norway, 2008; Volume 33, Abstract 1342645. [Google Scholar]
- Environmental Protection Agency. Rare Earth Elements: A Review of Production, Processing, Recycling, and Associated Environmental Issues; US Environmental Protection Agency: Washington, DC, USA, 2012; EPA600/R-12/572; p. 96.
- Gambogi, J. Rare earths. In U.S. Geological Survey Mineral Commodity Summaries; U.S. Geological Survey: Reston, VA, USA, 2013; pp. 128–129. [Google Scholar]
- Palaparthi, J.; Chakrabarti, R.; Banerjee, D.; Guin, R.; Ghosal, S.; Agrahari, S.; Sengupta, D. Economically viable rare earth element deposits along beach placers of Andhra Pradesh, eastern coast of India. Arab J. Geosci. 2017, 10. [Google Scholar] [CrossRef]
- Pike, D.R. Thorium and rare earth bearing minerals in the Union of South Africa. In Proceedings of the United Nations International Conference on Peaceful Uses of Atomic Energy, Geneva, Switzerland, 1–13 September 1958; pp. 91–96. [Google Scholar]
- Young, E.J.; Sims, P.K. Petrography and Origin of Xenotime and Monazite Concentrations, Central City District, Colorado; U.S. Geological Survey Bulletin; USGS: Reston, VA, USA, 1961; pp. 273–299.
- Mariano, A.N.; Mariano, A.R. Rare earth mining and exploration in North America. Elements 2012, 8, 369–376. [Google Scholar] [CrossRef]
- LeBas, M.J.; Keller, J.J.; Kejie, T.; Wall, F.F.; Williams, C.T.; Zhang, P. Carbonatite dykes at bayan Obo, inner Mongolia, China. Miner. Pet. 1992, 46, 195–228. [Google Scholar] [CrossRef]
- Hutchinson, D.E.; Toussaint, L.F. Near-surface disposal of concentrated NORM wastes. Appl. Radiat. Isot. 1998, 49, 265–271. [Google Scholar] [CrossRef]
- Paschoa, A.S. Potential environmental and regulatory implications of naturally occurring radioactive materials (NORM). Appl. Radiat. Isot. 1998, 49, 189–196. [Google Scholar] [CrossRef]
- Padmanabhan, V.T. Radioactive minerals and private sector mining. Econ. Political Wkly. 2002, 37, 4365–4367. [Google Scholar]
- Paschoa, A.S.; Dias da Cunha, K. A critical look at NORM in the monazite cycle. In Proceedings of the American Institute of Physics Conference Proceedings, Rio de Janeiro, Brazil, 7–12 October 2007; pp. 119–123. [Google Scholar]
Figure 1.
Geological map and cross-section of the La Joya mining district after [16]. Inset shows the location of the mining district within the tin belt of Bolivia, Peru, and Argentina after [7].

Figure 2.
Backscattered electron (BSE) images of Llallagua monazite: (A) grain 1; (B) grains 2 and 3; and (C) grain 4. Electron probe microanalysis (EPMA) and laser ablation pits are indicated with some spot numbers labeled for reference. Secondary electron (SE) images showing laser ablation pits of Llallagua monazite: (D) grain 1; (E) grain 3; and (F) grain 4. Pits are labeled. See the Supplementary Materials, File S1 for compositions.

Figure 3.
Plot of monazite EPMA compositions (see Supplementary Materials, File S1): (A) Rare Earth Element (REE) (atoms per formula unit, apfu) vs. P (apfu); (B) 3Ca (apfu) vs. 2(REE + Y) (apfu); (C) REE + Si (apfu) vs. Ca + P (apfu); and (D) Ca + Si vs. 2REE (apfu). Box in panels A and B indicates the region of ideal monazite formula. REE are La, Ce, Pr, Nd, Sm, Eu, Gd, and Tb.
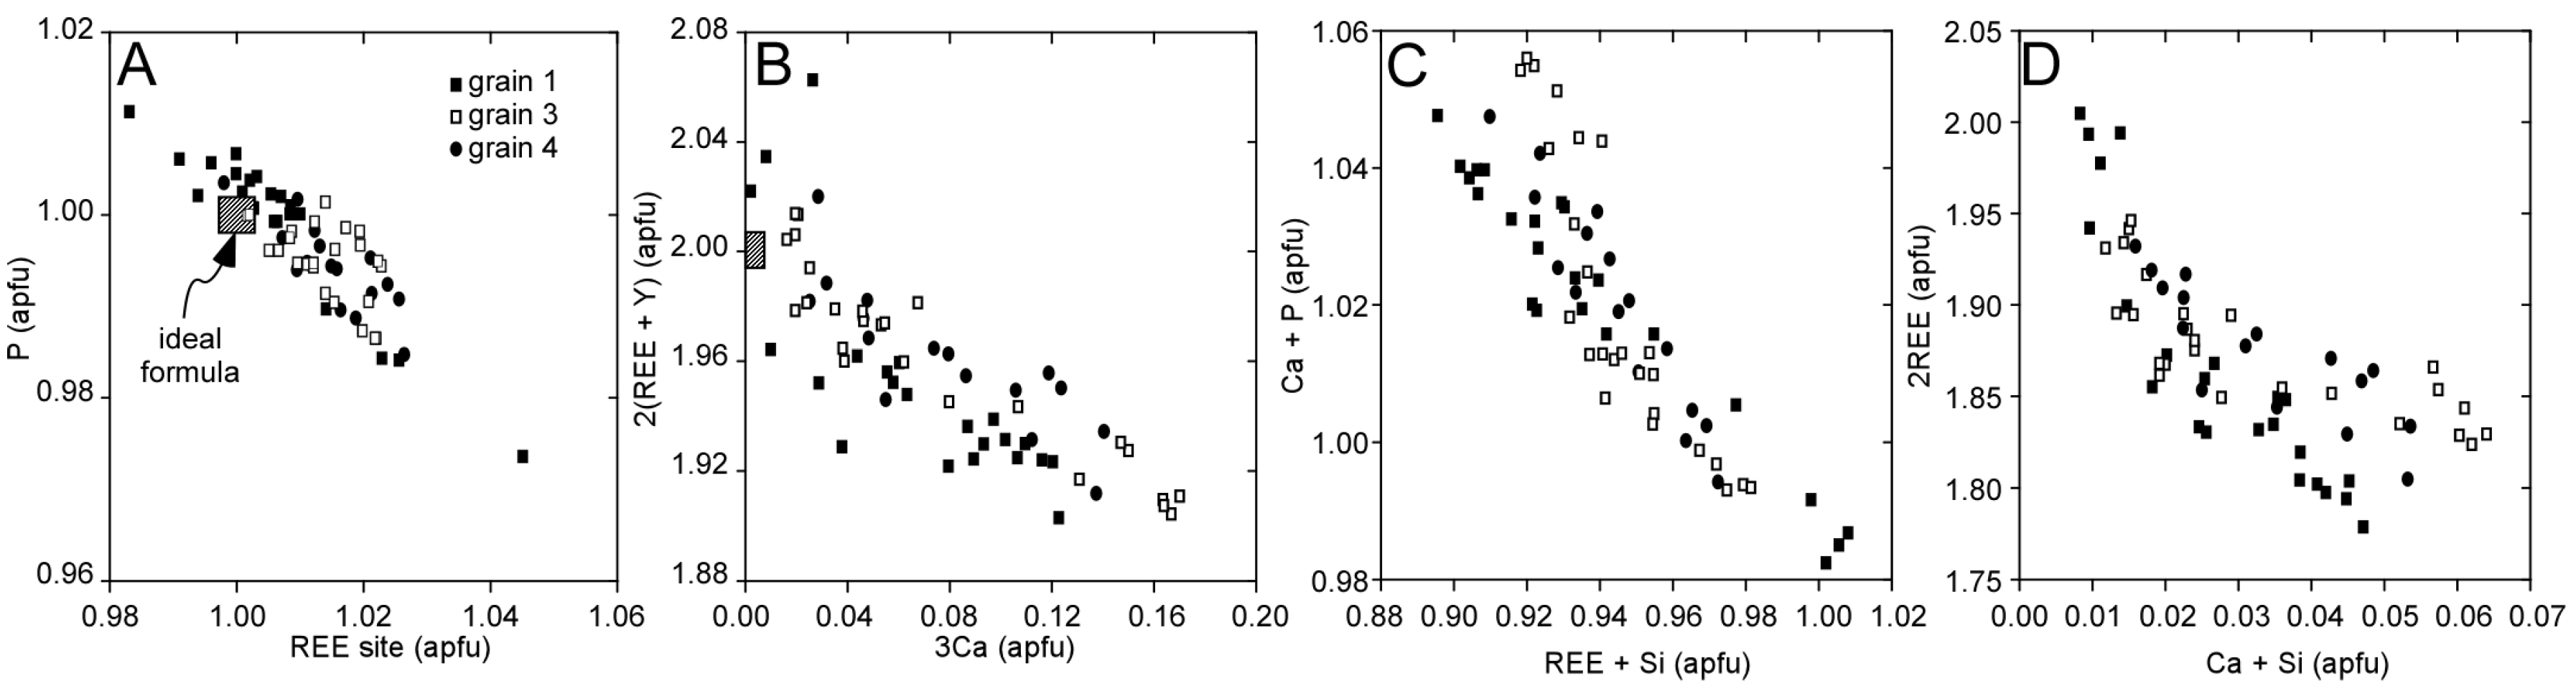
Figure 4.
Compositional transects across Llallagua monazite: (A) grain 1; (B) grain 3; and (C) grain 4 in Y2O3, Eu2O3, CaO and F obtained using EPMA. Approximate location of each monazite core is indicated; (D–F) Transects in Y (scale X 10,000 ppm) across Llallagua monazite grain 1, grain 3, and grain 4, respectively, obtained using LA-ICP-MS. See Figure 2 for locations of these transects.
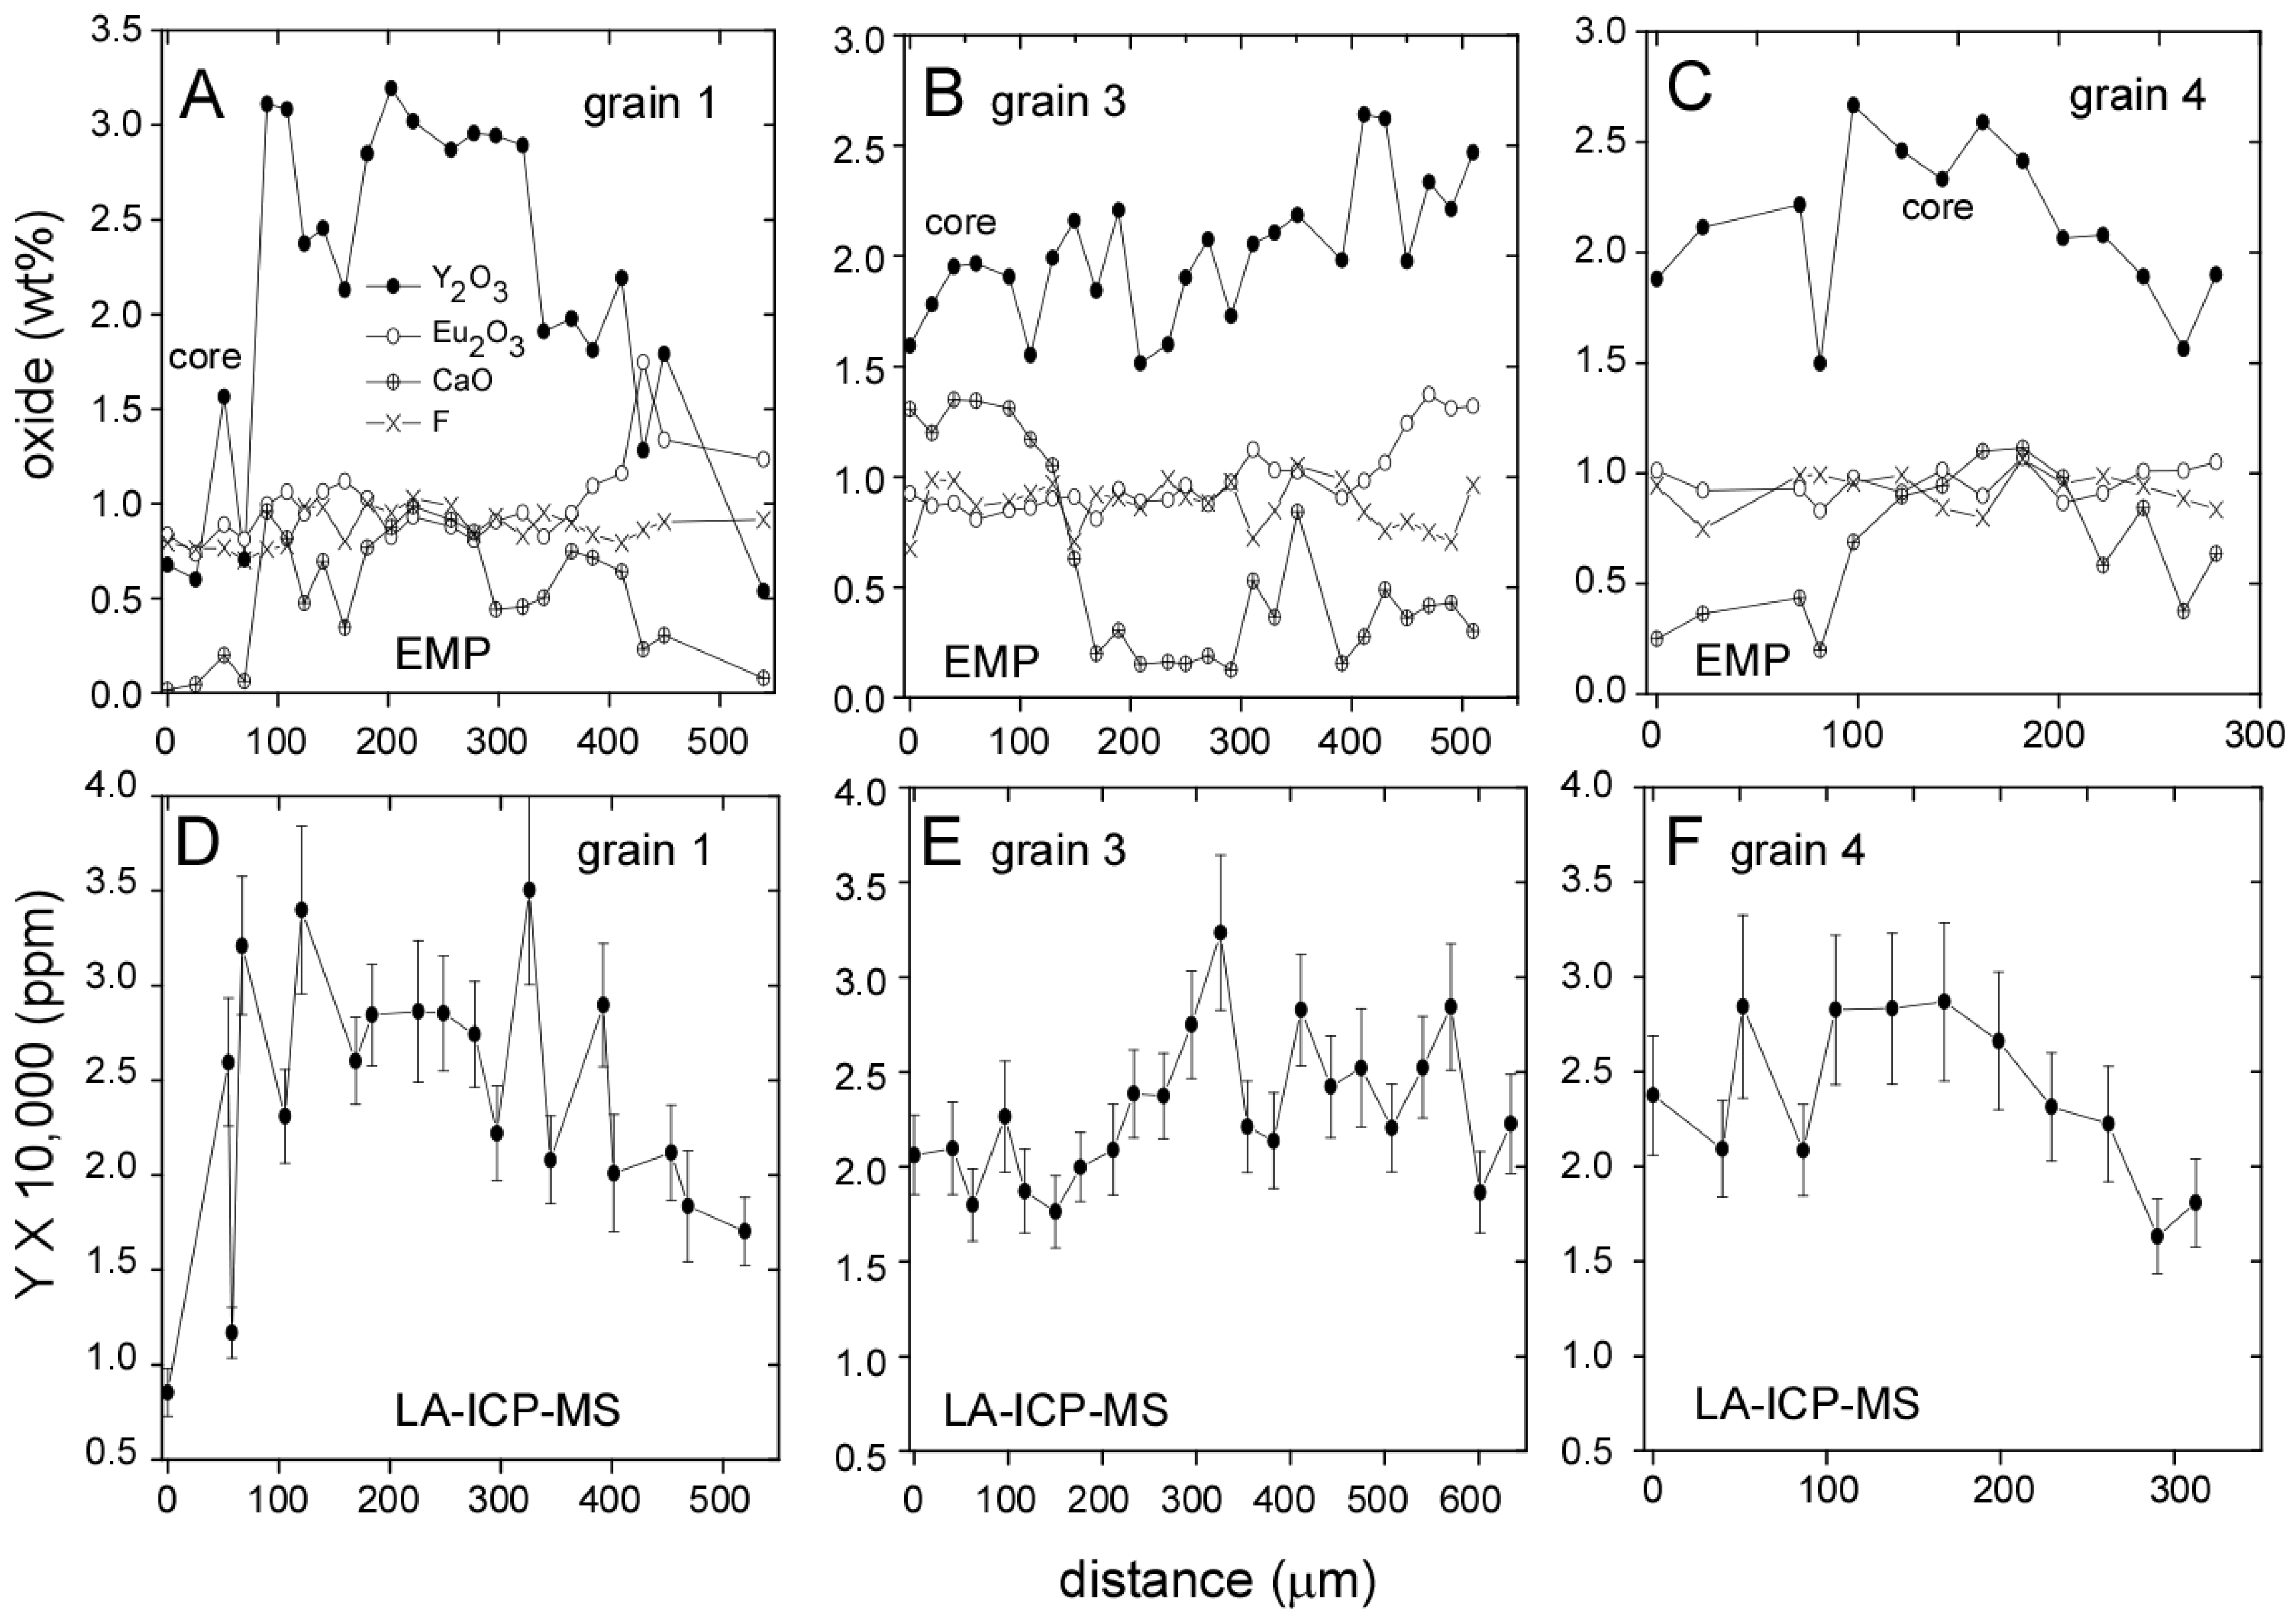
Figure 5.
Compositional transects across Llallagua monazite: (A) grain 1; (B) grain 3; and (C) grain 4 in lower atomic number (low Z, black circles) elements (P, Si, Y, and Ca) and high atomic number (high Z, open circles) elements (La, Ce, Pr, Nd, Sm, Eu, Gd, and Tb). Compositions obtained using the EPMA. Shaded areas are approximate regions that appear darker in BSE, whereas white regions are lighter (see Figure 2). Approximate location of each monazite core is indicated; (D) Plot of the low Z versus high Z elements for all Llallagua monazite EPMA compositions. Black spots correlate to regions that are darker in BSE, whereas open circles appear lighter in BSE.
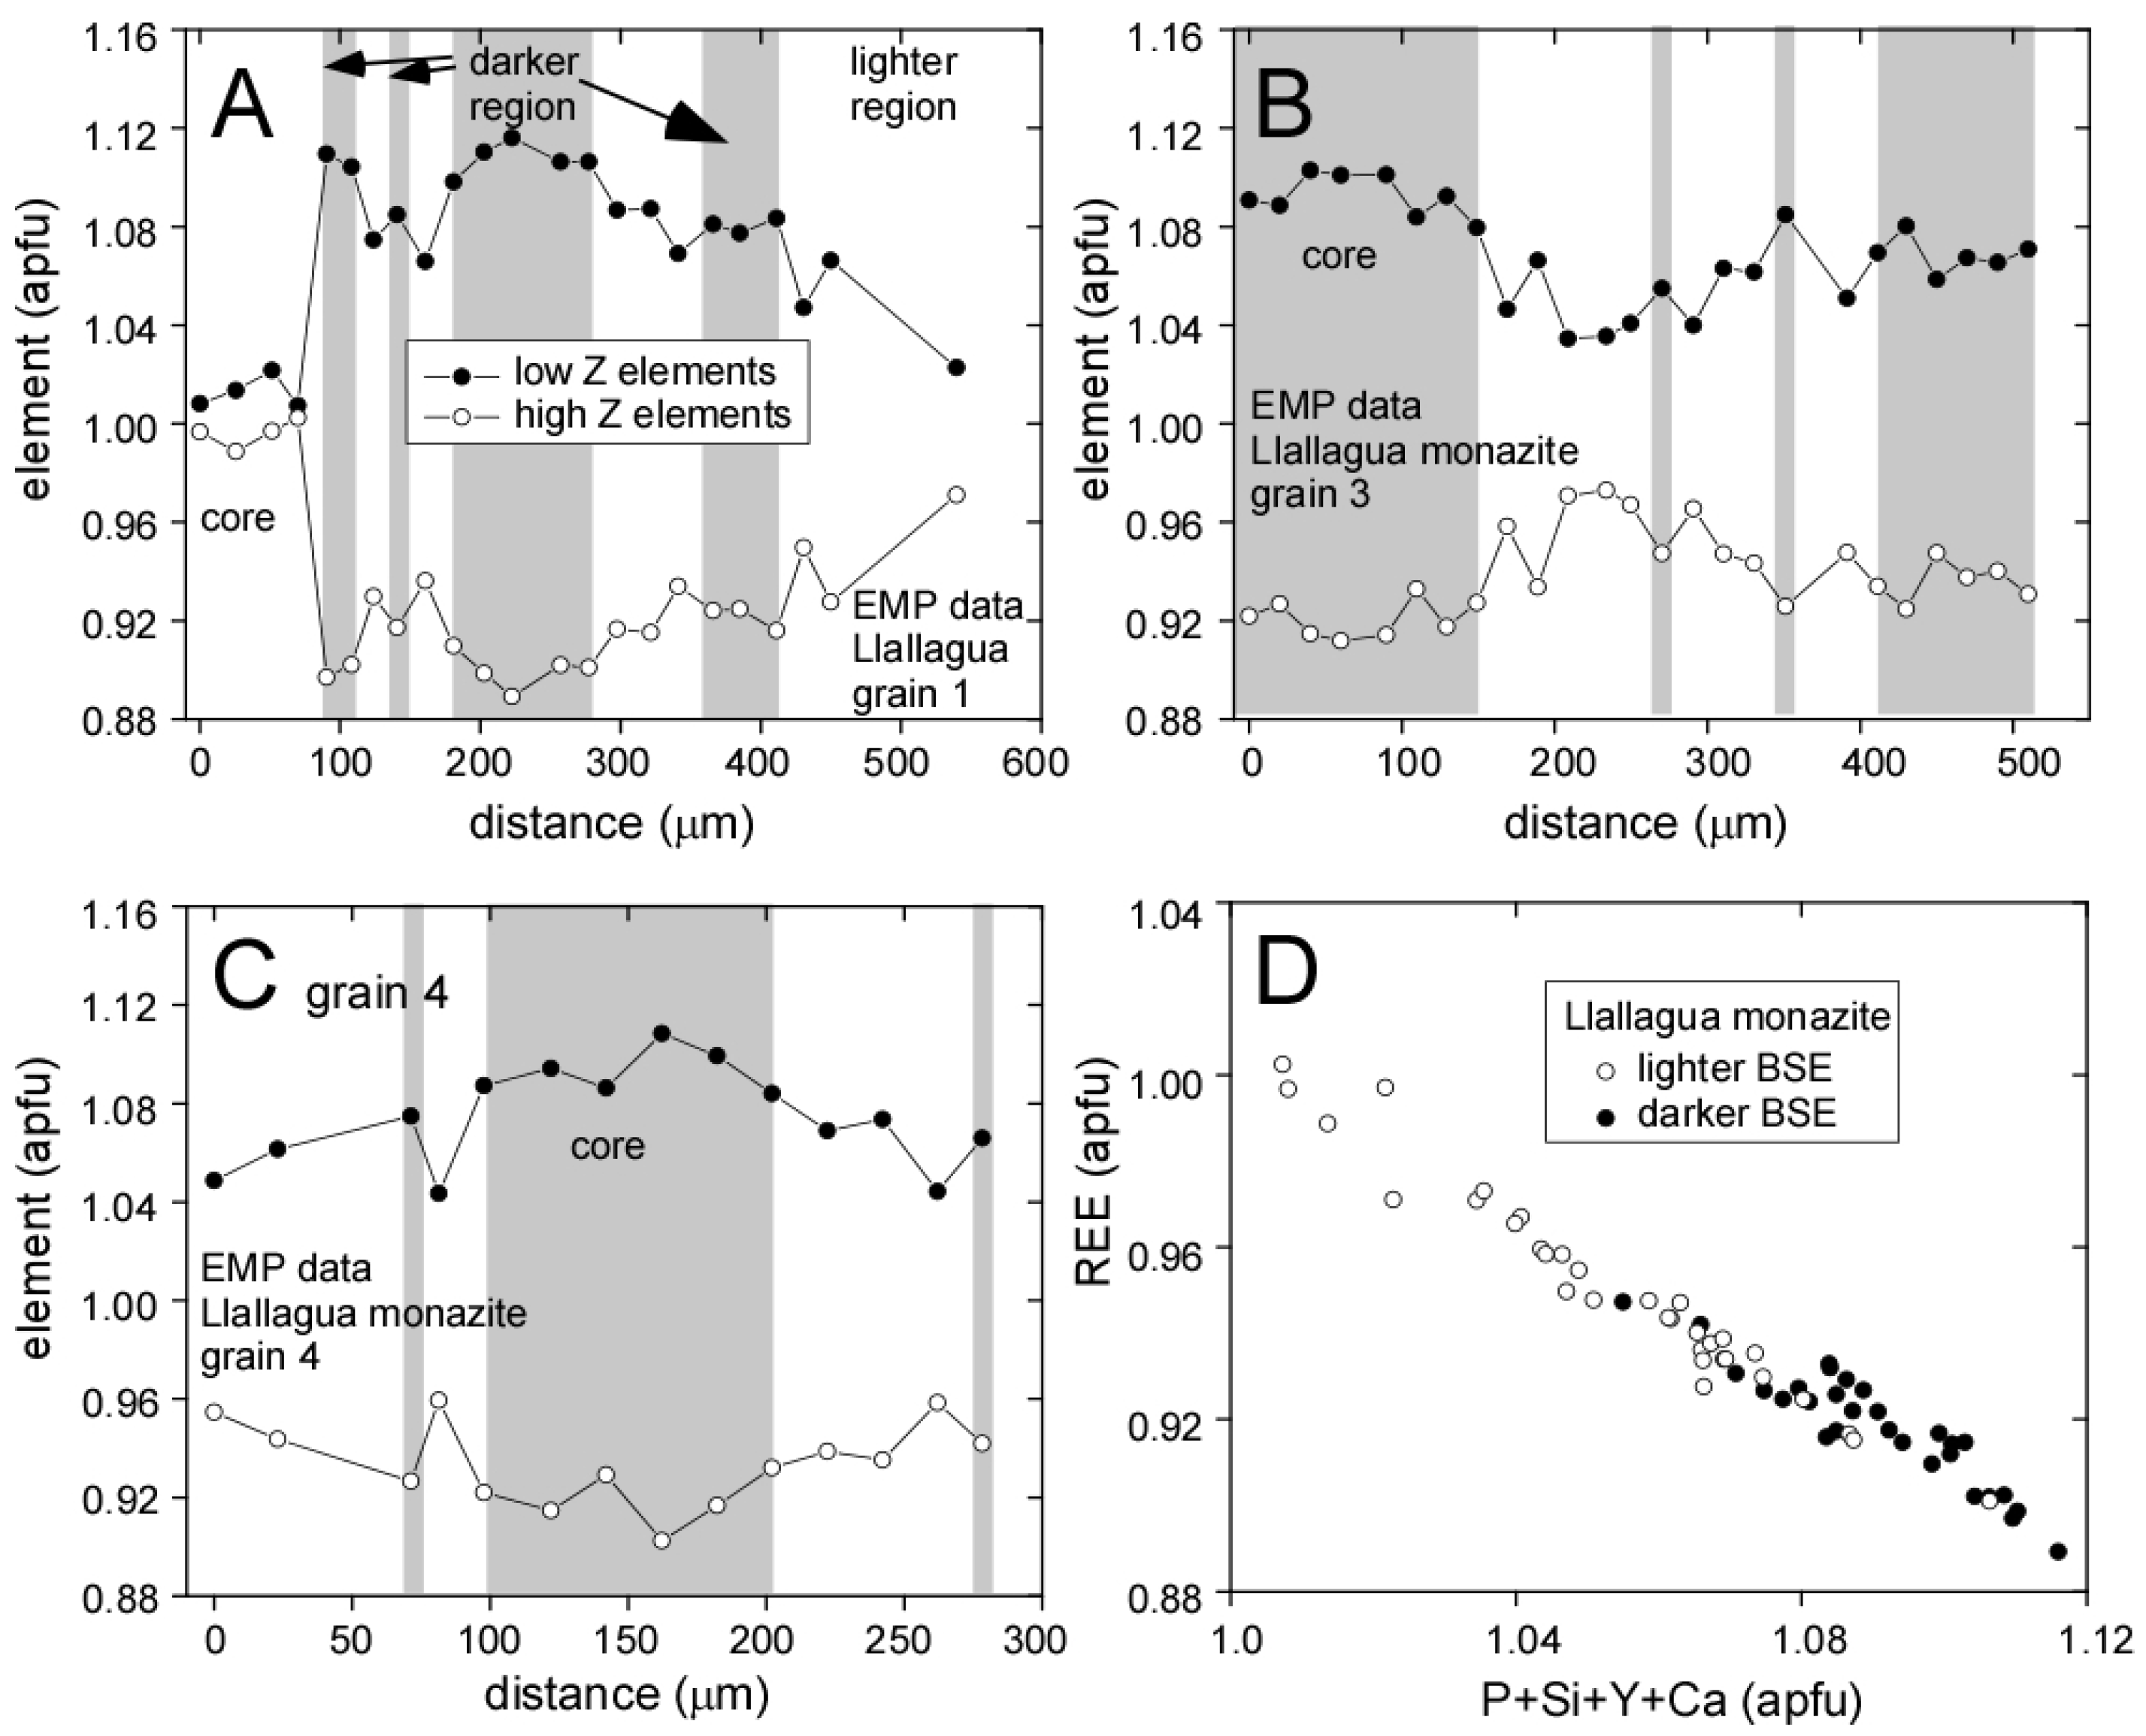
Figure 6.
Chondrite-normalized [45] REE plots of Llallagua monazite: (A) grain 1; (B) grain 3; and (C) grain 4 obtained using EPMA. Core regions are indicated by dark circles, mid-rim by grey circles, and rim by white circles. The grey square box indicates approaching instrument detection limits; (D–F) Chondrite-normalized middle and heavy REE patterns obtained using LA-ICP-MS. We include the EPMA analysis of Sm as a grey box.

Figure 7.
(A) Y (apfu) vs. Ce (apfu); and (B) La (apfu) vs. Pr + Nd (apfu) for individual spots on the Llallagua monazite obtained using EPMA; and (C,D) Yb (ppm) vs. Lu (ppm) and Gd (%) vs. Tb (ppm), respectively, for individual spots obtained using LA-ICPMS data.
Figure 7.
(A) Y (apfu) vs. Ce (apfu); and (B) La (apfu) vs. Pr + Nd (apfu) for individual spots on the Llallagua monazite obtained using EPMA; and (C,D) Yb (ppm) vs. Lu (ppm) and Gd (%) vs. Tb (ppm), respectively, for individual spots obtained using LA-ICPMS data.

Figure 8.
Transects in 232Th (ppm) and 238U (ppm) across Llallagua monazite: (A) grain 1; (B) grain 3; and (C) grain 4. Location of core is indicated; (D–F) Eu (ppm) transects across grains 1, 3, and 4, respectively. Data obtained using LA-ICP-MS.
Figure 8.
Transects in 232Th (ppm) and 238U (ppm) across Llallagua monazite: (A) grain 1; (B) grain 3; and (C) grain 4. Location of core is indicated; (D–F) Eu (ppm) transects across grains 1, 3, and 4, respectively. Data obtained using LA-ICP-MS.

Table 1.
Conditions used for quantitative monazite compositional analysis.
| Element(s) | Crystal | X-ray Line |
|---|---|---|
| P, S, Ca, Cl | PET | Kα |
| As, Ti, Fe, Mn | LIF | Kα |
| Al, Si, Mg, Na, F | TAP | Kα |
| Y | TAP | Lα |
| La, Ce, Nd, Eu, Tb | LIF | Lα |
| Pr, Sm, Gd | LIF | Lβ |
| Th | PET | Mα |
| U | PET | Mβ |
Table 2.
Average Llallagua monazite EPMA compositions 1.
| Analysis | Grain 1 (n = 23) 2 | Grain 3 (n = 25) | Grain 4 (n = 16) | All Grains (n = 64) |
|---|---|---|---|---|
| P2O5 (wt %) 3 | 30.1 (0.7) 4 | 29.9 (0.4) | 29.9 (0.4) | 29.97 (0.51) |
| As2O5 | 0.02 (0.04) | 0.02 (0.03) | 0.04 (0.07) | 0.03 (0.05) |
| SiO2 | 0.151 (0.027) | 0.185 (0.024) | 0.182 (0.024) | 0.17 (0.03) |
| TiO2 | 0.010 (0.016) | 0.012 (0.018) | 0.006 (0.015) | 0.01 (0.02) |
| UO2 | 0.031 (0.043) | 0.033 (0.053) | 0.041 (0.035) | 0.03 (0.05) |
| Y2O3 | 2.1 (0.9) | 2.0 (0.3) | 2.1 (0.4) | 2.07 (0.59) |
| La2O3 | 16.1 (1.7) | 14.3 (0.7) | 14.5 (1.4) | 14.97 (1.54) |
| Ce2O3 | 32.2 (1.0) | 32.7 (0.8) | 32.7 (0.7) | 32.54 (0.87) |
| Pr2O3 | 2.97 (0.19) | 3.21 (0.20) | 3.23 (0.13) | 3.13 (0.22) |
| Nd2O3 | 11.2 (0.8) | 12.4 (0.7) | 12.3 (0.7) | 11.92 (0.91) |
| Sm2O3 | 1.15 (0.17) | 1.19 (0.22) | 1.22 (0.15) | 1.18 (0.19) |
| Eu2O3 | 1.01 (0.22) | 0.99 (0.16) | 0.97 (0.07) | 0.99 (0.17) |
| Gd2O3 | 0.67 (0.12) | 0.72 (0.15) | 0.64 (0.15) | 0.68 (0.14) |
| Tb2O3 | 0.06 (0.05) | 0.08 (0.05) | 0.05 (0.04) | 0.06 (0.05) |
| CaO | 0.53 (0.32) | 0.59 (0.45) | 0.63 (0.32) | 0.58 (0.37) |
| F | 0.87 (0.09) | 0.88 (0.11) | 0.92 (0.09) | 0.88 (0.10) |
| Cl | 0.06 (0.01) | 0.06 (0.01) | 0.06 (0.01) | 0.06 (0.01) |
| Total | 98.8 (0.9) | 98.9 (0.6) | 99.1 (0.5) | 98.90 (0.7) |
| P (apfu) 5 | 0.999 (0.009) | 0.995 (0.004) | 0.994 (0.005) | 0.996 (0.007) |
| Si | 0.006 (0.001) | 0.007 (0.001) | 0.007 (0.001) | 0.007 (0.001) |
| Y | 0.044 (0.018) | 0.042 (0.006) | 0.043 (0.007) | 0.043 (0.012) |
| La | 0.233 (0.026) | 0.207 (0.011) | 0.209 (0.021) | 0.217 (0.023) |
| Ce | 0.462 (0.019) | 0.471 (0.012) | 0.471 (0.009) | 0.468 (0.014) |
| Pr | 0.042 (0.003) | 0.046 (0.003) | 0.046 (0.002) | 0.045 (0.003) |
| Nd | 0.156 (0.011) | 0.174 (0.010) | 0.172 (0.010) | 0.167 (0.013) |
| Sm | 0.016 (0.002) | 0.016 (0.003) | 0.017 (0.002) | 0.016 (0.003) |
| Eu | 0.013 (0.003) | 0.013 (0.002) | 0.013 (0.001) | 0.013 (0.002) |
| Gd | 0.009 (0.001) | 0.009 (0.002) | 0.008 (0.002) | 0.009 (0.002) |
| Ca | 0.022 (0.013) | 0.025 (0.019) | 0.026 (0.013) | 0.024 (0.016) |
| F | 0.108 (0.011) | 0.109 (0.013) | 0.114 (0.011) | 0.110 (0.012) |
| Cl | 0.004 (0.001) | 0.004 (0.001) | 0.004 (0.001) | 0.004 (0.001) |
| Total | 2.01 (0.01) | 2.01 (0.01) | 2.01 (0.005) | 2.01 (0.005) |
1 Measured but not detected: SO3, PbO, FeO, MnO, MgO, Na2O, ThO2 and Al2O3 (wt%). Supplementary Materials, File S1 contains details regarding each analysis and standard data. See Figure 2 for locations; 2 n = number of spots on monazite grain; 3 Oxides and halogens in this groups reported in wt %; 4 Number in parentheses is 1σ standard deviation of the average in absolute values; 5 Atoms per formula unit (apfu) are normalized to four oxygens.
Table 3.
Average Llallagua monazite LA-ICP-MS compositions 1.
| Isotope (ppm) 2 | Grain 1 (n = 19) 3 | Grain 3 (n = 22) | Grain 4 (n = 12) | All Grains (n = 56) |
|---|---|---|---|---|
| 75As | 173 (21) 4 | 207 (23) | 208 (27) | 195 (23) |
| 89Y | 24,119 (3008) | 22,946 (2596) | 23,808 (3348) | 23,562 (2929) |
| 153Eu | 3459 (507) | 2429 (318) | 2078 (339) | 2719 (400) |
| 157Gd | 14,344 (1774) | 14,445 (1601) | 14,291 (2012) | 14,374 (1763) |
| 159Tb | 1782 (210) | 1720 (191) | 1757 (248) | 1751 (212) |
| 163Dy | 8165 (982) | 7635 (826) | 8058 (1082) | 7903 (945) |
| 165Ho | 1038 (127) | 1030 (107) | 1057 (136) | 1037 (121) |
| 166Er | 2142 (261) | 2099 (213) | 2188 (289) | 2134 (249) |
| 169Tm | 167 (20) | 162 (16) | 169 (22) | 165 (19) |
| 172Yb | 682 (79) | 653 (65) | 686 (92) | 671 (77) |
| 175Lu | 59 (7) | 51 (5) | 55 (7) | 55 (6) |
| 204Pb | 5.2 (15.6) | 1.2 (12) | 3.0 (13) | 3.0 (14) |
| 208Pb | 0.5 (0.2) | 0.6 (0.2) | 0.3 (0.1) | 0.5 (0.2) |
| 232Th | 103 (33) | 3.3 (1.9) | 3.7 (1.9) | 39 (20) |
| 238U | 160 (22) | 107 (12) | 96 (13) | 123 (17) |
1 Measured but not detected: 23Na, 27Al, 55Mn, 57Fe, and 137Ba. Supplementary Materials, File S1 contains details regarding each analysis and standard data; 2 Compositions reported in ppm; 3 n = number of spots on monazite grain; 4 Number in parentheses is 2σ standard deviation of the average in absolute values, taking into account analytical uncertainties.
© 2017 by the authors. Licensee MDPI, Basel, Switzerland. This article is an open access article distributed under the terms and conditions of the Creative Commons Attribution (CC BY) license (http://creativecommons.org/licenses/by/4.0/).
Share and Cite
MDPI and ACS Style
Catlos, E.J.; Miller, N.R. Speculations Linking Monazite Compositions to Origin: Llallagua Tin Ore Deposit (Bolivia). Resources 2017, 6, 36. https://doi.org/10.3390/resources6030036
AMA Style
Catlos EJ, Miller NR. Speculations Linking Monazite Compositions to Origin: Llallagua Tin Ore Deposit (Bolivia). Resources. 2017; 6(3):36. https://doi.org/10.3390/resources6030036
Chicago/Turabian StyleCatlos, Elizabeth J., and Nathan R. Miller. 2017. "Speculations Linking Monazite Compositions to Origin: Llallagua Tin Ore Deposit (Bolivia)" Resources 6, no. 3: 36. https://doi.org/10.3390/resources6030036
Note that from the first issue of 2016, this journal uses article numbers instead of page numbers. See further details here.