Article

The Vital Minimum Amount of Drinking Water Required in Ecuador

by
Andrés Martínez Moscoso
1,2,*,
Víctor Gerardo Aguilar Feijó
1 and
Teodoro Verdugo Silva
1,2
1
Faculty of Economics and Administration, University of Cuenca, Cuenca 010203, Ecuador
2
Faculty of Jurisprudence, Political and Social Sciences, University of Cuenca, Cuenca 010203, Ecuador
*
Author to whom correspondence should be addressed.
Resources 2018, 7(1), 15; https://doi.org/10.3390/resources7010015
Submission received: 2 November 2017 / Revised: 7 February 2018 / Accepted: 13 February 2018 / Published: 24 February 2018
(This article belongs to the Special Issue New Water Regimes)

Abstract

:
In 2017, the government of Ecuador established the minimum quantity of water required to be provided for free by drinking water utilities. Ecuador recognized the access to water as a fundamental human right because it guarantees the good living, known as “Sumak kawsay”, an indigenous Andean concept, in the Ecuadorian Constitution. This represents a novel approach to water rights in the world, as it is the first attempt to establish a minimum quantity of water under a constitutional guarantee by legislation, rather than regulation or judicial decision. However, this novel legislative approach raises the question of how this minimum amount of free water will impact the most vulnerable members of the Ecuadorian community. This paper provides the results of the first comprehensive research of the minimum required water provision in Ecuador. In order to measure the impact on the income of households, we built a methodology integrating: doctrinaire analyses, normative studies, and economic analyses. According to the Ecuadorian legislation, over-consumption of raw water generates additional costs that must be paid by water companies to the central government. In that regard, there is an inevitable relationship between the efficiency of the service and those additional costs. Efficiency, on this case, is the capacity of water companies (public or private) to provide water services at an adequate price, observing the following parameters: quantity, quality and sufficiency. Our research found that with this legislation in three Ecuadorian local governments (Cuenca, Gualaceo and Suscal), the most vulnerable households (i.e., low-income and/or indigenous households) will be affected the most. This means that and those families will spend the most part of their income on water services otherwise they would have to reduce their water consumption.

1. Introduction

From a normative standpoint, the case of Ecuador presents a peculiarity in relation to water management. Until 1960, water administration remained private; the State simply intervened to resolve disputes and authorize usage. That year water was declared a national good, a principle ensured in 1972 when all continental waters of the country were declared public domain. In 1993, the process of State modernization affected the provision of public services, including water provision and management which was delegated to the National Council of Water Resources (1994) [1]. In 2008 Ecuador’s new Constitution reconfirmed the State as primary authority for water management, conservation, recovery, integrated management of water resources, watersheds and ecological flows associated to the water cycle (Art. 411 and 412).
An important feature of the Ecuadorian case is that irrigation water regulations have been prioritized over drinking water regulations due to the influence of 1970s Agrarian Reform, which generated a policy of subsidies and debt write-offs in favor of indigenous and peasant groups. This has produced an important gap between water access, efficiency and quality in rural and urban areas. With the new constitutional framework and the creation of the National Water Authority (SENAGUA) in 2008, access to drinking water has been increased (from 69% in 2006 to 83.6% in 2016). In the rural areas, however, the access to water through public connection is only 59%.
In May of 2017, SENAGUA signed the Ministerial Agreements No. 2017-1522 and 2017-1523, which approved the formula to calculate the cost of raw water, as well as the minimum amount of drinking water (200 L) guaranteed under the 2008 Ecuadorian Constitution. As positive as the recognition of the right to water is, quantifying a vital minimum amount of water per person poses the following complex questions: first, is the standardization made in Ecuador correct, since it doubles the international average? Second, is the application of the vital minimum of water widening the differences between subnational governments regarding the provision of water, quality of service, financial capacity of the lending companies, and quality of life for families?
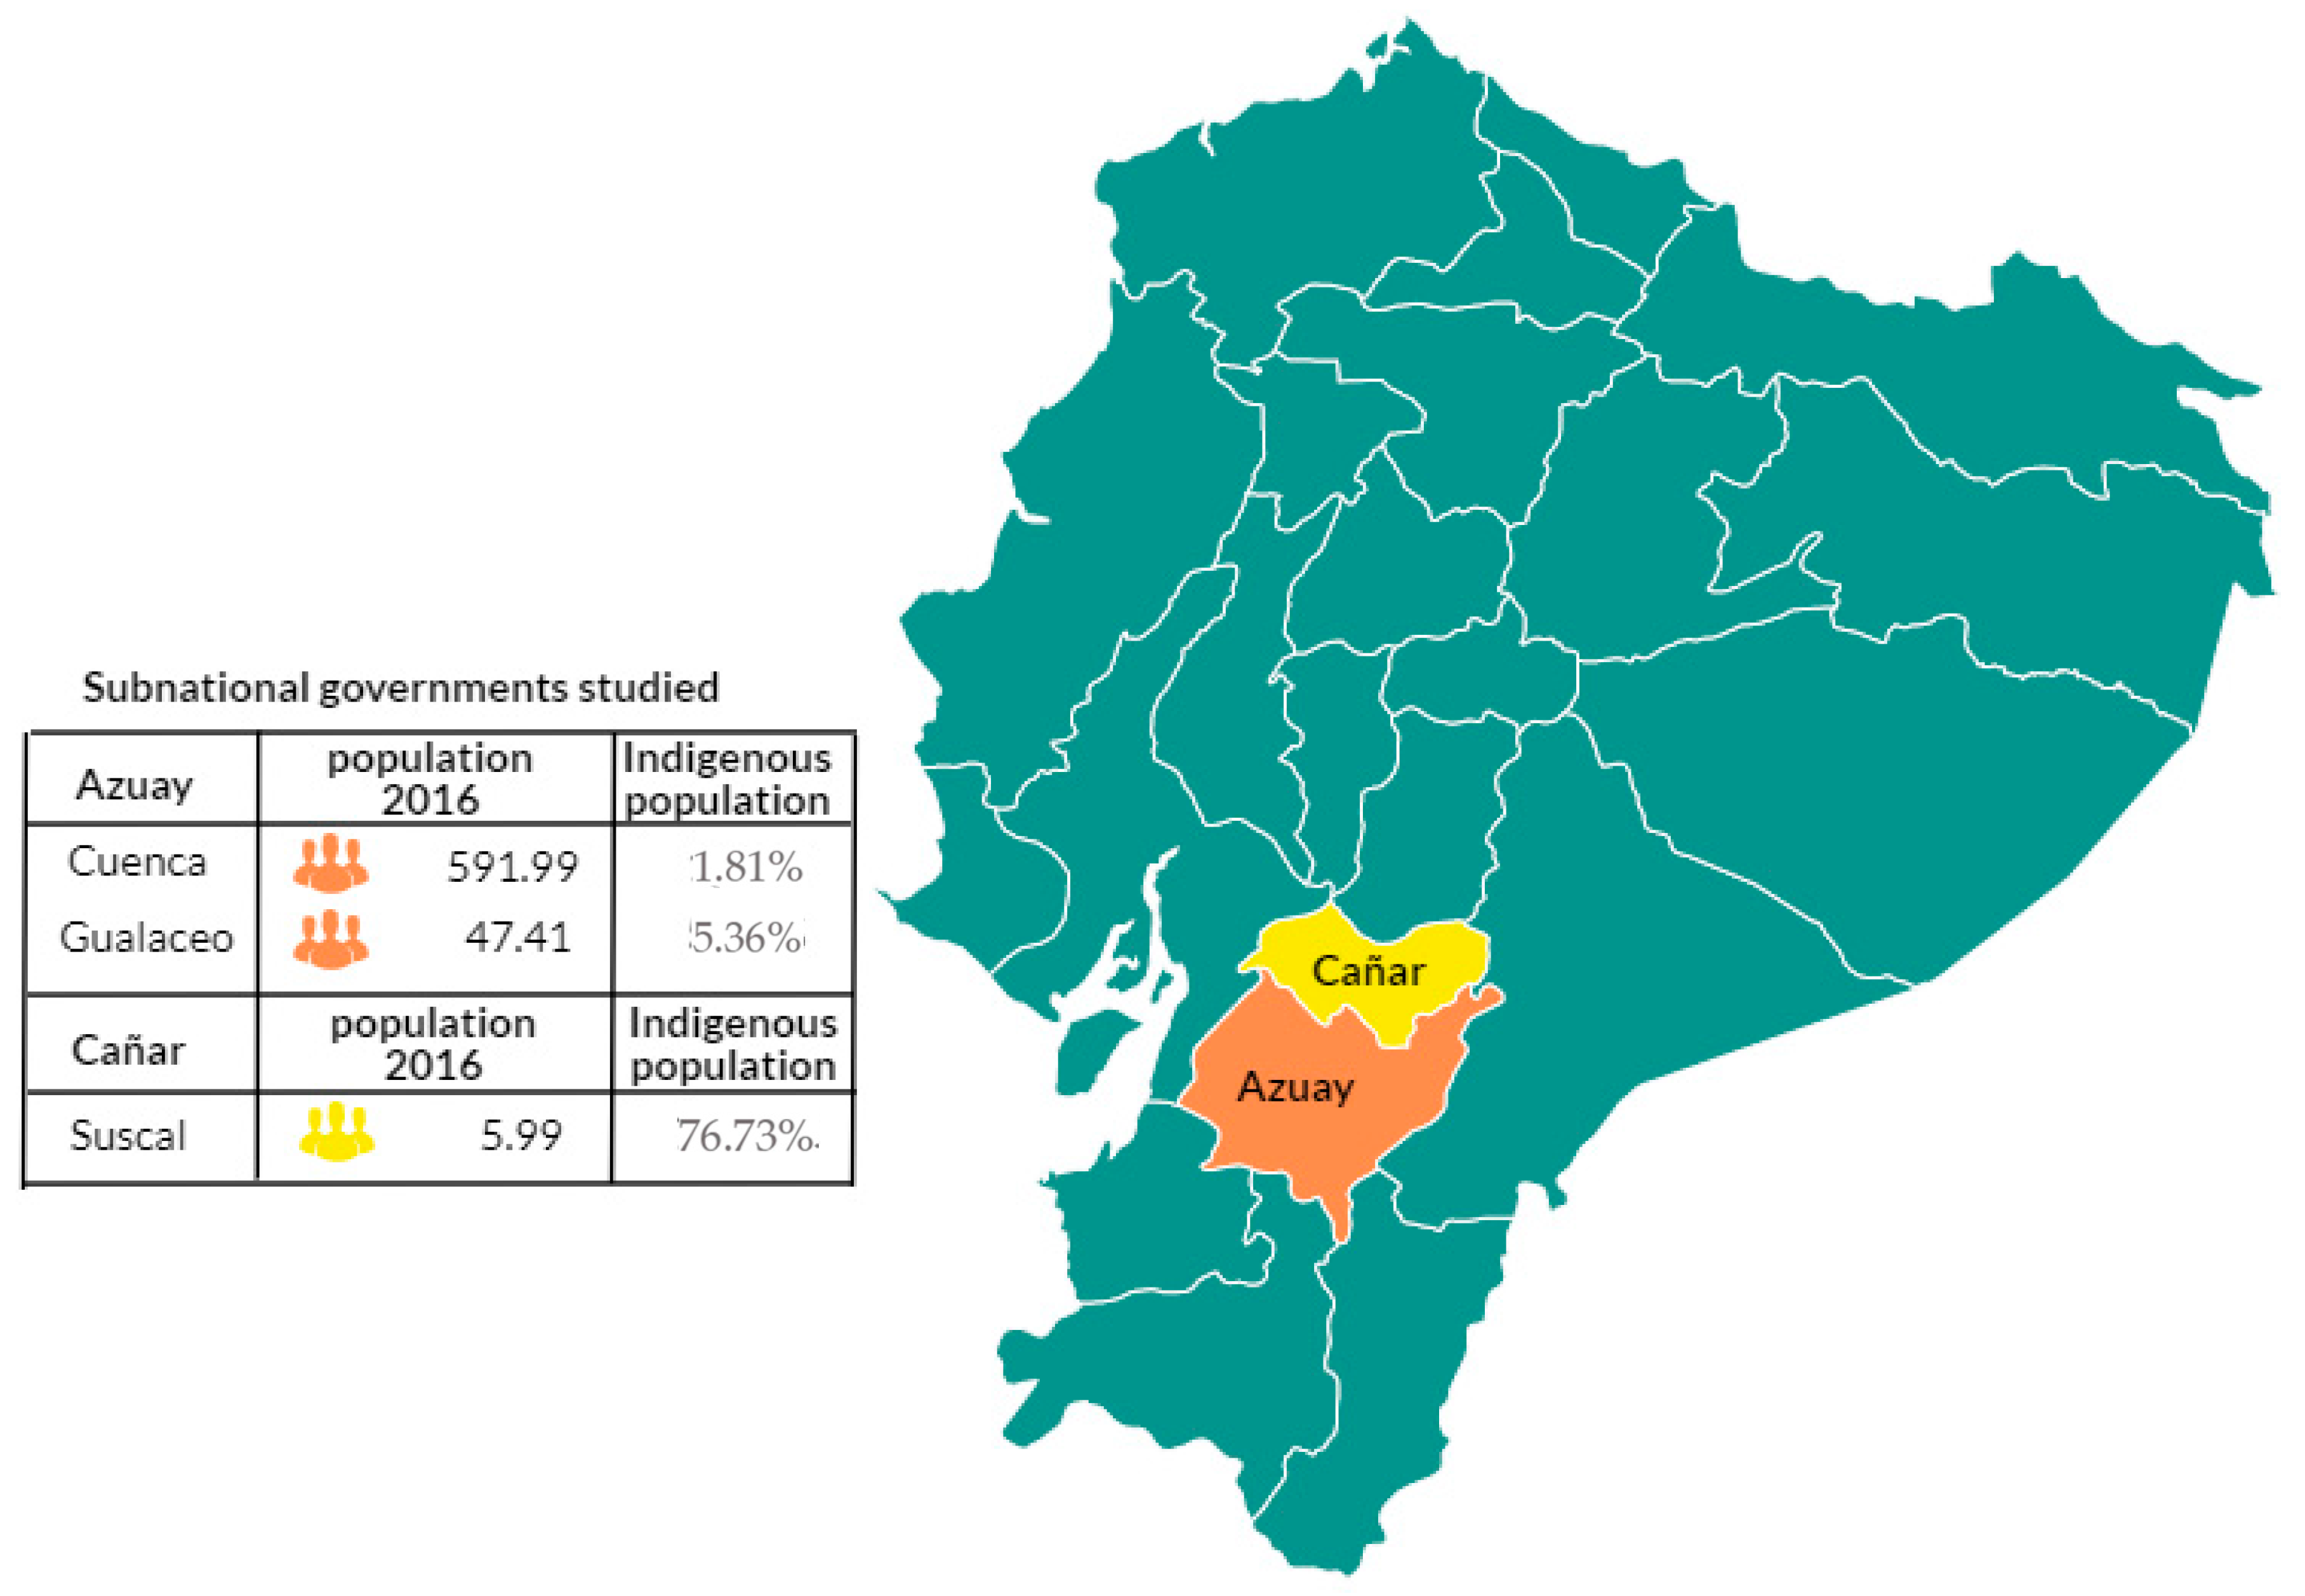
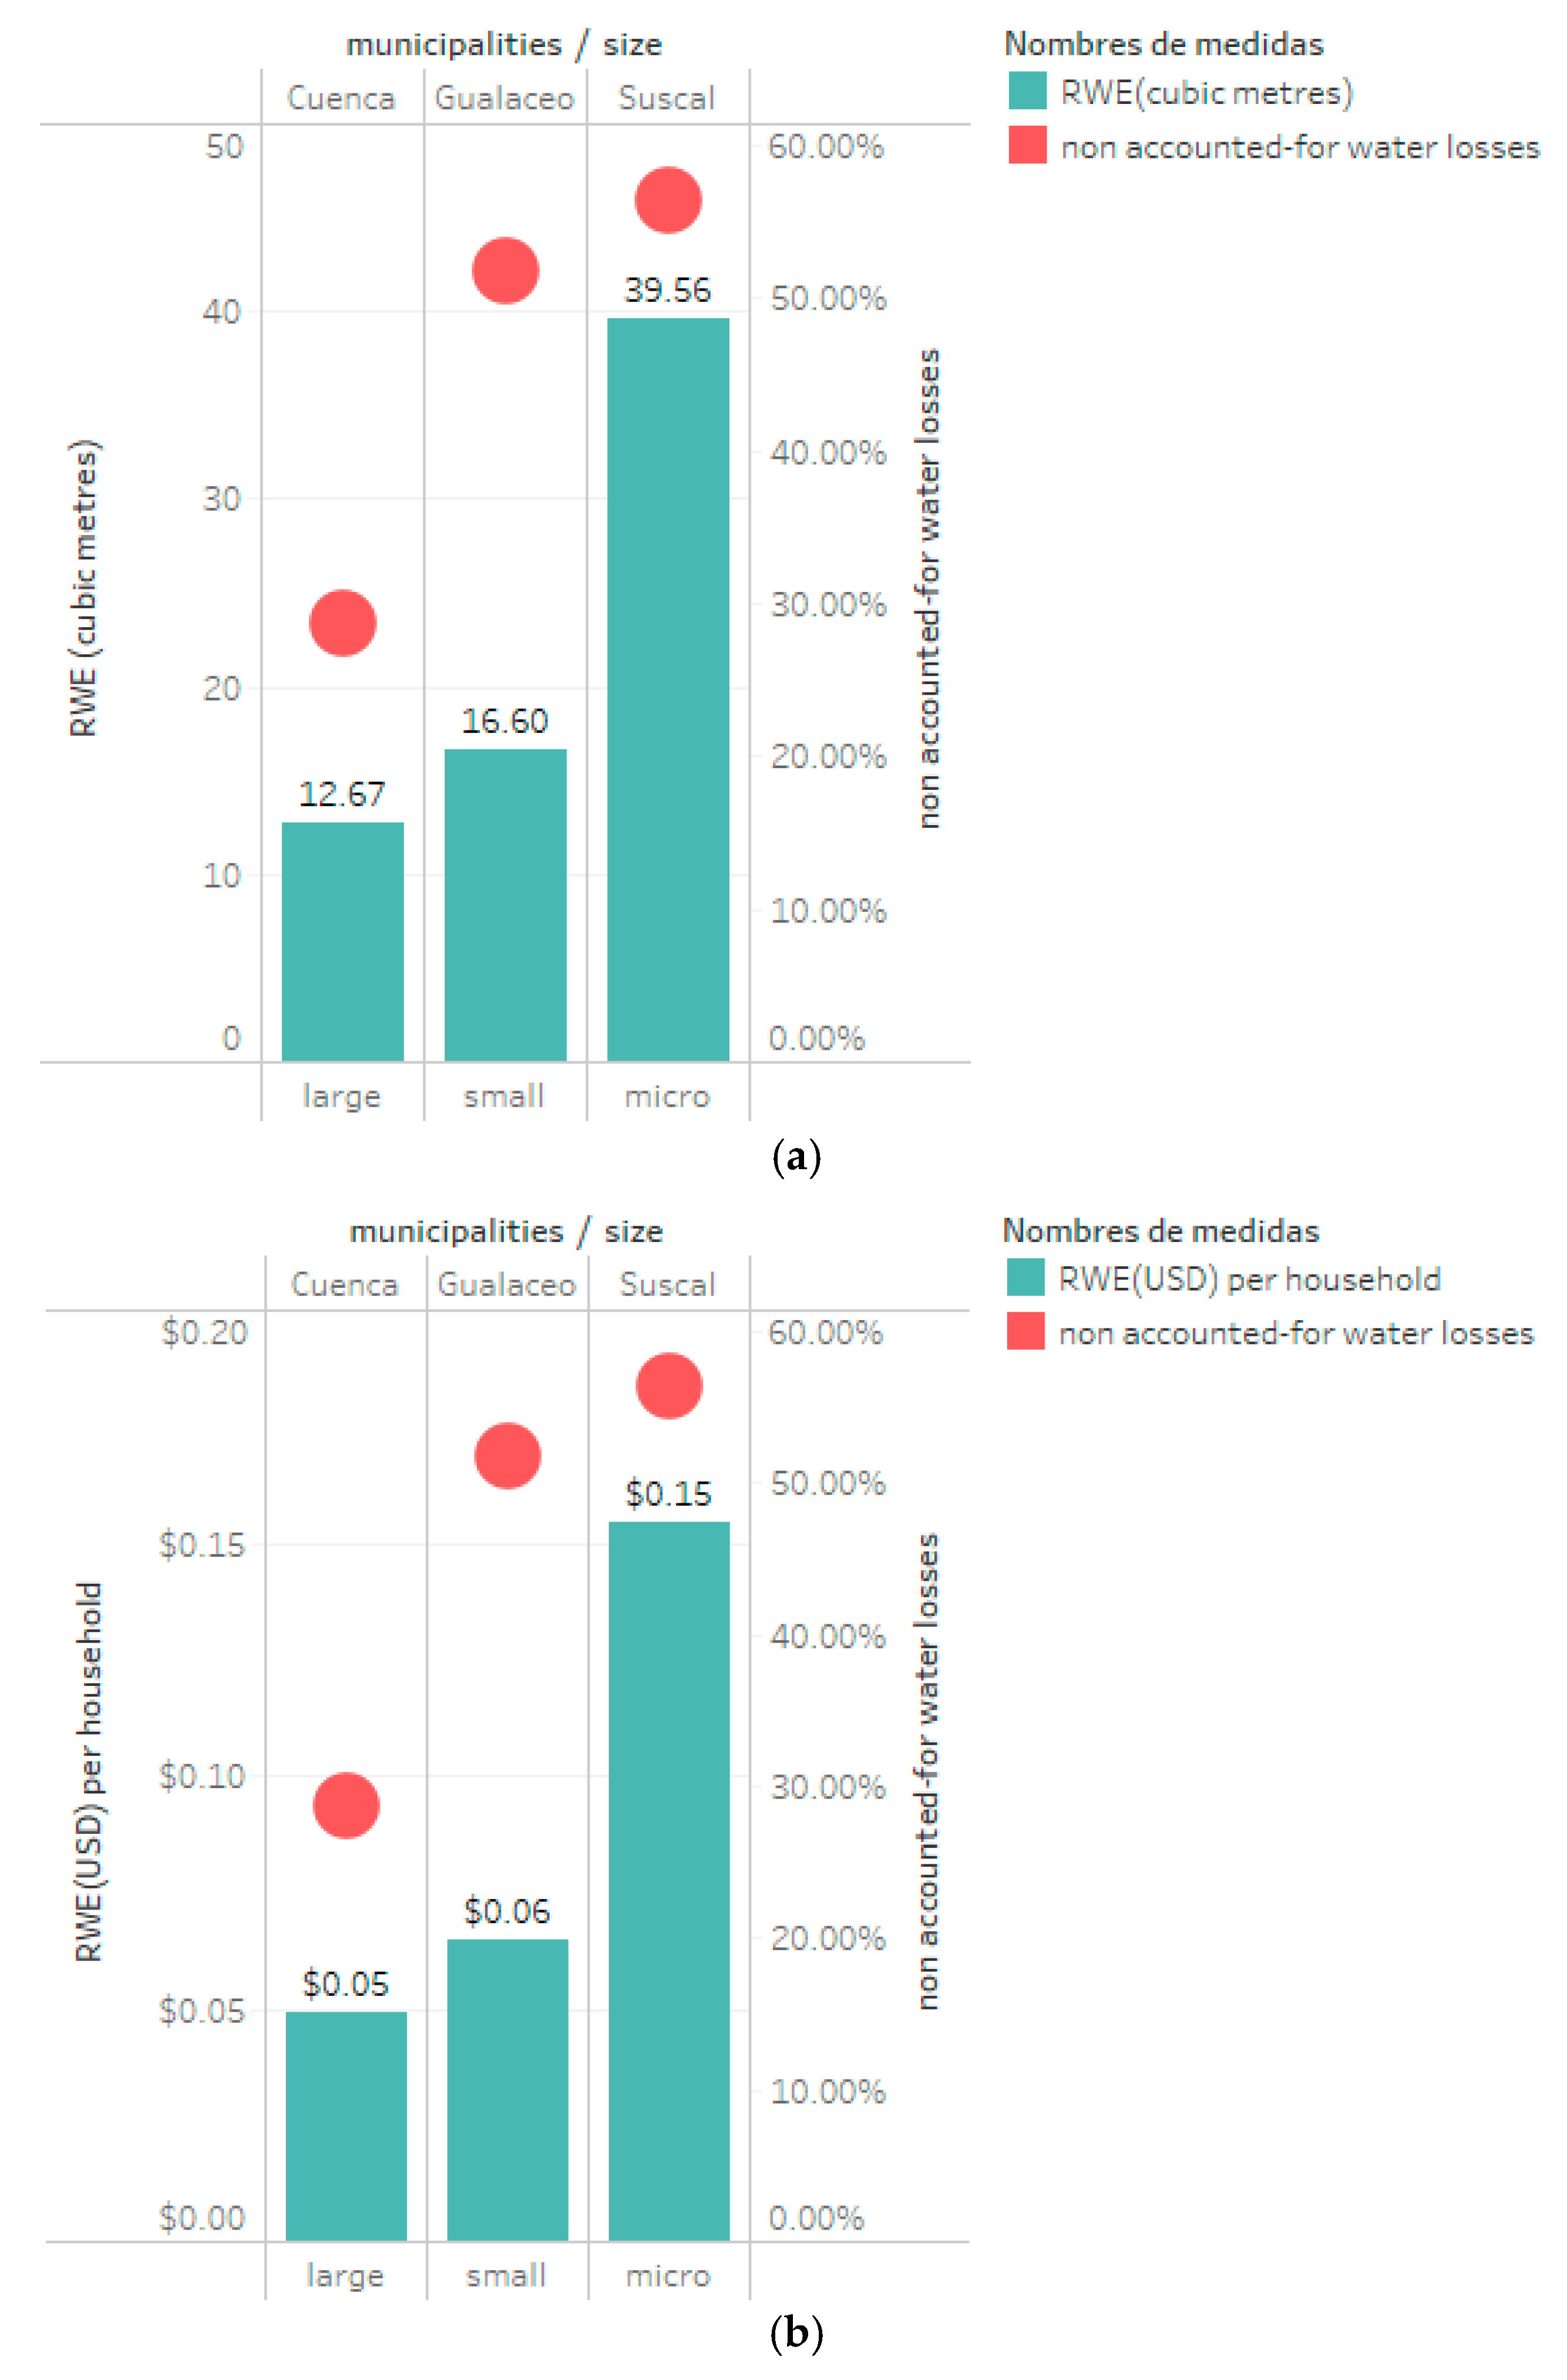
The purpose of this research is to determine the extent to which the application of these Ministerial agreements increases (or reduces) the differences between local governments, in terms water provision efficiency, and the economic capacity of the most vulnerable families to pay for water exceeding the Constitutionally-guaranteed vital minimum amount. The study selected three different municipalities in the austral area of Ecuador (See 
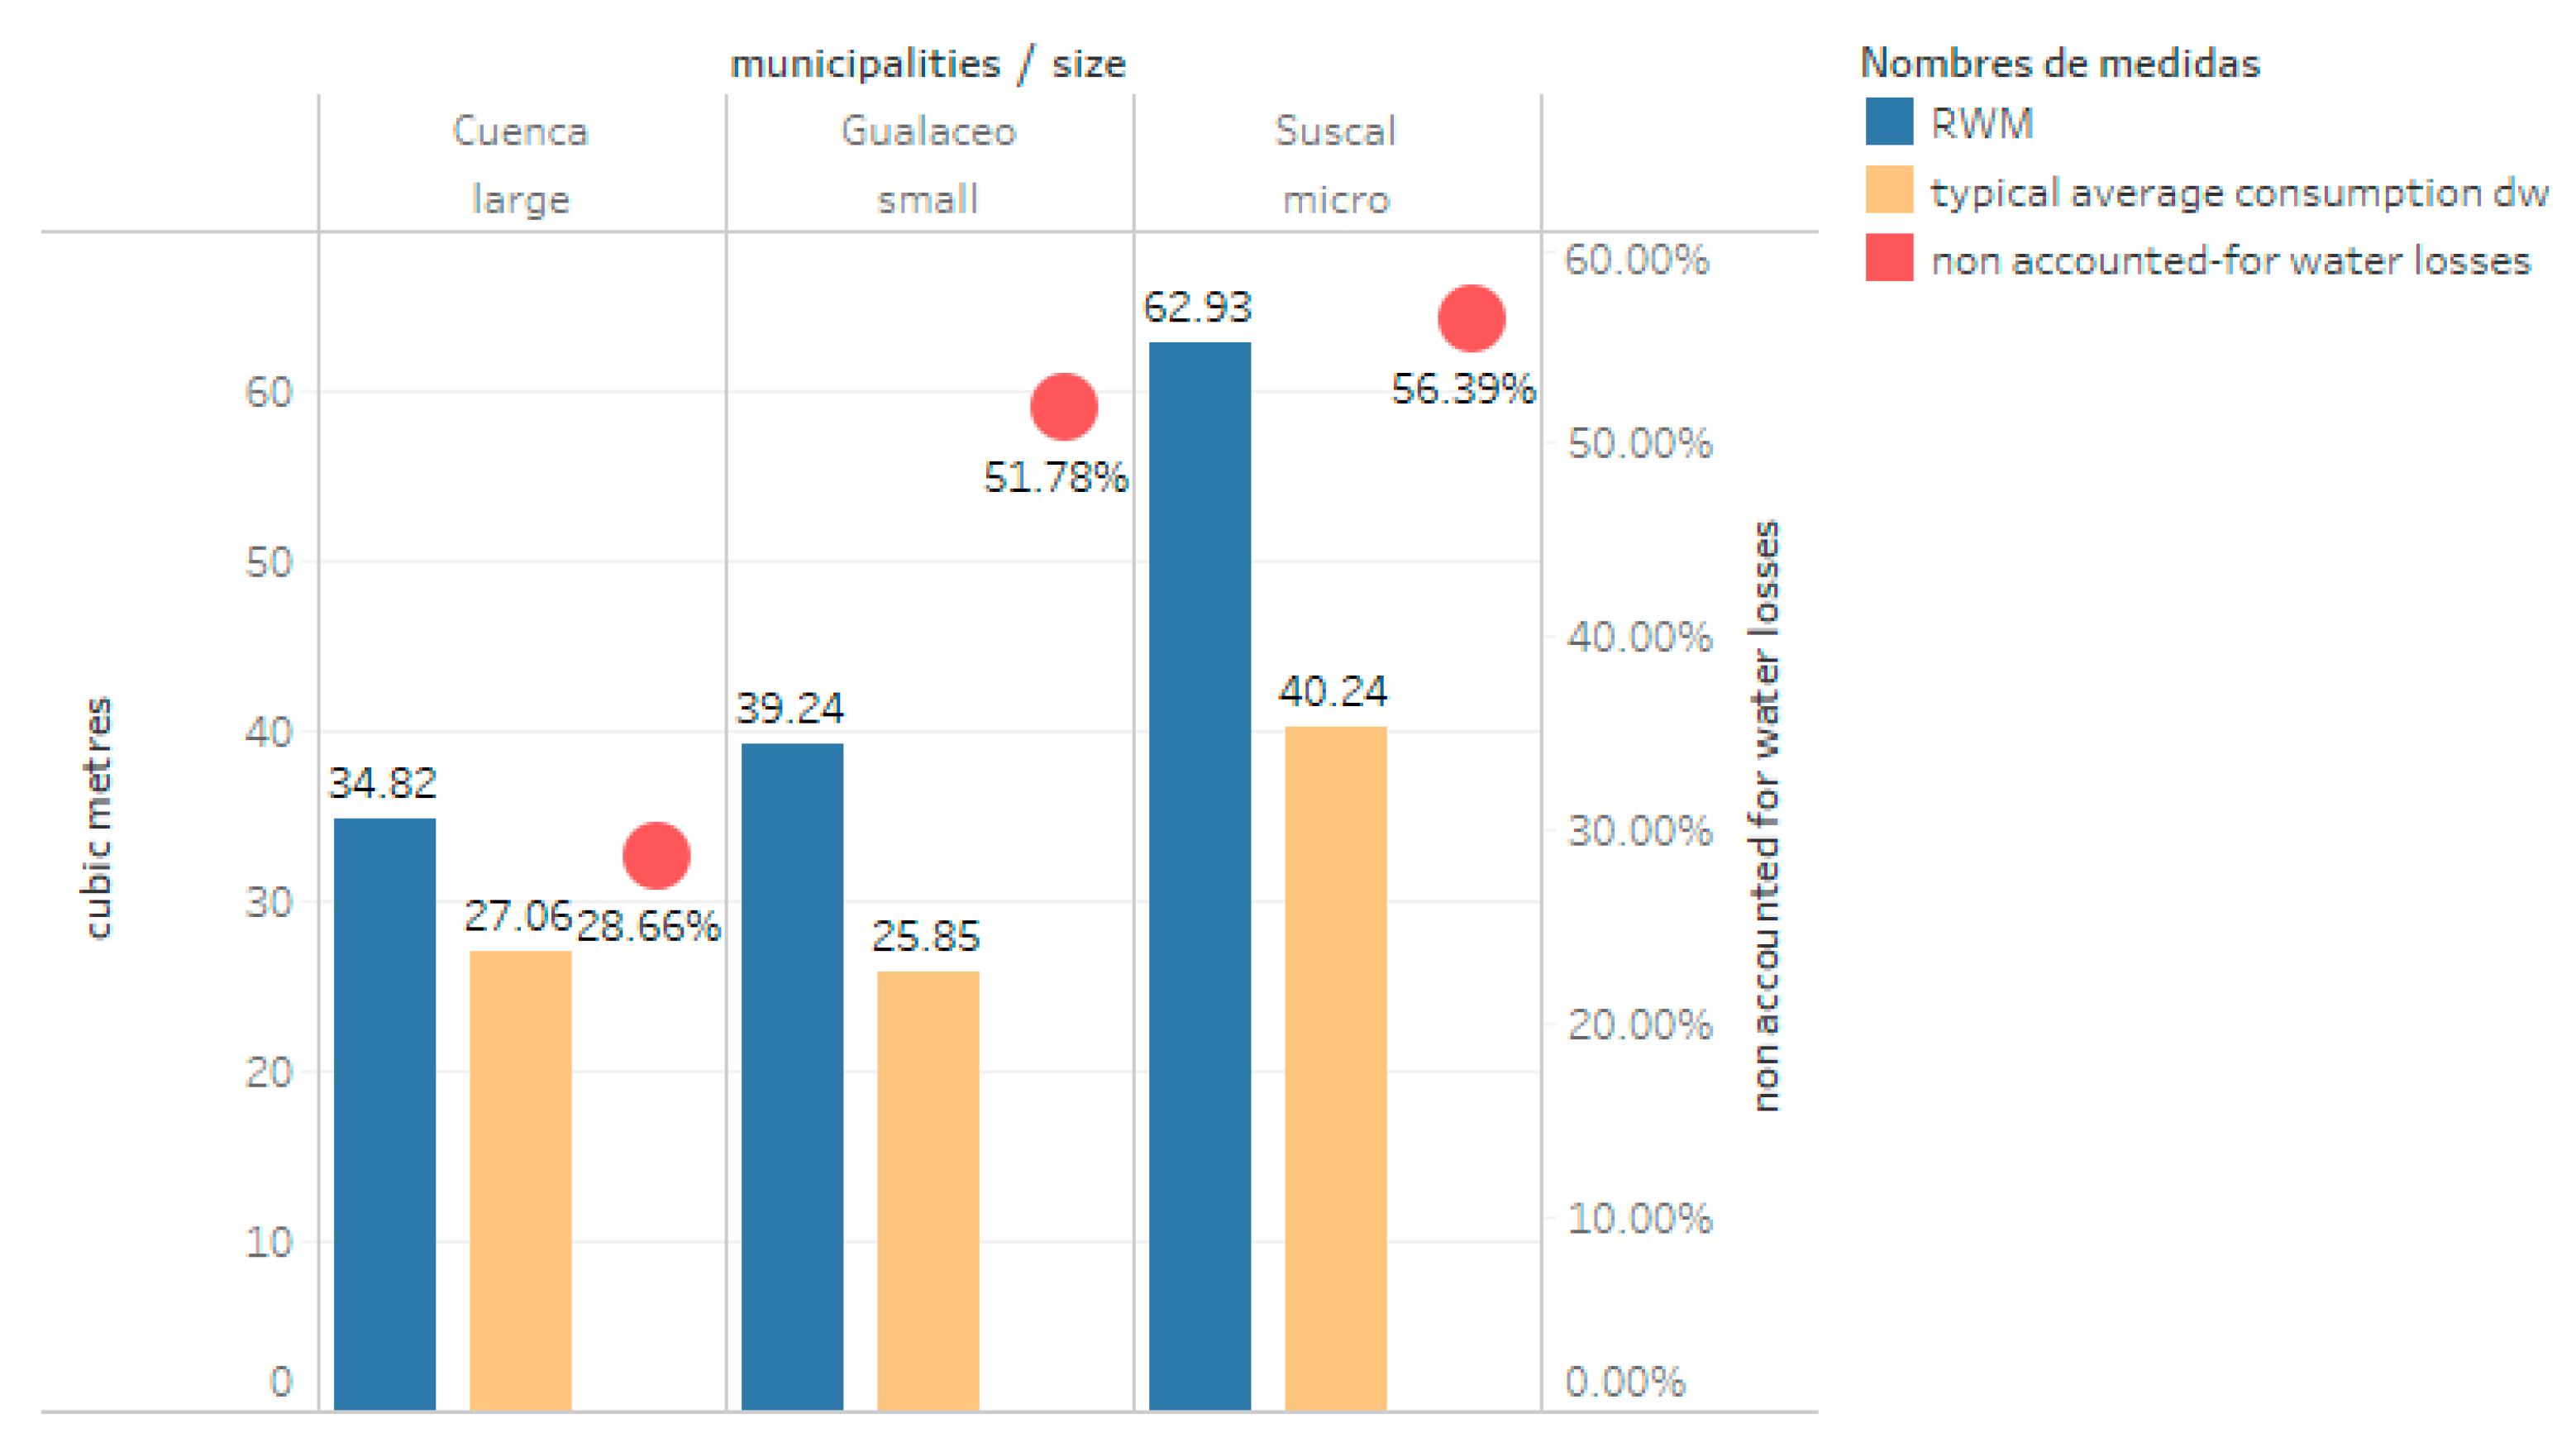
Figure 1): Cuenca the third largest city in the country, with 591.996 inhabitants, recognized for its efficiency in the provision of public services [2,3], Gualaceo and intermediate city with 47.411 inhabitants [3], and Suscal a small city of 5.998 inhabitants, with an indigenous majority (data based on [3,4]). The working hypothesis is that the application of the Minimum Amount of Raw Water (MARW) negatively affects the three subnational governments, both suppliers and most vulnerable consumers. We expect a greater effect in municipalities that are less efficient in the provision of potable water services and that have a socially and economically vulnerable population.

2. Background

According to the World Health Organization (WHO), access to the vital minimum amount of drinking water is directly related to hygiene and public health. Thus, ensuring a minimum access to water is crucial.
The WHO states that there should be a minimum acceptable quantity of water to cover basic needs, such as drink, food preparation and hygiene. In order to measure water requirements with provision of water services and its impact on healthcare, the WHO establishes four service levels (see Table 1): service without access, basic access, intermediate access and optimal access [5]. The first level, service without access (less than 5 L per day), cannot guarantee minimum hygiene conditions and entails a high risk for poor health. Basic access (20 L per day) guarantees basic hygiene (hand-washing), although the risk for poor health remains high. Intermediate access (50 L per day) assures basic personal and food hygiene and health. Finally, optimal access (100 L per day and more), satisfies all hygiene needs.
Access to water for domestic consumption is defined by WHO as: “water used for all usual domestic purposes including consumption, bathing and food preparation”, taking into account the following categories: drinking water (for drinking and cooking); water for personal hygiene (basic needs and personal care); and, water for domestic cleaning (car-washing, garden-watering, etc.) [5]. However, authors such as Thompson [6], suggest that a fourth category, “productive use”, should be included. This category should be applied to households with depressed economies in developing countries, in reference to the water that is used for small-scale agriculture and livestock, construction, etc. (Falkenmark argues that 1369 L/c/d (500 m3/c/y) is the minimum required to run a modern society living in semi-arid conditions, with 1095 L/y) required for irrigation, and 274 L/c/d (100 m3/c/y) for domestic and industrial needs).
The United Nations Children’s Fund (UNICEF) and World Health Organization (WHO), through their Joint Monitoring Program, define reasonable access to water as “the availability of at least 20 L per person per day from a source within one kilometer of the consumer’s home” [6]. However, this definition refers to access, not to the quantity that is recommended in liters per capita per day (LPCPD). The discussion regarding the minimum amount of water needed by an individual includes other variables such as the type of activity that is performed, the temperature, the geographical conditions, etc. [7].
Regarding the protection of rights related to water resources, the 108th plenary meeting of the General Assembly of United Nations (With 122 votes in favour, no votes against, and 41 abstentions), held in 28 July 2010, recognized drinking water and sanitation as human rights. In this sense, Ecuador was ahead of the region by innovatively recognizing water as a fundamental and inalienable human right in the 12th article of the 2008 Constitution. Water is also considered a strategic national heritage of public use, and above all, essential for life. Other countries that made the same recognition prior to 2010 are South Africa (1997) (“Other countries have recognised the right to a healthy environment in their constitutional texts. Whilst over 60 constitutions refer to environmental obligations, less than a half expressly refer to the right of the citizens to a healthy environment. Only the South African Bill of Rights enshrines an explicit right to access to sufficient water” [8]), Uruguay (2004), and Bolivia (2009) [9].
When applying human rights principles to water and sanitation, the following concepts should be observed: non-discrimination and equality; access to information and transparency; participation; accountability, and sustainability. It also should include: availability, physical accessibility, quality and safety, affordability, acceptability, dignity, and privacy [10,11].
The Ecuadorian Constitution defines water as: (a) a human right; (b) a national heritage and strategic sector; (c) a public service; and (d) an element to achieve food and energy sovereignty. As a human right, it is the State's primary duty to guarantee water (Art. 3, No. 1.) In fact, water is regarded as a fundamental and inalienable human right protected under the right to well-being (Art. 12). This implies that it cannot and should not be isolated but understood in interrelation with other rights, by virtue of its interdependent and indivisible character (article 11, No. 6), especially in connection to the right to health (article 32) and to a dignified life (Art. 66).
As a strategic national patrimony of public use, water is inalienable, inseparable, non-excludable, and essential for life (Art. 12). Decision and control is the exclusive responsibility of the State, which administers, regulates, controls, and manages water in accordance with the principles of environmental sustainability, precaution, prevention, and efficiency (Art. 313). The Constitution states that water is vital for nature and for the existence of human beings and, therefore, cannot be privatized (Art. 318).
As a resource to achieve energy sovereignty, constitutional provisions establish that this sovereignty shall not be reached in detriment of, or by compromising, water supplies. To this effect, the State will promote, in the public and private sectors, the use of environmentally clean technologies, and non-polluting and low-impact alternative energies (Art. 15). Similarly, water is a development goal in Ecuador. The Constitution states that one of the goals is to recover and conserve nature in order to maintain a healthy and sustainable environment, as means to provide people and communities an equitable, permanent, and high quality access to water, air, and soil (article 276, No. 4).
Water and its preservation are also the responsibility of the State in order to achieve food sovereignty. To ensure this, the State must promote redistributive policies, which give peasants access to land, water, and other productive resources (Article 281 No. 4), bearing in mind that it is the State’s obligation to avoid the monopolization or privatization of water and its sources. In addition, the State shall regulate the use and management of irrigation water for food production, under the principles of equity, efficiency, and environmental sustainability (Article 282).
Finally, the Ecuadorian Constitution considers water and its provision a public service (Art. 314.) In fact, water sanitation, supply, and irrigation can only be provided by national or communal entities. The State will encourage alliances between public and community sectors to provide water related services (Art. 318). By means of a constitutional clause, municipal governments of Ecuador are assigned the responsibility of providing potable water, sewage and wastewater treatment, and are forbidden to suspend any of these services (Art. 264 No. 4; Art. 326 No. 15.) It is the obligation of the State, at all the levels of government, to guarantee the uninterrupted provision of public drinking water services (Art. 375 No.6).

3. State of the Art

On the 28 July 2010, the United Nations General Assembly recognized the right to water, sanitation and hygiene (WASH). WASH was granted the status of an essential human right, since it guarantees both the enjoyment of life, as well as other human rights. In its resolution 64/292, the Assembly called upon the subjects of international law to provide resources, and technical and technological assistance, especially for developing countries, so that their populations can access drinking water and sanitation. Such access must be sustainable, since there is no point in having access to water through platforms and infrastructure if this is not sustainable over time, due to low quality or high maintenance costs [10]. If this condition is not met individuals will become unprotected again and, consequently, will lack access to water.
The Inter-American Human Rights System, through the Inter-American Court, Inter-American Commission, and its case law, has developed two transcendental criteria in the field of drinking water. The first deals with quantity and quality of water for the development of a dignified life, in the case of the Xákmok Kásek Indigenous Community vs. Paraguay, of 24 August 2010. The second relates to the minimum living conditions for persons deprived of their liberty, in in the cases Vélez Loor vs. Panama, date 23 November 2010, and Pacheco Teruel et al. vs. Honduras, of 27 April 2012. This last criterion establishes that the State must provide drinking water to all inmates to guarantee a dignified life.
In general, the application of the human right to drinking water and sanitation is progressive. Each State must develop and expand its coverage so that all inhabitants can gradually have access to these services, avoiding a setback for human rights in this area. However, as pointed out [10] in the Special Rapporteur’s report on these rights: the main risks, especially in times of crisis, are the budget cuts that affect the development of infrastructure and provision of public services. This directly impacts human rights, such as the right to health, since people with fewer resources (“The cuts in public spending particularly affect the poorest and most marginalized, whose income usually comes mainly from social benefits, which depend heavily on public services and devote a greater part of their income to basic services” [10]) are unable to access quality water or have their service interrupted due to lack of payment. Given disproportionate increases in rates, the lack of income from unemployment during such times leaves vulnerable groups without the resources to pay for essential services.
In 2007, Ecuador presented the “II National Report on the Millennium Development Goals” (The report was prepared by the Millennium Social Research Center (CISMIL), composed of the United Nations Development Program (UNDP), the Latin American Faculty of Social Sciences, FLACSO in Ecuador, and the National Secretary for Planning and Development (SENPLADES)). In it, the National Secretary of Planning and Development acknowledged that while progress had been made in access to drinking water and sanitation, the territorial gaps (urban/rural, coast, highlands and Amazon Region) are still considerable. 
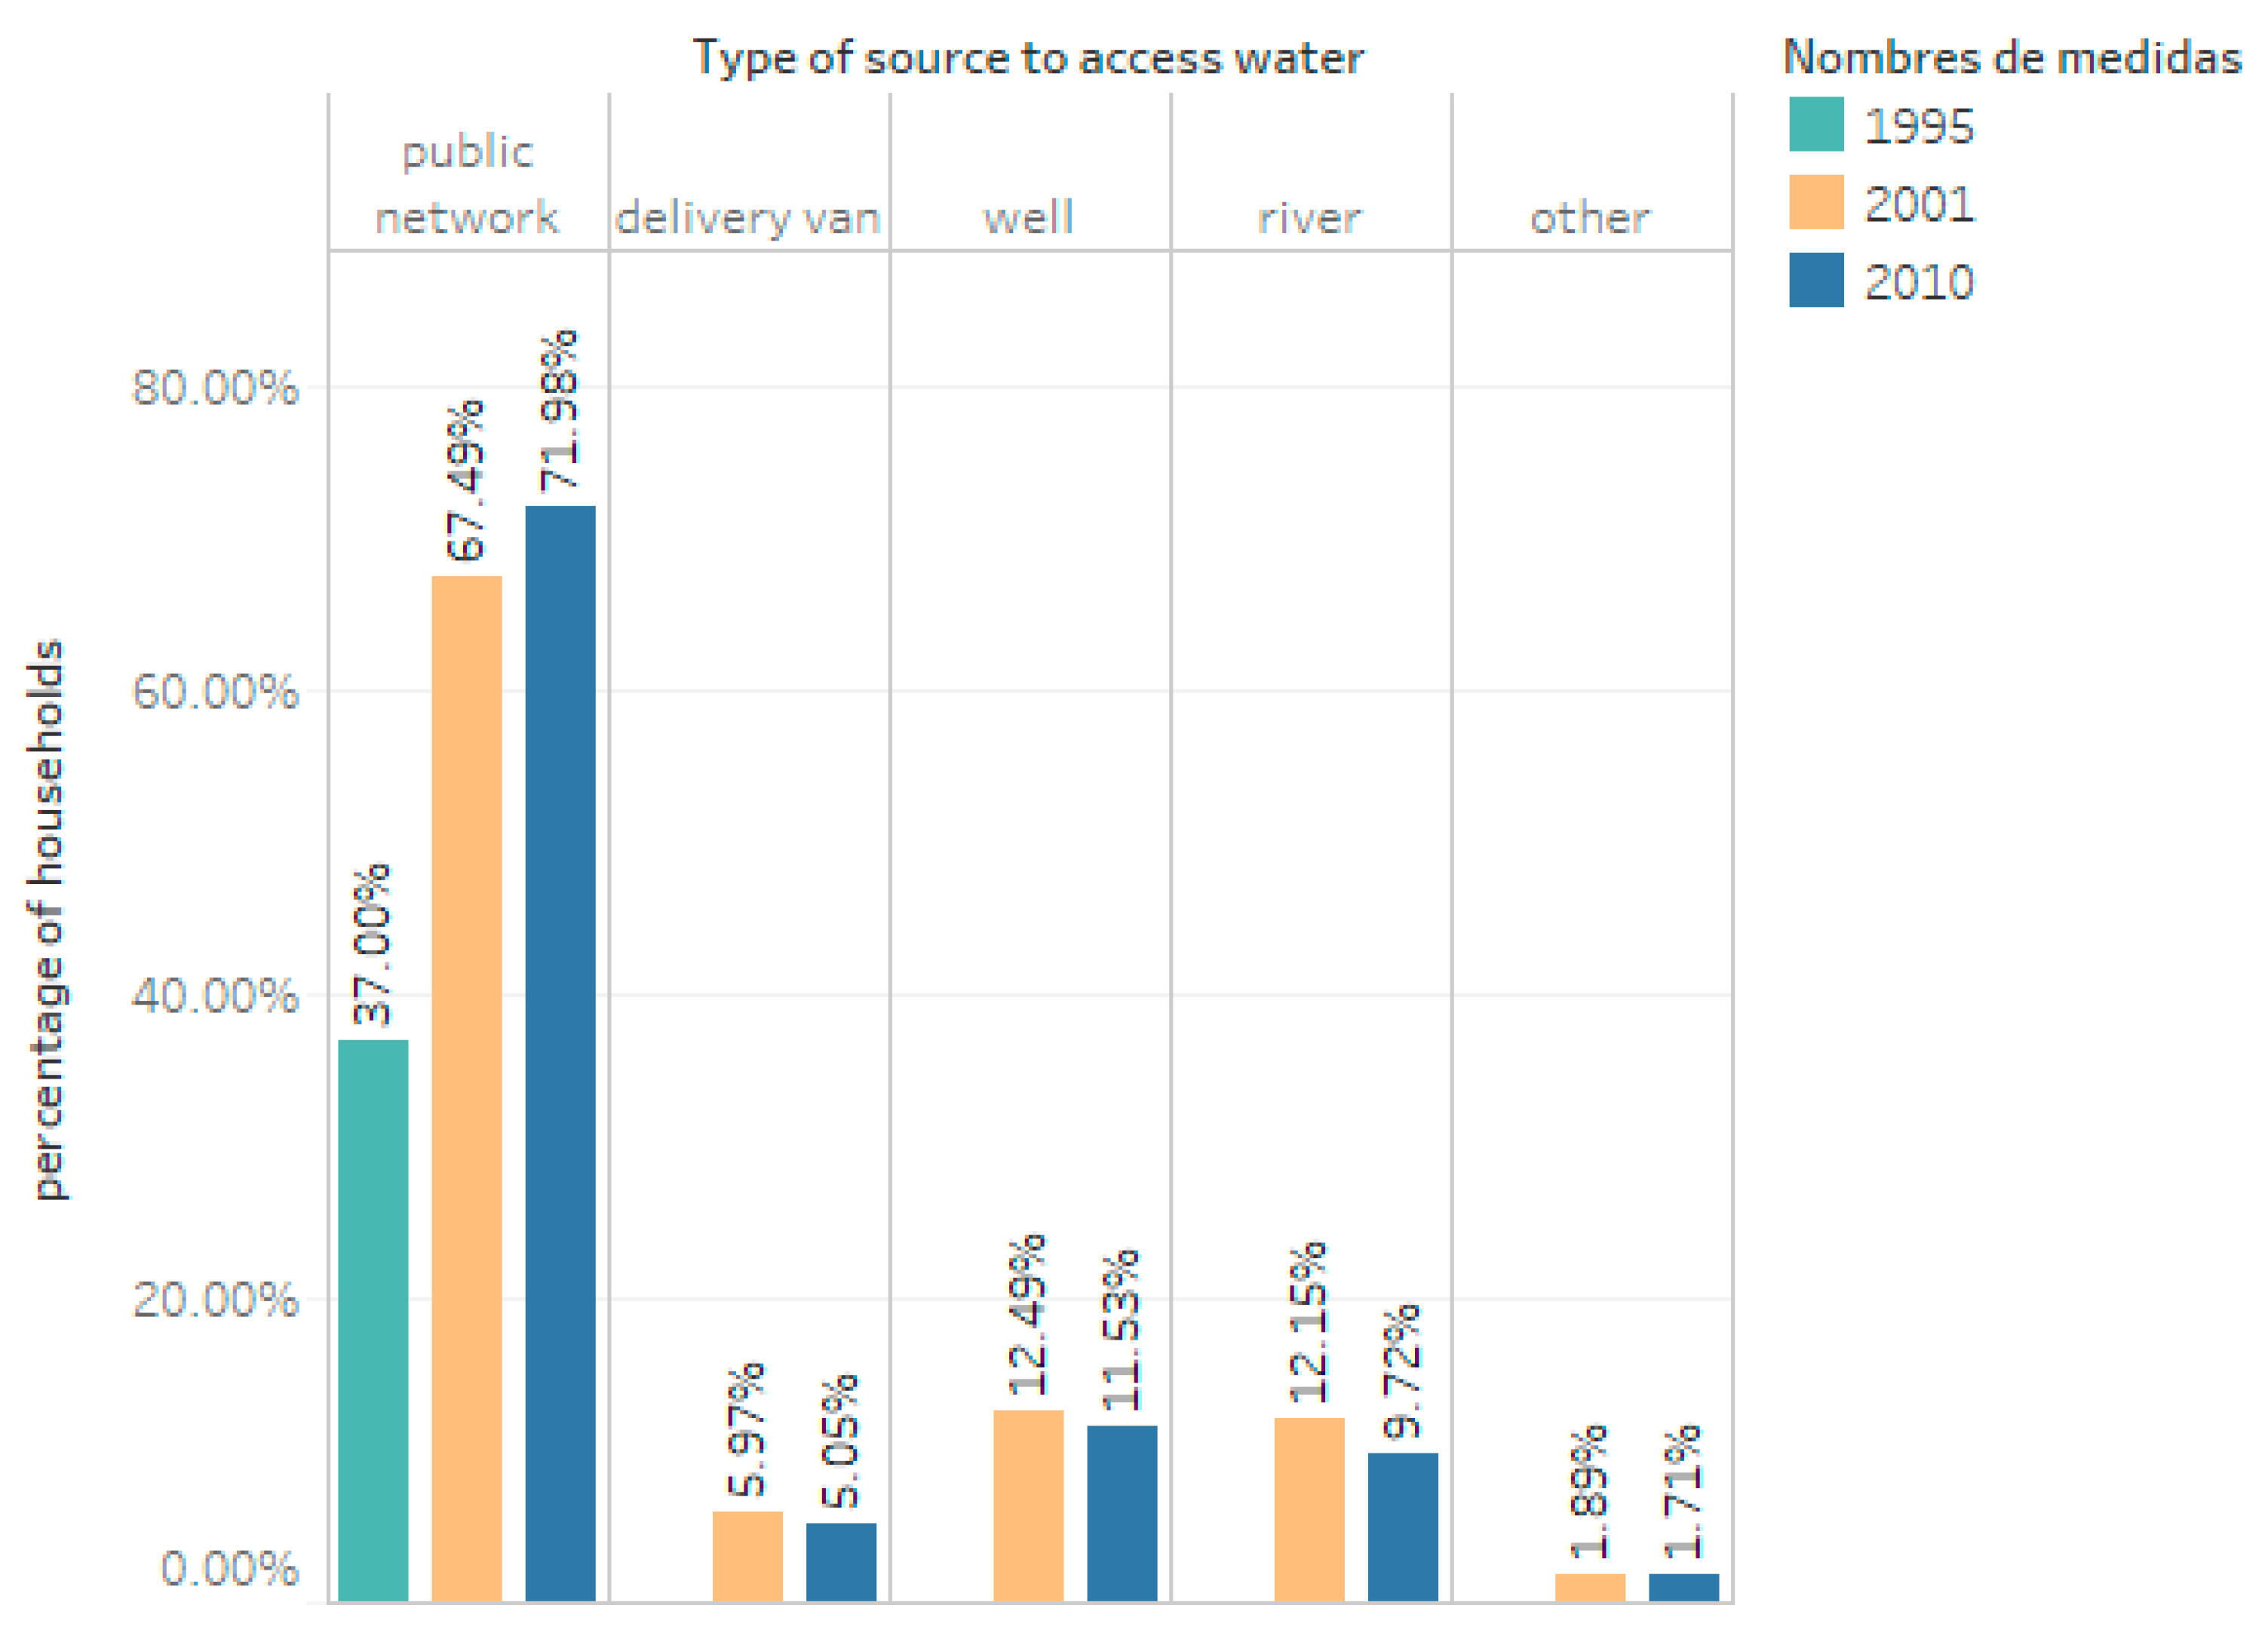
Figure 2 shows the evolution of drinking water access in Ecuador since 1995 when only 37% of Ecuadorian households had access to water through the public network. This percentage grew to 67% in 2001 and to 71.98% 2010. Ecuador’s drinking water coverage has improved in the last decade, from 69% (2006) to 83.6% (2016), thanks to the significant investment in accessibility by the Local Governments, which have the capability to provide the service. According to the statistics from the Joint Monitoring Program (JMP) of WHO and UNICEF in 2015, coverage levels of drinking water services in Ecuador have increased to 92% at a national level, 97% in urban areas, and 82% in the rural areas.

3.1. Analysis of International and National Case Law on the Vital Minimum Amount of Drinking Water

Regarding international case law, there are two cases concerning the determination of a vital minimum of drinking water. The first, in South Africa, of Lindiwe Mazibuko and others against the city of Johannesburg, in 2009, in which two issues were discussed: (a) if the basic free water supply, that is, 6 kiloliters per month for each connection holder (or, 60 L per person per day), was in conflict with the Constitution; and, (b) if the installation of prepaid water meters was legal, as they worked with coins resembling parking meters, for the excess rate. The Constitutional Court considered that as there were too many answers to the question of what constitutes a sufficient amount of water, therefore, a specific vital minimum should not be determined, since that decision corresponded to the legislator or the government as a matter of public policy.
The second case corresponds to the Constitutional Court of Colombia, in its Judgment T-740, of 2011. The Sentence determined that the vital minimum of drinking water is 50 L per person per day. The constitutional judge developed the fundamental right to water applying the Resolution of the General Assembly of the United Nations as “soft law” for the legal system, obliging the Operator to reconnect, restore the service, and review payment agreements so that the user could afford them. It also mandated the installation of a flow redactor which guarantees the minimum water for consumption (50 L). Finally, it ordered the national government, through the local government, to subsidize 50% of the costs, for the user to pay for the service.
The Colombian decision is based on the following criterion: “... The deprivation of drinking water entails a serious violation of the state obligations derived from the fundamental right to water, specifically those of availability and accessibility, inasmuch as, first, it restricts the possibility that this sector of the population, which is in a circumstance of manifest weakness, has access to the services and facilities of water, and second, the availability of water for the satisfaction of personal and domestic needs, such as the preparation of food, personal hygiene and household hygiene. Thus, in the event of failure to pay more than two consecutive billing periods, the public water utility should, as has been pointed out in this Corporation’s case law, report the credit situation of the user, and the procedure to follow, so that she can keep up to date with her obligations ...” (Full sentence available in [14]).
In the Ecuadorian case, the Constitutional Court ruled on the management and administration of strategic sectors, through decision No. 001-12-SIC-CC. This rule absolves the President’s consultation on the content of the articles 313, 315 and 316 of the Constitution. The consultant, after stating that during the 1990s there was a privatizing tendency from the State, manifests that the current Constitution seeks to guarantee the satisfaction of collective needs through the priority intervention of the State in the management of strategic sectors, as well as public services. Distinguishing between the administration, regulation, and control of those sectors, which corresponds to the Central State according to Art. 313 of the Constitution; and the management which corresponds to public companies, as established in Art. 315 of the same legal body [15].
For this reason, two doubts arise regarding the application of the mentioned articles. The first is that public companies, being part of the State, either enjoy or lack administrative, regulatory, and control powers in strategic sectors and public services. The second refers if the rest of the state organizations (such as any Ministry), have to create a public company, if they want to manage a strategic sector.
Regarding the first consultation, the Constitutional Court mentions Art. 313 of the Constitution, which establishes the exclusive power of the State to manage, regulate, control and operate the strategic sectors. Although these powers have been granted to the State, it is possible to distinguish between the central State and public companies. The first is responsible for the administration, regulation, and control through the competent public administration authorities, in accordance with the law. In addition, the seconds, the public companies which are authorized only for the management of a strategic sector, and in every case it is obligatory to obtain the authorization from the central State (Regulatory and control organs) [15].
Article 316 establishes a priority order for the management of strategic sectors and the provision of public services: State; joint ventures in which the state has a majority shareholding; private initiative and popular and solidarity economy. We have, therefore, the State’s own management, and delegation, which can appear in two cases. The first refers to the aforementioned joint ventures, and the second, to private entities [15]. The latter is exceptional and only applies when it is necessary to satisfy the general interest, and the State does not have sufficient technical or economic capacity, or when demand cannot be met by public or mixed companies [16].
Therefore, the Court concludes that the power attributed to the State in Art. 313 manifests itself through two concrete functions. The first is the authorization granted by the central State to public companies, to manage strategic sectors and provide public services. The second is in the delegation that the State can grant to non-public companies to perform such management [15].
Regarding the second consultation, the Court states that when State institutions, as a means to provide public services inherent to their competence, need to manage strategic sectors, they will not need to establish public companies for that purpose. It will only be necessary to have access to the corresponding enabling titles granted by the regulatory and control authorities [15]. Thus, the Ministries, not being public companies, can request such titles themselves.

3.2. The Vital Minimum Quantity of Drinking Water in the Ecuadorian Legislation

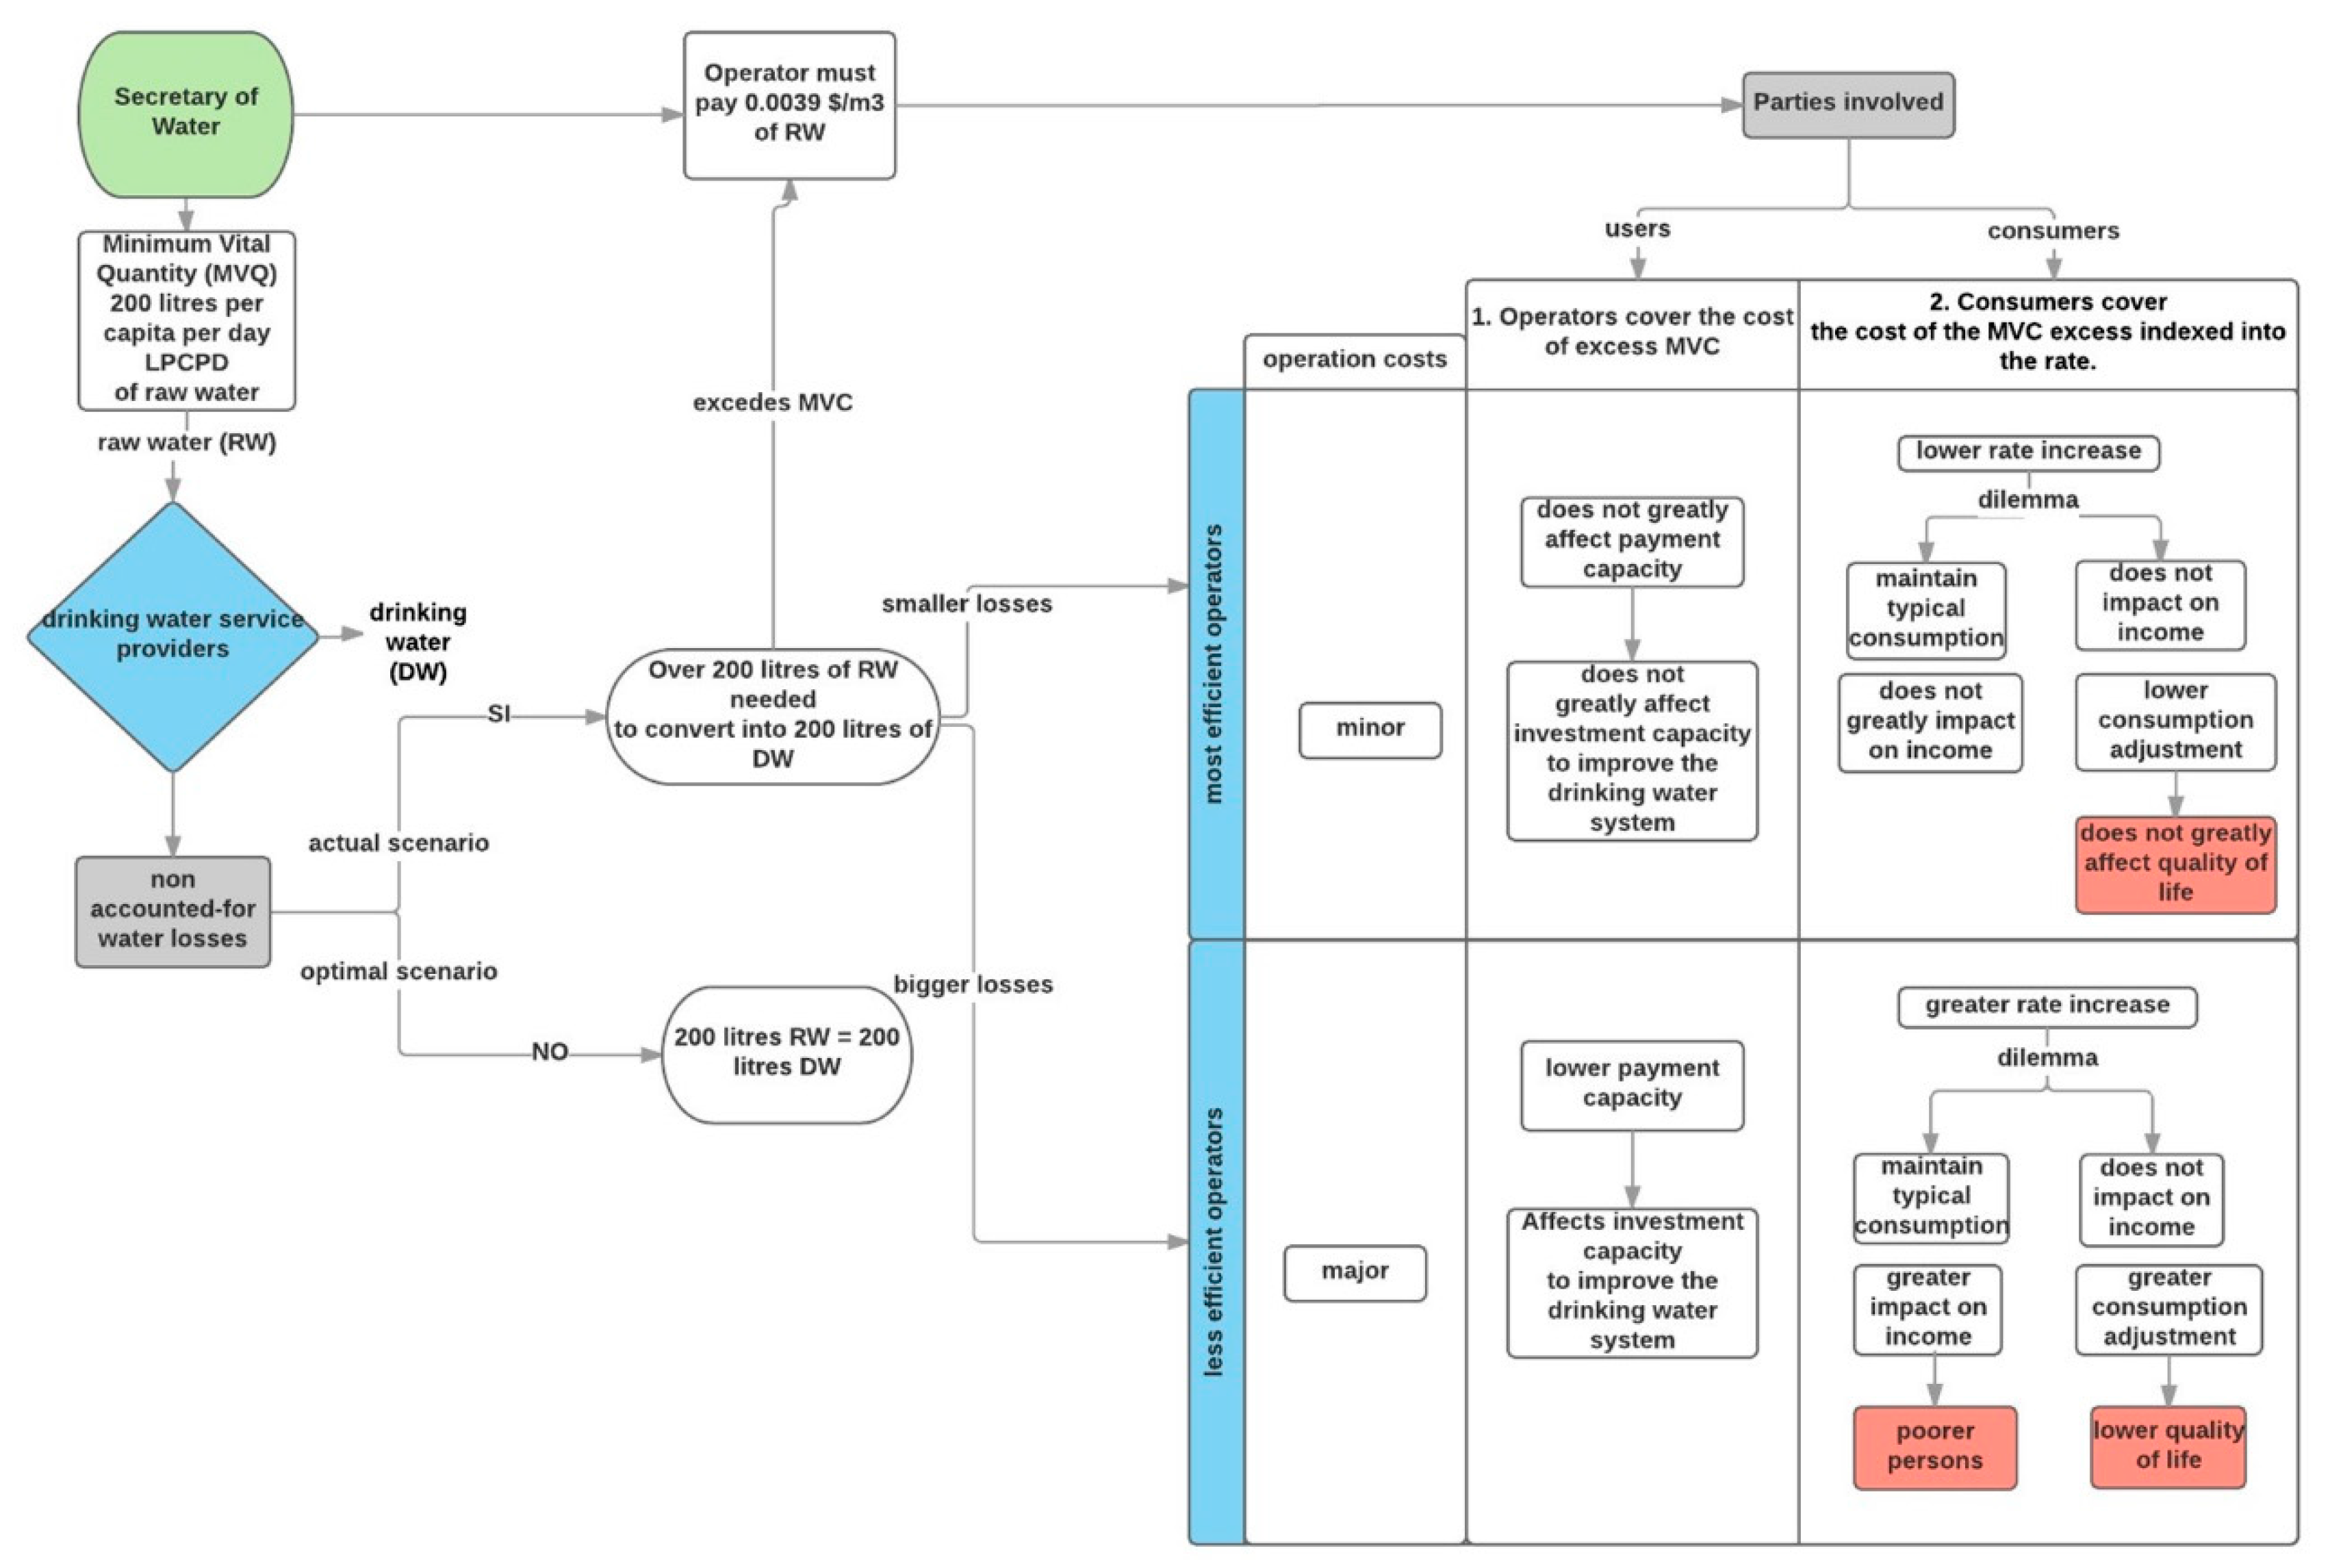
The Organic Law on Water Resources, Uses and Exploitation of Water, in defining the human right to water, refers to its availability. According to the Law water should be clean, sufficient, healthy, acceptable, accessible and affordable, for personal and domestic use. Then the vital or “vital minimum” amount of water is important since no person can be deprived, excluded or stripped of this right. It can be considered as the cornerstone on which the enforceability of the human right to water is based. In this way, raw water destined to be processed within this range is free.
Article 18 defines the competence and attribution of the Single Water Authority to set the rates to authorize the use of water. In this context, one day before the end of the last Presidential term (23 May 2017), the Secretary of Water signed Ministerial Agreements No. 2017-1522 and 2017-1523. These agreements established the calculation formula to obtain the raw water referential rate, fixing the minimum vital amount of water in 200 L per capita per day as a minimum amount unified value). Later, the new Administration (2017–2021) amended Ministerial Agreement No. 2017-1522 through Agreement No. 2017-0010, dated 28 June 2017. It established a new administration for SENAGUA—now presided by a former indigenous leader, linked to community water management, which specifically reformed the rates to authorize the use of water.
The raw water referential rate is based on the formula of total costs of water sustainability, over the authorized national volume of water, which has duration of 5 years. However, the most important thing is the differentiation made in the rate according to the type of use and/or utilization, where those who use less than 5 L per second for activities linked to food sovereignty are exempt from payment; while rates are significantly taxing for productive irrigation, industrial use, tourism, hydroelectricity and water bottling.
As for Agreement No. 2017-1523, it establishes the minimum vital amount of water in Ecuador at an equivalent of 200 L of raw water per inhabitant per day. Therefore, the excess consumed above the vital minimum should be charged for. The charging entities are the providers of drinking water services at a national level (Municipal Government or its Public Companies, and Drinking Water Boards).

4. Methodology

We developed our investigation according to the Ecuadorian Legal Framework. The article 59 of the Organic Law on Water Resources, Uses and Exploitation of Water establishes that:
“The vital quantity of raw water destined for processing for human consumption is free to guarantee the human right to water. When the established minimum vital amount is exceeded, the corresponding rate will be applied.”
In this context, the agreement No. 2017-1523, issued by the National Water Authority, in its article 3 indicates that: operators who exceed the minimum vital amount of raw water to supply households, incur a cost of USD $0.0039 per m3.
We developed the following variables and indicators to determine the extent to which the application of the minimum vital amount of drinking water established by the government affects local governments, in terms of water provision efficiency, and the economic capacity of the most vulnerable families.

4.1. Determination of the Minimum Vital Consumption

The value representing the minimum vital consumption follows the next scheme:
Consumption is distributed in categories which are called activities. According Table 2, the total of activities amounts to 154 LPCPD, a quantity to which an additional amount of 46.2 LPCPD is added, which represents a 30% of that total, up to 200 LPCPD. This 30% does not constitute a consumption activity; it directly reflects the raw water linked to the operation of the system. In this sense, an operator depending on its level of efficiency, exceed, match, or reduce that amount. When the amount is exceeded, the excess over 200 LPCPD generates a cost of USD $0.0039 per cubic meter which must be reverted to the State, according to the regulations, or charged to the household.

4.1.1. MARW’s Impact on Service Providers

In order to measure the impact of Minimum Amount of Raw Water (MARW) on the providers of drinking water, Formulas (1) and (2) apply to each local governments.
RWE(m3) = RW − MARW
where: Raw water excess RWE(m3): raw water excess in m3, measures the difference between the m3 of raw water that a local governments needs in order to satisfy the average present or typical drinking water consumption of a household, and the minimum vital amount of raw water consumption in m3 according to the regulations of the Secretary of Water. RW: raw water, refers to the quantity in m3 of raw water that a local governments needs in order to satisfy the average current or typical drinking water consumption monthly of a household. MARW: is the minimum vital amount of raw water consumption monthly in m3 which a household needs on average.
RWE (USD) = RWE(m3) × 0.0039USD
where: RWE (USD): raw water excess in USD $, measures the cost of excessive consumption of raw water in USD $ per household to be reverted to the State. This results from the product between the excess consumption of raw water in m3 times the amount of m3 which exceeds the MARW of 200 LPCPD (USD $0.0039).

4.1.2. MARW’s Impact on Households Living in Extreme Poverty:

As mentioned, the excess, once monetized, must be reverted to the State. The operator of the service in each local governments can cover such value without using the rate, or, alternatively, add that cost to the value paid by the consumer, thus giving it the appearance of a cost to cover. When municipalities index the costs of excess raw water over the rate to be paid by households, the impact of the vital minimum consumption of raw water on the income of the households living in extreme poverty [6] is determined by applying the Formulas (3)–(5).
TAC(% AI) = (TACPC(USD)
(AIPC(USD))
where: TAC(% AI): Typically Average Consumption of drinking water (TAC) as percentage of average income, measures the monthly consumption of drinking water per capita in monetary units as a percentage of the average per capita monthly income of a household considered to be living in extreme poverty. TACPC(USD): Typically Average Consumption Per Capita (TACPC), refers to the monetary value of the average monthly consumption of drinking water in a household, divided by the average number of people in a household. Average Income Per Capita (AIPC) (USD): is the average monthly income per capita of a household living in extreme poverty.
TCPC(% AI) = (TACPC(USD) + RWEPC(USD))
(AIPC(USD))
where TCPC(% AI): is the total cost per capita of the average monthly consumption of drinking water as a percentage of average income, and it measures the average monthly per capita consumption of drinking water in the monetary units that a household pays to the potable water service operators, plus the cost of the monthly excess of consumption of raw water in monetary units per capita under the assumption that the household assumes the cost; divided by the average monthly income per capita of a household considered to be poor. TACPC(USD): typically average consumption per capita, refers to the monetary value of the average monthly consumption of drinking water in a household, divided by the average number of people in a household. RWEPC(USD): Raw Water Excess Per Capita (RWEPC) in USD $, measures the cost of excess consumption of raw water in monetary units per capita. It results from the product between the excess consumption of raw water in m3 times the value of m3 which exceeds the MARW of 200 LPCPD (USD $0.0039), divided by the number of average people per household.
IH = (TCPC(% AI) − TAC(% AI))
(TAC(% AI))
where IH: impact household, measures the impact on a household living in extreme poverty (According to the National Institute of Statistics and Census of Ecuador, an individual is extremely poor by income, when the total per capita income is below a minimum income to not be considered as extremely poor, that is, when it is below the extreme poverty line, which for December 2016 was $ 47.72 [18]), as well as the growth rate represented by the additional cost that the household should pay for excess water consumption. TCPC(% AI): as is the total per capita cost of the average monthly consumption of drinking water as a percentage of average income, which includes the cost of excess water consumption. TAC(% AI): typically average consumption of drinking water as percentage of average income.

4.2. Data

The methodology described in the previous section is applied with the information from Table 3.

4.3. MARW Impact Process: Conceptual Framework

Figure 3 shows the impact scheme. During the process by which raw water is collected by service providers to convert it into drinking water for human consumption and its distribution to households, operators face unaccounted-for water losses (Unaccounted-for water losses, according to the Regulatory and Control Agency, are measured by dividing the average monthly commercialized water, and the average monthly water distributed to the network). In this sense, the possible scenarios are as follows: (1) scenario in which the operator does not exceed the value of wholesale and therefore converts 100% of raw water into drinking water; (2) scenario where the operator has a percentage that exceeds the value of increase, so that the operator needs more than 200 LPCPD to provide 200 LPCPD of drinking water to a home. In this context, operators who exceed the minimum vital amount of raw water to supply households, incur a cost of USD $0.0039 per m3, a cost that is not covered by those who are efficient enough to not generate excess.
In the case of interest, in which excess cost is generated, the value can be assumed by the operator without transferring it to the consumer, which increases the rate if the household maintains typical or higher levels of consumption. Therefore, the following would occur.

4.3.1. Less Efficient Operators Who Assume the Cost of the Excess

Those water service providers who face high loss percentages, have higher operating costs; therefore, if they assume the excess costs, the entity is affected in its solvency, which in turn affects its investment capacity to make improvements in the system.

4.3.2. Less Efficient Operators Who Charge the Excess Cost through the Rate Paid by the Household

Operators with high percentages of losses that index the costs of excess into rates, cause an increase in them. As a result, if a household chooses to maintain its typical consumption, it would have to pay more for the liquid and its income would be affected. However, it may also choose not to affect its income and would then be forced to reduce consumption levels which consequently affect life quality (see Figure 3).

5. Results

Economic Analysis

5.1.1. Typical Consumption of Water by Local Governments

Local governments need raw water to transform it into drinking water. The level of raw water required depends on the level of efficiency at all stages of service delivery. In this case, it is measured by the percentage level of unaccounted-for water losses. Figure 4 shows the typical household consumption of drinking water by local governments, and it also shows the raw water needed by a local government to supply the consumption of drinking water to the household in question.
In this sense, in the city of Cuenca, a household consumes on average 27.06 m3 of drinking water per month. However, the water service operator of the city needs an average of 34.82 m3 raw water per month to supply the usual consumption of a home, due to a 28.66% of unaccounted water losses. In the case of Gualaceo, the quantities of water needed to supply the current water consumption are even higher (39.24 m3 of raw water to supply 25.85 m3 of drinking water as the average household consumption), due to a higher percentage of losses (51.78%). In Suscal, the operator of this city needs on average 62.93 m3 of raw water per month to supply 40.24 m3 of drinking water as the usual average consumption of one household per month. The high consumption of this city’s households may be due to the low prices paid by households (on average $3.7) and the likely use of water for other activities not included in the MARW calculation formula.
Using Equation (1), the results indicate that the households that consume larger amounts of drinking water require, in proportion, larger amounts of raw water; an amount which is also higher in cantons where the percentage of losses is higher. In Cuenca (canton with a lower percentage of losses compared to the rest of the cantons under study), RWE is 12.67 m3. In addition, RWE are even larger in small and micro-sized cantons such as Gualaceo (16.70 m3) and Suscal (39.56 m3), which is evidently due to the high average consumption of a household (as in Suscal) and the high percentages of losses (see Figure 5a).
As a result, applying Equation (2), we obtain that the operators with lower rates of losses (Cuenca’s case) would pay the state about $0.05 monthly per household, if Cuenca household maintains its usual average monthly consumption levels of drinking water. The most affected operators are those with the higher rates of losses and higher consumption per household. Therefore, if Gualaceo households continue with the usual average consumption, the operator should pay the state $0.06 monthly per household, while Suscal must pay a value around $0.15 per month per household, which is about 3 times more than what a more efficient operator (such as Cuenca) should pay (see Figure 5b).

5.1.2. MARW Impact on Households Living in Extreme Poverty by Income

Formulas (3)–(5) were applied to measure the effects of the application of the vital minimum of water consumption on households considered to be extremely poor by income. To do so, the average number of persons per household is considered, following the 2010 census of population and housing in Ecuador, which is 3.69; 3.77 and 3.9 for the cantons of Cuenca, Gualaceo and Suscal, respectively. This means that the minimum vital monthly amount of water for a household is 22.1; 22.6 and 23.4 cubic meters of drinking water for the same cantons, in that order.
Since there are different levels of unaccounted-for water losses, there is an excess of raw water use compared to the average monthly water consumption of a household. If the excess MARW rate (USD $0.0039) is applied to the excess MARW used, the monthly cost per household for excess consumption is of $0.05; $0.06 and $0.15 per local governments respectively (see Table 4), when the local governments rates the excess. If it does not, it ought to use other sources of income to revert the payment to the State. In the cases in which the operators index the payment for the excess into the rates, the household should pay for the excess. Consequently, those households living in poverty would be mostly affected.
After applying the Formulas (3)–(5), the typical consumption per capita is obtained as a percentage of the average monthly income per capita in households considered extremely poor. By including the cost of excess MARW, the total cost to be paid by the household for the consumption of raw water increases in relative terms. The generated variation represents the affectation to the home considered in extreme poverty, thus, a home belonging to canton Suscal should pay an additional 4.17% (of their average income). The results indicate that households with greater economic difficulties and also those in cities with less efficient operators, experience a greater impact on their income (in the case of households in Suscal) compared to households considered in extreme poverty living in cities with more efficient water service providers (there are less losses in the case of Cuenca).
In sum, the application of the minimum vital water consumption has economic implications both for service operators and the families that belong to these municipalities. The level of inefficiency (efficiency) is a key factor in the final outcome of the implementation of the MARW. Thus, operators with less water losses will face lower costs (or none, if their loss is within the increase value of the formula) and therefore the households they serve can maintain their typical levels of consumption and do not see their income affected. On the other side, operators that handle high levels of raw water loss will assume higher costs to provide the service, while households face the dilemma of maintaining their levels of consumption and pay more, if the operator charges the cost, or modifying their levels of consumption with the subsequent effect on their quality of life.
Results show that, in fact, there is a correlation between the size of the local governments, the efficiency of the operator, and the affectation to the income of the poorest families; which implies that the application of the MARW adversely affects the smaller municipalities, the less efficient operators, and the most economically vulnerable families.

6. Conclusions

The standardization of MARW in Ecuador does not consider differences in municipalizes’ size, efficiency in service provision and income levels of their populations. Far from being a convergence factor, it widens the differences between them. Regarding water services provision, the enforcement of vital minimum amount of water regulation “punishes” least efficient operators. Therefore, to sustain their finances, operators transfer to the cost to their clients, that is, the families which are provided with the service. The families most affected by the application of the MARW are those settled in municipalities with lower incomes and a greater indigenous population. The possibilities for these families are to pay more in order to maintain level of consumption or consume less in order not to adversely affect the family finances, even if this means affecting their quality of life. These findings suggest that the water authority should establish an MARW that captures the differences between the Ecuadorian municipalities.

Acknowledgments

The authors thank the research assistance of Eco. Fanny Cabrera from the Faculty of Economics and Administration of the University of Cuenca, and students Adriana Abril and Francisco Bermeo from the school of law at the Faculty of Jurisprudence, Political and Social Sciences of the University of Cuenca.

Author Contributions

Andrés Martínez Moscoso designed Section 2. Background and Section 3.2. The vital minimum Quantity of Drinking Water in the Ecuadorian Legislation; Víctor Gerardo Aguilar Feijó designed Section 4. Methodology and Section 5. Results; and Teodoro Verdugo Silva contributed with the Section 3.1. Analysis of International and National Case Law on the Vital Minimum Amount of Drinking Water.

Conflicts of Interest

The authors declare no conflict of interest.

References and Note

  1. Pigretti, E.; Dino Bellorio, C.; Cavalli, L. Environmental Law of Waters, 1st ed.; LAJOUANE, Gráfica Sur Editora: Buenos Aires, Argentina, 2010; ISBN 978-84-7429-522-1. [Google Scholar]
  2. Decentralized Atonomous Municipal Government of Canton Cuenca. Cuenca Has the Best Drinking Water in the Country. Available online: http://www.cuenca.gob.ec/?q=content/cuenca-cuenta-con-la-mejor-agua-potable-del-país (accessed on 8 December 2017).
  3. Instituto Nacional de Estadística y Censos (INEC). Population Projections. Available online: http://www.ecuadorencifras.gob.ec/proyecciones-poblacionales/ (accessed on 8 December 2017).
  4. Instituto Nacional de Estadística y Censos (INEC). Population and Demography. Available online: http://www.ecuadorencifras.gob.ec/censo-de-poblacion-y-vivienda/ (accessed on 8 December 2017).
  5. World Health Organization/United Nations International Children’s Emergency Fund. WHO/UNICEF Joint Monitoring Program for Water Supply and Sanitation; Global Water Supply and Sanitation Assessment 2000 Report; WHO/UNICEF: Washington, DC, USA, 2000. [Google Scholar]
  6. Thompson, J.; Porras, I.T.; Tumwine, J.K.; Mujwahuzi, M.R.; Katui-Katua, M.; Johnstone, N.; Wood, L. Drawers of Water II: 30 Years of Change in Domestic Water Use and Environmental Health in East Africa; International Institute for Environment and Development: London, UK, 2001. [Google Scholar]
  7. Chenoweth, J. Minium water requirement for social and ecomomic development. Desalination 2008, 229, 245–256. [Google Scholar] [CrossRef] [Green Version]
  8. Scanlon, J.; Cassar, A.; Nemes, N. Water as a Human Right; IUCN Envoronmental Law Program; International Union for Conservation of Nature: Gland, Switzerland, 2004. [Google Scholar]
  9. Embid-Irujo, A.; Domínguez-Serrano, J. (Dir.). The Quality of Water and Its Legal Regulation. (A Comparative Study of the Situation in Spain and Mexico); Iustel, Portal Derecho SA: Madrid, Spain, 2011. [Google Scholar]
  10. De Albuquerque, C. Report of the Special Rapporteur on the Human Right to Drinking Water and Sanitation; United Nations: Geneva, Switzerland, 2013. [Google Scholar]
  11. De Albuquerque, C. Realising the Human Rights to Water and Sanitation: A Handbook by the UN Special Rapporteur Catarina de Albuquerque; Office of the High Commissioner for Human Rights, UN Habitat: Bangalore, India, 2014. [Google Scholar]
  12. Instituto Nacional de Estadística y Censos (INEC). Census of Population and Housing. Available online: http://www.ecuadorencifras.gob.ec/sistema-integrado-de-consultas-redatam/ (accessed on 8 December 2017).
  13. Centro de Investigaciones Sociales del Milenio (CISMIL). II National Report of the Millennium Development Objectives Ecuador 2007. Partnerships for development. Available online: http://www.undp.org/content/dam/ecuador/pnud_ec_II_INFORME_NACIONAL.pdf (accessed on 8 December 2017).
  14. Corte Constitucional de Colombia. Available online: http://www.corteconstitucional.gov.co/relatoria/2011/T-740-11.htm (accessed on 17 October 2017).
  15. Constitutional Court of Ecuador. SENTENCE No. 001-12-SIC-CC, CASE No. 0008-10-IC. Available online: http://portal.corteconstitucional.gob.ec:8494/FichaRelatoria.aspx?numdocumento=001-12-SIC-CC (accessed on 15 December 2017).
  16. Ecuador, Organic Code of Production, Trade and Investment, Art. 94. Available online: http://www.wipo.int/wipolex/es/details.jsp?id=11417 (accessed on 25 October 2017).
  17. SENAGUA. Memorandum No. SENAGUA-SAPYS.2-2016-0214-M. 2016.
  18. Instituto Nacional de Estadística y Censos (INEC). National Survey of Employment, Unemployment and Underemployment. Indicators of Poverty and Inequality. 2016. Available online: http://www.ecuadorencifras.gob.ec/empleo-diciembre-2017/ (accessed on 20 October 2017).
Figure 1. Subnational governments studied and population in thousands of inhabitants. Source: Prepared by the Authors based on population projections of INEC [4].
Resources 07 00015 g001
Figure 2. Access to water in Ecuadorian households by type of source (1995–2010). Source: Prepared by the Authors based on [12,13].
Resources 07 00015 g002
Figure 3. MARW impact.
Resources 07 00015 g003
Figure 4. Typical water consumption of a household by local governments.
Resources 07 00015 g004
Figure 5. Excess use of raw water in m3 and USD, according to the percentage of unaccounted-for water losses of a household with a typical level of consumption, per local governments. (a) Excess use of raw water in cubic meters of a household according to the percentage of water losses not accounted- for by local governments; (b) Excess use of raw water in monetary units of a household according to percentage of water losses not accounted-for by local governments.
Resources 07 00015 g005
Table 1. The vital minimum of drinking water (World Health Organization).
Service LevelAccess LevelLevel of Effect upon Health
Without accessLess than 5 L per dayCannot guarantee minimum hygiene conditions and entails a high risk for poor health.
Basic access20 L per dayGuarantees basic hygiene (hand-washing), although the risk for poor health remains high.
Intermediate access50 L per dayAssures basic personal and food hygiene and health risks are low.
Optimal access100 L per day or moreSatisfies all hygiene needs, with a very low risk to health.
Source: Prepared by the Authors based on [5].
Table 2. Minimum vital amount of raw water. Based on [17].
ActivityConsumption (L/h/d)Justification
Larger body hygiene (shower)802 × 8 L/m × 5 min (expenditure 0.134 L/s)
Minor body hygiene (washing hands, teeth, etc.)9average referential value
Toilet244 flushes × 6 L
Laundry20average referential value
Dish washing9average referential value
Consumption, cooking12average referential value
Sub Total154
Increase due to operation of the system, trade, industries and losses (30%)46.2
Total200.2
Vital Amount of Adopted Raw Water200
Table 3. Data source.
VariableDescriptionUnit of MeasurementData Source
RWE (m3)Raw Water Exccess (Formula (1))m3calculation
RW (m3)Raw Water collected by the municipality: (TAC(m3)) × (1 + percentage non accounted for water losses)m3calculation
TAC (m3)Typical Average monthly consumption of drinking water of a household: It is calculated through TAC(USD) and the tariff specifications.m3calculation
TAC (USD)Typical Average monthly consumption of drinking water in a household in USD $USD $National Survey of Employment and Underemployment section environment December 2016 in Ecuador [16]
Tariff specificationsInformation on the tariff structure of the drinking water serviceUSD$ per m3 in blocks consumptionAvailable on the official pages of each subnational governments (case of Cuenca y Gualaceo), and ARCA a (case of Suscal)
Percentage non accounted for water lossesPercentage not accounted for water losses in the networkPercentageOfficial information of ARCA
MARWMinimum Amount of Raw Water monthly per household: MARW monthly in m3 per habitant × number of people per householdm3calculation
Number of people per householdAverage people in a householdPeoplePopulation and Housing Census 2010
MARW per habitantMinimum Vital Consumption monthly per habitant in m3: (MARW daily per habitant in L × 30 days)/1000m3calculation
MARW daily per habitant in litersMinimum Amount of Raw Water daily per habitant in literslitersMemorando Nro. SENAGUA-SAPYS.2-2016-0214-M
RWE(USD)Raw Water Exccess in USD $ (Formula (2))USD $calculation
TAC(% AI)Typical Average Consumption monthly of a household (Formula (3))Percentagecalculation
TACPC(USD)Typical Average Consumption per cápita: TAC(USD)/number of people per householdUSD $calculation
AIPC(USD)Average Income per capita: AI(USD)/number of people per householdUSD $calculation
AI(USD)Average income monthly of a household living in extreme povertyUSD $National Survey of Employment and Underemployment complete section December 2016 in Ecuador [16]
TCPC(%IP)Total cost per capita (Formula (4))Percentagecalculation
RWEPC(USD)Raw Water Consumption Excess Per Capita: RWE(USD)/number of people per householdUSD $calculation
IHImpact on household (Formula (5)): growth monthly in payment for drinking water monthly consumptionPercentagecalculation
a Water regulation and control agency (ARCA by its initials in Spanish).
Table 4. Excess consumption of minimum vital raw water in a household in m3 and monetary units per local governments.
MunicipalitiesSizeAverage Persons Per HouseholdHC Monthly Average (USD/Household)RWE (USD)AIPC (USD)TAC (% AI)TCPC (% AI)IH
Cuencalarge3.69$15.78$0.05$30.4214.05%14.10%0.31%
Gualaceosmall3.77$8.02$0.06$34.506.16%6.21%0.81%
Suscalmicro3.90$3.70$0.15$27.973.40%3.54%4.17%

