Global Projection of Lead-Zinc Supply from Known Resources


1
Institute for Sustainable Futures, University of Technology Sydney, 235 Jones St, Ultimo, NSW 2007, Australia
2
Independent Scholar, Sitka, AK 99835, USA
3
Environmental Engineering, School of Engineering, RMIT University, Melbourne City Campus, 124 La Trobe St, Melbourne, VIC 3000, Australia
*
Author to whom correspondence should be addressed.
Resources 2018, 7(1), 17; https://doi.org/10.3390/resources7010017
Submission received: 31 October 2017
/
Revised: 20 February 2018
/
Accepted: 22 February 2018
/
Published: 28 February 2018
Abstract
:Lead and zinc are used extensively in the construction and automotive industries, and require sustainable supply. In order to understand the future availability of lead and zinc, we have projected global supplies on a country-by-country basis from a detailed global assessment of mineral resources for 2013. The model GeRS-DeMo was used to create projections of lead and zinc production from ores, as well as recycling for lead. Our modelling suggests that lead and zinc production from known resources is set to peak within 15 years (lead 2025, zinc 2031). For lead, the total supply declines relatively slowly post peak due to recycling. If additional resources are found, these peaks would shift further into the future. These results suggest that lead and zinc consumers will need to plan for the future, potentially by: seeking alternative supplies (e.g., mine tailings, smelter/refinery slags); obtaining additional value from critical metals contained in lead-zinc ore deposits to counter lower grade ores; identifying potential substitutes; redesigning their products; or by contributing to the development of recycling industries.
1. Introduction
Questions surrounding the best approaches to managing the sustainable supply of natural resources on our planet have been answered in different ways, depending on the type of resource that is under consideration. For example, declines in renewable resources, such as forests [1] and fish [2] populations, have presented different problems to declines in resources like oil [3] or phosphorus [4], which are non-renewable over the span of a human lifetime.
Even within a subset of non-renewable resources, such as the wide range of minerals used to produce industrial metals like zinc, lead, copper, aluminum, and lithium, or alloys like steel, differences in approaches to analysis and management exist. For example, zinc is often mined with lead; and copper, aluminium, and steel are used in vast quantities and are also often recycled, whereas lithium is hardly recycled at all. Peak-type resource modelling is aimed at gaining insight into long-term management strategies for minerals that play significant roles in human societies. In generating one or more endpoints for existing production from known resources, it becomes possible to suggest both potential consequences for existing systems, and potential remedies.
Despite the opportunities for such modelling to deliver insights into improved resource management (and societal benefit), some suggest that they are ultimately unnecessary. Some have argued that declines in economic resources of metals are likely to be addressed by new deposits [5,6,7], and changes in technology that make existing uneconomic deposits viable [5] (e.g., development of new process technology for the McArthur River deposit, Australia [8]), or that make mining wastes salvageable [5,9,10,11,12,13,14]. A number have also pointed to the theoretical recyclability [5,10,15,16] and high quality of in-use materials [5,17,18]. Others have argued that such changes are more likely occur in a timely way when there is greater awareness of the potential for disruptions [5].
Our view is that projections of ‘known resource mining through time’ fill a fundamental gap in publicly available knowledge. Whilst geological surveys such as the US Geological Survey update static estimates of resources for various minerals, data on the projected utilization of these resources through time is generally held privately (by industry). As will be shown in this paper, such analysis helps to paint a much more nuanced picture of the time horizon in which the world can rely on known resources to meet demand. It can then support subsequent analysis (not undertaken in this paper) of how changes in rates of exploration, recycling, and demand may affect possible social, geopolitical, and environmental impacts.
Zinc and lead are considered together in this paper as many zinc deposits also contain lead. Both are long-established industrial metals with established patterns of primary and secondary production. Often found together, these minerals follow very different paths in use, and re-use, making them an interesting comparison with respect to modelling future availability.
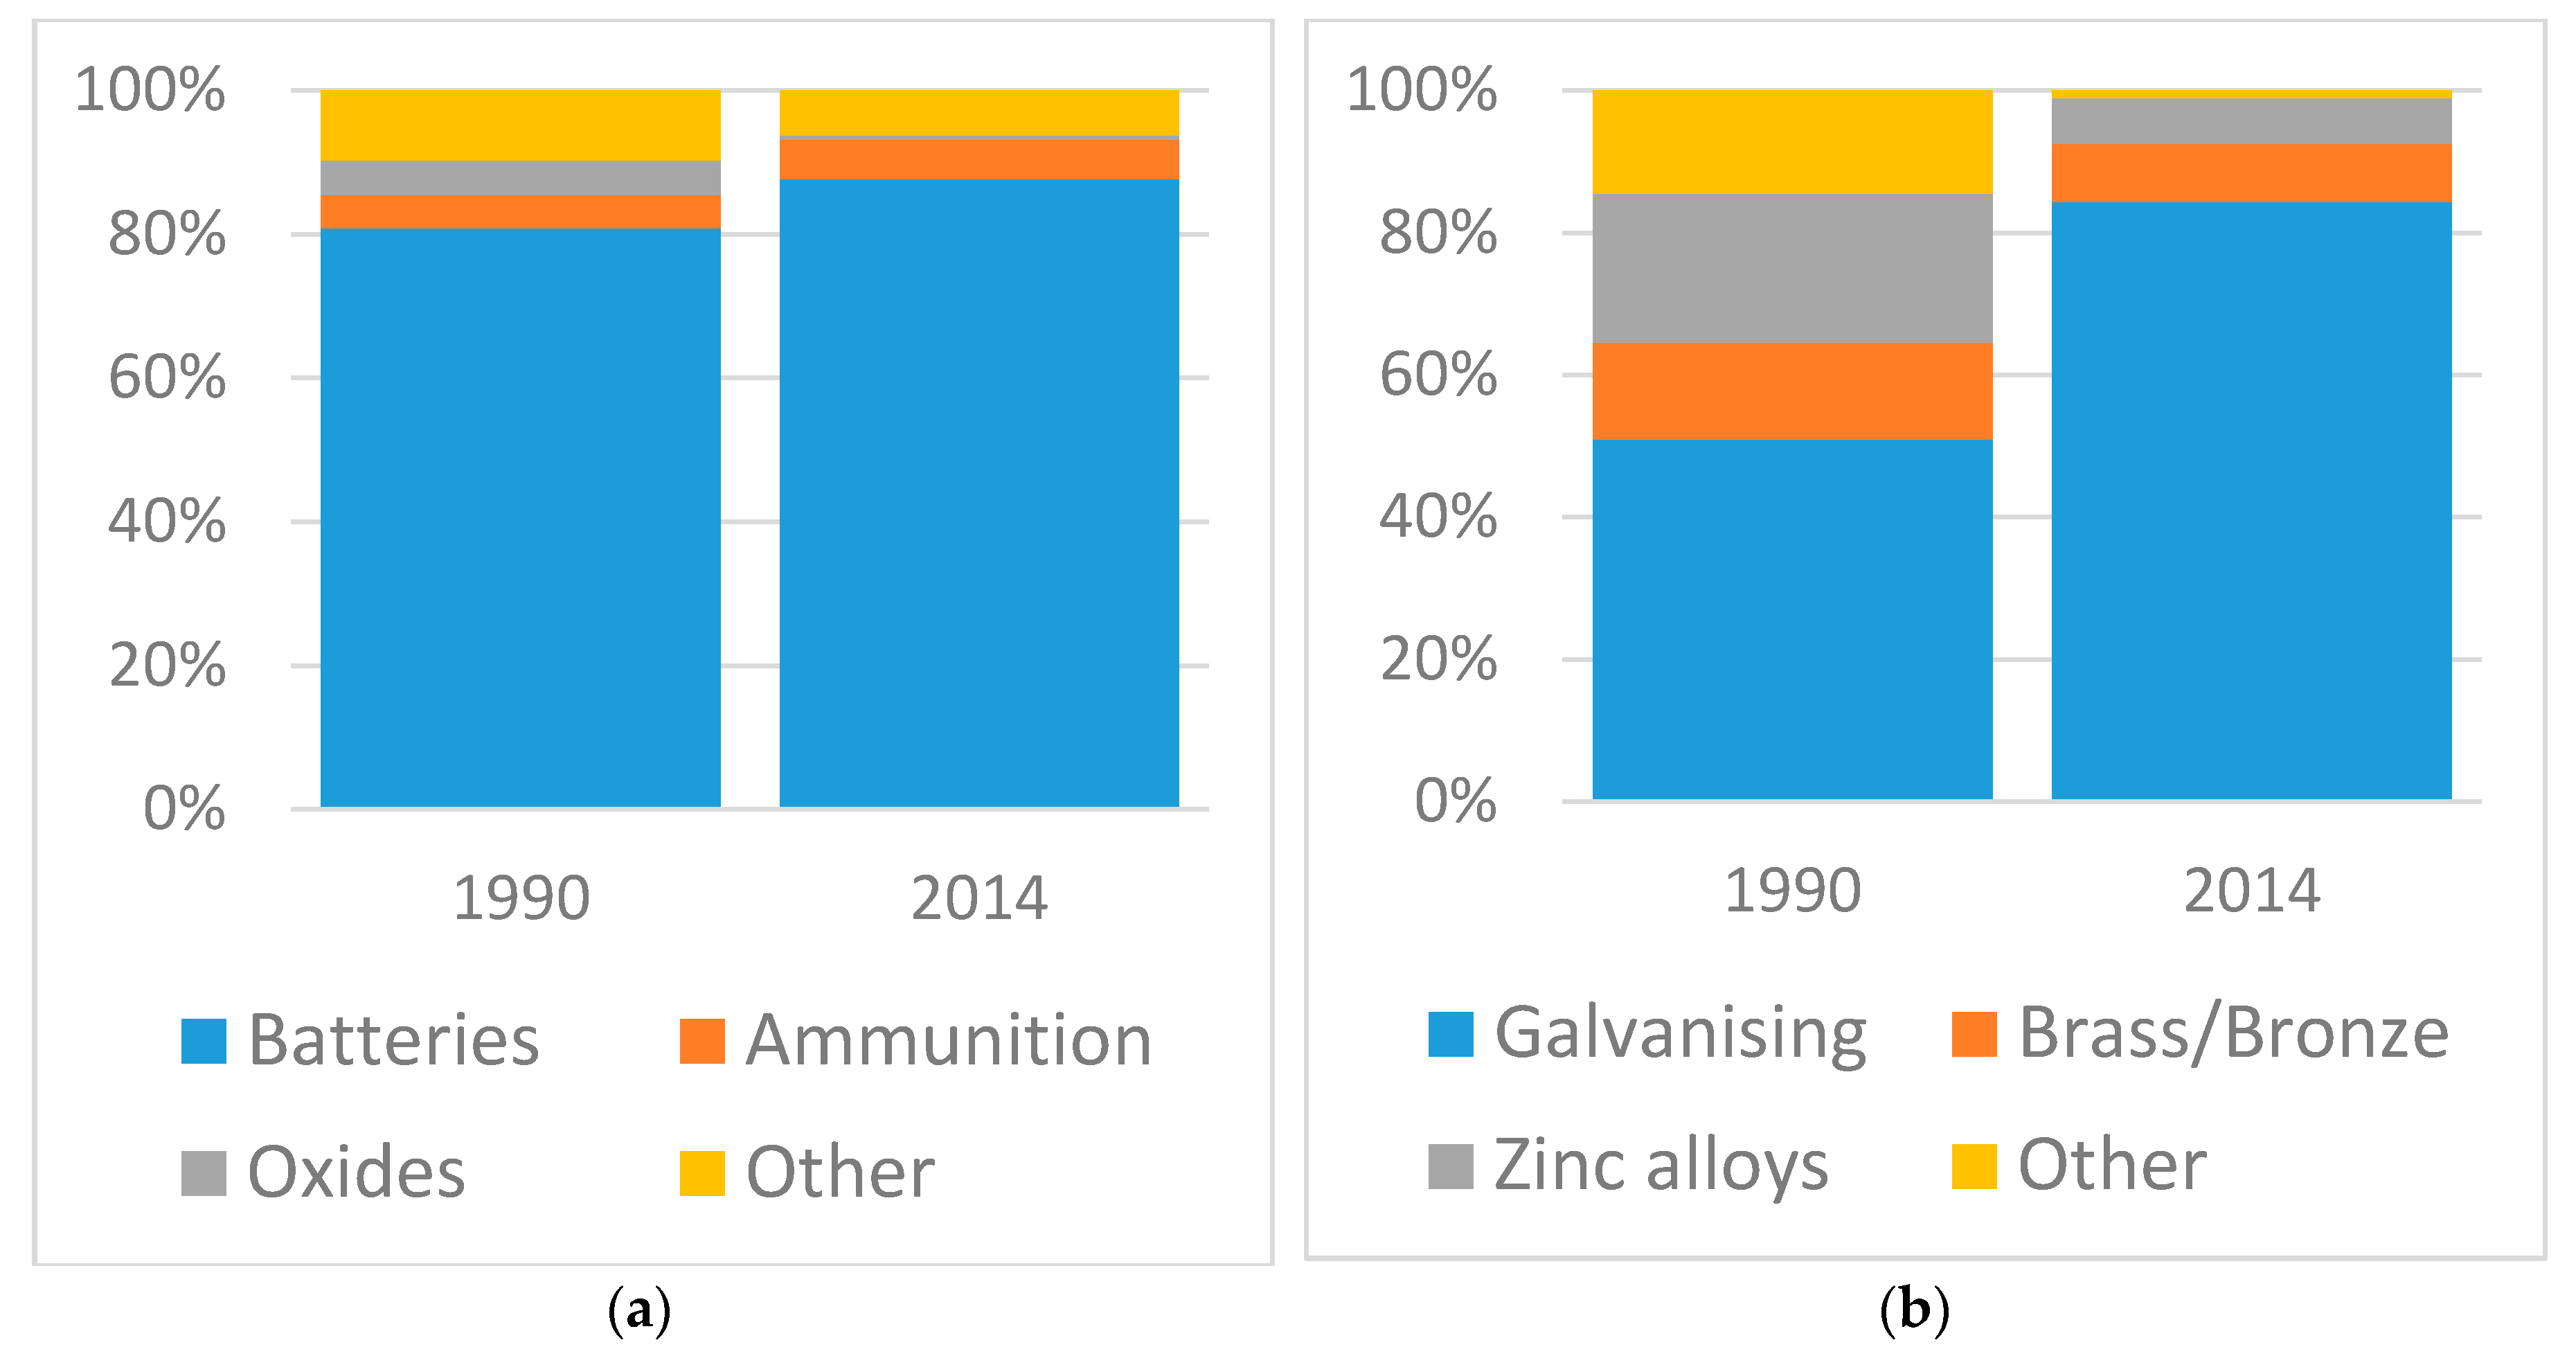
Lead and zinc both have important applications within the global economy. Zinc is predominantly used for galvanizing steel for the construction and automotive industries, as well as for the production of brass, bronze, chemicals, and zinc-based alloys [19]. Lead is primarily used for the production of lead-acid batteries with significant demand from the automotive sector [19]. Historic global demand for lead and zinc, by sector, has proven difficult to source; however, sectorial demand is known for the US, and may be considered a useful analog for global demand. The charts in Figure 1 illustrate the proportions of lead and zinc used for each sector in 1990 and 2014 in the United States.
As shown in Figure 1 the use of zinc for galvanizing steel has increased from around 50% of consumption in 1990 to over 80% in 2014. In contrast, zinc alloys have decreased from 21% to 6% of the consumption share. For lead, the manufacturing of batteries remains the largest consumption sector. Globally, over the 1990 to 2014 period, mined zinc production increased by over 90% (7.12 to 13.6 Mt Zn), whereas lead production increased by just under 70% (3.14 to 5.31 Mt Pb).
In a report on the criticality of minerals for the EU, zinc is considered to have high economic importance but a low supply risk, making it a non-critical material [20]. Aluminium can be used as a substitute for the primary uses of zinc [19]. Historically, there is no substitute for the lead used in lead-acid batteries, and this has been a factor in designating it as a critical metal [21]. Rapid uptake of other battery technologies, notably lithium ion batteries for electric vehicles, may change this. Other uses of lead metal include: ammunition, building materials, power and communication cables, solders for construction, brass and bronze, and electronic components [19].
Three projections of lead and zinc supplies have recently been conducted [22,23,24]. All three studies modelled global production only for lead and zinc on an aggregated basis, rather than a country-by-country basis. Roper [22] and Sverdrup and Ragnarsdottir [23] used multicyclic Hubbert Curve techniques, and Calvo et al. [24] applied a single Gaussian/normal distribution curve to project individual metals’ production. Despite the similar approaches, the results differ considerably.
For lead production, one of the three studies differs markedly from the rest, in its assessment of the timing and progression of the peak. Roper [22] projects a peak of 5.5–7 Mt/y before 2020, which is similar to Sverdrup and Ragnarsdottir [23], who estimate that production is currently at its peak. By contrast, Calvo et al. [24] project peak production for lead to occur in 2128 at approximately 9 Mt/y. Two reasons are apparent for the differences. First, Roper [22] and Sverdrup and Ragnarsdottir [23] both predict rapid production growth immediately prior to peak production. Roper [22] in the higher Ultimately Recoverable Resources (URR) scenario has production increasing from 5.4 Mt/y in 2014 to 7 Mt/y in a couple of years. By contrast, Calvo et al. [24] has production reaching 7 Mt/y in ~2060. Another difference is the assumptions regarding Ultimately Recoverable Resources (URR). While Sverdrup and Ragnarsdottir [23] do not state the URR used, it is believed to be similar to Roper [22] in the range of 340–430 Mt. Calvo et al. [24] use the United States Geological Survey (USGS) identified world lead resource estimate of 2000 Mt [25]. With cumulative production, this figure would equate to a URR of ~2300 Mt, which is significantly higher than in the other models. Although the USGS resources number is stated as identified, little information is publicly available to substantiate this figure. A detailed review of known deposits by Mudd et al. has identified resources of at least 226 Mt Pb [8].
The three projections by Roper [22], Sverdrup and Ragnarsdottir [23], and Calvo et al. [24] are somewhat similar for zinc. Roper [22] has production peaking between 2018 and 2023 at 14.5–17 Mt/y, which is similar to the study by Sverdrup and Ragnarsdottir [23] with a peak in 2030 at 20 Mt/y. It is worth noting that although the peak years and rates are similar, the URR estimates of Sverdrup and Ragnarsdottir [23] are substantially larger (1560 Mt) than those of Roper [22] (250–480 Mt). The projection by Calvo et al. [24] again has the furthest peak year with a peak in 2061 at ~17 Mt/y. Here, the main reason for the difference appears to be the larger URR used by Calvo et al. [24] of 1900 Mt resources (which would equate to a URR of ~2450 Mt). The 1900 Mt of resources is sourced from the USGS’s world identified resources estimate [25]. Of the projections of lead and zinc production, only Roper [22] looked at recycled lead and zinc. Roper’s [22] projection of recycling results in little change for either mineral, with the total lead supply shifting from before 2020 to around 2035, and from 2018 (low scenario) to 2023 for zinc.
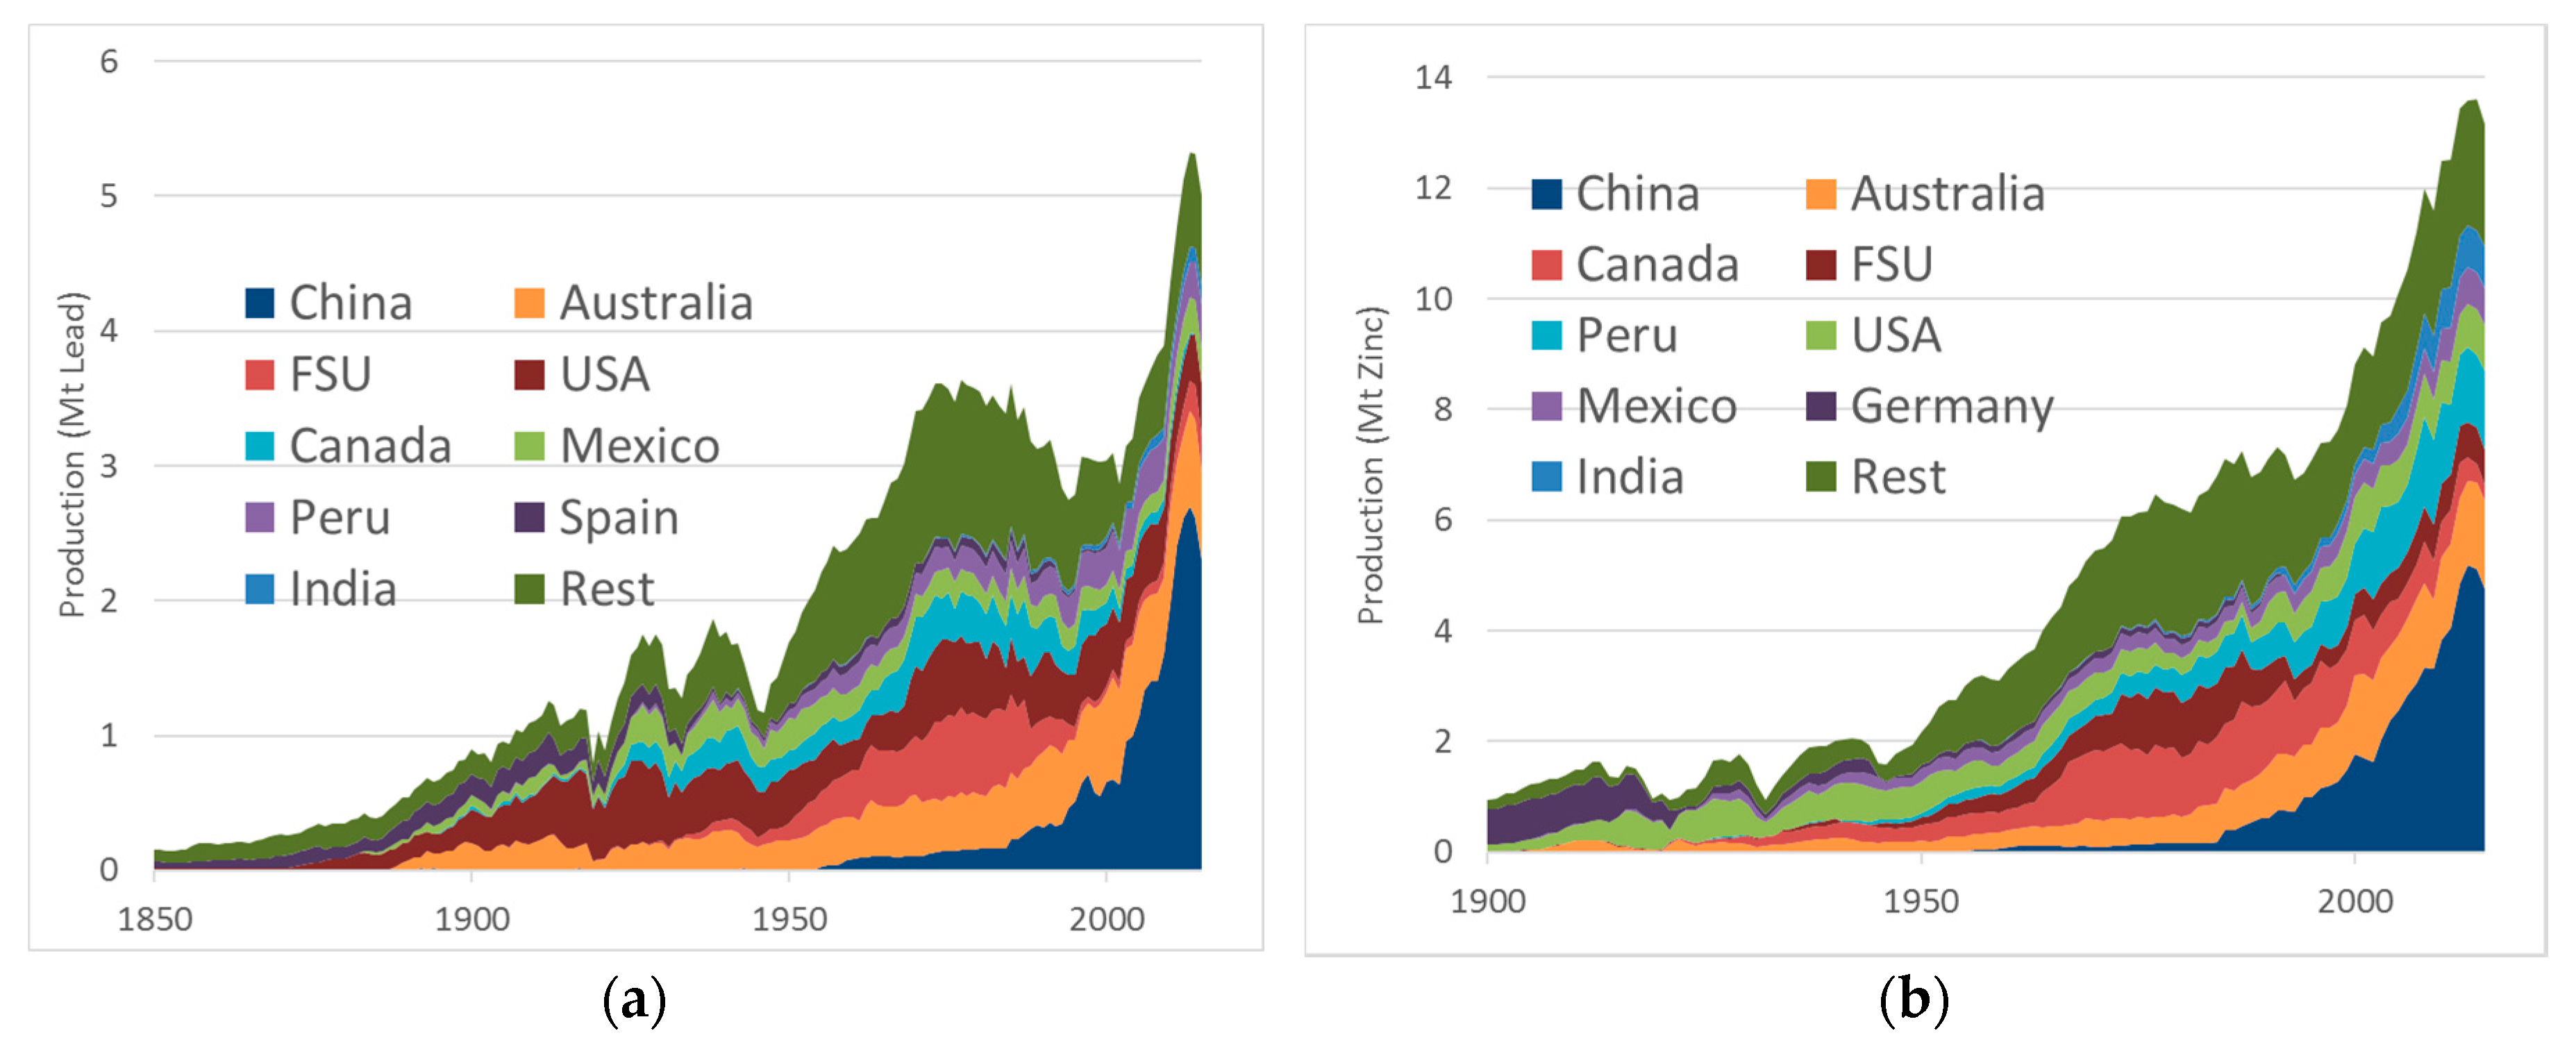
As seen in the literature, there are two main causes for uncertainty in estimating long term production, namely, the growth in production and the assumed URR. In the case of the URR for lead and zinc, recently published research from Mudd et al. [8] provides improved estimates for lead and zinc resources. As shown in Figure 2, the bulk of growth for lead and zinc since 2000 has come from Chinese production; however, in 2015, the figures for Chinese production of lead and zinc are sharply lower. As such, it is worth examining developments in China more closely in future to monitor any continuation of a decline in Chinese lead and zinc production, as this would most likely result in a decline for world production. The ability to disaggregate the data, breaking projections into specific country contributions, facilitates a more nuanced discussion on how production might be affected by different factors.
In this study, we use recent estimates of global mineral resources from Mudd et al. [8] to model the production of lead and zinc by country using the Geologic Resources Supply-Demand Model (GeRS-DeMo). GeRS-DeMo estimates production by applying a scheduling approach to determine when a new mine should commence. This approach enables us to develop a more refined projection of lead and zinc production and contributes to the literature by helping to narrow down the likely peak years for production from known primary resources. The model lends itself to being updated periodically with new estimates of known resources, for example, as new resource discoveries are made or are deemed off-limits. The model implicitly assumes a steadily increasing demand based on historical rates and on this basis, offers a plausible projection of future production based on the currently known resources. In addition, we project the potential for lead recycling in order to determine the role that recycling can play supplying future resources, including an alternate recycling projection. Zinc recycling has not been modelled in this paper as historic data to calibrate were insufficient. In Section 2, we outline the URR values used for the projections and in Section 3 we set out the details of the model used to generate the projections. In Section 4, we present and discuss the results.
2. Ultimately Recoverable Resources (URR) Estimate
As discussed earlier, the URR estimate used in modelling significantly impacts projections of future supplies. While previous studies have used URR estimates primarily from USGS data, we use the URR estimates from Mudd et al. [8] as the basis for the remaining resources of lead and zinc because they are deposit specific. This granular data enables modelling production with greater disaggregation, namely modelling individual countries rather than world production.
In addition, ore reserves data generally represent short term economic mine plans (say five to 10 years or so), while mineral resources represent longer term prospects for eventual economic extraction (see Mudd et al. [8]). It is important to emphasize that these URR estimates are believed to still underestimate future resources, as additional deposits may be found, existing deposits may be expanded with additional exploration and evaluation (e.g., Antamina, amongst many others; see Mudd et al. [8]), and there are many known deposits where resources data remains unavailable [8]. Whilst our modelling assumes that all known resources will be mined at some point in future, in practice, this may not occur, for example, socio-political or economic constraints prevent mining. The URR estimates from Mudd et al. [8] are detailed in Table 1 by country. For some countries such as Macedonia, small production figures were available but no stocks of resources were listed. For these countries, the Hubbert Linearisation technique [27] was applied to estimate the URR. The Chinese Ministry of Land and Resources estimates of resources were used for Chinese resources [28].
3. Modelling Approach
The model used to create the projections is the Geologic Resources Supply-Demand Model (GeRS-DeMo) [29,30]. The model has been described in detail in Mohr [29], and briefly elsewhere [3,30,31]. The model can be used to simulate production from either oil/gas fields or through mining. The mining model was used here to create the lead and zinc projections. The model allocates how the URR are mined over time by assuming that production from an individual mine is trapezoidal in shape (see Figure 3). Each country is modelled as one or more ‘theoretical mines’ for a producing region. Typically, only countries with very small resources are modelled with one mine.
In yearly time steps, the model determines how many new mines are added, based on the historical rate of increase in production in that country, and how many older mines exhaust their resources, and cease production. The model assumes that the maximum production capacity of the new mines increases over time. This increase is due to technology improvements such as larger trucks, and more efficient mining equipment. The method of scheduling new mines to be added to a region for a given year is determined by a rate term that is fitted to historical data. In this paper, the model operates in the static mode and the rate term is constant, with the figure determined by fitting the model to historic production for the country. In the dynamic version of the model, the rate term is influenced by demand, which is based on the population and a per capita intensity of use over time projection. Additionally, in the dynamic version, if demand is sufficiently strong, mines can be upgraded (that is the production of a certain number of individual mines can be doubled, and the remaining mine life halved). Similarly, if demand is suitably weak, the model switches existing mines off to restart again when demand is stronger. The GeRS-DeMo model also projects contributions from mineral recycling as discussed in Section 3.3. This method was first described in Mohr et al. 2012 [30]. In the remainder of this section, we provide an overview of the model, with emphasis on the recycling component of the model. The treatment of demand is noted first, then the mines model is explained, followed by recycling, all parameters adopted or developed are justified, and finally limitations of the model are described.
3.1. Demand
For this study, GeRS-DeMo was run in static mode, meaning that it focuses on the available supply from mining extraction, and does not incorporate or interact with demand data for either lead or zinc.
While the present GeRS-DeMo is not capable of modelling demand for lead, some discussion of the challenges that this would present could be instructive for discussions of future development of the model. One complexity for lead is lithium-ion electric vehicles. For example, the International Energy Agency (IEA) estimates that the high end uptake of electric vehicles could reach 25% Electric Vehicle (EV) market share by 2030 [32]. Contrasting this, Ahmed 2017 estimates that electric vehicles will represent a negligible portion of car stocks by 2025 and predicts that lead demand for batteries will increase from 10 Mt/y in 2014 to 14 Mt/y in 2025 [33]. A historical complexity was leaded fuel. Historically, lead production declined between 1970 and the mid 1990’s (see Figure 2), indicating that the demand for lead was subdued. This reduction was likely partially due to the phased removal of leaded petrol. For example, in 1965, lead as a fuel additive accounted for 18% of lead consumption in the US [19]. For the purposes of this study, the limitations of the present model have been acknowledged, and existing demand is assumed to be steadily increasing into the future at the recent historical rates.
3.2. Mines Component
The first component of the model projects mineral production from mines. These projections are developed by modelling idealized production for a mining region and summing these results. An idealised mine has a four year ramp up and ramp down period, with a steady production rate in between, as shown in Figure 3.
The life of an individual mine and its production rate is determined by the year the mine is brought on-line, as described in Equations (1) and (2).
Mp(t) = (MH + ML)/2 + ((MH − ML)/2)tanh(rt(t − tt))
In Equations (1) and (2), rt and tt are the rate and time constants, respectively; ML, MH are the minimum and maximum mine production rates, respectively; and LL, LH are the minimum and maximum mine lives, respectively. The rate constants rt and tt were set to 0.037 and 1960 for all projections, respectively. The values for LM, LH, MM, and MH for all scenarios are provided in the electronic supplement and were determined by fitting the model to historic data. This leaves one remaining variable, which is the number of mines brought on-line in year t. To calculate this, we firstly need to determine the exploitable URR.
The exploitable URR is the cumulative production from all mines plus the remaining resources in all mines that are currently on-line. The estimated exploitable URR QE(t), is determined by Equation (3):
where QT1 is the URR of the first mine brought on-line in the region and rT is a rate constant. The number of mines brought on-line is found by increasing the number of mines online until the actual exploitable URR is larger than the estimated exploitable URR QE(t).
QE(t) = [(QT − QT1exp(− rT))/(1 − exp(− rT))] − [(QT − QT1)/(1 − exp(− rT))]exp(− rTQ(t)/QT)
The method means that neither the URR for a mine, nor the number of mines are inputted, rather the model calculates these values. For example, if a country has 100 Mt of URR and at time 1 the mine life is 40 years and mine production is 1 Mt/y, then the mine would consume 40 Mt of the 100 Mt URR. If at a later date, the mine life is then 50 years and mine production is 2 Mt/y, the new mine would consume 100 Mt; however, there is only 60 Mt left, so the model truncates the life from 50 years to 30 years. As a result, the number of mines and the URR of specific idealised mines are only known when the last mine has been placed online.
3.3. Recycling Component
The contributions from recycling activity in the GeRS-DeMo model are determined as follows. The recycling rate is assumed to increase over time in an S shaped curve described by:
where Rr(t) is the recycling rate in year t, RL is the initial recycling rate, RH is the ultimate recycling rate, rR is the rate constant that controls the speed at which the recycle rate increases, and tR is the time constant and is the year recycling half way between RL and RH. The amount of metal recycled in year t, R(t), is calculated as:
where Lu is the average useable lifespan of the metal products, and S(i) is the supply of the metal in year i. Note the Supply of the metal in year t, S(t), is determined by:
where P(t) is the production of the metal from the mines.
Rr(t) = [(RH − RL)/2] + [(RH − RL)/2]tanh(rR(t − tR))
R(t) = Rr(t)S(t − Lu)
S(t) = P(t) + R(t)
In the next section, we explain the sources for the recycling model inputs.
3.4. Determining Model Parameters
The mining parameters for each country’s production are determined by taking the calculated URR and known historical production and fitting the model iteratively to the data until a suitable fit has been found. The mining parameters are listed in full in the electronic supplement.
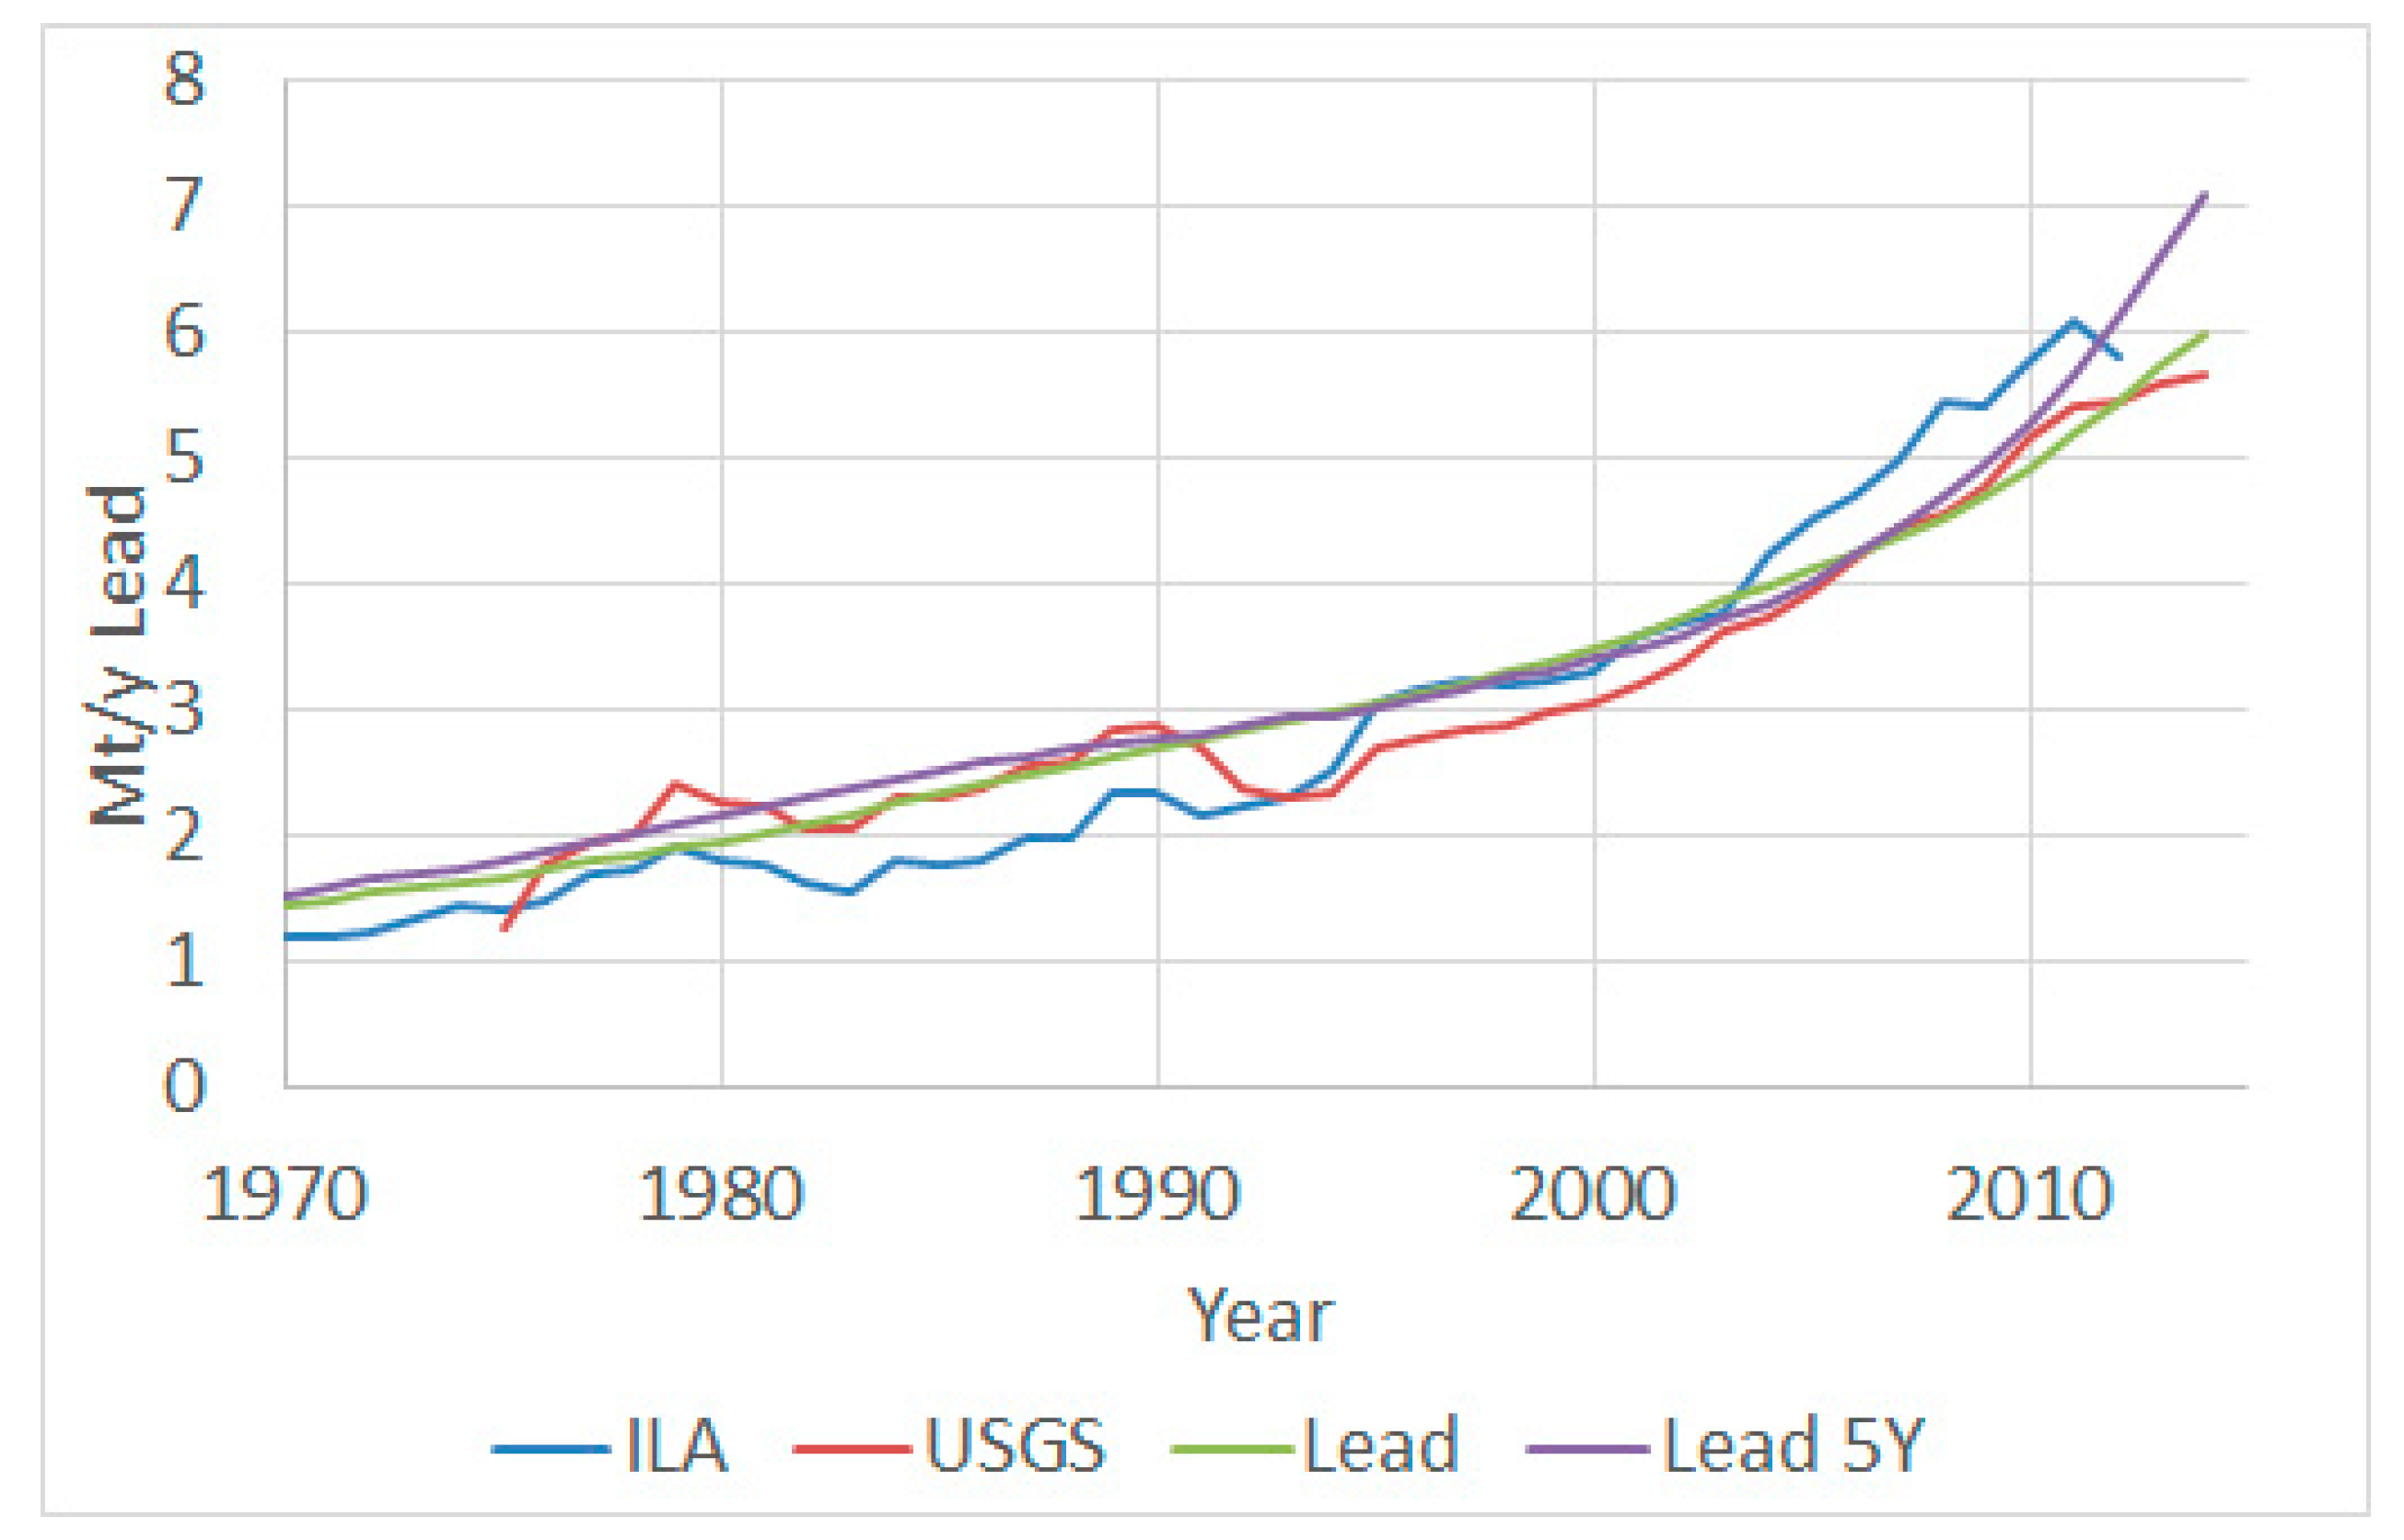
To calculate the parameters for recycling, we need to determine the historical quantities of recycling. Data for recycled lead can be readily obtained from USGS [19] and International Lead Association (ILA) [34], and while the two datasets are different, there are similarities in the order of magnitude and their broadly exponentially growing recycling rates (see Figure 4).
The lifespan Lu for lead is assumed to be 10 years, based on an approximate lifespan of a car [30]. In order to estimate future recycling in addition to lifespan, Lu, we need to determine RL, RH, rR, and tR as per Equations (4)–(6). RL, tR, and rR can be estimated by fitting Equation (5) to historical production data; however, the ultimate recycling rates RH needs to be known first. For lead recycling, the maximum end of life recycling rate presented in Graedel et al. [35] is 95%, and Roper [22] assumed a maximum recycling rate of 90%. We have assumed the maximum recycling rate found in the literature, namely 95%. In order to examine the sensitivity of lead recycling, an alternate lead recycling model with a lead lifespan of five years is presented, labelled as ‘Lead 5Y’, in addition to the standard recycling assumption, denoted simply as ‘Lead’.
3.5. Modelling Limitations
The current model has a number of limitations. First, the current demand component in the model is not sophisticated enough to account for complex situations such as the phasing out of leaded fuel; or technology disruptions [36] such as lithium ion replacing lead batteries. The implications are that if demand for lead was drastically reduced (as happened when lead was phased out from petrol), known resources of lead would last for longer than projected.
Secondly, price modelling is absent from the current model, and further development would, ideally, project supply, demand, and price in an interlinked fashion. It should also be noted that building an economic model of mine supply is inherently difficult and subject to considerable uncertainty and complexity—which is why there is no such reliable model in the academic literature.
Another limitation is the conventional assumption of production from a mine remaining relatively flat. It is possible that ore grade declines, where initially higher metal concentrations are mined first, result in the actual production of metal from the mine decreasing overtime, even though raw ore production remains relatively constant.
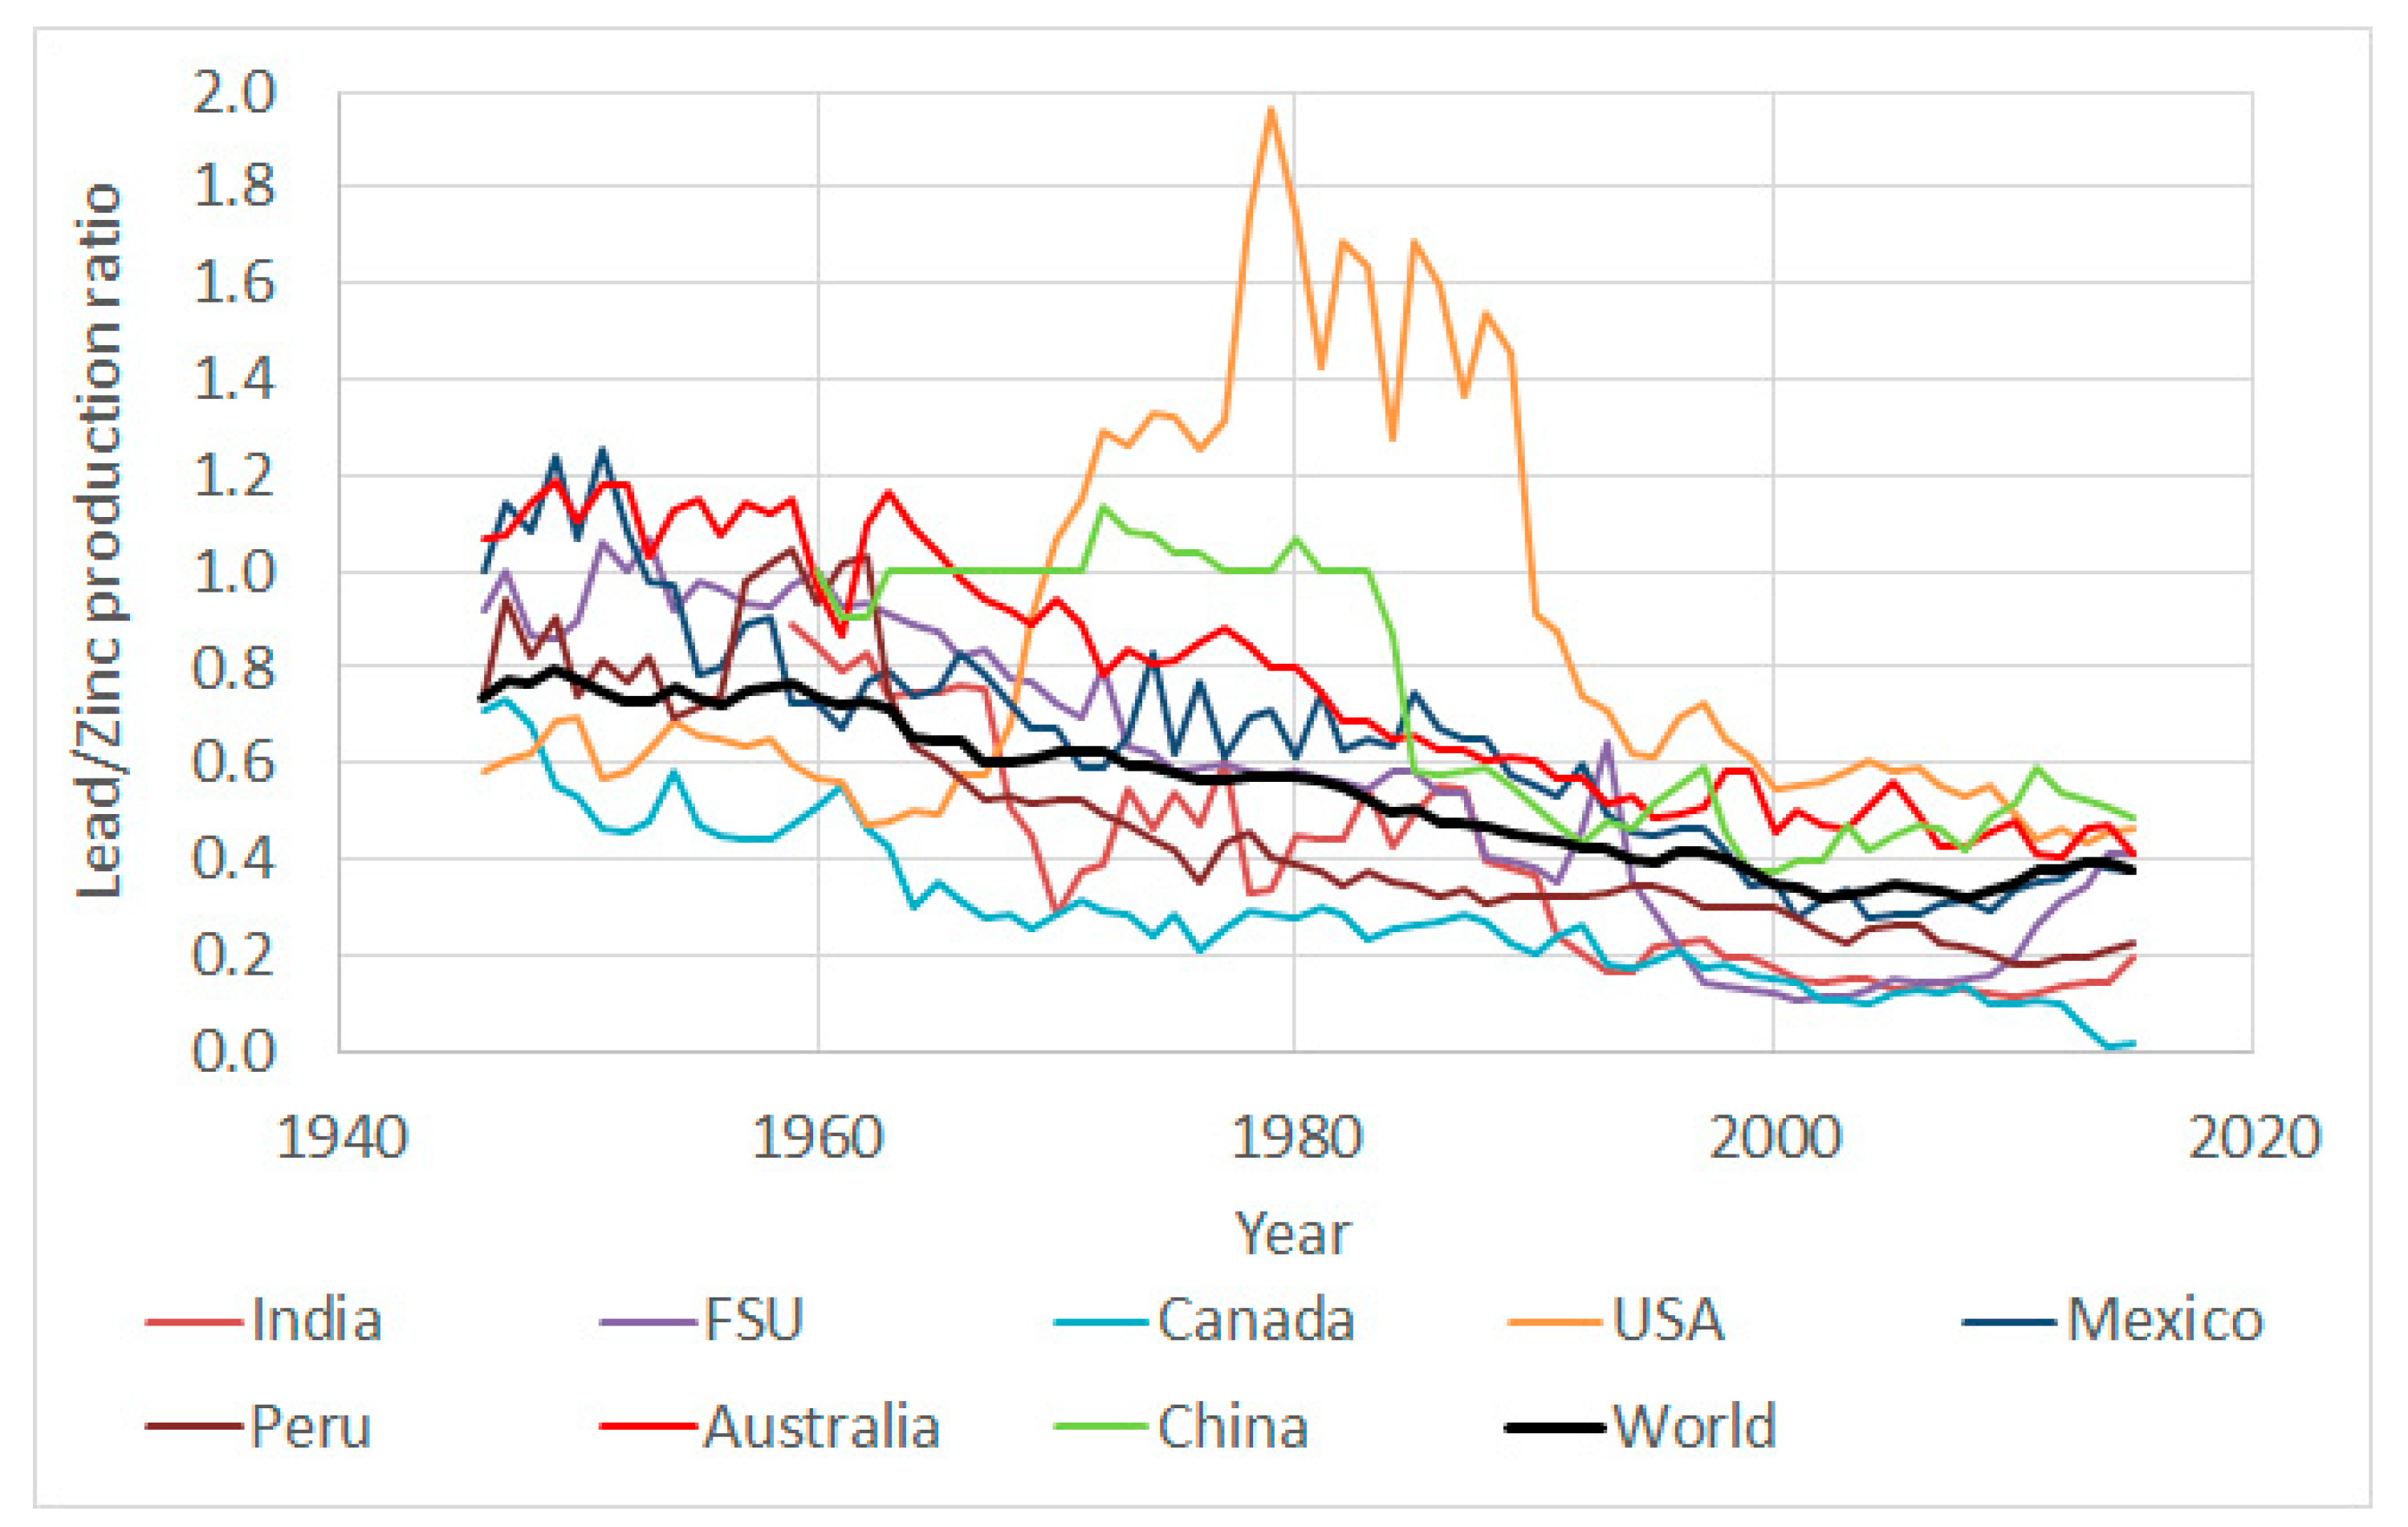
A further shortcoming of the model is the present inability to deal with minerals, such as lead and zinc, that are frequently co-produced at the mines. This study has therefore treated the extraction of lead and zinc as independent operations. It is noted that not all deposits have both lead and zinc; of the deposits listed in Mudd et al. [8], 638 have both lead and zinc, 188 have only zinc, and 25 have lead only. The zinc to lead production ratio has tended downward over time (Figure 5), although in recent years, the ratio for the world has increased primarily due to FSU, India, and Peru. In particular, the world lead to zinc ratio has declined from an average of 77% in 1946–1949 down to an average of 33% in 2000–2009 decade, and in the last six years (2010 to 2015), increased to 38%. It is difficult to estimate from the historical data what the future lead to zinc ratio will be. Without addressing this in an economic manner, it is impossible to discern or differentiate a deposit’s ability to produce both lead and zinc, as in reality, the choice to extract particular metals by a mining company will always come to relative economics of extraction technology and input costs versus market prices and demand levels.
4. Results and Discussion
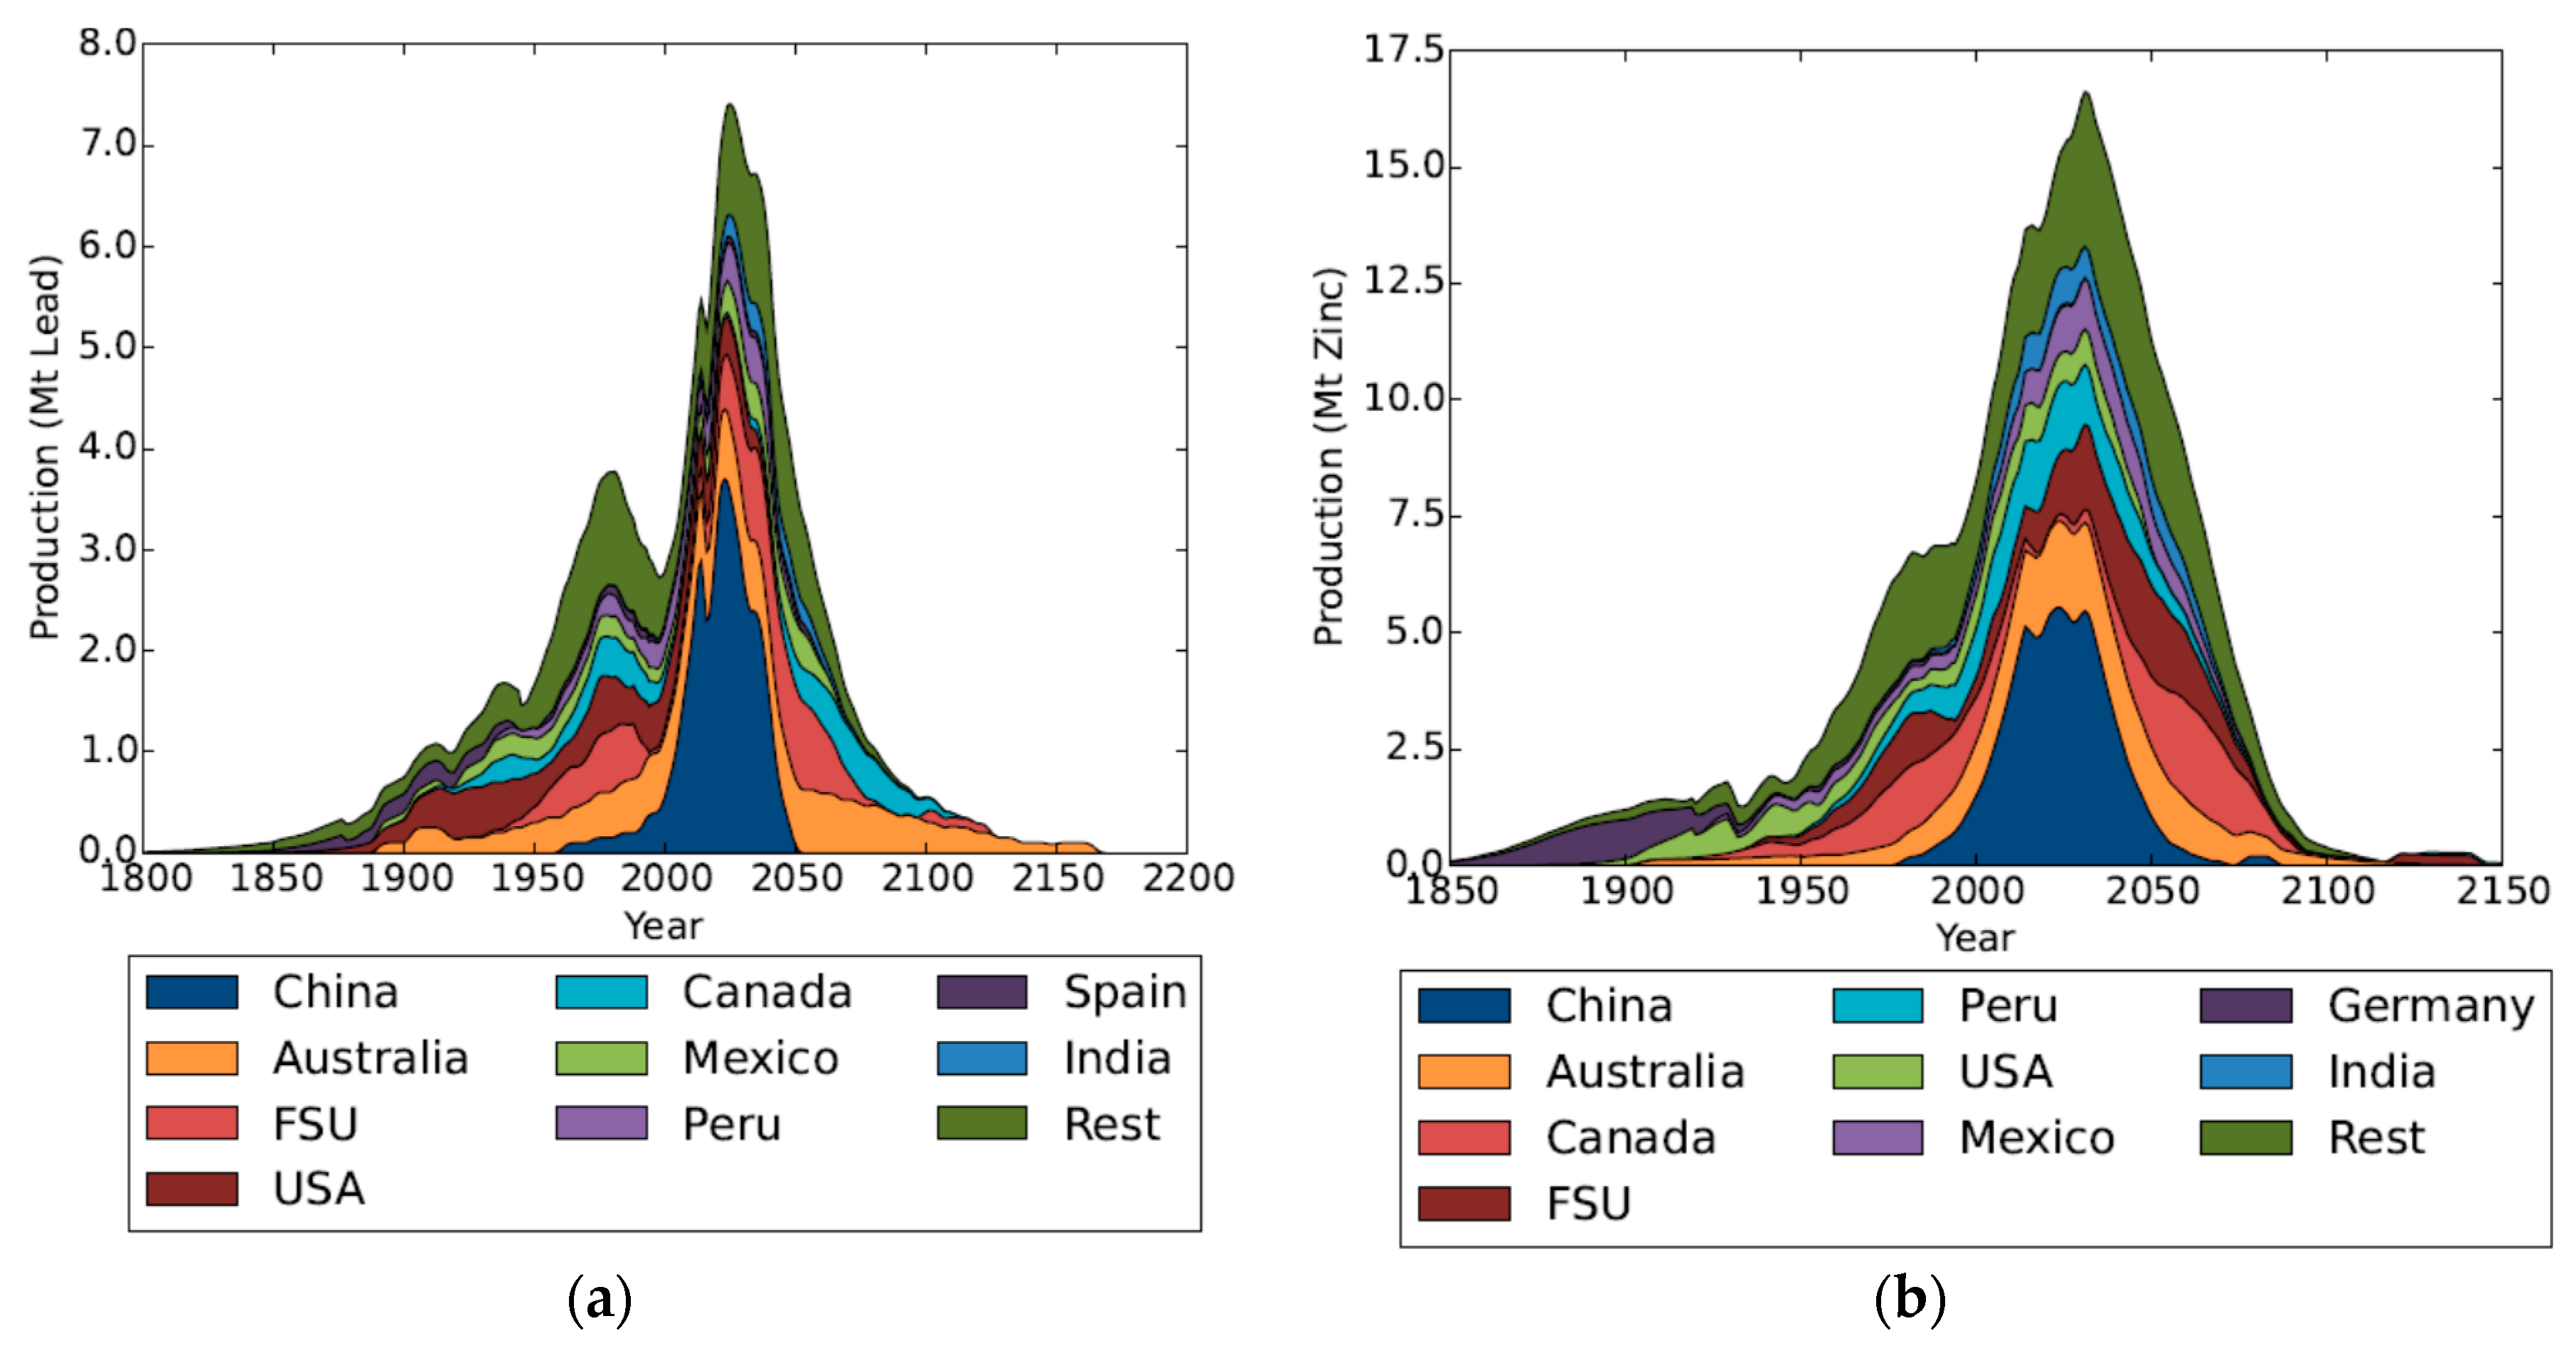
The projections of mine production of lead and zinc are shown in Figure 6, and a summary of the estimated peak years are presented in Table 2. Unless additional resources are found soon, it is projected that if current trends continue, lead and zinc production from mines will peak within 15 years (lead 2025, zinc 2031). As additional resources are found [8], the peak year will likely move further into the future. It shows that based on known resources, China will not make a significant contribution to primary lead and zinc mining beyond 2050, whilst Australia and the former Soviet Union will, plus Canada in the case of zinc.
These production results are more optimistic than those of Roper [22], considerably lower than Calvo et al. [24], and broadly similar to Sverdrup and Ragnarsdottir [23]. We compare our results with those in the literature in Table 3. At present, the remaining gaps in this modelling work are the future ore grades over time, as well as exploring the implications for the economics of lead and zinc mining, especially the interactions between ore grades, market prices, and demand—which are clearly complex and beyond the present capabilities of GeRS-DeMo.
A key follow-up question is: how much does recycling provide now, and what can it provide in the future for lead? The impact recycling is estimated to have is shown in Figure 7 in the base and alternative scenario. For lead, the addition of recycling pushes the peak date and rate substantially into the future, with a total supply peak projected after 2060 at 29.6 Mt/y, and with additional resources likely, this peak will probably shift further. Recycling lead also ensures a slow decline post peak with supply still at 22 Mt/y in 2150, a decline of just over 25%. For the alternative scenario, Lead 5Y, the total supply still peaks after 2060 but now at a production level of 41.1 Mt/y.
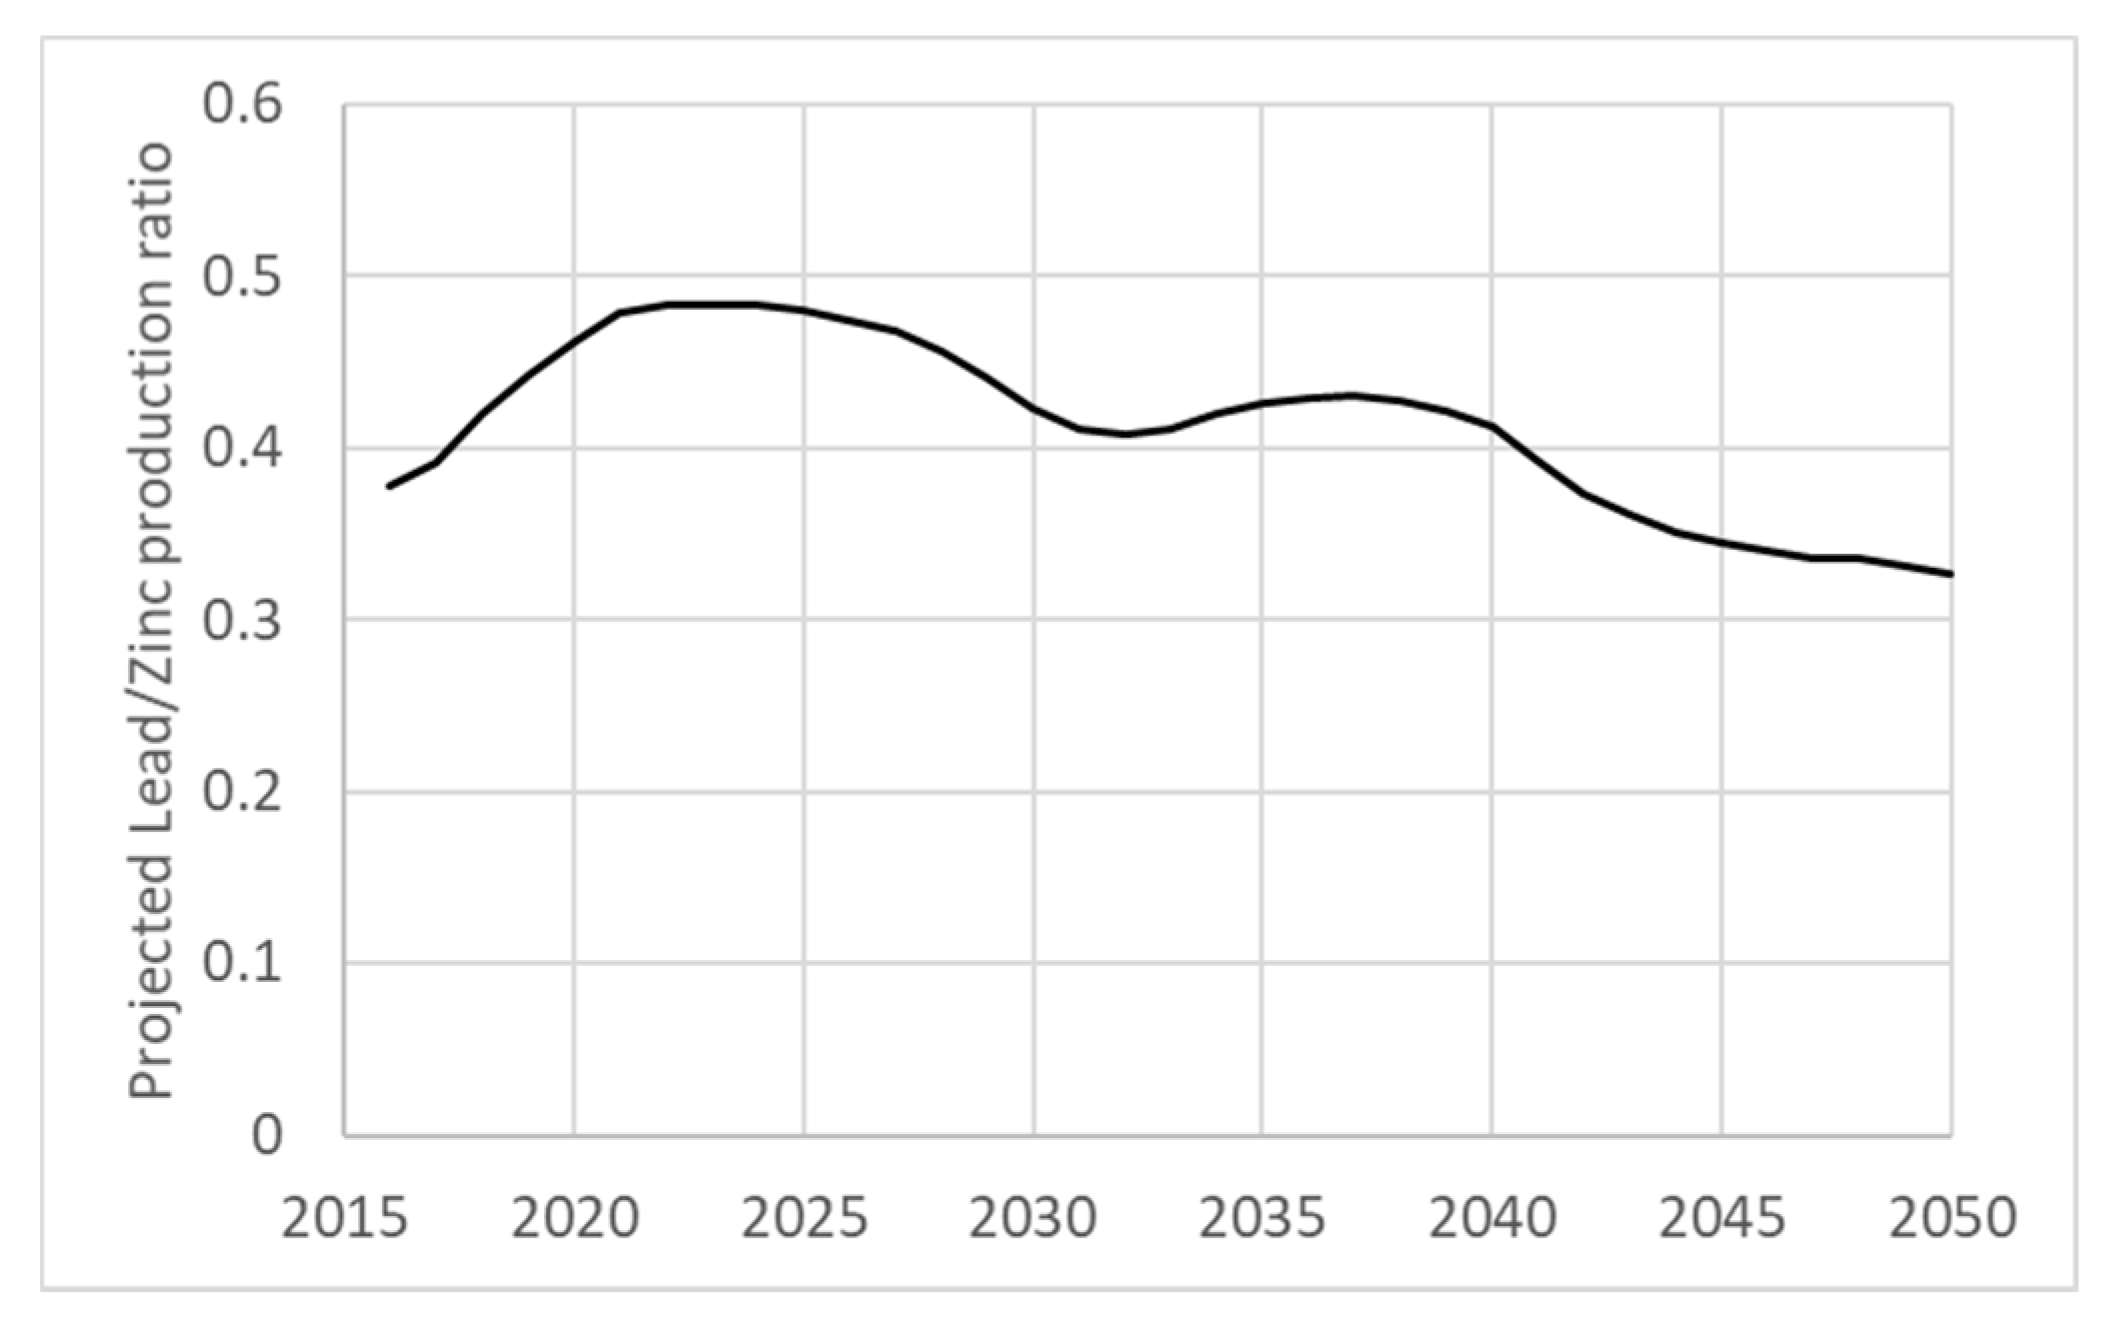
Figure 8 shows the projected lead to zinc production ratio, with the ratio projected to continue its historic increase into the future until 2022, at which point it will start an undulating decline to 33%, which is where the ratio was on average in the decade 2000–2009.
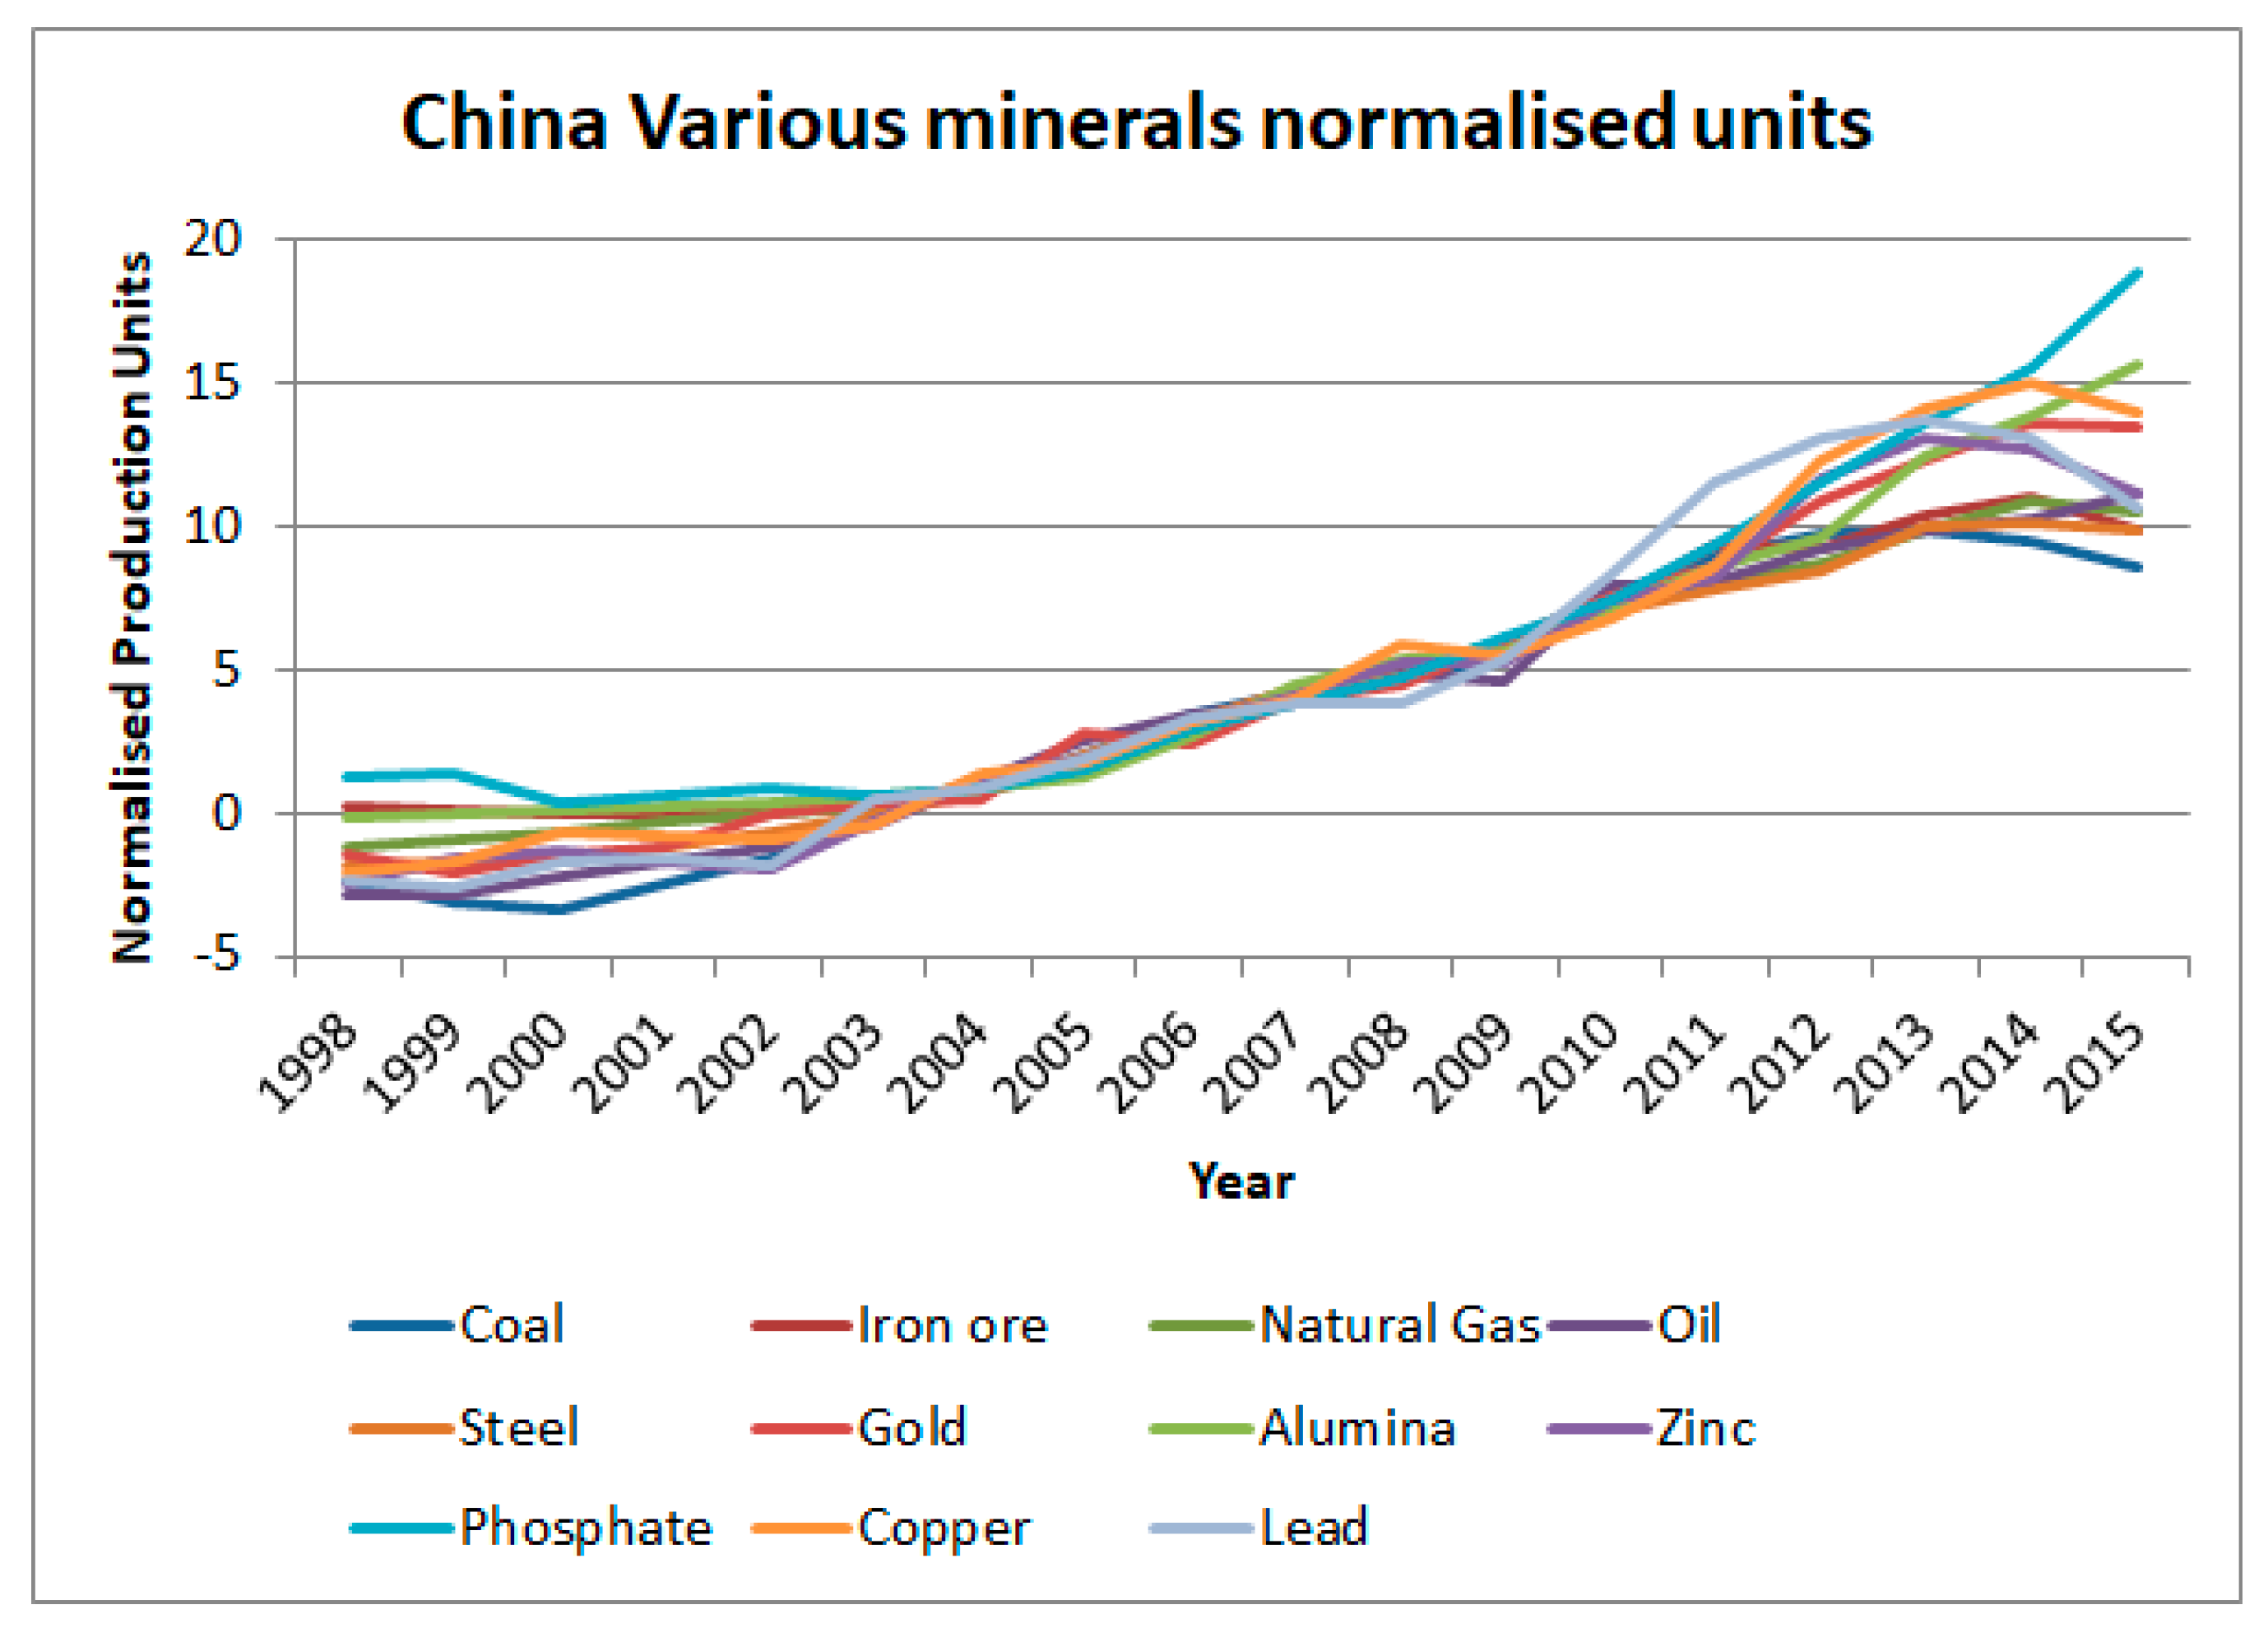
One of the key uncertainties of the global production forecast for lead and zinc relates to Chinese production. China produced 46% of the world’s lead and 36% of the world’s zinc in 2015 (see Figure 2a,b). Figures 2a and b also highlight a recent downturn in Chinese production of lead and zinc compared to their 2013 levels, with lead down by 15% and zinc 8%. This signals uncertainty in the future production of lead and zinc, as this downturn might be the beginning of a downward trend or simply be a blip in production. However, this downturn in China is not limited to lead and zinc. As shown in Figure 9, the production for a range of minerals has recently declined after peaks in 2013 or 2014, with only phosphate, oil, and aluminum defying the downward trend. One reason for the decrease in lead and zinc production is the Chinese government’s forced shutdown of 26 mines in the Hunan province [37]. In our modelling, we have assumed that the downturn in China is a temporary aberration, (implemented in the model as a disruption to production); however, it is unclear if this recent downward is primarily economic in nature (e.g., depressed global market prices), or based on improved environmental regulation and the need to address pollution risks from mining (especially water), or even geological in nature such as declining ore grades or more refractory ores which are limiting mine production.
Two recent studies continue a debate that marks a fundamental difference in approaches to understanding resource availability. The first by Meinert et al. [38] proposes that there is little constraint to future resource availability and that modelling peak mineral production from known resources is unhelpful. It expresses a curious relationship to uncertainty, expressing both great faith in as yet unidentified innovation to make economic yet-to-be-discovered resources and to overcome social and environmental constraints which may hinder resource access, but no confidence in using existing information on known resources to undertake projections of use and further analysis that might inform the development of such innovation.
The second, by Northey et al. [39], identifies that known resources have continued to grow over time. They acknowledge the uncertainty in determining ultimately recoverable resources, and the difficulties associated with quantifying less tangible environmental and social factors which can constrain future resource development, but draw attention to a large and growing body of methods and data that can help in defining areas that are responsive to different types of innovation or investment.
Attempting to estimate the ultimately recoverable resources for any resource is inherently difficult, as such an estimate is intrinsically tied to assumptions around geology, technology of extraction, market prices, mining costs, acceptable environmental, economic and social impacts, and so on—all of which influence each other (sometimes significantly; e.g., technology, geology, and mining costs). Given that meeting sustainable development goals will require an adequate supply of resources from both primary and secondary sources [40], the country-by-country projections as shown in this paper provide a valuable-publicly available dataset-to understand primary supply from known resources at this point in time. Whilst more resources will be discovered, social economic and environmental constraints may also constrain the development of known resources, a point that is somewhat backgrounded by Meinert et al. [38]. As an illustrative example, consider the case of coal. The social and environmental costs of mining and burning coal are delaying new coal resource developments. This creates an arena where the development of alternative energy technologies can flourish by lowering social, environmental, and economic costs. It led to the 2015 coal demand in China being lower than the year before [41]. Whilst cleaner energy technologies could be portrayed as independent technological developments affecting demand, considering the supply-demand interaction provides a more nuanced view. Peak minerals researchers are sometimes portrayed as saying ‘the world’s running out of minerals’ when our argument is that we’re running out of ‘easily accessible, low cost and low impact’ mineral resources and are being left with those that are more costly, expensive, and higher impact to access. Peak coal has not occurred because the world has run out of coal, but because the world no longer has an increasingly available supply of easily accessible low cost and low impact resources. Importantly, it is interesting to observe the huge change in the global energy system which this lack of easily accessible low cost, low impact resources has given rise to, even before global production passed its peak. For this reason, as a global community, we must be cognisant of the implications of nearing peak supply, also for other resources, including for pressures on substitution and supply security.
5. Conclusions
We have developed a comprehensive set of country-by-country and global projections of lead and zinc supply including recycling for lead. The objectives were to identify the likely peak production years for both minerals and to model the impact of recycling projections on mineral availability. We applied an established [29] modelling approach to build global projections based on country-by-country production data. Our modelling suggests that lead and zinc production from known resources is set to peak within 15 years (lead 2025, zinc 2031). When looking at total supply (production + recycling), we project that recycling for lead will shift the peak to beyond 2060. The results also highlight the need to develop a more sophisticated approach to understanding, quantifying, and modelling the links between the economic, social, and environmental aspects of lead and zinc mining and their use.
Supplementary Materials
The following are available online at https://www.mdpi.com/2079-9276/7/1/17/s1, Lead Projection: Lead_Input_File.xlsm, Lead_Output_File.xlsx, Lead_Automated_Report.pdf, Lead Sensitivity Scenario Projection: Lead_5Y_Input_File.xlsm, Lead_5Y_Output_File.xlsx, Lead_5Y_Automated_Report.pdf Zinc Projection: Zinc_Input_File.xlsm, Zinc_Output_File.xlsx, Zinc_Automated_Report.pdf, Historic Lead and Zinc Production: HistoricProdction.xlsx, Normalised Chinese Mineral production: ChinaMinerals.xlsx, The projections are available in PowerBI here: https://app.powerbi.com/view?r=eyJrIjoiMmEwYWJmNDQtOGYxZS00NDIyLTkyZWEtMzAzZTk2NTc4YWUxIiwidCI6ImU4OTExYzI2LWNmOWYtNGE5Yy04NzhlLTUyNzgwN2JlODc5MSIsImMiOjEwfQ%3D%3D.
Acknowledgments
This research was partially funded by the International Union of Geological Sciences (IUGS) through a grant from its ‘Resourcing Future Generations’ initiative.
Author Contributions
Steve Mohr created the projections; Damien Giurco, Monique Retamal, Steve Mohr, Leah Mason, and Gavin Mudd co-wrote the paper.
Conflicts of Interest
The authors declare no conflict of interest.
References
- Hansen, M.C.; Stehman, S.V.; Potapov, P.V. Quantification of global gross forest cover loss. Proc. Natl. Acad. Sci. USA 2010, 107, 8650–8655. [Google Scholar] [CrossRef] [PubMed]
- Mullon, C.; Freon, P.; Cury, P. The Dynamics of collapse in world fisheries. Fish Fish. 2005, 6, 111–120. [Google Scholar] [CrossRef]
- Mohr, S.H.; Wang, J.; Ellem, G.; Ward, J.; Giurco, D. Projection of world fossil fuels by country. Fuel 2015, 141, 120–135. [Google Scholar] [CrossRef]
- Mohr, S.H.; Evans, G. Projections of Future Phosphorus Production. PHILICA.COM 2013, 380. Available online: http://www.resilience.org/wp-content/uploads/articles/General/2013/09_Sep/peak-phosphorus/Phosphorus%20Projections.pdf (accessed on 25 February 2018).
- Giurco, D.; Prior, T.D.; Mudd, G.; Mason, L.; Behrisch, J.C. Peak Minerals in Australia: A Review of Changing Impacts and Benefits; Institute for Sustainable Futures, UTS and Department of Civil Engineering, Monash University: Clayton, Australia, 2010. [Google Scholar]
- Mudd, G. The Environmental sustainability of mining in Australia: Key mega-trends and looming constraints. Resour. Policy 2010, 35, 98–115. [Google Scholar] [CrossRef]
- Hill, L. Gold miners not finding new deposits to meet future needs—Study. Mining Weekly. 16 June 2009. Available online: http://www.miningweekly.com/article/gold-industry-not-finding-new-deposits-to-meet-future-needs---study-2009-06-16 (accessed on 26 February 2018).
- Mudd, G.; Jowitt, S.M.; Werner, T.T. The world’s lead-zinc mineral resources: Scarcity, data, issues and opportunities. Ore Geol. Rev. 2017, 80, 1160–1190. [Google Scholar] [CrossRef]
- Giurco, D.; Evans, G.; Cooper, C.; Mason, L.; Franks, D. Mineral Futures Discussion Paper: Sustainability Issues, Challenges and Opportunities; Institute for Sustainable Futures, UTS and Centre for Social Responsibility in Mining (Uni of Qld): St Lucia, Australia, 2009. [Google Scholar]
- Gordon, R.B.; Bertram, M.; Graedel, T.E. Metal stocks and sustainability. Proc. Natl. Acad. Sci. USA 2006, 103, 1209–1214. [Google Scholar] [CrossRef] [PubMed]
- Tilton, J.E.; Lagos, G. Assessing the long-run availability of copper. Resour. Policy 2007, 32, 19–23. [Google Scholar] [CrossRef]
- Roberts, P.A.; Zhang, H.G.; Prommer, H.; Johnston, C.D.; Jeffrey, M.I.; Benvie, B.; Jeffrey, R.G.; Gipps, I.D.; Anand, R.R. In place leaching of oxidized gold deposits. A new method for recovering stranded gold resources? In Proceedings of the World Gold 2009 Conference, Johannesburg, South Africa, 26–30 October 2009; pp. 43–50. [Google Scholar]
- Johnson, D.B. Biomining—Biotechnologies for extracting and recovering metals from ores and waste materials. Curr. Opin. Biotechnol. 2014, 30, 24–31. [Google Scholar] [CrossRef] [PubMed]
- Huisman, J.L.; Schouten, G.; Schultz, C. Biologically produced sulphide for purification of process streams, effluent treatment and recovery of metals in the metal and mining industry. Hydrometallurgy 2006, 83, 106–113. [Google Scholar] [CrossRef]
- Gerst, M.D.; Graedel, T.E. In-Use Stocks of Metals: Status and Implications. Environ. Sci. Technol. 2008, 42, 7038–7045. [Google Scholar] [CrossRef] [PubMed]
- Kapur, A.; Graedel, T.E. Copper mines above and below the ground. Environ. Sci. Technol. 2006, 40, 3135–3141. [Google Scholar] [CrossRef] [PubMed]
- Elshkaki, A.; Van der Voet, E.; Van Holderbeke, M.; Timmermans, V. THe environmental and economic consequences of the developments of lead stocks in the Dutch economics system. Resour. Conserv. Recycl. 2004, 42, 133–154. [Google Scholar] [CrossRef]
- Cui, J.; Zhang, L. Metallurgical recovery of metals from electronic waste: A review. J. Hazard. Mater. 2008, 158, 228–256. [Google Scholar] [CrossRef] [PubMed]
- USGS. Minerals Yearbook; United States Geological Survey: Reston, VA, USA, 1965–, 1965–2014.
- Chapman, A.; Arendorf, J.; Castella, T.; Thompson, P.; Willis, P.; Espinoza, L.T.; Klug, S.; Wichmann, E. Study on Critical Raw Materials at EU Level—Final Report; Fraunhofer ISI: Oakdene Hollins, VA, USA, 2013. [Google Scholar]
- Harper, E.M.; Kavlak, G.; Burmeister, L.; Eckelman, M.J.; Erbis, S.; Espinoza, V.S.; Nuss, P.; Graedel, T.E. Criticality of the Geological Zinc, Tin, and Lead Family. J. Ind. Ecol. 2015, 19, 628–644. [Google Scholar] [CrossRef]
- Roper, L.D. Minerals Depletion. Available online: http://www.roperld.com/science/minerals/minerals.htm, 2016 (accessed on 26 February 2018).
- Sverdrup, H.; Ragnarsdottir, K.V. Natural Resources in a Planetary Perspective. Geochem. Perspect. 2014, 3, 129–341. [Google Scholar] [CrossRef]
- Calvo, G.; Valero, A.; Valero, A. Assessing maximum production peak and resource availability of non-fuel mineral resources: Analyzing the influence of extractable global resources. Resour. Conserv. Recycl. 2017, 125, 208–217. [Google Scholar] [CrossRef]
- USGS. Mineral Commodity Summaries; USGS: Reston, VA, USA, 2016. [Google Scholar]
- BGS. World Mineral Production; British Geological Survey, Minerals UK: Nottingham, UK, 2000–2017. [Google Scholar]
- Deffeyes, K.S. World’s oil production peak reckoned in near future. Oil Gas J. 2002, 100, 46–48. [Google Scholar]
- Wang, M. China Mineral Resource 2015; Ministry of Land and Resources, People’s Republic of China: Beijng, China, 2015.
- Mohr, S.H. Projection of World Fossil Fuel Production with Supply and Demand Interactions. Ph.D. Thesis, University of Newcastle, Callaghan, Australia, 2010. [Google Scholar]
- Mohr, S.H.; Mudd, G.; Giurco, D. Lithium Resources, Production: Critical Assessment and Global Projections. Minerals 2012, 2, 65–84. [Google Scholar] [CrossRef]
- Mohr, S.H.; Evans, G.M. Long term forecasting of natural gas production. Energy Policy 2011, 39, 5550–5560. [Google Scholar] [CrossRef]
- IEA. Global EV Outlook 2017. Available online: https://www.iea.org/publications/freepublications/publication/global-ev-outlook-2017.html (accessed on 28 November 2017).
- Ahmed, F. Future lead battery demand: A tasty prospect, or is someone eating our lunch? In Proceedings of the 17th Asian Battery Conference, Kuala Lumpur, Malaysia, 19–22 September 2017. [Google Scholar]
- ILA. Lead Production & Statistics. Available online: http://www.ila-lead.org/lead-facts/lead-production--statistics (accessed on 25 July 2017).
- Graedel, T.E.; Allwood, J.; Birat, J.-P.; Reck, B.K.; Sibley, S.F.; Sonnemann, G.; Buchert, M.; Hageluken, C. Recycling Rates Metals A Status Report; UNEP: Nairobi, Kenya, 2011. [Google Scholar]
- Christensen, C.M. The Innovator’s Dilemma: When New Technologies Cause Great Firms to Fail; Harvard Business School Press: Brighton, MA, USA, 1997. [Google Scholar]
- Leung, J. China Shuts All Lead, Zinc Mines in Hunan’s Huayuan in Effort to Clean up Mining Sector; S&P Global Platts: London, UK, 2016. [Google Scholar]
- Meinert, L.D.; Robinson, G.R.J.; Nassar, N.T. Mineral Resources: Reserves, Peak Production and the Future. Resources 2016, 5, 14. [Google Scholar] [CrossRef]
- Northey, S.; Mohr, S.H.; Mudd, G.; Weng, Z.; Giurco, D. Modelling future copper ore grade decline based on a detailed assessment of copper resources and mining. Resour. Conserv. Recycl. 2014, 83, 190–201. [Google Scholar] [CrossRef]
- Ali, S.H.; Giurco, D.; Arndt, N.T.; Nickless, E.; Brown, G.; Demetriades, A.; Durrheim, R.; Amélia Enriquez, M.; Kinnaird, J.; Littleboy, A.; et al. Mineral supply for sustainable development requires resource governance. Nature 2017, 543, 367–372. [Google Scholar] [CrossRef] [PubMed]
- Qi, Y.; Stern, N.; Wu, T.; Lu, J.; Green, F. China’s post-coal growth. Nat. Geosci. 2016, 9, 564–566. [Google Scholar] [CrossRef] [Green Version]
Figure 1.
Change in final uses of (a) lead and (b) zinc in 1990 and 2014, USA; data sourced from [19].
Figure 1.
Change in final uses of (a) lead and (b) zinc in 1990 and 2014, USA; data sourced from [19].

Figure 2.
Historic production of (a) lead and (b) zinc from Mudd et al. [8] updated with data from the British Geological Survey [26].

Figure 3.
Production from an idealised mine.
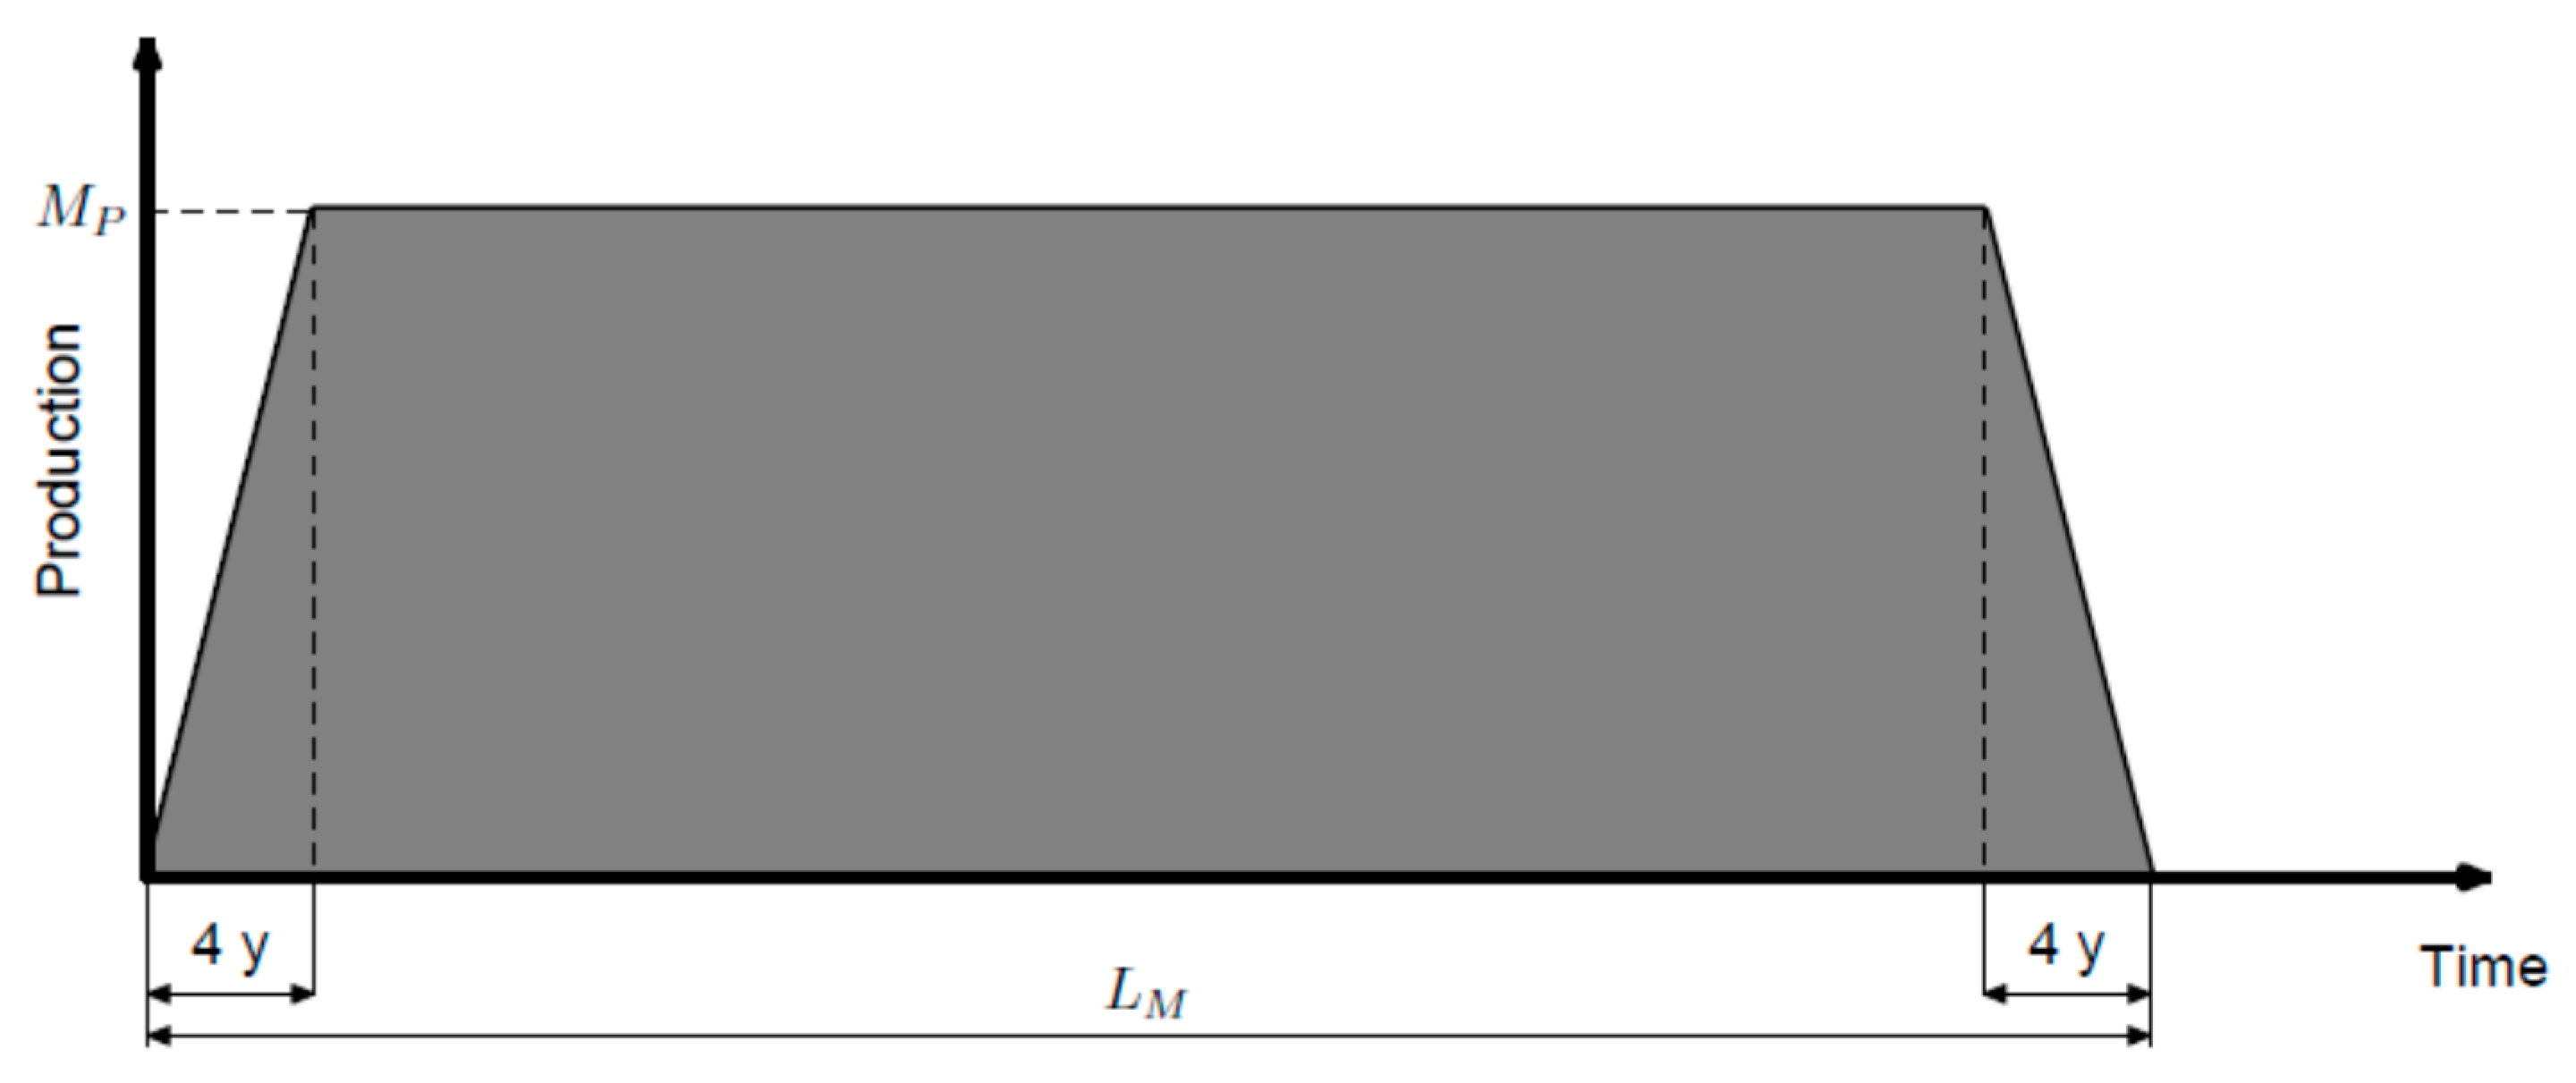
Figure 4.
Historic and Modelled lead recycled. Historical data from USGS [19] and ILA [34]. Lead is the standard recycling assumption, Lead 5Y is the alternative recycling assumption with a five-year lifespan.

Figure 5.
Lead/Zinc production ratio for key countries and world.

Figure 6.
Projection of (a) Lead and (b) Zinc mine production by key countries.

Figure 7.
Projection of Lead supply by source, (a) Standard projection, (b) Alternate projection assuming a lead lifespan of five years.
Figure 7.
Projection of Lead supply by source, (a) Standard projection, (b) Alternate projection assuming a lead lifespan of five years.

Figure 8.
Projected Lead to Zinc production ratio to 2050.

Figure 9.
Recent Chinese production of various minerals [26]. Normalisation applied assumed production between 2003 and 2010 was approximately linear and fitted by least squares method so that production is around 0 in 2003 and increases to around 7 in 2010 (see electronic supplement for data).
Figure 9.
Recent Chinese production of various minerals [26]. Normalisation applied assumed production between 2003 and 2010 was approximately linear and fitted by least squares method so that production is around 0 in 2003 and increases to around 7 in 2010 (see electronic supplement for data).


Table 1.
The URR estimates for lead and zinc in Mt of metal, predominantly based on Mudd et al. [8].
Table 1.
The URR estimates for lead and zinc in Mt of metal, predominantly based on Mudd et al. [8].
| Country | Cum. Production | Resources | URR | |||
|---|---|---|---|---|---|---|
| Lead | Zinc | Lead | Zinc | Lead | Zinc | |
| China 1 | 35.2 | 68.4 | 73.9 | 144.9 | 109.0 | 213.2 |
| Australia | 42.7 | 58.2 | 59.5 | 95.4 | 102.2 | 153.7 |
| FSU 2 | 21.7 | 40.4 | 44.2 | 97.6 | 65.9 | 138.0 |
| Canada | 19.4 | 63.0 | 22.8 | 76.8 | 42.2 | 139.8 |
| USA | 51.1 | 59.2 | 6.4 | 21.8 | 57.5 | 81.0 |
| Peru | 14.2 | 41.8 | 11.7 | 52.7 | 26.0 | 94.5 |
| Mexico | 19.8 | 25.8 | 14.7 | 46.1 | 34.5 | 71.8 |
| India | 1.9 | 11.0 | 11.0 | 34.9 | 12.9 | 45.9 |
| Germany | 8.1 | 47.9 | 0.0 | 0.3 | 8.1 | 48.2 |
| Iran | 1.4 | 3.8 | 8.5 | 25.2 | 9.9 | 29.1 |
| North Korea | 3.7 | 6.1 | 7.5 | 17.0 | 11.2 | 23.0 |
| Spain | 14.8 | 10.4 | 2.9 | 5.9 | 17.7 | 16.2 |
| Sweden | 5.1 | 11.1 | 2.4 | 9.1 | 7.5 | 20.2 |
| South Africa | 2.5 | 2.7 | 3.5 | 17.4 | 6.0 | 20.1 |
| Poland 3 | 3.8 | 13.0 | 4.5 | 1.2 | 8.2 | 14.2 |
| Others 4 | 52.5 | 93.4 | 25.3 | 95.1 | 77.8 | 188.5 |
| World | 298.0 | 556.0 | 298.5 | 741.5 | 596.5 | 1297.4 |
1 Chinese government resource numbers [28]; 2 Former Soviet Union; 3 Poland’s lead URR estimated by Hubbert Linearisation method; 4 The total contains small additional resources calculated via the Hubbert Linearisation method, for countries with production but no resources. The offshore Atlantis II deposit has been split 50/50 between Somalia and Saudi Arabia.
Table 2.
Peak Year and Rate by main countries. Peak Rate in Mt/y metal.
| Country | Lead | Zinc | ||
|---|---|---|---|---|
| Peak Year | Peak Rate | Peak Year | Peak Rate | |
| China | 2023 | 3.7 | 2023 | 5.54 |
| Australia | 2028 | 0.7 | 2030 | 1.9 |
| FSU | 2041 | 0.98 | 2046 | 2.06 |
| Canada | 2071 | 0.47 | 2060 | 2.1 |
| USA | 1976 | 0.57 | 2006 | 0.85 |
| Peru | 2039 | 0.49 | 2009 | 1.54 |
| Mexico | 2048 | 0.36 | 2032 | 1.1 |
| India | 2038 | 0.29 | 2022 | 0.83 |
| Germany | 1944 | 0.1 | 1897 | 0.85 |
| Spain | 1909 | 0.2 | 1990 | 0.26 |
| Production | 2025 | 7.41 | 2031 | 16.61 |
| Recycle | 2074 | 28.09 | - | - |
| Supply | 2064 | 29.57 | - | - |
Table 3.
Comparison between literature projections and this article.
| Reference | Mineral | Method | URR Mt (metal) | Peak Year | Peak Production (Mt/y metal) |
|---|---|---|---|---|---|
| Roper [22] Low | Lead | Multicycle Hubbert Curve | 340 | <2020 | 5.5 |
| Roper [22] High | Lead | Multicycle Hubbert Curve | 430 | <2020 | 7 |
| Sverdrup and Ragnarsdottir [23] | Lead | Multicycle Hubbert Curve | NA | Historic | |
| Calvo et al. [24] | Lead | Single Hubbert Curve | 2300 | 2128 | 9 |
| This article | Lead | GeRS-DeMo | 597 | 2025 | 7.4 |
| Roper [22] Low | Zinc | Multicycle Hubbert Curve | 250 | 2018 | 14.5 |
| Roper [22] High | Zinc | Multicycle Hubbert Curve | 480 | 2023 | 17 |
| Sverdrup and Ragnarsdottir [23] | Zinc | Multicycle Hubbert Curve | 1560 | 2030 | 20 |
| Calvo et al. [24] | Zinc | Single Hubbert Curve | 2450 | 2061 | 17 |
| This article | Zinc | GeRS-DeMo | 1297 | 2031 | 16.6 |
© 2018 by the authors. Licensee MDPI, Basel, Switzerland. This article is an open access article distributed under the terms and conditions of the Creative Commons Attribution (CC BY) license (http://creativecommons.org/licenses/by/4.0/).
Share and Cite
MDPI and ACS Style
Mohr, S.; Giurco, D.; Retamal, M.; Mason, L.; Mudd, G. Global Projection of Lead-Zinc Supply from Known Resources. Resources 2018, 7, 17. https://doi.org/10.3390/resources7010017
AMA Style
Mohr S, Giurco D, Retamal M, Mason L, Mudd G. Global Projection of Lead-Zinc Supply from Known Resources. Resources. 2018; 7(1):17. https://doi.org/10.3390/resources7010017
Chicago/Turabian StyleMohr, Steve, Damien Giurco, Monique Retamal, Leah Mason, and Gavin Mudd. 2018. "Global Projection of Lead-Zinc Supply from Known Resources" Resources 7, no. 1: 17. https://doi.org/10.3390/resources7010017
Note that from the first issue of 2016, this journal uses article numbers instead of page numbers. See further details here.