Article

The Potential Benefits of Introducing Informal Recyclers and Organic Waste Recovery to a Current Waste Management System: The Case Study of Santiago de Chile

1
Graduate School of Life and Environmental Sciences, University of Tsukuba, Tsukuba 305-8572, Japan
2
Faculty of Life and Environmental Sciences, University of Tsukuba, Tsukuba 305-8572, Japan
*
Author to whom correspondence should be addressed.
Resources 2018, 7(1), 18; https://doi.org/10.3390/resources7010018
Submission received: 14 January 2018 / Revised: 12 February 2018 / Accepted: 24 February 2018 / Published: 2 March 2018

Abstract

:
Chile has experienced rapid economic growth in recent decades. However, this economic growth has been accompanied by a huge increase in waste generation. Although the country has historically put emphasis on appropriate final disposal of waste through landfill, the environmental problems generated by this activity have shown that it is necessary to improve the national solid waste management approach. Santiago, the capital of Chile, generates about 43% of the national solid waste. A study conducted by the Ministry of the Environment in 2011 found that 14% of the waste generated in the capital is recycled, mostly thanks to local campaigns and collection by the informal sector (scavengers). While in 2009 the government set a target to recycle 25% of municipal inorganic waste by 2020, there is no information on the implementation process to reach this target. Most importantly, the law has not established specific recycling rates for target materials, and, has not taken into consideration organic waste recovery, which accounts for 48% of the total waste stream. In order to meet the government target and at the same time promote organic waste recovery, this study proposes and evaluates the environmental impacts of different viable alternatives for municipal solid waste collection, treatment and recovery by using Life Cycle Assessment (LCA). The proposed scenarios range from the current situation to the introduction of organic waste recovery and the inclusion of informal recyclers in the collection process. By considering the investment and treatment costs of each alternative, the study identifies the most effective scenario in terms of avoided pollutants per cost ratio. Finally, the study analyzes the feasibility of the implementation of the selected scenario by indicating benefits and challenges. The results of the scenario evaluation suggest that the scenario with the highest recovery of inorganic and organic materials, coupled with the participation of the informal collectors, will have a positive impact not only in terms of meeting and surpassing the government goal, but also in the reduction of CO2eq emissions. This scenario can reduce by approximately 3.5% the national CO2eq generated, with a cost of $14.1/ton. Moreover, the potential reductions of CH4 account for 8.5% of the national CH4 emissions and 24.5% of the national waste sector CH4 emissions.

1. Introduction

The rapid increase in population, economic growth, and rise in living standards in urban areas of developing countries have been accompanied by a huge increase in municipal waste generation [1]. This rapid increase in urban areas has overwhelmed local authorities and national governments alike [2].
Latin America and the Caribbean (LAC) are no exception to these trends. The region experienced robust economic growth between 2002 and 2012, with an increase in gross domestic product (GDP) per capita of nearly 28.2%. In the same period, the population has grown by 13.2% [3] and is also the most urbanized region in the world [4].
Several recent World Bank studies forecast that the region’s municipal solid waste will increase from 131 million tons in 2005 to roughly 179 million by 2030 [5]. The regional average per capita generation of municipal solid waste (MSW) is 0.9 kg/cap/day, of which 67% corresponds to domestic solid waste (DSW) [6].
In the region, the management of MSW is largely the responsibility of the municipal governments [7]. Local governments typically use property taxes to handle waste management costs. Between 2002 and 2010 the cost per ton of the collection, transfer, and disposal of solid waste increased by 42%, from $47/ton to almost $67/ton [8]. The waste collection coverage in the region’s cities ranges from 11 to 100% of the population, with an average of 81% [5]. In countries like Argentina, Brazil, Chile, Colombia, Dominican Republic, Uruguay, and Venezuela, the coverage is nearly 100% [6].
Informal recyclers do most of the sorted collection in the region. They collect, separate, and commercialize materials like cardboard, glass, paper, or metal, and rely on this activity as their main source of income. They are known as informal because their activities are not regulated or protected by the government; hence, there is no specific information about the amount of waste recovered. It is estimated that in Latin America there are approximately 3.8 million informal recyclers and cities such as Sao Paulo, Buenos Aires, Bogota, and Mexico City have tens of thousands [9]. While sorted collection increases the feasibility of recycling programs, this practice is almost non-existent in the region. However, there are cases like Brazil, where a little more than 69.3% of municipalities implement some type of initiative for selective MSW collection programs [10].
Although a growing number of LAC governments are either implementing awareness initiatives on the negative impacts of poor solid waste management, focused on designing and implementing the regulatory framework for adequate waste management, and/or incorporating the informal sector into the formal waste management system [7,11], municipalities with management plans account for only 19.8% at the regional level [8].
Financial capacity is another challenge that LAC governments must overcome. For example, except for landfill gas recovery systems, Latin American countries do not have the financial capacity to implement energy recovery technologies through incineration or biogasification [12].
In order to reduce the greenhouse gas (GHG) emissions that account for 12% of total global emissions, clean development mechanism (CDM) is one of the most used instruments in the region. It was stated at the meeting of the Executive Committee of CDM in 2010 that from the registered projects (investment projects executed in developing countries that may obtain additional income through the sale of carbon credits via an emission reduction certificate issued to a developed country with emission reduction goals), 19.6% (or 480 projects) are from the Latin American region. Of these projects, 24.8% correspond to waste management and disposal [8]. The countries with the largest number of approved projects in the region are Brazil, Mexico, and Chile, with 7.3%, 5%, and 1.6%, respectively.
With $23,960 in 2016, Chile had the highest GDP PPP (Purchasing Power Parity) per capita in Latin America [13], and it is considered one of Latin America’s fastest-growing economies in recent decades by the World Bank [14]. As one of the countries that joined the Kyoto Protocol, Chile, as a developing country, does not have a binding commitment to reduce its emissions under this protocol. However, Chile made a voluntary commitment at the time of the Copenhagen Agreement. Under this commitment, Chile has set a target to achieve a 20% reduction in projected GHG emissions by the year 2020 [15].
A study conducted by the Ministry of Environment in 2011 [16] found that 14% of the waste generated in the capital is recycled thanks to mostly local campaigns and collection by the informal sector (scavengers). While in 2009 the government set a target to recycle 25% of inorganic waste by 2020, there is no information on the implementation process to reach this target. Most importantly, the law has not established specific recycling rates for target materials, and has not taken into consideration organic waste recovery, which accounts for 48% of the total waste stream. In order to meet the government target and at the same time promote organic waste recovery, this study proposes and evaluates different viable alternatives for municipal solid waste collection, treatment, and recovery using LCA. The proposed scenarios range from the current situation to the introduction of organic waste recovery and the inclusion of informal recyclers in the collection process.

2. Chile’s Waste Management System Background

Chile has enjoyed rapid and sustained economic growth in recent decades [14]. However, this economic growth has been accompanied by severe environmental degradation and social costs. Historically, the country has focused on the appropriate final disposal of waste through sanitary landfill. Until 1990 all the MSW produced in Santiago was disposed of in landfills or dumping sites. Thanks to the policies introduced from the 1990s, the government improved quality landfill regulations and increased controlled post-closure programs, significantly reducing the number of dumpsites [17]. However, despite this progress, the environmental problems generated by the hoarding of solid waste in landfills, such as GHG emissions, water pollution, land erosion, and the rapid filling of the landfills, have shown that concentrating efforts on sanitary final disposal is not enough. Therefore, it is necessary to improve the current environmental and sanitary regulations, address the existing legal loopholes, enhance inspection, and change the national solid waste management reactive approach [18]. This new line of action will also contribute to progress toward green growth and sustainable development, one of the goals of the Organization for Economic Co-operation and Development (OECD), of which Chile has been a member since 2010.
In Chile, local governments oversee city sanitation, defined as the proper collection, transportation, and disposal of municipal solid waste [19]. Municipalities pay an average of $40 per ton of waste to be collected, transported, and disposed [8]. However, as there is no specific policy about the way solid waste must be managed, each municipality has its own waste management system.
The last study conducted by the Ministry of the Environment [16] stated that 10% of waste is recycled. The rest of the waste is disposed of in landfills, which, in 2013, generated 34.8% of national CH4 emissions, making the waste sector the second most relevant in terms of CH4 emissions [20].
Even though 50% of the population has a positive attitude towards the separation of municipal solid waste, and 90% of the population identified recycling as the solution to the municipal solid waste management system [21], currently it is not compulsory to separate waste in Chile. While in 2009 the government set a recycling target of 25% for inorganic materials by 2020, there is no specific information on how to achieve this target. As part of the National Policies of Solid Waste Management strategic plans, Santiago Province, which includes 32 of the 52 municipalities of the Santiago region, is implementing a large recycling project. This project is called “Santiago recicla” (Santiago recycles) and proposes the establishment of drop-off stations to reach the government target. Nowadays, this is where the government is directing its efforts. However, considering the low efficiency of drop-off collection systems, it will be extremely difficult to reach the target. Moreover, this project does not take into consideration organic materials, which account for 48% of waste.
In order to meet the government goal and at the same time promote organic waste recovery for methane emissions reduction, this study proposes the evaluation of different alternatives for municipal solid waste collection, treatment, and recovery for inorganic and organic materials with the intention of determining the most effective systems in terms of avoided pollutants per cost ratio.
The area of study will be the capital of Chile, which generates about 43% of national solid waste and where 14% of waste is recycled, mostly thanks to local campaigns and informal collectors [18].

2.1. Waste Generation and Characterization in Santiago

Figure 1 shows a map of the continental area of Chile and the location of the metropolitan Region. This region is divided into six provinces, with a total of 52 municipalities. The highest generation of waste is produced at the center area, i.e., Santiago Province. Therefore, this study uses the 32 municipalities of Santiago Province and the municipalities of Puente Alto and San Bernardo as the study area. This area is called Gran Santiago.
Puente Alto, Maipu, La Florida, San Bernardo, Las Condes, and Pudahuel are the districts with the highest waste generation, exceeding 100,000 tons per year [16]. They account for over 43% of the waste generated by the 34 districts considered in this study. Waste generation per capita ranges between 0.54 and 2.09 kg/hab/day in 2009 [18].
There are two major studies regarding waste characterization in Santiago: the first was conducted in 2006 [22] by the Catholic University of Valparaiso with the support of the Environment National Commission and is the most detailed characterization done in Chile, with five subcategories for paper, six for cardboard, seven for plastic, and four for metal and glass. The second study is a report conducted in 2012 [23] by a consulting firm for the Ministry of the Environment and has only the categories used in this study with no subcategories. Since there are no major differences between the results of the two analyses (less than 1% for dry recyclable materials), this research uses values from both studies. For example: this study uses the latest information regarding the percentage of plastic in waste, to obtain the plastic recovery amounts, but used the study from 2006 to obtain the tons of PET bottles.

2.2. MSW Management System in Santiago

Gran Santiago is the most urbanized area in the metropolitan region, reaching 100% collection coverage with a frequency that varies from two to three times a week to daily [8]. In Santiago, municipal waste is usually collected through kerbside collection system, covering around 86% of total waste generation. MSW is usually left in bags or containers on the street. The normal collection system takes all the mixed waste and then transports it to a transfer station or directly to landfill. The other 14% of waste is collected through different collection methods, the final goal of which is waste recovery [24,25]. These methods and their respective recovery system are described as follows:

2.2.1. Sorted Collection at Source

This method involves the sorting of recyclable waste at home and collection by a municipal service or by informal collectors. There are only three municipalities that offer a formal sorted collection system: Vitacura and Nuñoa for dry recyclable waste with a mixed bank collection system; and La Pintana for kitchen waste with a sorted bank collection system. These formal systems contribute approximately 4.8% of the recycled waste collected in Santiago. In the case of informal collectors, they transport the waste to an intermediate collector or sell it directly to recycling companies. There are approximately 60,000 informal collectors in the country, who collect between 2 to 10 tons per month/person, depending on the zone in which they operate [25]. They contribute approximately 86% of the total waste that is recycled at national level. Some recycling companies have a team of informal recyclers, with paper recycling being the most developed network.

2.2.2. Sorting at Source for Direct Sales

This option also involves recyclable waste sorting at home or transportation by the generators to the direct sale points established by recycling companies. In this type of system, the recycling companies require a minimum volume for some recycled materials to be accepted. However, this method is not popular because of the huge amount of waste that needs to be stored before it is sold.

2.2.3. Separation at Origin for Drop-Off Collection

This method is the most popular among the municipalities and involves drop-off collection systems like the one introduced by the project Santiago Recycles. There are two types of locations, solitary bell-shaped container stations, and what in Chile is called “clean point” stations. A clean point station is a larger drop-off area that has various containers for different types of recyclable waste. Bell-shaped containers are usually associated with charity institutions, a main incentive the community has to separate and transport recyclable materials to this collection point. These drop-off stations can be managed by municipalities or by the recycling companies. There is no clear information on how much waste is collected through this method. However, the biggest clean point, and the only one included in a municipality management annual report, contributed 0.3% of the recycled waste collected in Santiago in 2009, and by 2014 increased by 156% the amount collected [26].

2.3. Sanitary Landfill

There are three sanitary landfills in Santiago and two transfer stations. The locations of the facilities are also shown in Figure 1. According to data from 2009, there were still dump sites in the metropolitan region [16], but thanks to the government’s effort these have mostly been closed, leaving only one basic controlled dump site.

3. Methodology

3.1. Model Implementation

For the Life Cycle Inventory, the functional unit in this study has been defined as the amount in tons of municipal waste generated per year in Gran Santiago. This is to avoid seasonal variations between winter and summer [22].

3.1.1. System Boundaries and Waste Generation

This study considers the forecast for waste generated in Santiago in 2017 based on an official report [22]. This report estimates that in 2020 approximately 4,400,000 tons/year of waste will be generated and it will increase to 5,250,000 tons/year by 2030. According to this, Gran Santiago will generate 3,858,760 tons/year in 2017. For the year 2017 the study considers that the increase in recycling is achieved by the increase in collection points and the participation of citizens compared to 2009. This assumption is based on government efforts to improve the drop-off collection system. This increase is estimated to be 27,555 tons/year, according to the capacity of recovery of the installed system. This represents an increase of approximately 7.2% since 2009 [27]. Figure 2 shows a diagram of the situation assumed for 2017, which will be the baseline for the study. Table 1 shows the collection and treatment efficiency for each material in the study, adapted from different sources, [28,29] and Table 2 shows the waste characterization and the recovery per material considered as a baseline in this study.
The collection systems considered in the study will be a material bank collection for mixed dry recyclable materials like glass, paper, plastic, metal, etc.; a mono material bank collection for food waste; a mono collection that includes the informal sector; and drop-off stations for sorted dry recyclable materials.
The study only assumes truck emissions, as explained in Section 3.2. Since most of the municipalities have a contract with private companies in charge of collection, with a duration of few years, the reduction in fuel cost and the reduction of trucks units will not affect the municipalities in the short term and therefore it is not included in the cost of this study.

3.1.2. Scenario Design

This study proposed six scenarios that were evaluated by using LCA technique. (IWM-2 software: version 2.5) The scenario design considered the current situation, government targets, engaging of informal recyclers, and organic waste recovery potential. These scenarios do not include energy recovery systems since those represent the lowest priority in Chile’s hierarchical waste strategy, with prevention, reuse, and recycling being the main priorities (from highest to lowest) [18].
The first scenario (S1) considers the current situation and the second scenario (S2) only improves the informal and drop-off collection efficiencies. As mentioned in previous paragraphs, the government has focused on the drop-off collection system. However, the efficiencies of these types of systems can be low [23]. The importance of this scenario is to find out if it is feasible to reach the 2010 goal by maintaining the government strategy. The third scenario (S3) focuses on reaching the governmental target set for 2020 while improving all the collection methods. However, there is the possibility that the municipalities could follow the example of Vitacura and Nuñoa, and, instead of supporting the informal sector (a subject still under analysis [24]), considers only a mixed-material bank formal collection system. Therefore, this scenario analyzes both cases while reaching the same recycling target.
Scenarios 4 (S4) and 5 (S5) focus on CH4 reduction by introducing organic waste recovery. S4 maintains the inorganic recovery target of S2, but improves all the collection methods. It also considers an organic recovery target according to the current situation of La Pintana municipality, which is the only district that has implemented a single bank collection system for vegetables. S5 maintains the inorganic recovery of S3 and introduces a target for organic materials according to the recovery target goals of the municipality of La Pintana.
From these scenarios, this study will identify the scenario that has the lowest CO2eq emission reduction cost.
A more detailed explanation of the scenarios is as follows:
Scenario 1 (S1): This scenario is based on the projected situation of waste management in Santiago for 2017, which is considered as the baseline. The recovery of the generated waste is approximately 11%, as detailed in Table 2. This was estimated with information from the Ministry of the Environment [16,18], municipalities [26,30,31], KDM tratamiento (owner of KDM MRF) [29] and personal interviews with staff from the Environmental Department of La Pintana and Nuñoa municipalities and KDM in 2015.
S1 considers four collection types. Out of the 34 municipalities, two have a mixed-material bank collection system for plastic, metal, and cardboard that will be transferred to a MRF. One district has a single bank collection system for vegetables that will be treated through composting or vermicomposting. Also, there are drop-off stations and clean points distributed in different parts of Santiago and informal household collections.
Scenario 2 (S2): This scenario considers the goal of the government for 2010, which was 20% recovery of inorganic materials and has not been achieved yet (see Figure 3). The materials considered and the ratios for this and other scenarios are shown in Table 3. This table was constructed by considering the collection system and treatment efficiencies, using reference values from different studies and reports [23,24,30,31,32].
Scenario 3: This scenario considers the goal of the government for 2020, which was 25% recovery of inorganic materials (see Table 3). It is divided into two sub-scenarios depending on whether the project includes collectors as part of the waste management collection system or not.
  • Scenario 3.1 (S3.1): Does not consider the informal collection system but only kerbside, material banks, and drop-off stations (see Figure 4).
  • Scenario 3.2 (S3.2): This scenario considers all the formal collection system from S3.1 plus the informal collectors (see Figure 4).
Scenario (S4): This scenario considers the target recovery of S2 and introduces a goal for inorganic materials of 16.4%, which represents 7% of the total waste generated. S4 total material recovery target is 27% and the collection systems considered are the same as in S1 (see Figure 5).
Scenario (S5): This scenario considers the target recovery of S3 and introduces a goal for inorganic materials of 28%, which represents 12% of the total waste generated. S5 finally sets a total target of 37% of material recovery. The S5 total material recovery target is 37%. The collection systems considered in S5 are the same as in S1 (see Figure 6).

3.2. Pollutant Emissions by Collection Trucks

This study considers the CO2 and PM10 emissions savings associated with the collection conducted by informal collectors instead of formal kerbside collection. The values were estimated based on the following equation adapted from [21] in Santiago, where municipal expenditure information from July 2008 to 30 June 2009 was used.
CO2 Calculations
W r i W t × K × R × D c o 2
where,
  • Wri: Amount of waste recycled by the informal sector in scenario i (kg/year).
  • Wt: Amount of waste taken to the landfill in each truck trip (kg/trip).
  • K: Average round-trip distance per truck (km/trip).
  • R: Fuel consumption of truck (fuel liter/km).
  • Dco2: Diesel generation of CO2 = 2.64 kg/fuel liter
  • Wt, K and R indicators were obtained from the results of a previous study [21].
PM10 Calculations
W r i W t × K × T p m 10 ,
where,
  • Wri: Amount of waste recycled by informal sector in scenario i (kg/year).
  • Wt: Amount of waste taken to the landfill in each truck trip (kg/trip).
  • K: Average round-trip distance per truck (km/trip).
  • Tpm10: Truck emissions of PM10 = 0.0029 kg/km
Wt and K were obtained from the same source as for the CO2 emission calculations. Tpm10 was obtained from the United Nations Environment Program (UNEP) TNT model’s emission factors. This model is a tool created by the United Nations to calculate fleets’ pollutant emissions [33].

3.3. Investment and Operational Cost

Table 4 shows the summary of capital and operation cost for each type of treatment according to their respective capacity. This was obtained from documents from Nuñoa Municipality [30], KDM Holdings [29], Ingeniería Alemana consultant [23], and La Pintana [31].

3.4. Assumptions Considered in This Study

The study is based on the following assumptions:
  • There is no increase in the formal collection cost even when the collection of organics is included in the system. For simplification, it is considered that the same number of trucks will be used since there is no increase in the amount of waste transported, just different days of collection.
  • There is no cost associated with the distribution of information on waste separation since it is the same in all scenarios.
  • No land cost is considered because of the price variability and lack of information.
  • The companies that recycle and use recycled materials are prepared for an increase of capacity according to each scenario. (All recyclable materials collected will be sold)
  • The municipalities cover the cost of building storage center (SC)facilities since storage is one of the biggest problems for informal recyclers when collecting waste.
  • The participation of the informal collectors and drop-off stations in the mono collection is 90% and 10%, respectively.
  • Table 5 shows the participation between bank collection and mono collection in the inorganic materials recovery considered in this study. This is based on information from experts, experience from the municipalities, and other studies.
  • Index inflation-linked Chilean peso (UF, Unidad de Fomento) value of 25,629.09 Chilean pesos according to the SII (Servicio Impuesto Interno,) for 9 December 2015 [34].
  • Dollar change of 709.04 Chilean pesos according to SII for 23 November.
  • 10% discount rate obtained for environment-related projects designed for the Ministry of the Environment [35].

4. Results and Discussions

4.1. Drop-Off Collection System

As mentioned before, the government is working on a Santiago Recicla project that intends to invest in the installation of clean points in different districts in Gran Santiago.
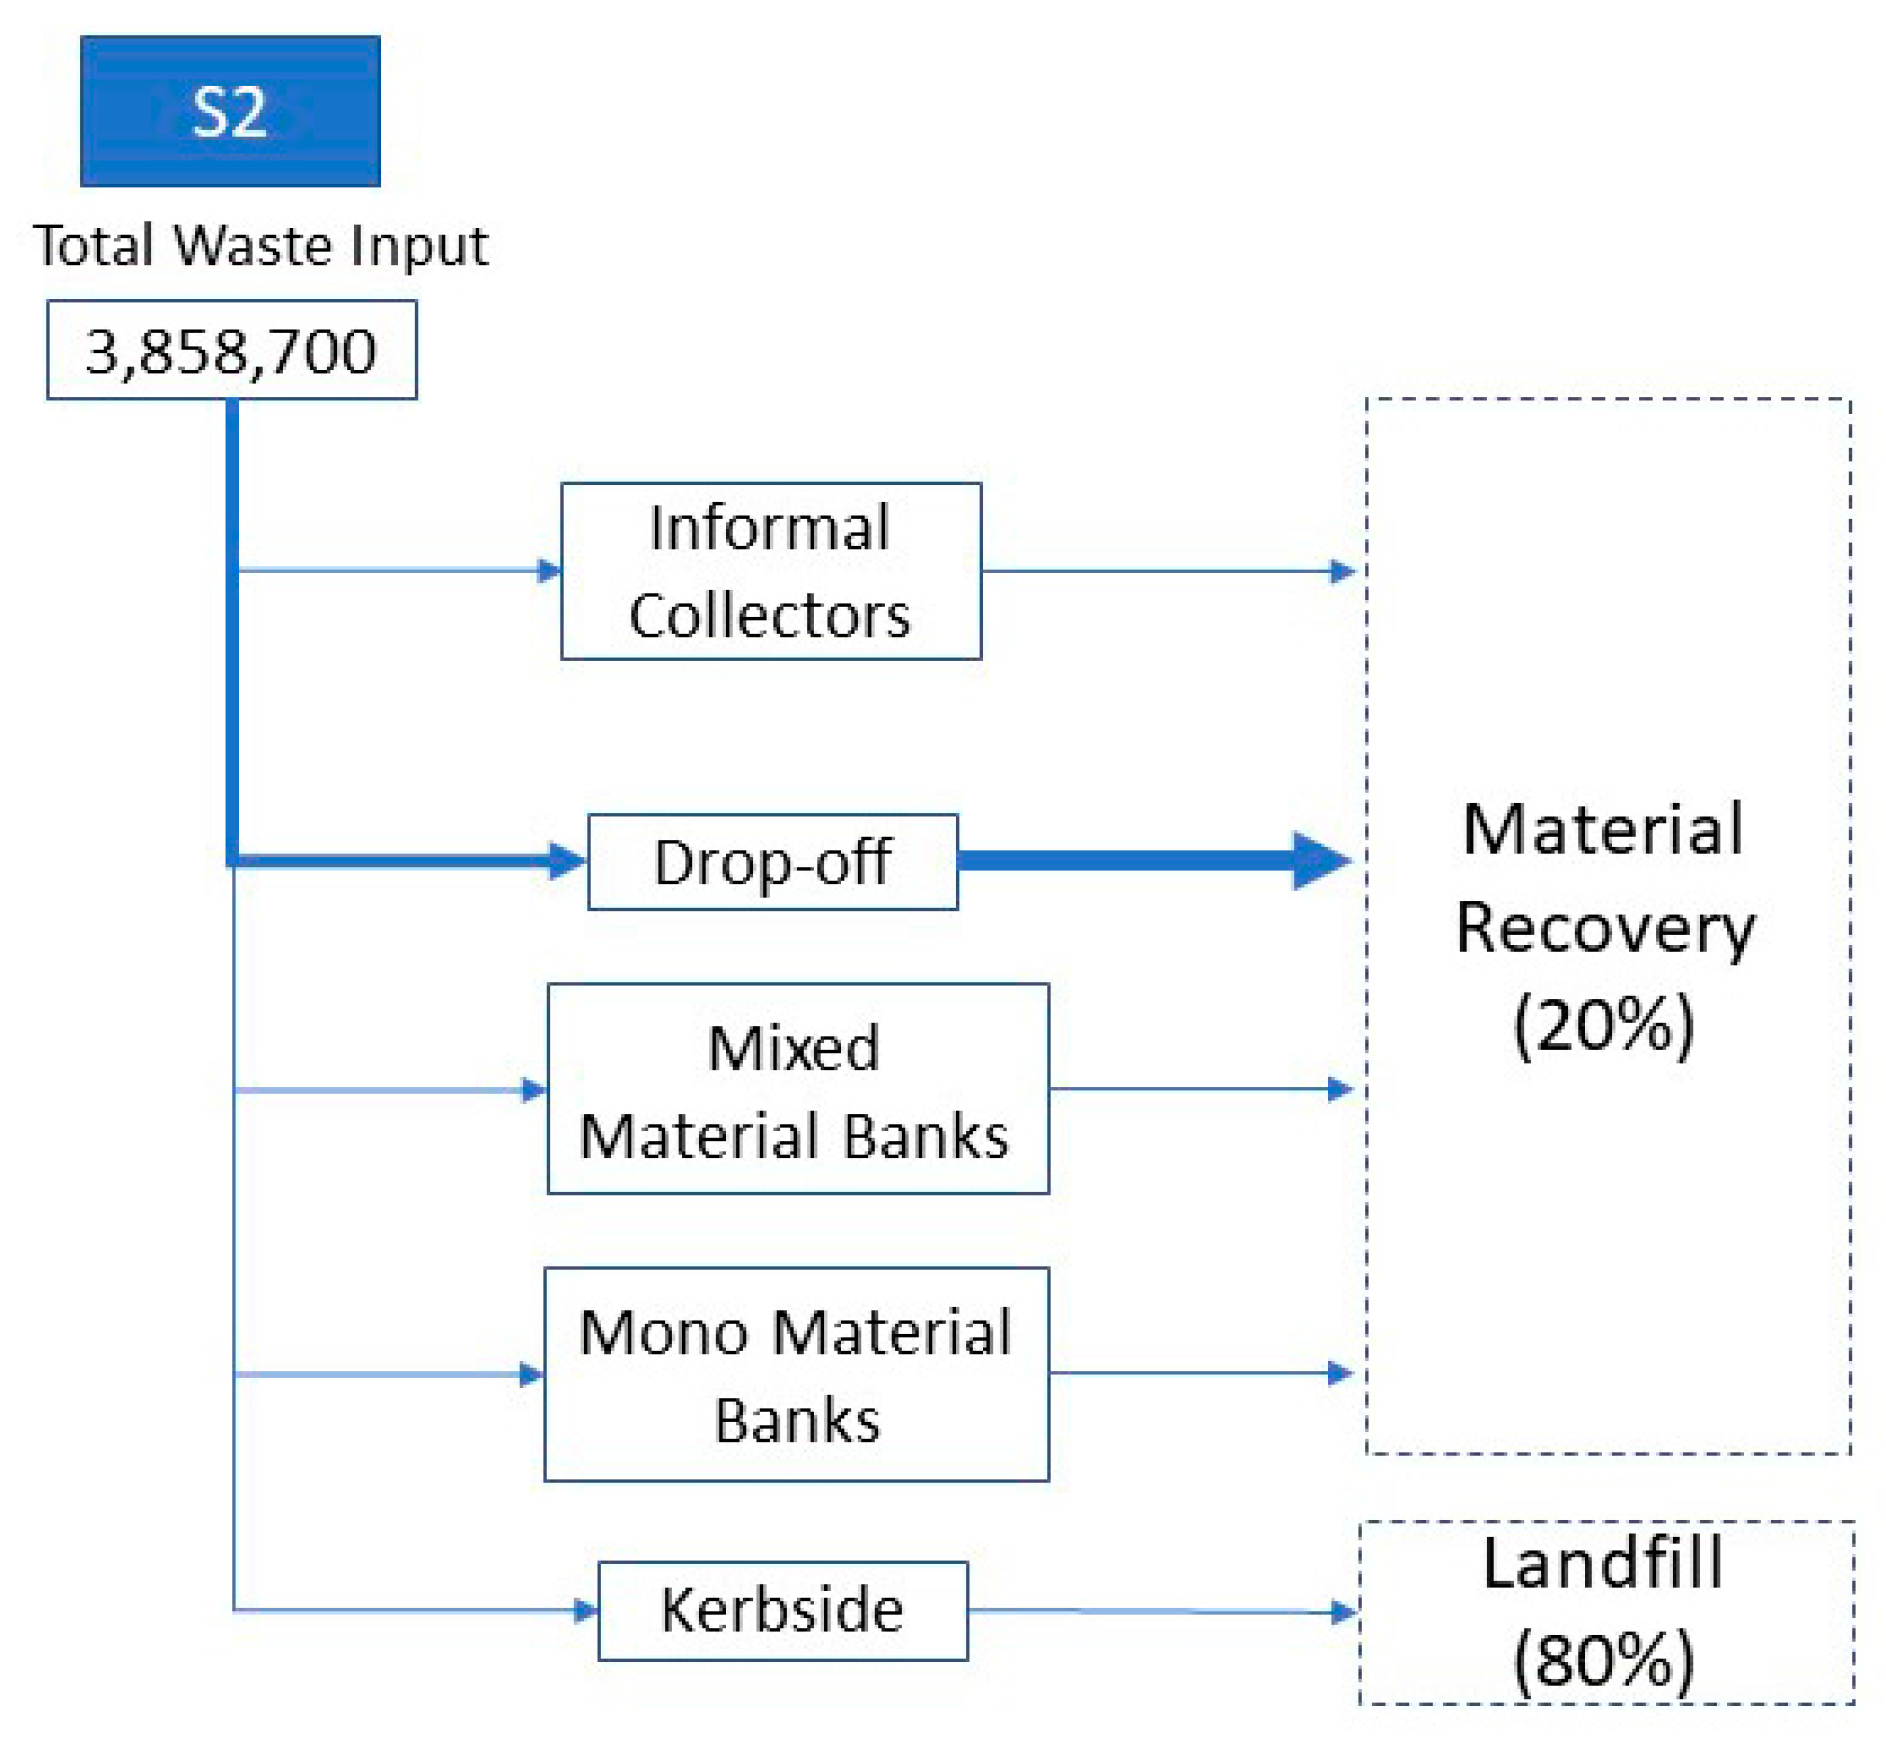
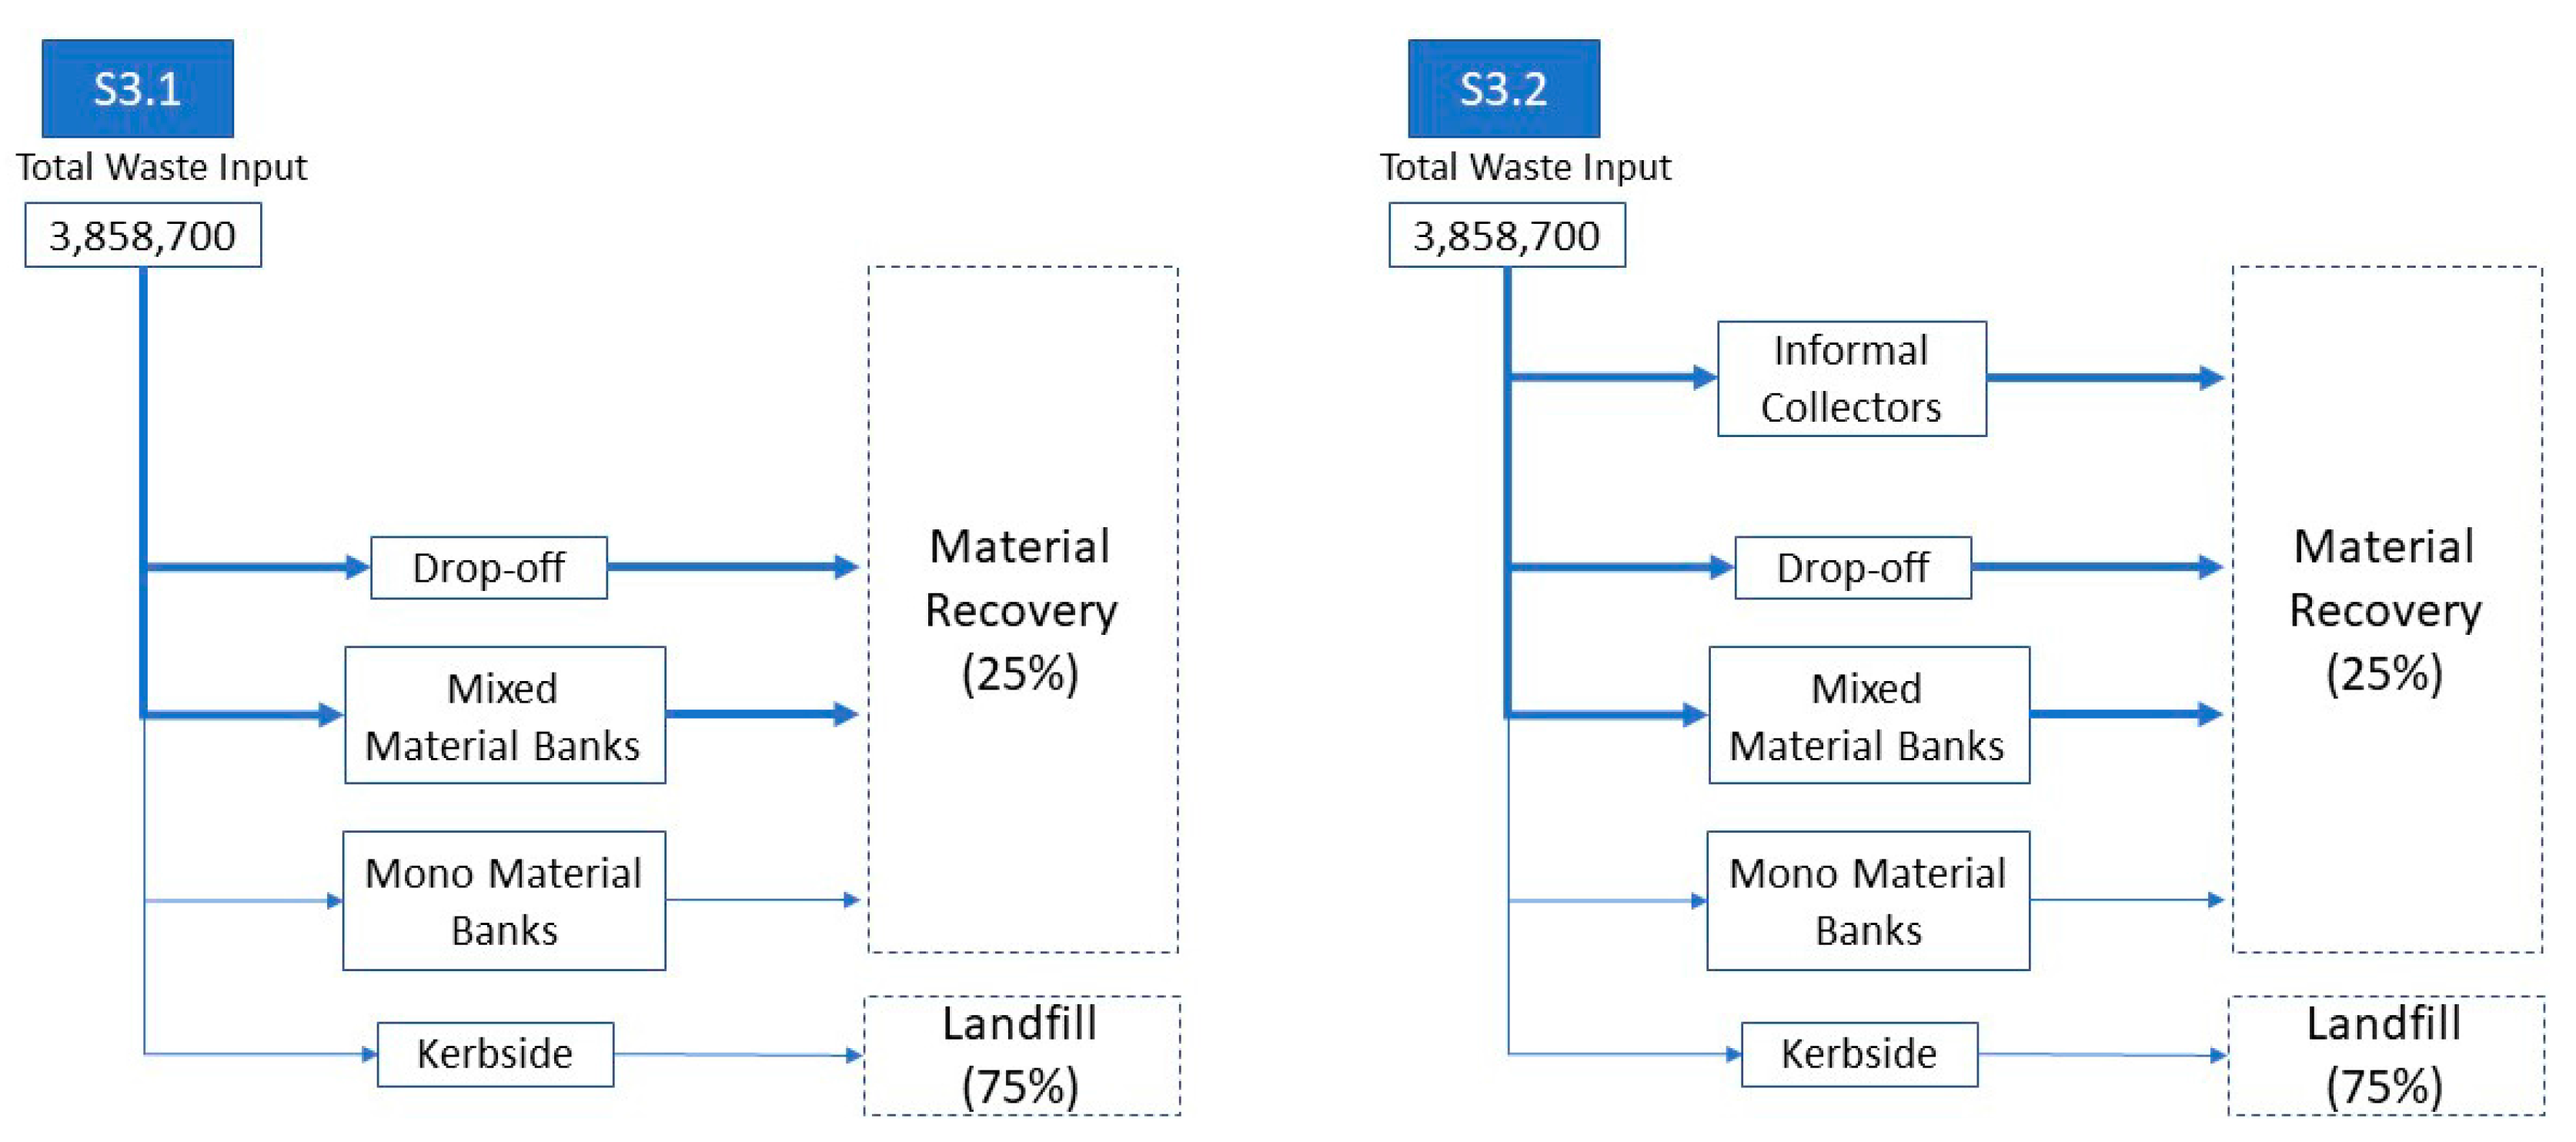
S2 maintains the status quo for the informal and formal sector and only increases the location of drop-off stations. S3.1 maintains the status quo of the informal sector and improves the formal collection and drop-off stations. To reach each of these target scenarios, it is necessary to increase the waste collected through drop-off by 1314% and 1096%, respectively, compared to S1. Table 6 shows the number of stations necessary to cover this increase in demand; the numbers are overwhelming. The results show that each municipality will have to allocate and manage approximately 16 drop-off stations. Even if the municipalities decide to install only the biggest-capacity stations, the numbers will still be in the hundreds.
The problem with this system is determining who will oversee the collection of materials. If the municipality oversees the collection, that requires additional expenses and constant monitoring, but if recycling companies oversee the collection, there would be the problem of collection frequency (companies usually wait for a few stations to be full before collecting the materials, leaving some stations overflowing with recyclable materials and not allowing people to continue depositing there). This is a big problem that happens nowadays with this type of material collection method. The location is also a problem. The center area of the study is where commerce is carried out; therefore, to allocate this number of stations seems extremely hard to do.
Another alternative will be to make the informal recyclers in charge of the collection of the materials accumulated in the drop-off and clean points; however, that does not solve the problem of storage for the informal recyclers. Storage capacity is the most important limitation that prevents informal collectors from getting better prices from recycling companies and increasing the amount they can collect [24].
These numbers show that only increasing the amount of drop-off stations is not a feasible option to reach the governmental target. Therefore, S2 is not a recommended system.

4.2. S3.1 and S3.2 High Recyclable Materials Collection Ratio

By comparing the scenarios in S3, as shown in Table 7, it is possible to notice how the informal recyclers’ participation affects the collection ratios and increase the system collection efficiency. In scenario 3.1 to reach the 25% recovery target it is necessary to force the collection of some of the recyclable materials to almost 100%, which is a very difficult task. There is also a higher loss of waste compared to S3.2. The loss of materials that are collected but not recovered is 12.4% because of the low treatment efficiencies of the MRF stations—especially regarding paper and glass, which are well-established recycling industries in Chile. However, these materials have high collection efficiencies by informal recyclers. The results show that in S3.1, to recover 59% of paper, 98.3% should be collected. Likewise, glass needs a 97.8% collection ratio to recover just 27%.
Plastic was the only material whose recovery ratio could not be increased further, although its collection ratio is still low compared to other materials. This is because film plastic is not considered a recyclable type of plastic in this study. Therefore, 48% is the maximum of plastic that can be recycled. This is different to Japan, where most plastic can be recycled thanks to energy-recovery treatments that in 2011 recycled 52% out of the 78% of plastic waste recovered that year [36].
To reach the recycling target in S3.1 it will be necessary to have a collection of almost 100% of rigid plastic, specifically plastic bottles. This is higher than the collection ratios of experienced countries like Japan, the United States, and Europe, with approximately 72%, 28%, and 48%, respectively, in 2004 [37]. It must also increase the recovery of the “other” category, which means assuming a high recovery of textiles, wood, bulky waste, and batteries, yet those materials are difficult to collect with only drop-off stations. Therefore, S3.1 is not a feasible scenario either.
Thanks to the high recovery efficiency of the informal recyclers (mono collection) for paper and glass, S3.2 can reduce the pressure on plastic recovery. Moreover, it improves the overall collection efficiency ratios, diminishing the residues that will end up in landfill.
S3.2 also has a high collection ratio, although not as high as S3.1. Discussions on this matter will be conducted in point 4.6.4 of this study.

4.3. Importance of the Inclusion of the Informal Sector in the MSWMS

Point 4.2 of this study shows how relevant the inclusion of the informal sector is for increasing the collection/treatment rate. However, the process of including the informal sector is a complicated one that would include many governmental entities. This proposal is a simple first step that will allow a better flow of information and increase awareness.
Even though in Santiago and other regions some informal collectors have formed organizations to achieve better income, there is still no information about the area they work on, specific materials they collect, or if they work based on a specific schedule. All this information is available for citizens regarding formal collection thanks to the municipalities. However, so far there is no information regarding informal recyclers.
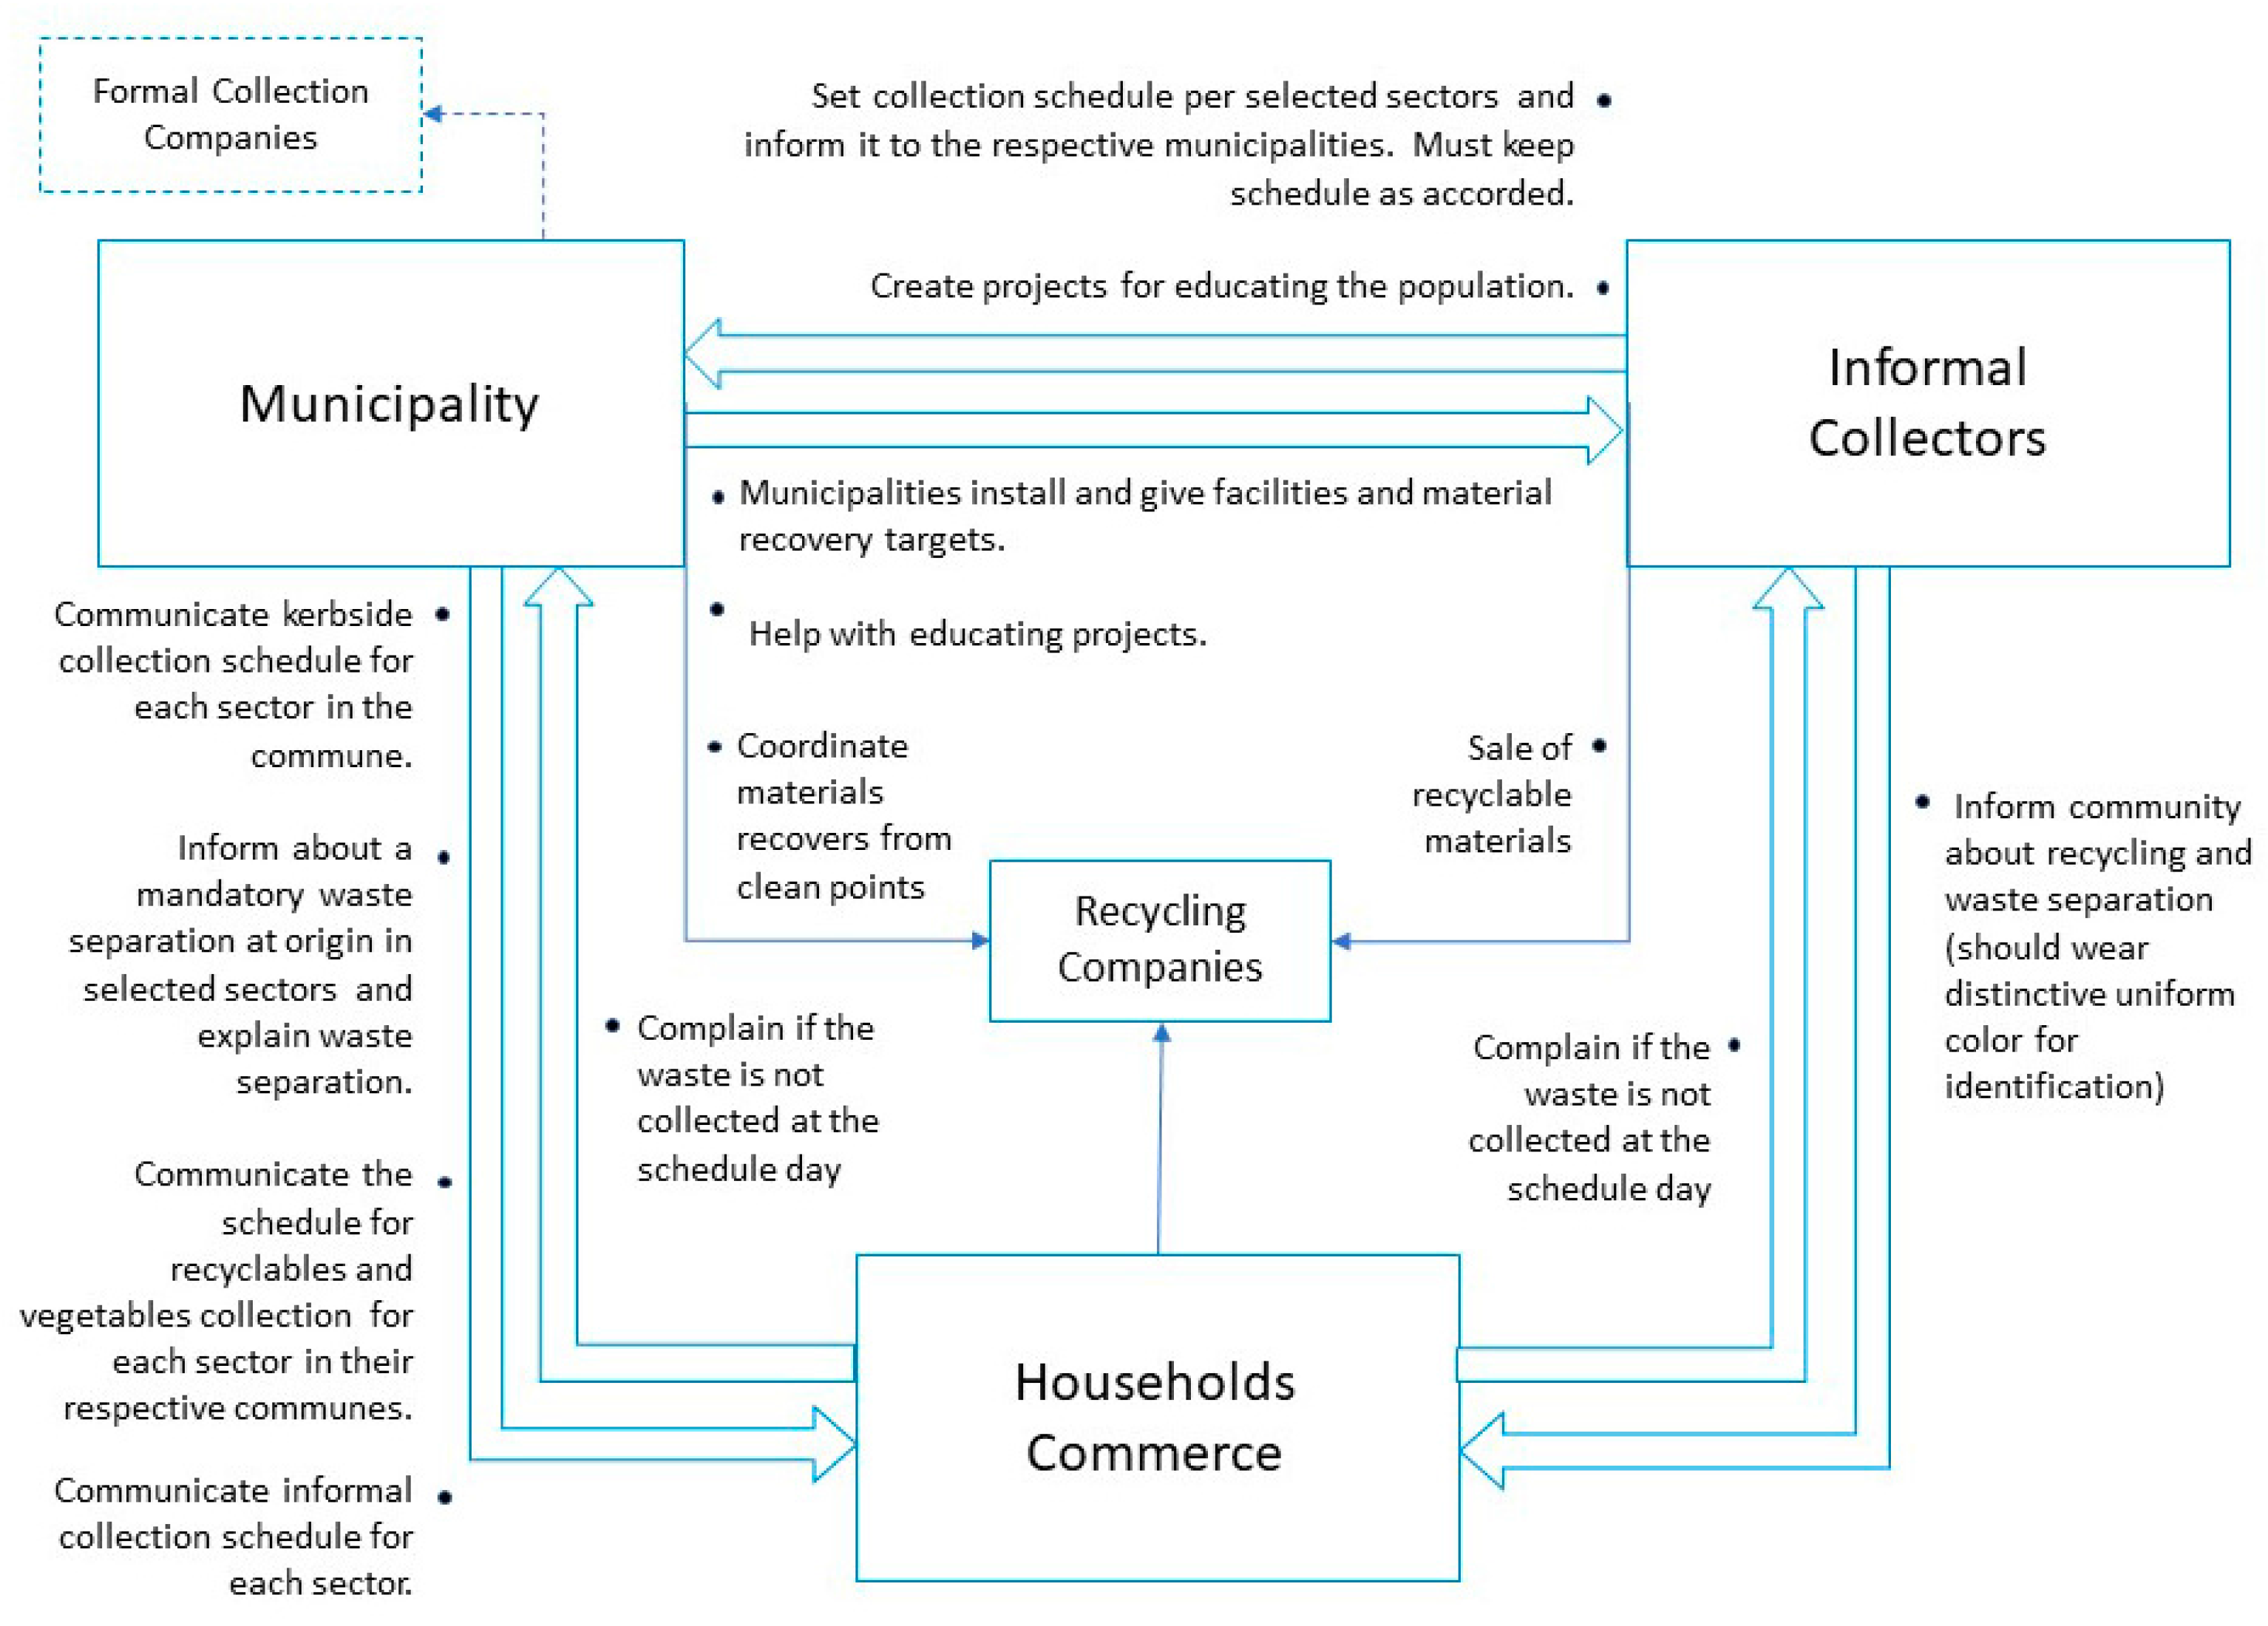
As Figure 7 shows, the municipalities need to become an intermediary between the collectors and the community, making the informal collection part of the formal system. For this, citizens need to receive information about the informal recycling schedule from an official source—the municipalities. This will help with gaining acceptance from the community.

4.4. Selection of the Most Suitable Scenario

As explained at the beginning of this research, this study first intended to identify the scenario that has the lowest CO2eq emission reduction cost.
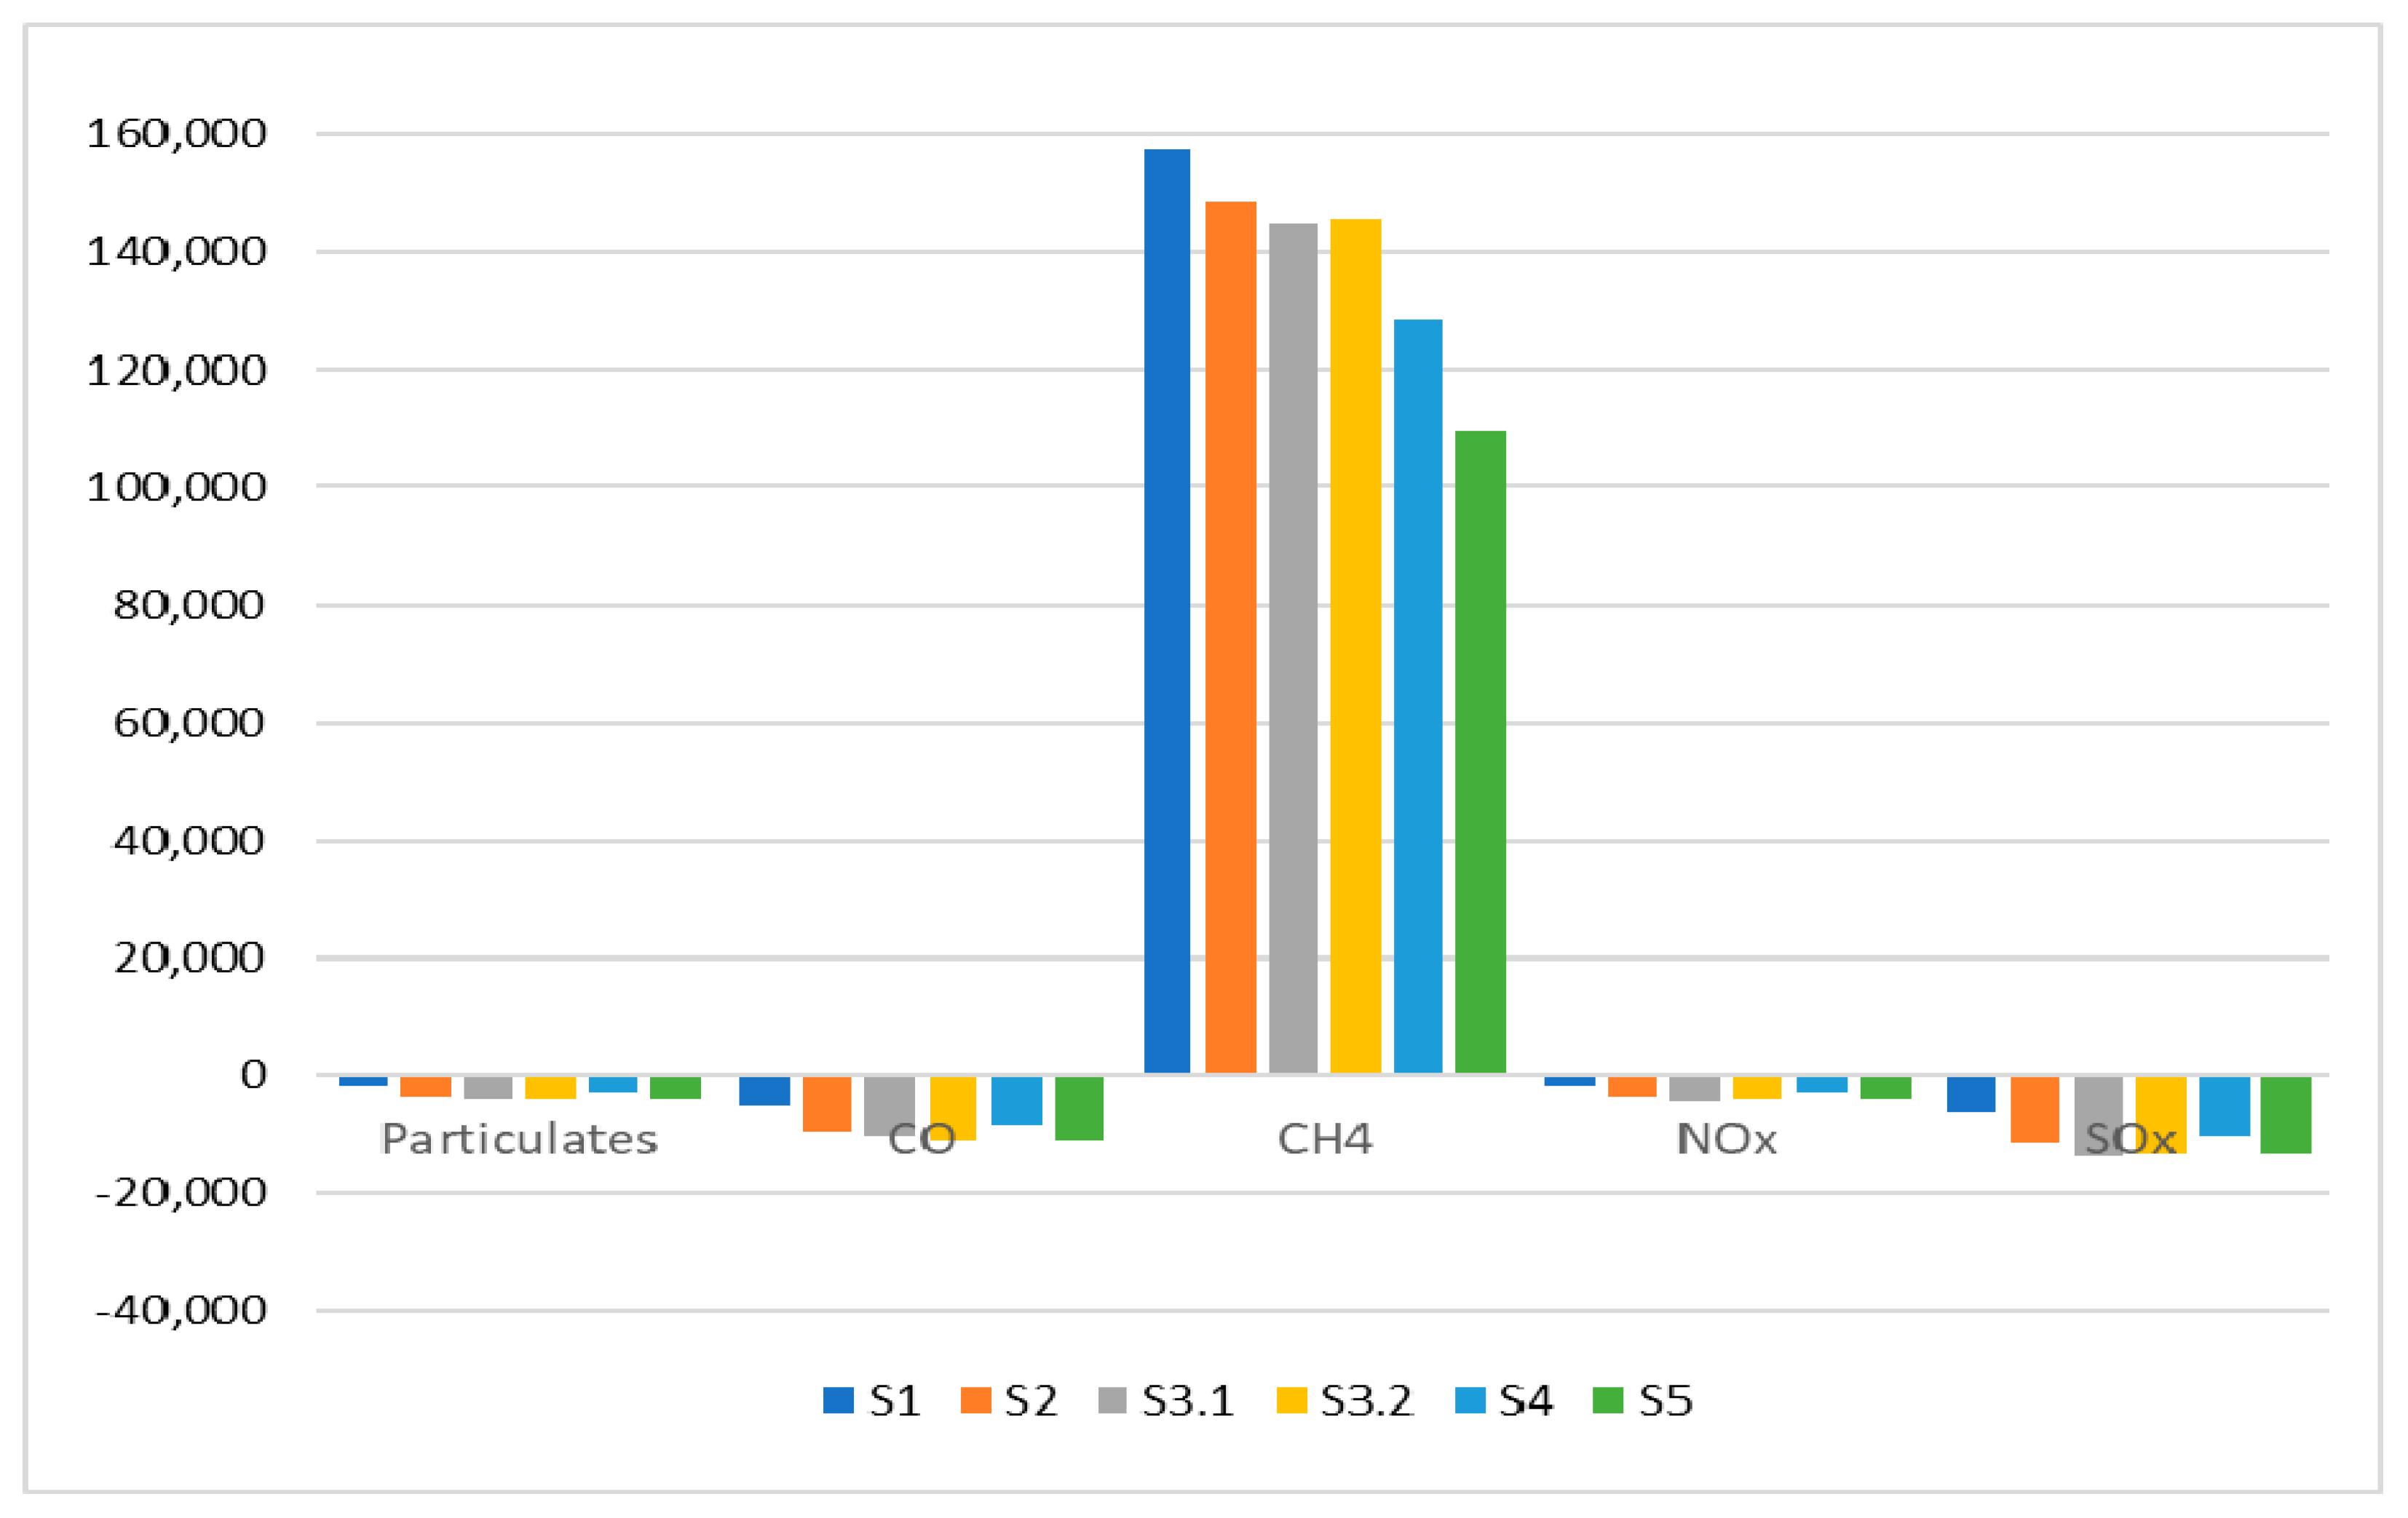
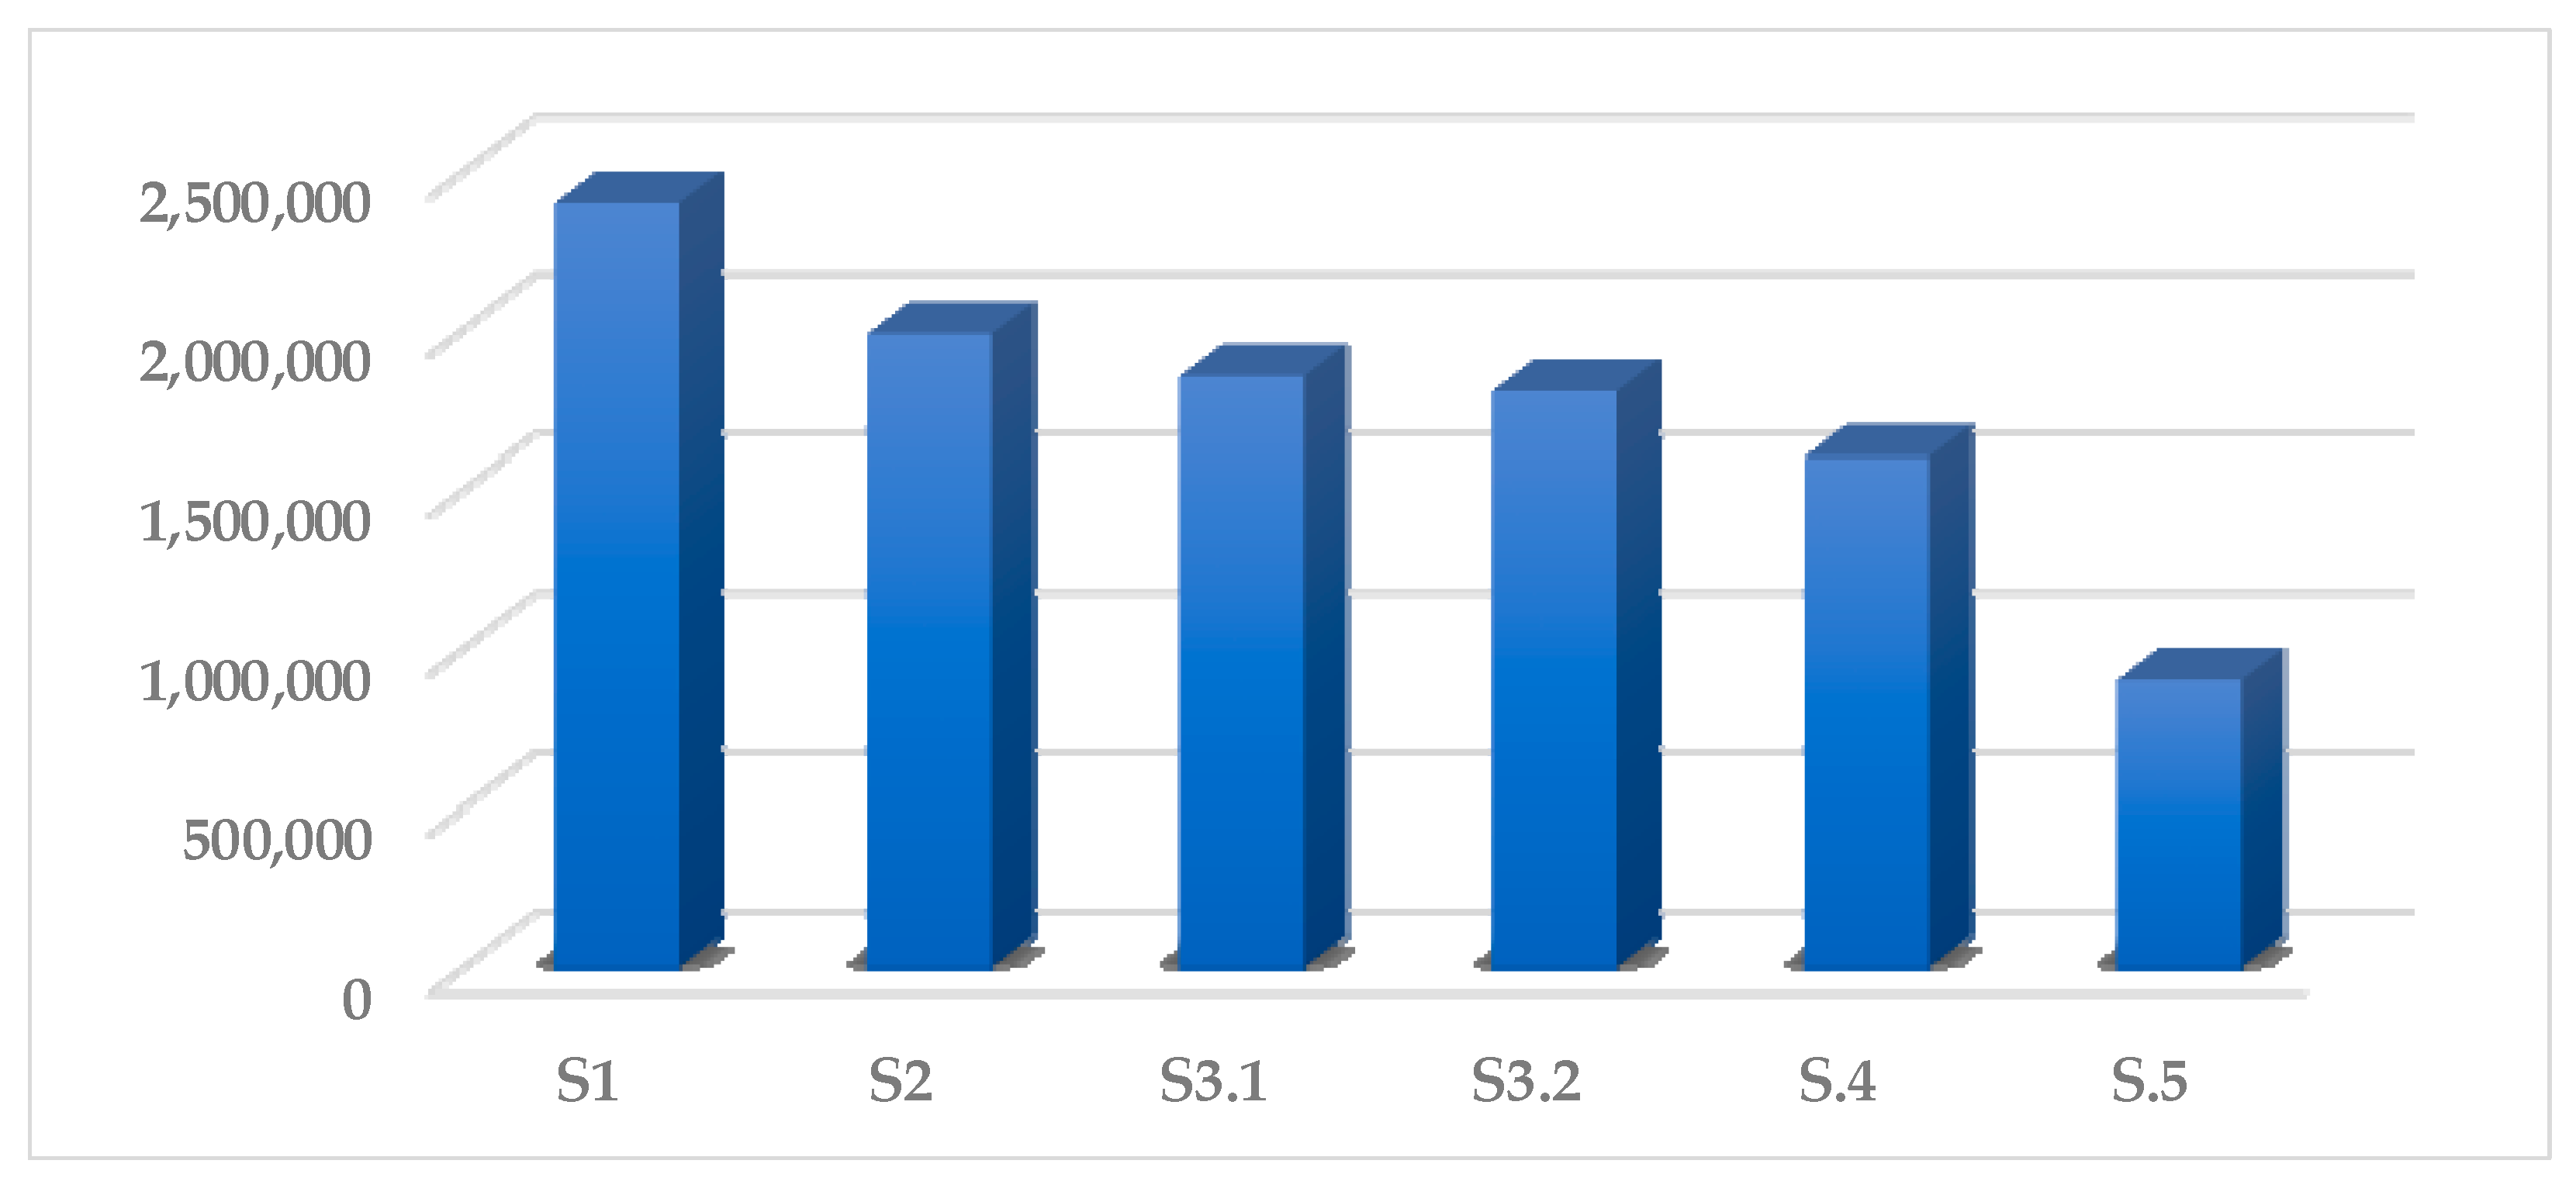
The environmental air pollutant emissions for each scenario are shown in Figure 8. Since S5 is the scenario with the highest collection of organic materials, it has the highest potential reduction of CH4, reducing approximately 30% of the S1. This reduction accounts for 8.5% of the national CH4 emissions and 24.5% of the national waste sector CH4 emissions [20]. The negative numbers represent the emissions avoided due to recycling of materials. For example, in scenario 3.2, the emission of 3000 tons of NOX can be avoided.
As expected, the more organic materials are recycled, the more GWP is reduced since CH4 is equivalent to 21 times CO2, as shown in Figure 9. In this case the highest reduction is accomplished in S5, which can reduce Chile’s CO2eq emissions by 3.5% according to data from 2006 [38].
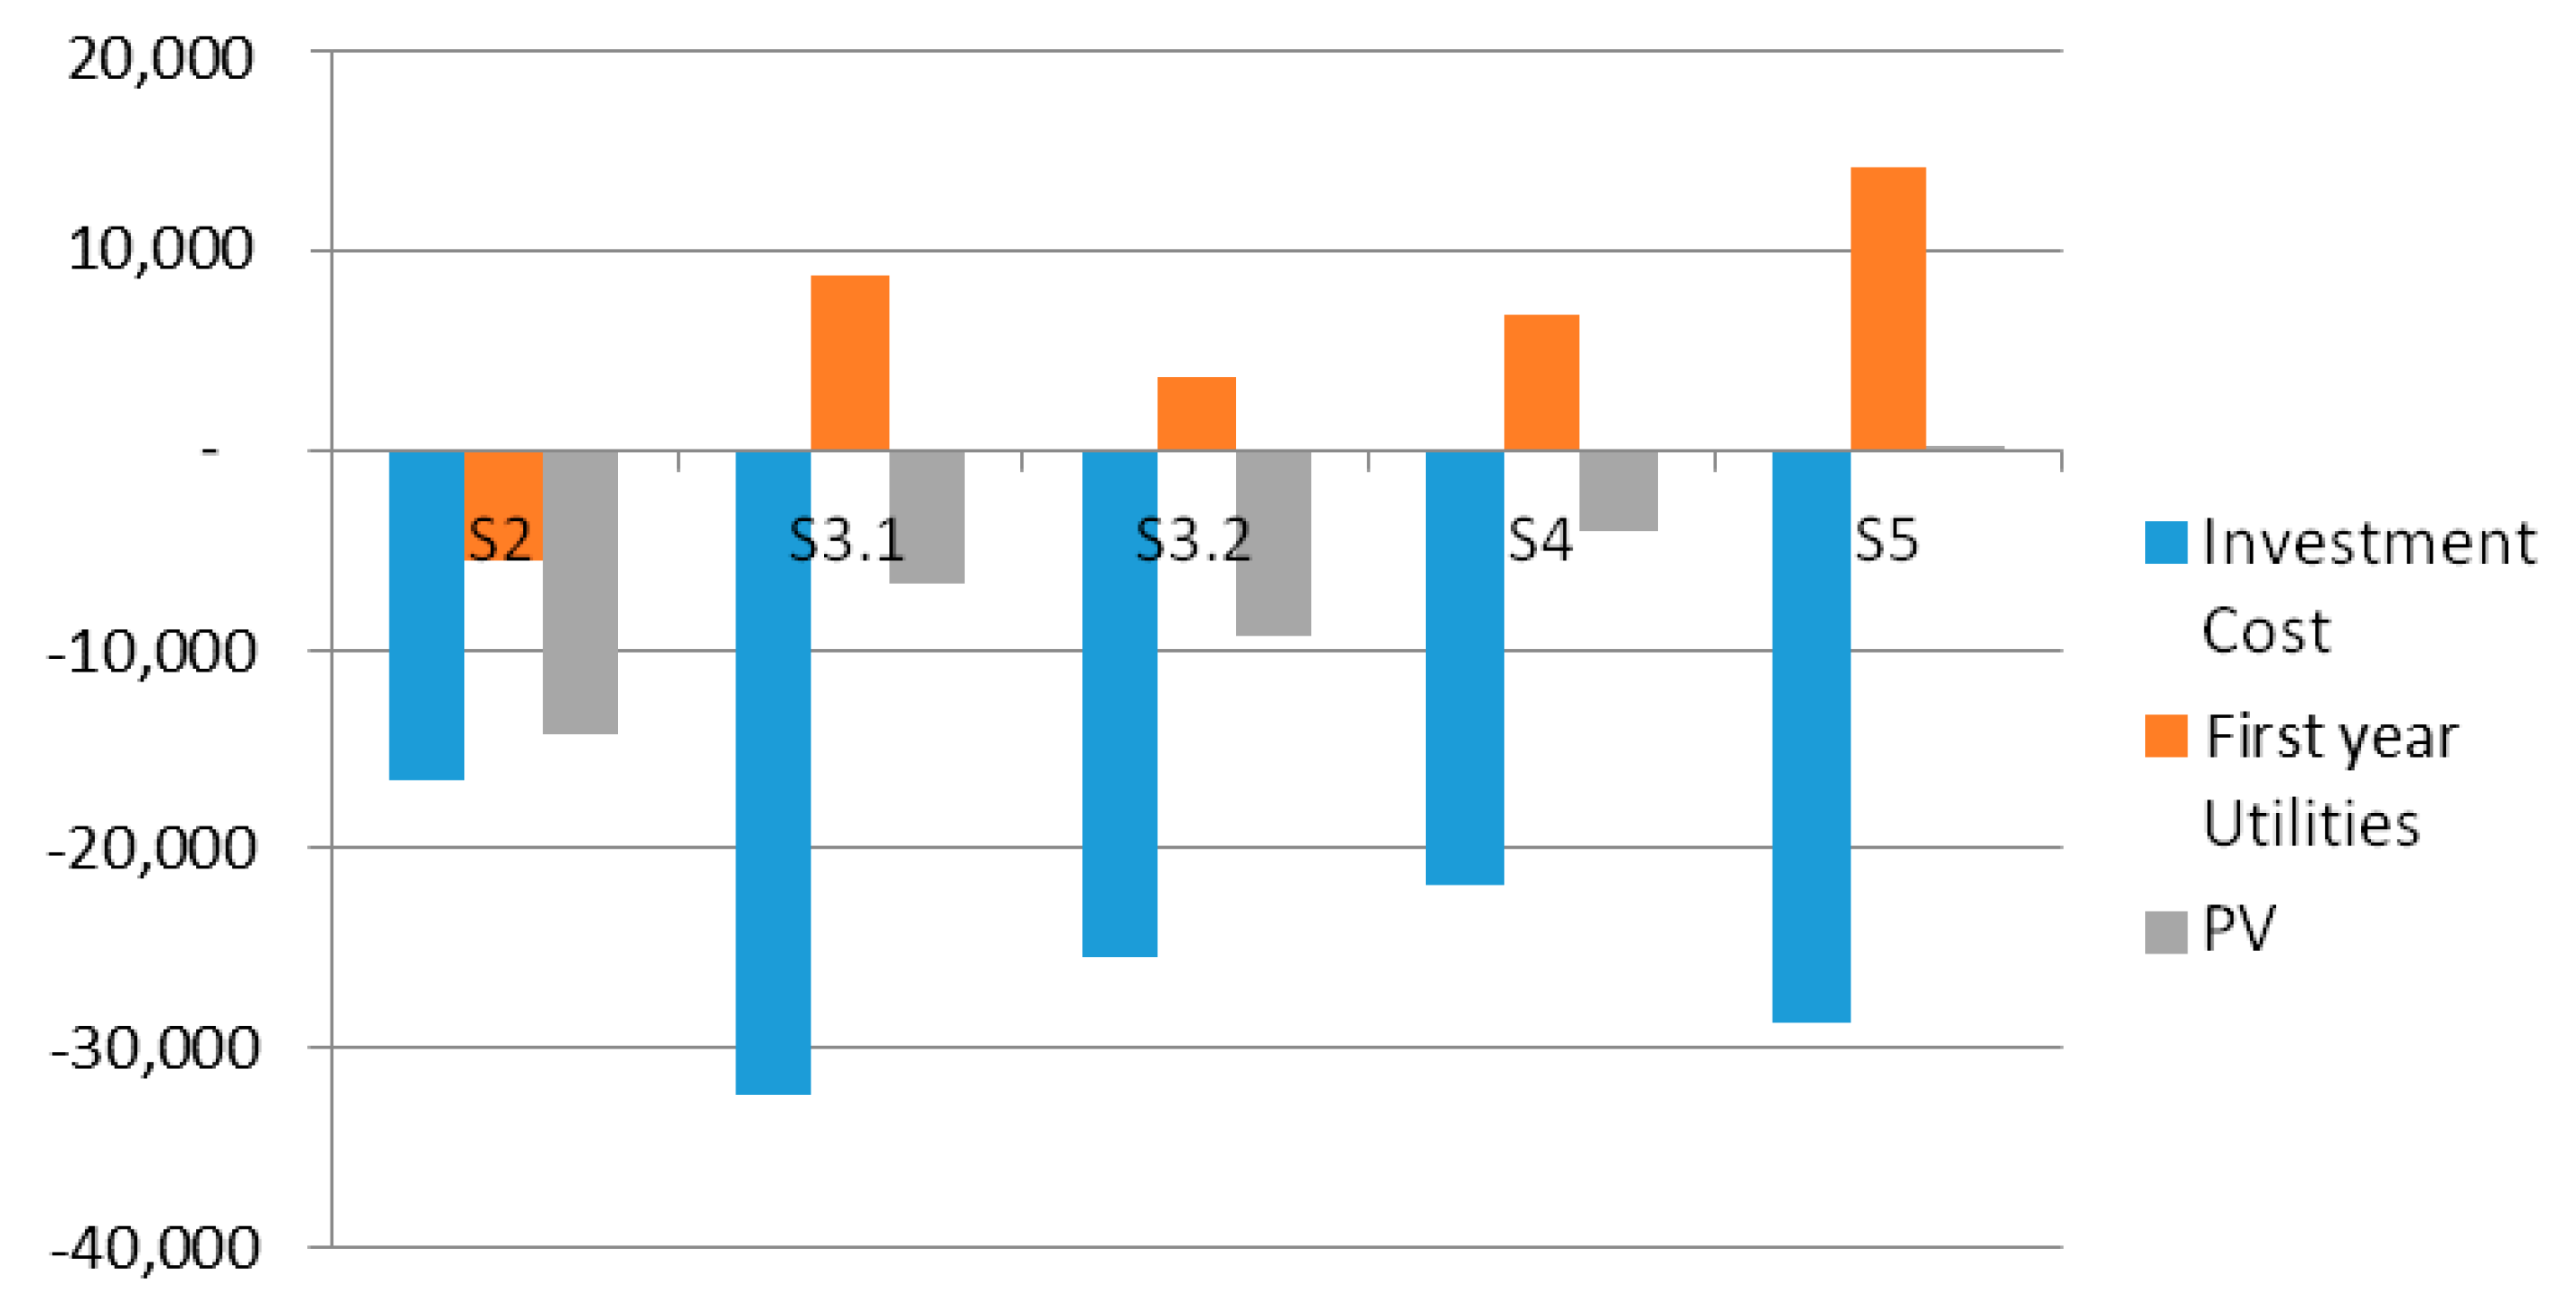
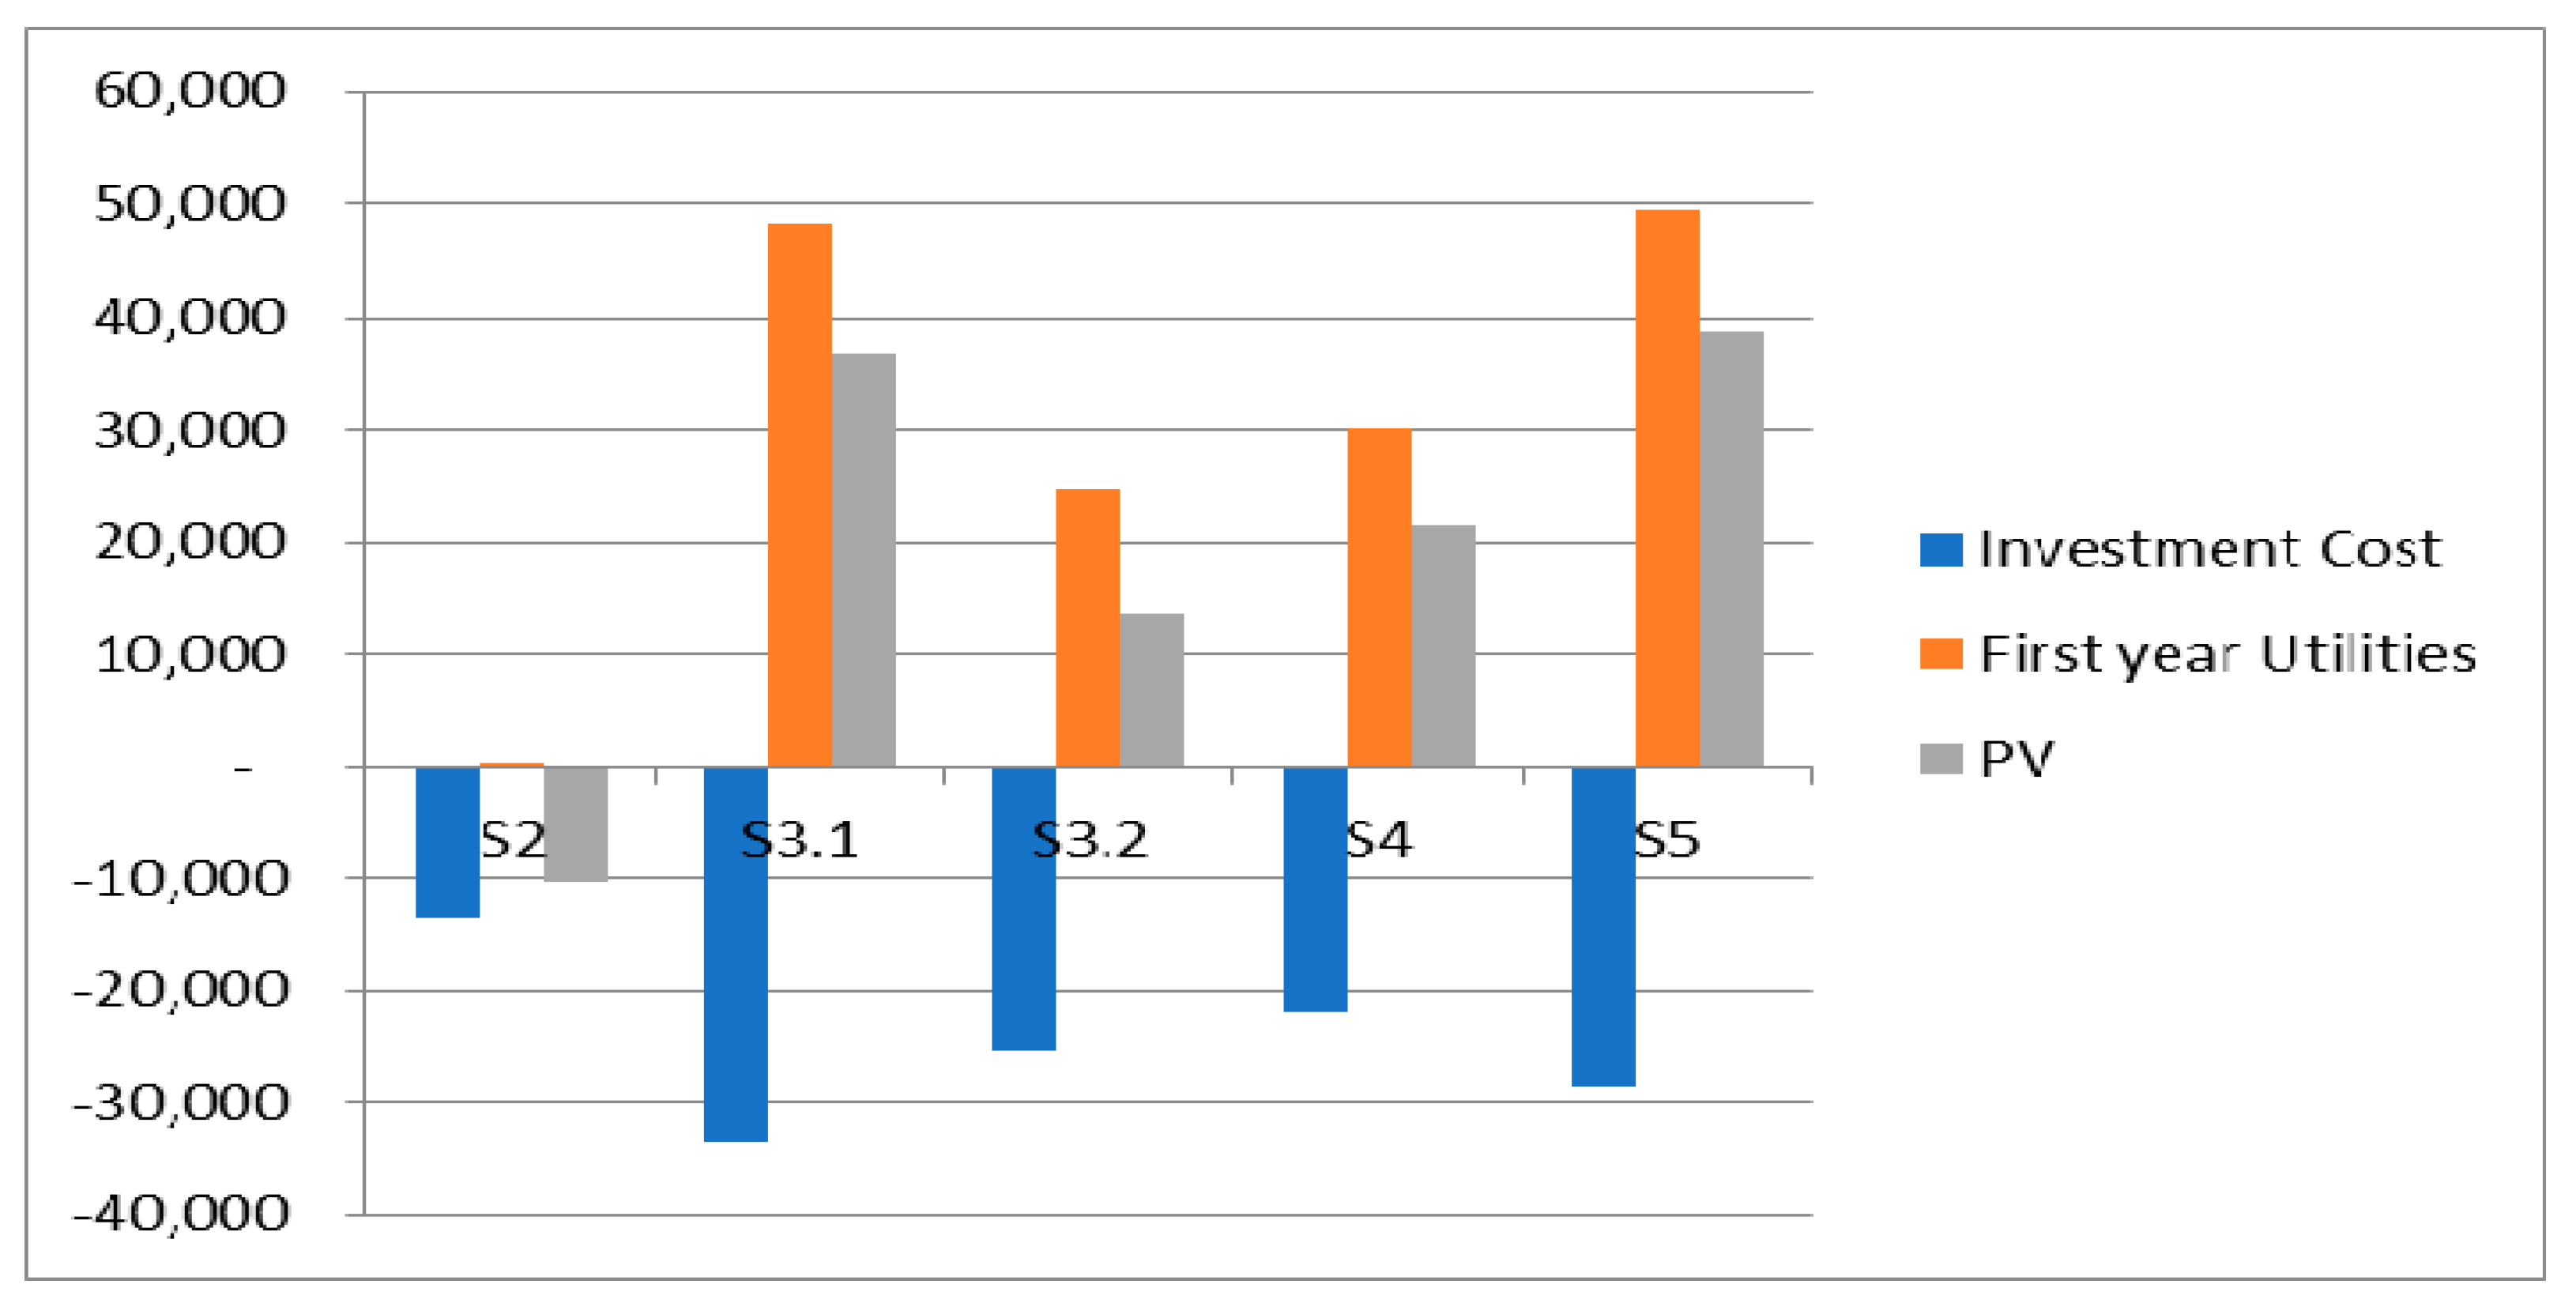
Regarding the utilities, as can be seen in Figure 10, except for S2, all the scenarios produce a positive Present Value (PV) after one year of operation because of the high income from selling the materials recovered by the formal sector (the sale of materials recovered by the informal sector and drop-off points are not considered in this analysis).
For the first year of operation, 10% of the sales will be considered as expenses. The facility operational costs, the savings in landfill costs and the landfill cost for the disposal of residual materials after collection are also considered.
Figure 10 shows how attractive the industry of recyclable materials is in terms of cost-effectiveness. This explains why the number of recovery companies has risen in recent years in Chile, from 33 companies in 2000 to 137 in 2009, an increase of 315% [16].
A good example of this is the experience of the municipality of Ñuñoa, which in 2003 installed an MRF station with an investment cost of approximately $233,000. This facility’s recovery of materials increased from 684 tons in 2003 to 2374 tons in 2011, earning $30,330 and $194,329, respectively, and recovering the investment after four years of operation ($272,883).
This study shows that, to reduce CO2eq emissions, municipalities do have to make an initial investment, but that investment can be recovered rapidly.
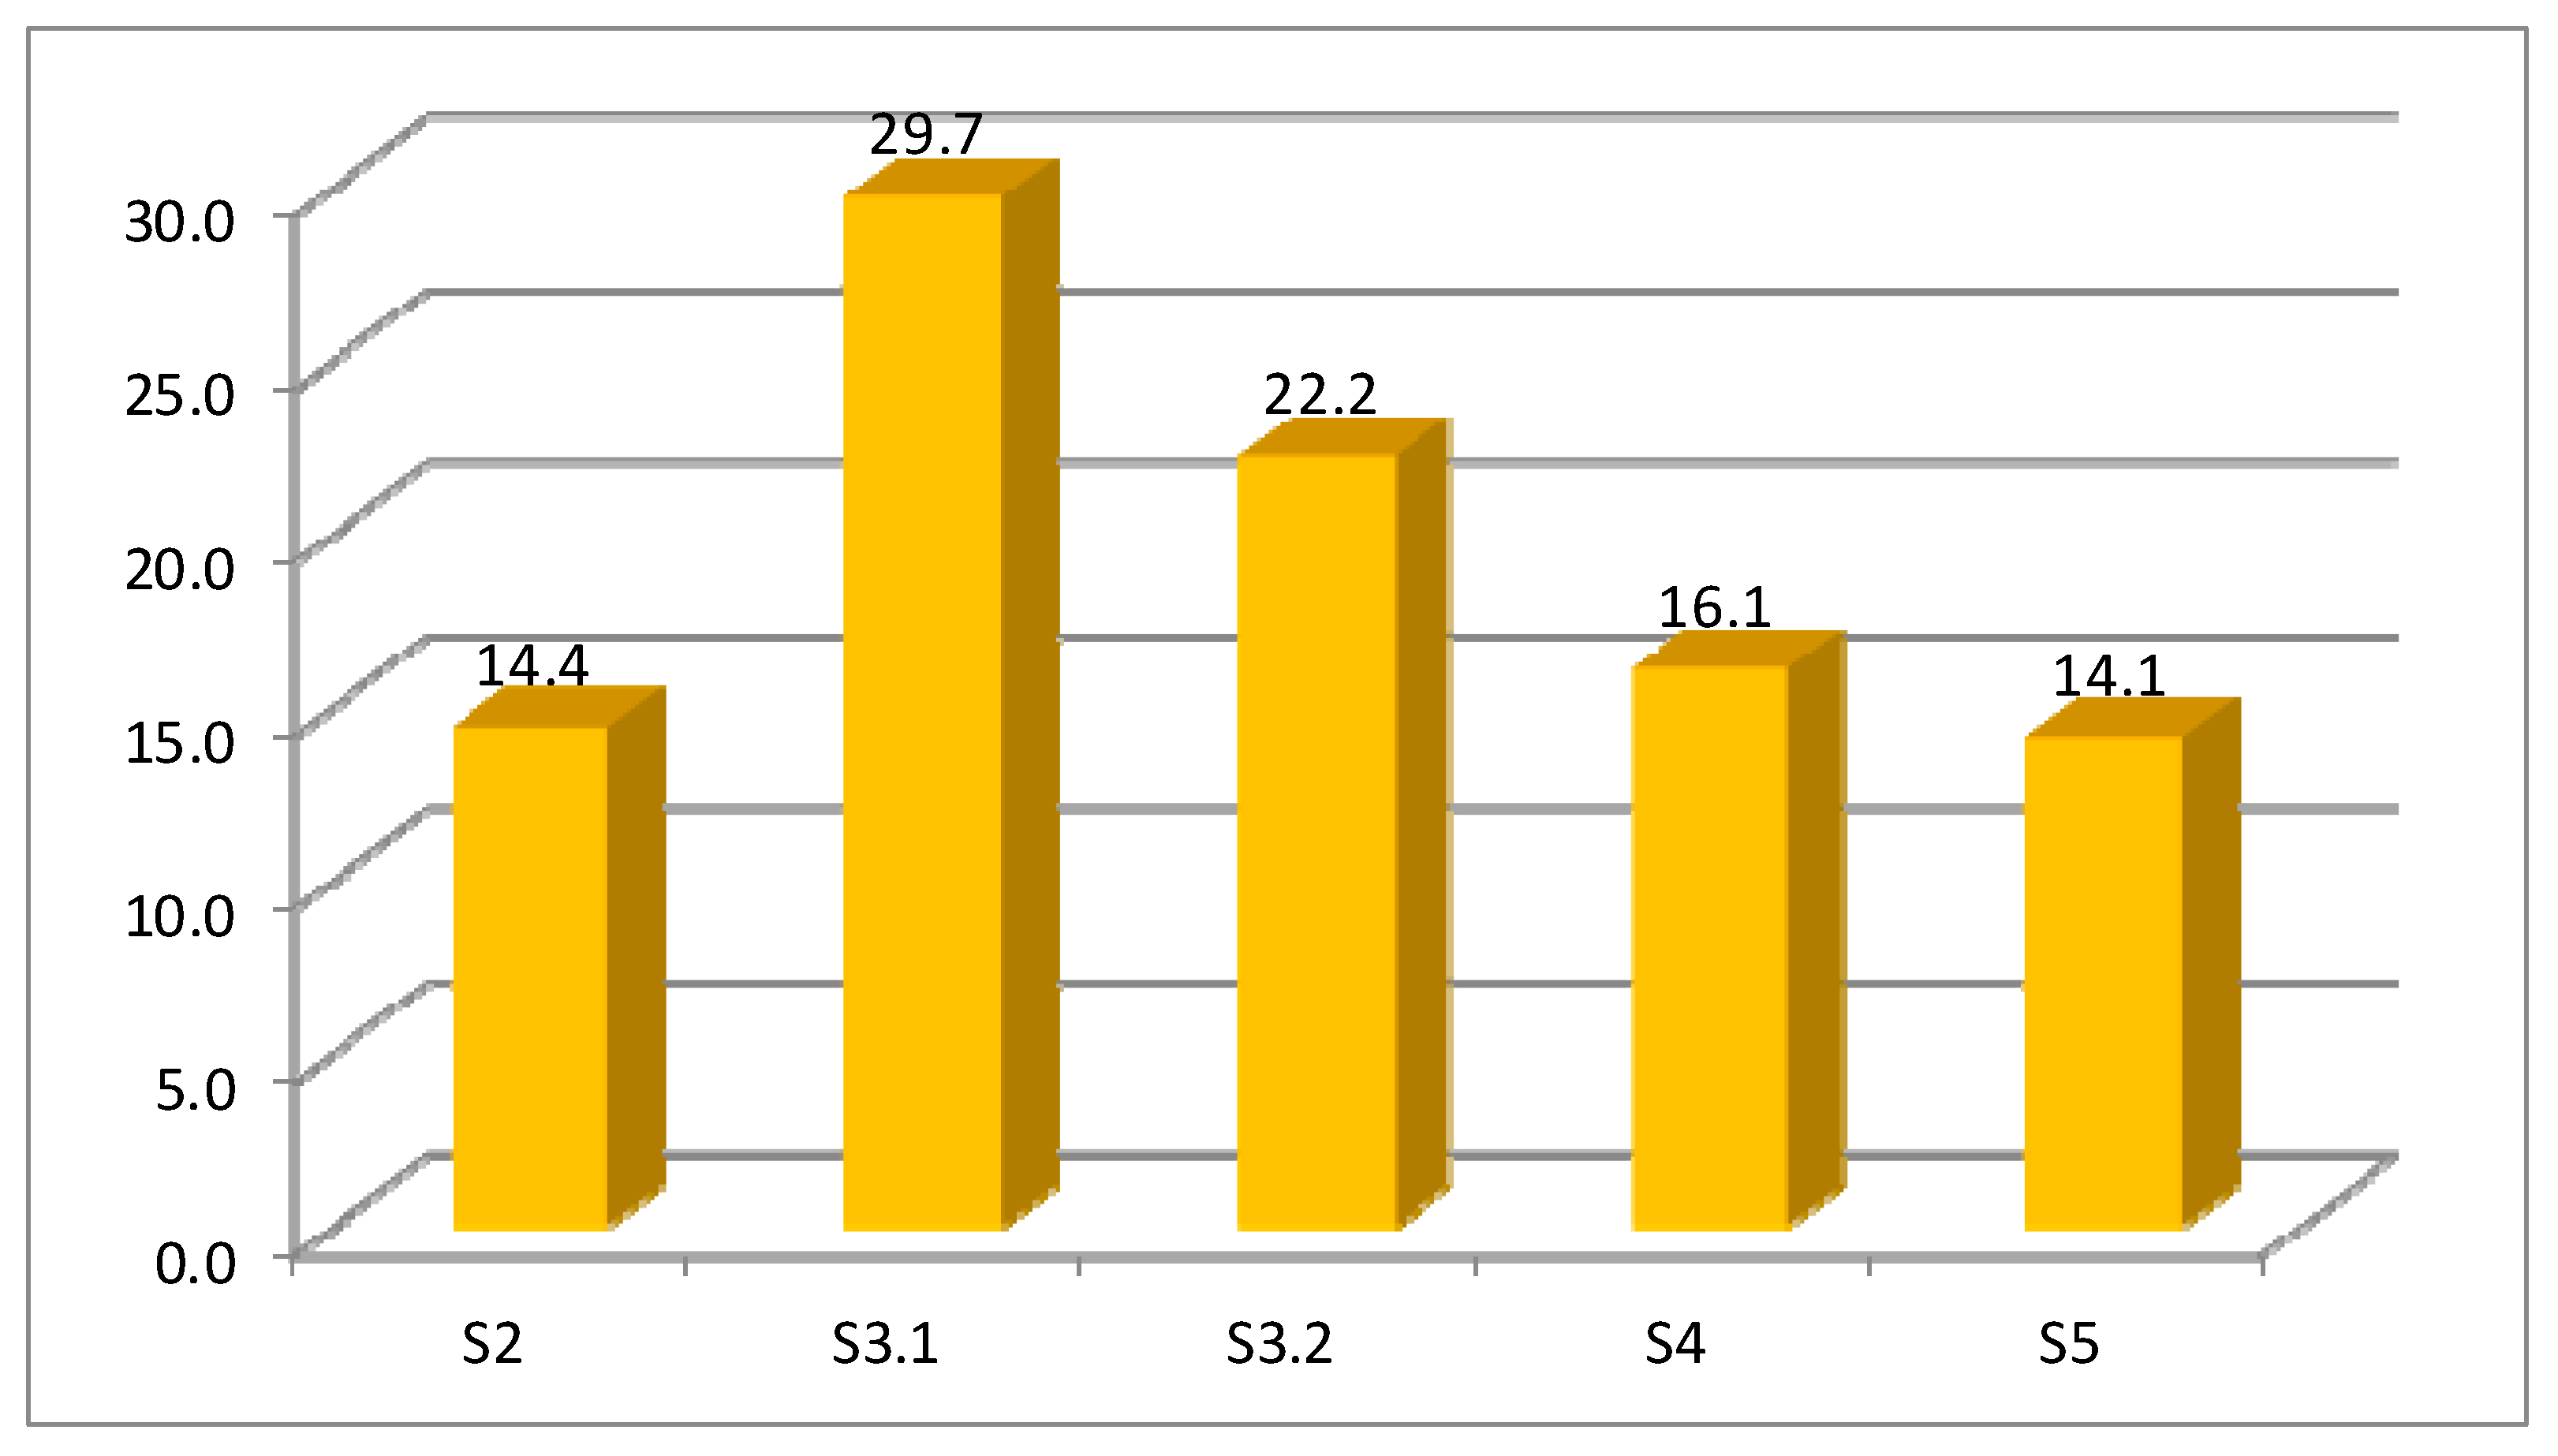
For scenarios 3 to 5, municipalities get revenues and achieve a reduction of CO2eq. In this case, the scenario that reduces CO2eq by the most, S5, is also the one that has the highest PV. Moreover, if we look at the ratio of investment cost and CO2eq reduced, shown in Figure 11, we see clearly that the lowest cost is also achieved by S5.
All scenarios have a lower CO2eq reduction cost than the $36 used by the United States Environmental Protection Agency (EPA) as CO2 social cost (a 3% discount rate for 2015). However, all scenarios have a higher cost compared to the California carbon trade price for 16 January 2016, with a value of $13.21 per ton of CO2eq, with S5 and S2 being the closest followed by S4.
However, as shown in point 4.1, S2 is not a feasible scenario. Therefore, S5 is selected for the continuation of the analysis.

4.5. Potential Benefits of Scenario 5

Regarding the social benefits, the informal recycling sector could provide between 4962 and 24,811 people with a source of steady income. This will have the positive effect of improving the poverty level, which is currently at 14.4% [39]. Moreover, approximately 708 new job positions could be created for the operation and maintenance of seven MRFs and 34 composting and vermiculture plants.
As for air emissions, since Santiago has been declared a PM2.5-saturated zone in recent years, PM reduction is very important. Scenario 5 diminishes 4262 tons/year of PM and is also the scenario with the highest reduction of GHG emissions, contributing a 3.5% GHG reduction emission at a national level [20].
Thanks to the energy savings associated with the recycling of paper, cardboard, plastics, and glass, companies can save, in total, approximately $1203 million.

4.6. Feasibility of Scenario 5 Implementation

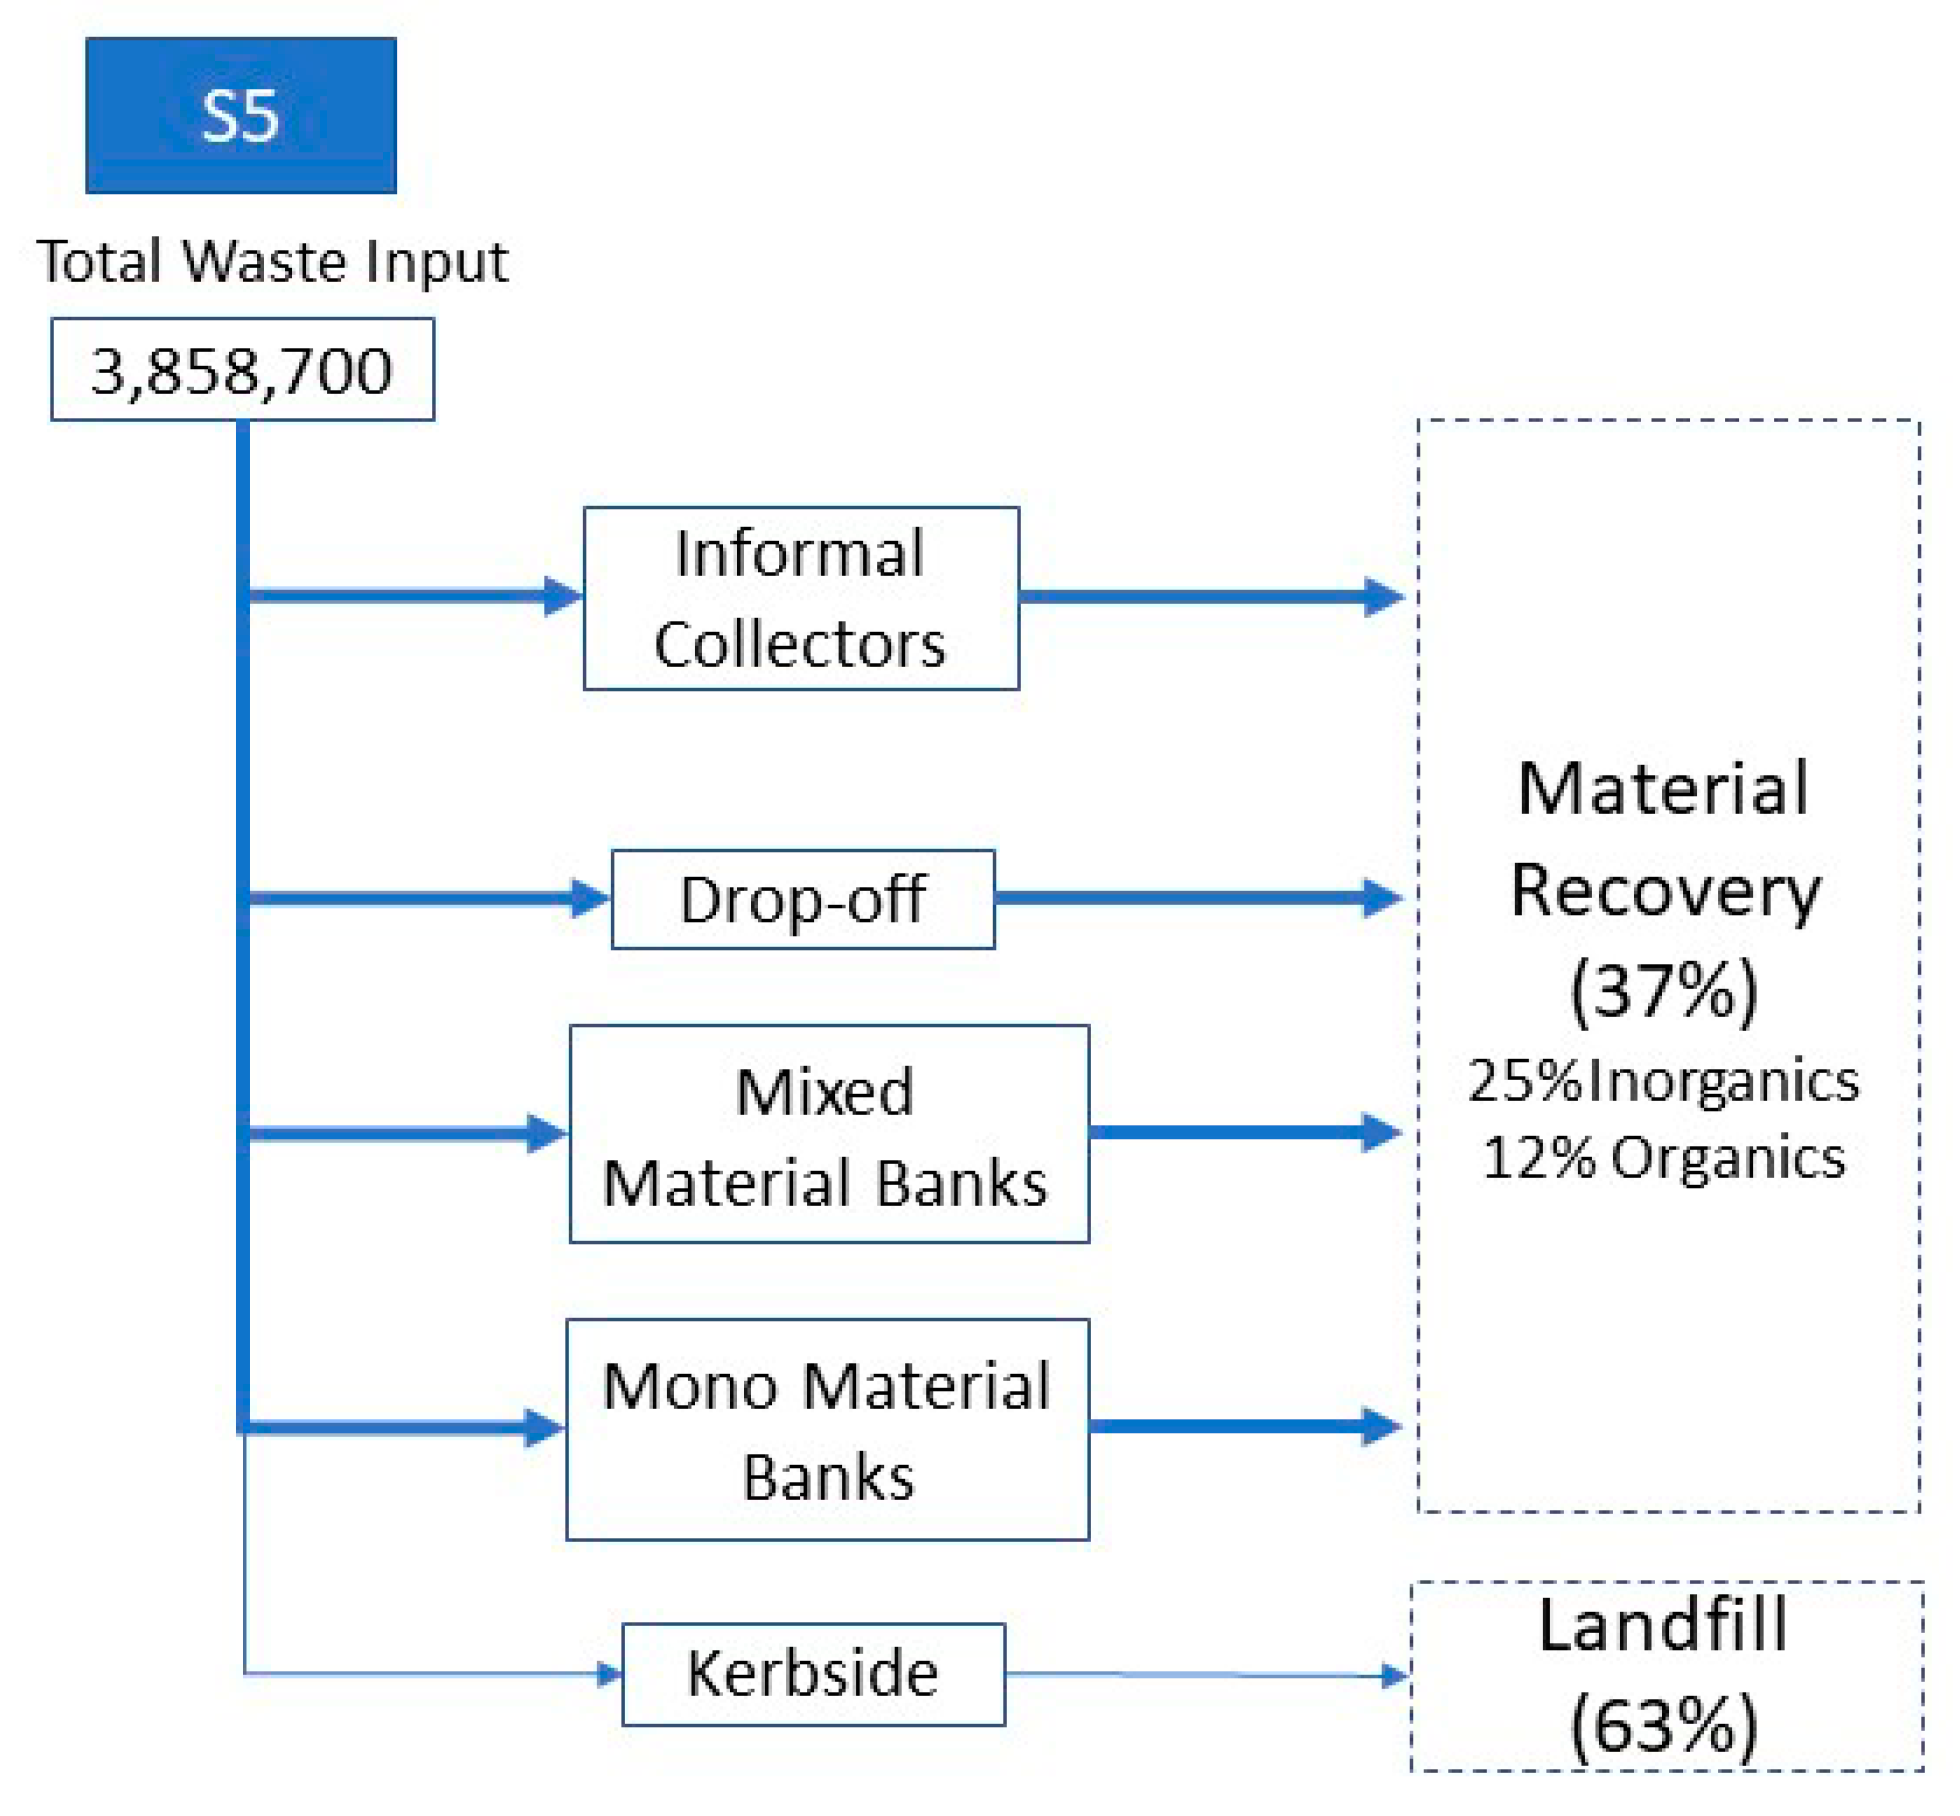
In order to achieve the recovery target of 37% of waste in S5, and considering the collection and treatment efficiencies (Table 3), it would be necessary to collect 44.9% of the generated recyclable waste, as shown in Table 8, which means that 17% of the collected waste will end up in landfill. In this scenario glass needs the highest collection ratio to because of its low treatment efficiency in MRF. The same occurs with paper and carboard. The informal sector has a high efficiency recovery for these two materials, however it is difficult to increase further their participation ratio because of the high amount of materials in total that they will need to collect in this scenario—40.1% of the total collected waste for recovery.

4.6.1. Mono Collection

According to the share of the two mono collection types and the mixed material bank collection (Table 5), the collection ratio for each method is 40.1% and 59.9% respectively.
One of the assumptions of this study is that in the mono collection the participation of the informal sector and the drop-off/clean points is 90% and 10%, respectively, for scenarios 3.2, 4 and 5. Hence, the informal sector will have to collect and treat, in S5, 595,465 tons of waste, which represents an approximate increase of 58% over the current situation. Therefore, if we consider that an informal collector recovers between 2 and 10 tons per month of recyclable materials [25], then between 4962 and 24,811 informal recyclers are necessary to reach the target. To achieve this, nine storage centers will be required, as shown in Table 9.
In addition, the drop-off and clean point centers will have to collect 66,163 tons of municipal solid waste, which represents an increase of 132% relative to the current situation. For that it will be necessary to install 84 drop-off and clean point stations, as also shown in Table 9.
The municipalities of Santiago and their surroundings, like the municipality of Independencia, have a high waste generation per capita rate because of the commercial and governmental activities in these districts. Hence these areas will be ideal candidates for the installation of storage facilities. This will allow informal collectors to transport waste using their carts, which is their most used method of transportation.
La Reina and Maipu are municipalities where there are informal collectors’ organizations, so these are also potential locations. La Pintana has already informed their community that they must give recyclable materials to the informal collectors, making it another potential location.

4.6.2. Formal Collection and Treatment of Inorganic Waste

This type of collection is provided by a municipality service. The formal collection sector will have to collect 575,100 tons of waste and take them to the MRF stations for treatment. This represents an extremely high increase compared to the current situation, where approximately 6000 tons are treated. Therefore, it is in this area where most of the investment is needed. Table 9 shows the number of facilities necessary to treat the huge amount of waste.
Since there are five treatment centers with a high capacity of 110,000 tons per year, these facilities must have easy access and be in an industrial zone because of the noise of the operations. The other two facilities, with 20,000 tons capacity, should be located in places separate from the previous five to achieve better coverage of Gran Santiago. In this case, the location sites should be in the eastern part of Gran Santiago.

4.6.3. Collection and Treatment of Organic Waste

The collection of organic waste is provided by a municipality service. Another assumption of this study is that 50% of the organic waste is going to be composted and the other 50% will go for vermiculture.
Table 9 also shows the number of plants required for organic waste treatment. Since there are 34 municipalities included in the study, one alternative for the siting of the plants would be that each district treats its own organic waste. This will motivate areas with low income to increase their green areas, using compost as fertilizer and therefore diminishing their maintenance costs. The second alternative is to concentrate the treatment in only some municipalities, for example by considering the district that have a high proportion of green areas. In this way it is also possible to concentrate efforts on information diffusion for vegetable separation and obtain higher levels of participation. It is important to consider that it might be inconvenient to have vermiculture or compost plants in municipalities with high population density and few green areas.

4.6.4. Governmental Recycling Target for 2020

Scenarios 3.1 and 5 have an inorganic material recovery target of 25%. When compared to other countries like Japan, which implemented its waste recycling initiatives in the 1990s [40], Chile is extremely underdeveloped, especially with regards to waste management regulations and the involvement of stakeholders. Moreover, Chile has just started to improve and coordinate national waste management systems after the establishment of the Ministry of the Environment in 2010. Before that, there were only two extraordinary cases of individual municipalities that improved their systems by setting their own goals and priorities since 2005 (La Pintana and Nuñoa).
The 3Rs concept (Reduce, Reuse, and Recycle) is still new in Chile and is not integrated in the waste management system. In May 2016 the government approved Law 20920, which establishes the framework for waste management, Extended Producer Responsibility (EPR), and promotes recycling [41]. However, it only mentions that municipalities should help companies recover their waste, without further regulations about its execution.
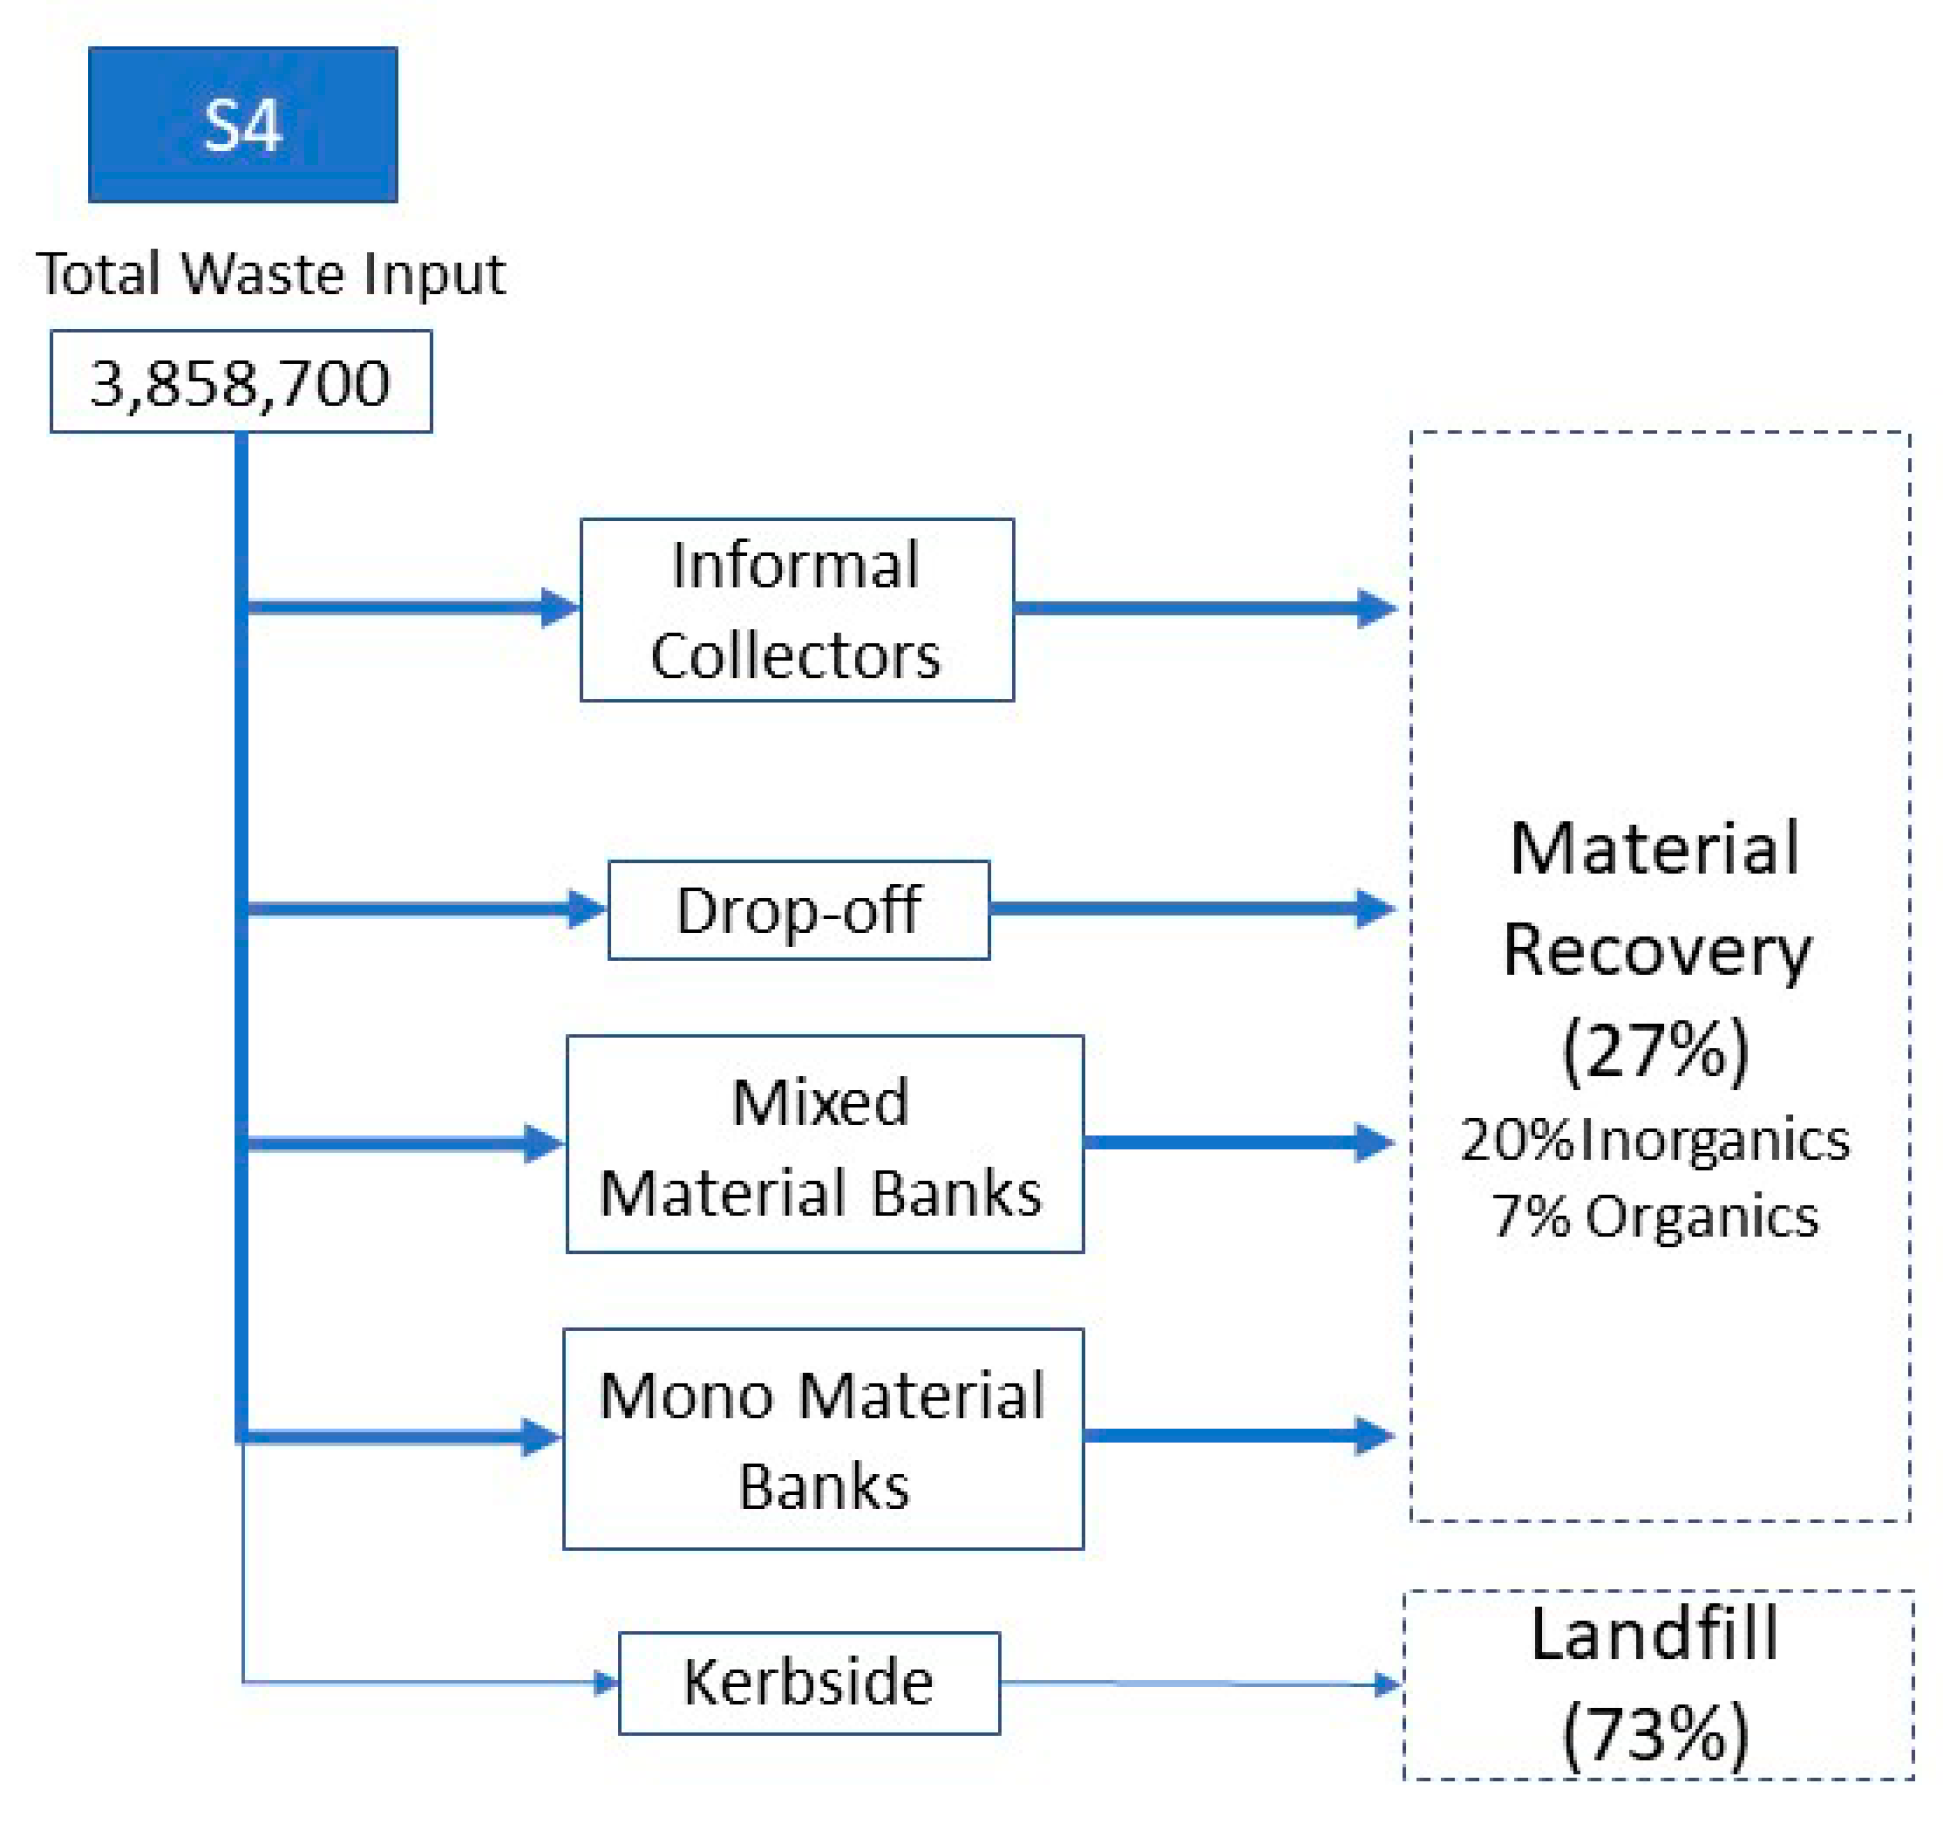
Observing the recovery ratios for different countries shown in Table 10, the Chilean target seems too optimistic—especially considering that there are only three years left to reach this target. In this sense, S4 is more feasible than S5.
Regarding composting, S5 involves a 12% recovery of waste for composting. This goal seems to be conservative in comparison to other countries. It is also based on a local composting expert municipality goal target; therefore, the organic recovery target can be considered feasible.

4.6.5. Amount of Material Collected or Sold (Sensitivity Analysis)

This analysis considers that the efficiency assumptions made for collection and treatment stages are not achieved as initially proposed in this study. There could be cases where the public participation is lower than expected, MRF treatment efficiency is low and/or lower capacity of the recycling companies. Under these conditions municipalities need to sell at least 34.25% of the total amount collected for recycling (Figure 12).
As for the other scenarios, the minimum % of the targeted recovered materials are 45.1%, 63.9%, and 45.8% for S3.1, S3.2, and S4, respectively. We can refer to this % as the efficiency of the system.

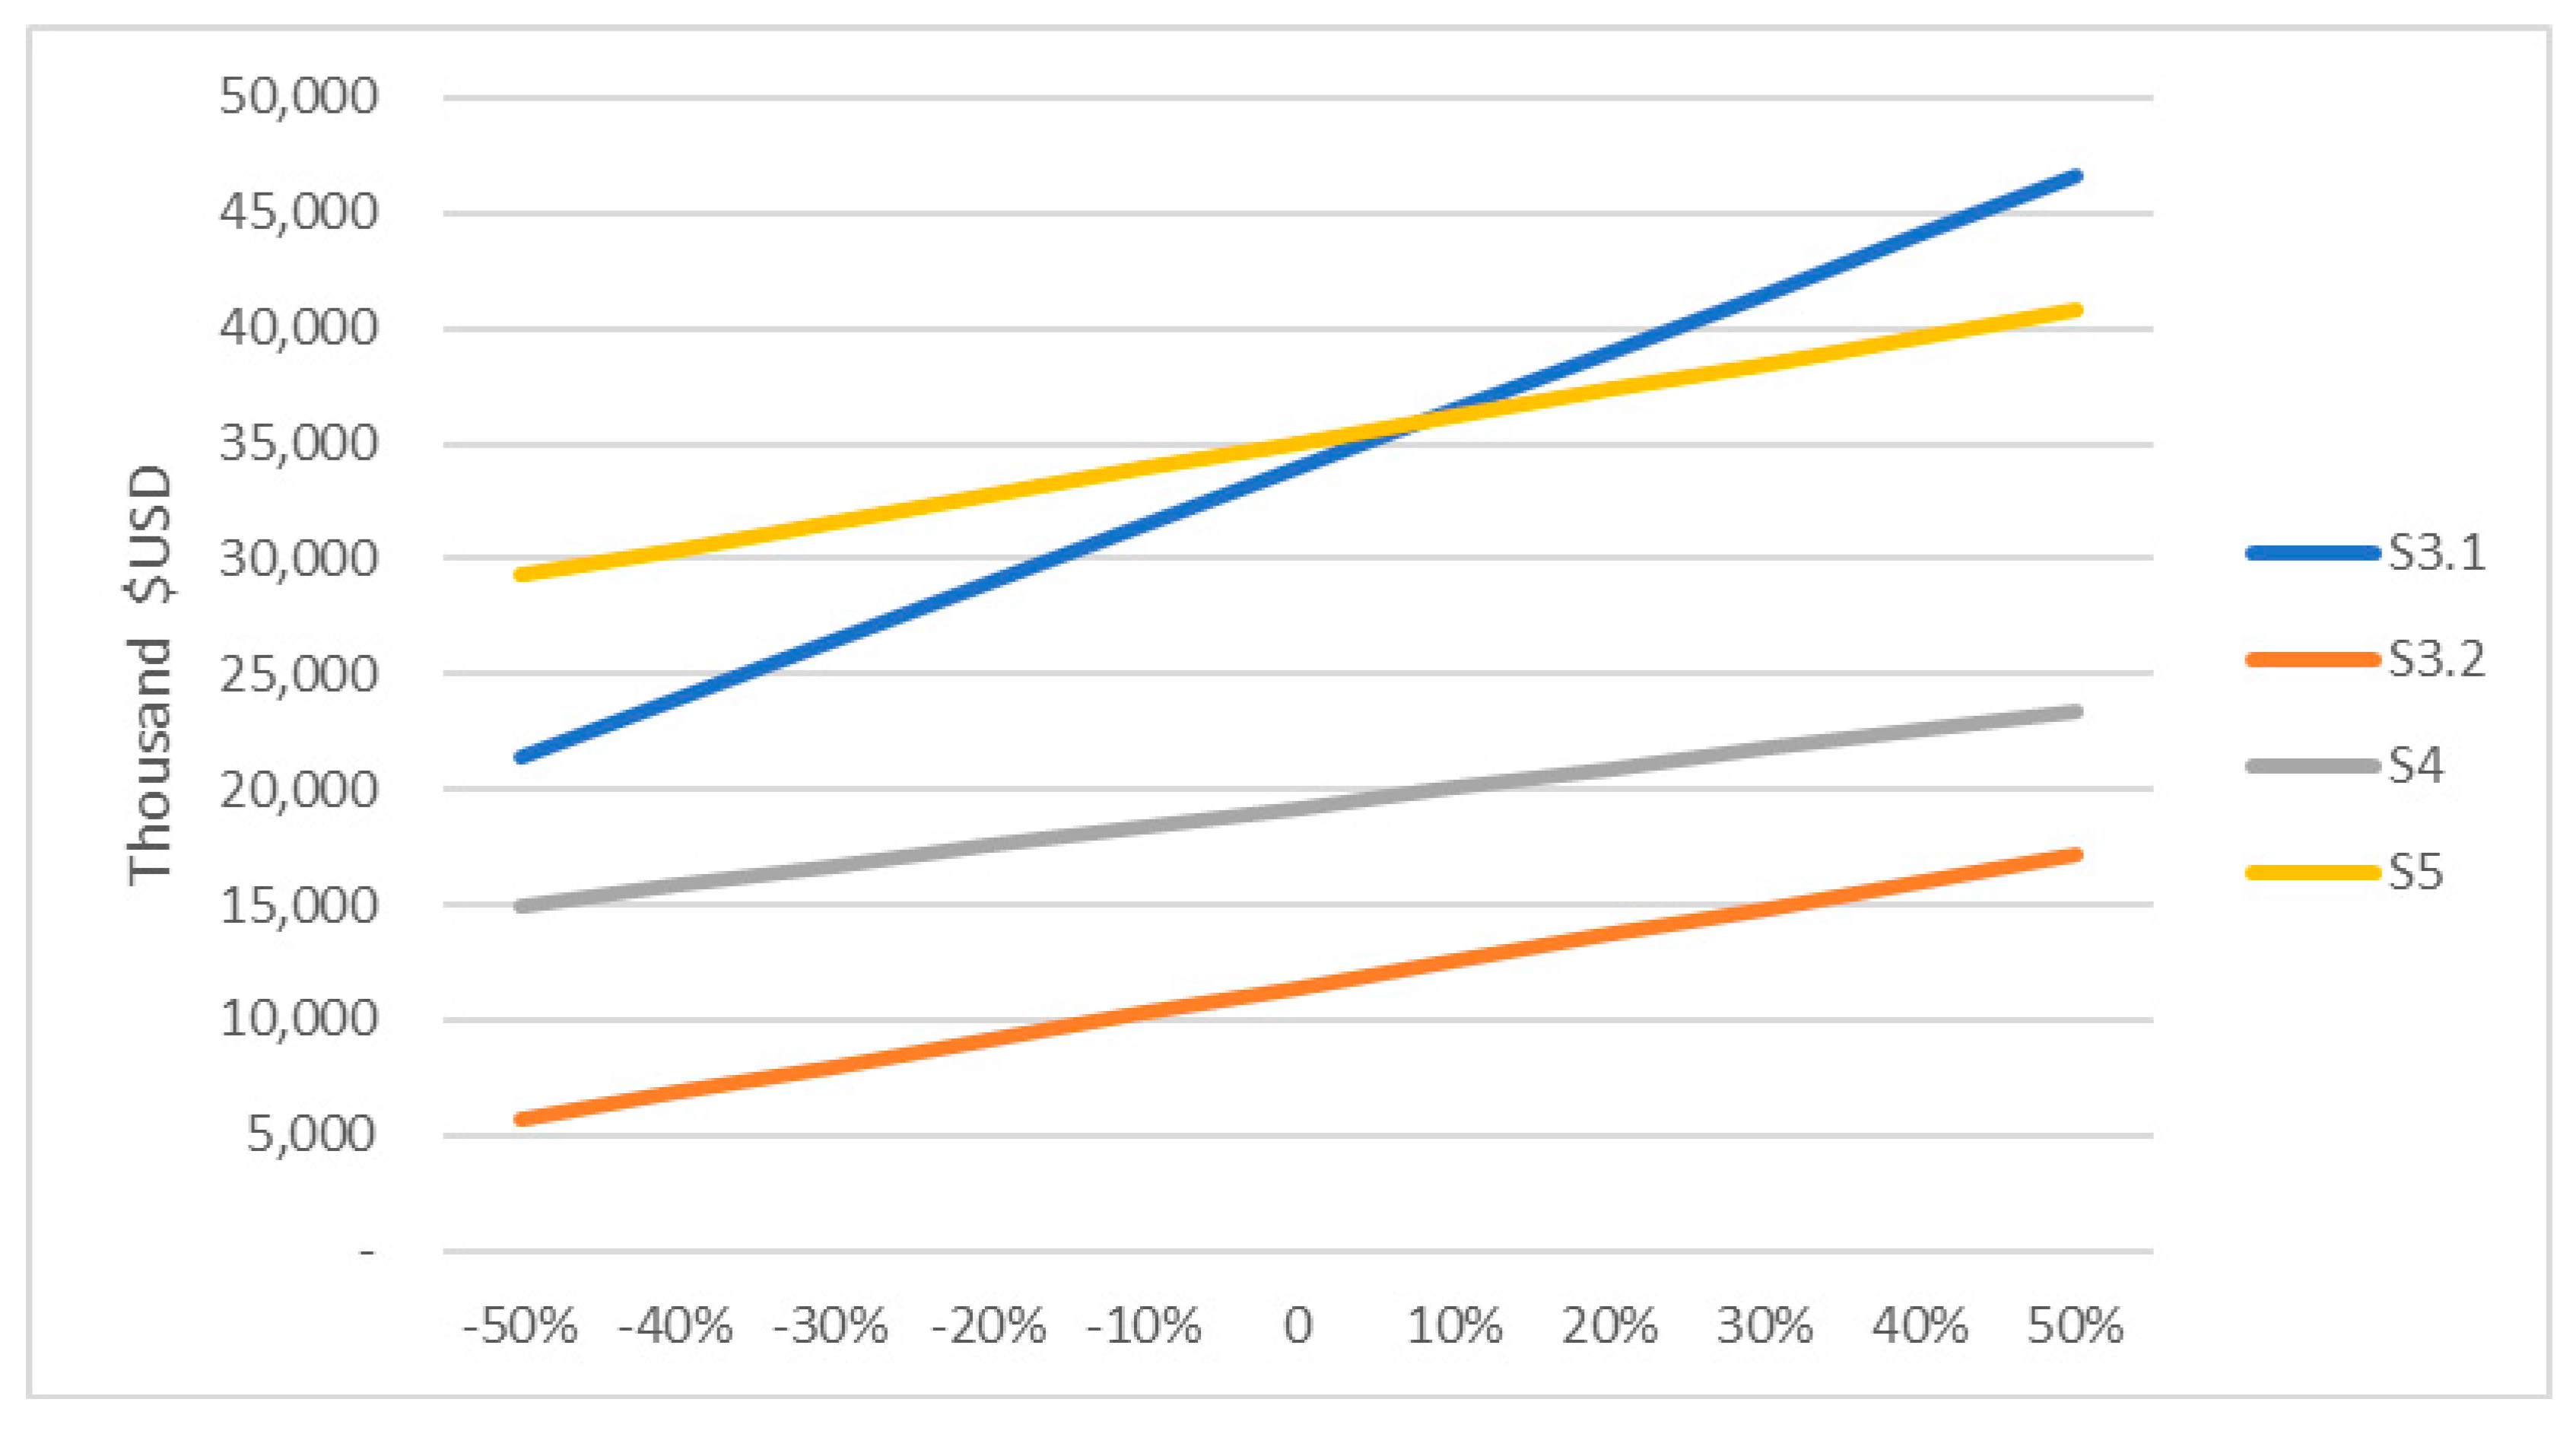
4.6.6. Price of Recovered Materials (Sensitive Analysis)

An increase in the supply of recyclable materials might cause a decrease in their price. There might also be an increase in the price of raw materials. Based on these assumptions, the study also conducted a sensitive analysis assuming up to 50% variation for paper, cardboard, plastic, and aluminum.
As shown in Figure 13, if the price of aluminums increase by 10–20%, then scenario 3.1 has a higher PV than all other scenarios because it is the most sensitive to price variations. The same happens with paper/cardboard and plastic.

5. Conclusions

This study proposes and evaluates the environmental impacts and feasibility of different alternatives for municipal solid waste collection, treatment, and recovery in Gran Santiago, Chile. In order to meet the government recycling targets, the study proposed scenarios that range from the current situation to the introduction of organic waste recovery and the inclusion of informal recyclers in the collection process.
The results show that 20% inorganic material recovery cannot be achieved by continuing the government focus on improving the drop-off collection system. It is not a feasible option because of the overwhelming number of stations necessary to reach the target and the difficulties in managing this type of station. Therefore, it is mandatory to improve other collection methods, specifically the informal sector. This point is confirmed with the comparison between S3.1 and S3.2, where the informal sector improves the overall collection ratio; because of its high paper and glass recovery efficiency, it can help reach the target with lower plastic recovery ratio. Including informal collectors in the waste collection process will also significantly reduce collection and treatment costs. Hence, for the system to work effectively it is imperative to improve communications between municipalities, informal recyclers, and communities.
As expected, the scenario with the highest recovery of inorganic and organic materials and the commitment of the informal collectors has the highest positive impact, not only in terms of meeting and surpassing the government goal, but also in the reduction of CO2eq emission. S5 can reduce the national CO2eq generated by approximately 3.5%, at a cost of $14.1/ton. Moreover, the potential reduction of CH4 accounts for 8.5% of total national CH4 emissions and 24.5% of the national waste sector.
Currently, the government recycling targets do not take into consideration organic materials, which account for 48% approximately of the total waste stream. This study demonstrated that promoting organic waste recovery could have both environmental and economic benefits. In this sense, composting is a feasible alternative. This is demonstrated when comparing scenarios S3.2 and S5, where the only difference is the organic recovery in the latter scenario, but the reduction of 1 ton of CO2eq is 4 times cheaper in S5.
Although this study’s objective was to identify the most effective systems in terms of avoided pollutants per cost ratio, when comparing the inorganic material target of the best scenario, S5, with the recycling ratios from previous years in different countries like Japan, Chile’s 2020 target seems too optimistic—especially considering that there are only three years left to reach this target. Therefore, although S5 is the best scenario according to the objectives of this study, when considering the feasibility and challenges of the system’s execution, the scenario recommended is S4.
Due to the lack of data, this study had to make some assumptions. Future studies must consider land costs and people’s participation to determine a more accurate economic assessment.

Author Contributions

Ailyn Rojas C. conceived and designed the study. Ailyn Rojas C. and Helmut Yabar conducted the research analysis, evaluation and wrote the paper. The four authors discussed results and summarized the conclusion.

Conflicts of Interest

The authors declare no conflict of interest.

References

  1. Daniel Hoornweg, P.B.-T. What a Waste—A Global Review of Solid Waste Management; World Bank: Washington, DC, USA, 2012. [Google Scholar]
  2. Rachel, E.; Marshall, K.F. Systems approaches to integrated solid waste management in developing countries. Waste Manag. 2013, 33, 988–1003. [Google Scholar]
  3. World Bank. World Bank Latin American and The Caribbean. Available online: https://data.worldbank.org/region/latin-america-and-caribbean (accessed on 30 October 2017).
  4. UN-HABITAT. Towards a New Urban Transition; UN-HABITAT: Nairobi, Kenya, 2012. [Google Scholar]
  5. Hoornweg, N.D. Managing Municipal Solid Waste in Latin America and the Caribbean: Integrating the Private Sector, Harnessing Incentives; Latin America and the Caribbean; World Bank: Washington, DC, USA, 2007. [Google Scholar]
  6. Javier Grau, H.T. Solid Waste Management un Latin America and the Caribbean; IDB: Washington, DC, USA, 2015. [Google Scholar]
  7. Zohoori, M.; Ghani, A. Municipal solid waste management chalenges and problems for cities in low-income and developing countries. Int. J. Sci. Eng. Appl. 2017, 6. [Google Scholar] [CrossRef]
  8. Evelyn, M.A.; Daza, D.; Tello Espinoza, P.; Soulier Faure, M.; Terraza, H. Regional Evaluation on Urban Solid Waste Managemetn in Latin America and The Caribbean; AIDIS, BID, Pan American Health Organization: Washington, DC, USA, 2010. [Google Scholar]
  9. Medina, M. Community-Based Recycling Initiatives. Grassroots Dev. 2008. Available online: https://www.iaf.gov/resources/publications/grassroots-development-journal/2008-enterprise-at-the-grassroots/community-based-recycling-initiatives (accessed on 29 October 2017).
  10. ABRELPE. Panorama dos Residuos Solidos No Brasil; ABRELPE: Sao Paulo, Brazil, 2015. [Google Scholar]
  11. Terraza, H.; Sturzenegger, G. Dinamicas de Organizacion de los Recicladores Informales; Banco Interamericano de Desarrollo (BID): Washingdon, DC, USA, 2010. (In Spanish) [Google Scholar]
  12. Frietag, V. Deutsche Welle. Dossiers, Reciclado de Desperdicios. Available online: http://www.dw.com/es/la-gesti%C3%B3n-de-residuos-en-am%C3%A9rica-latina-hacia-un-modelo-europeo/a-3656859 (accessed on 16 October 2016).
  13. World Bank. GDP per Capita, PPP (Current International $) Retrieved from World Bank Data. Available online: https://data.worldbank.org/indicator/NY.GDP.PCAP.PP.CD?end=2016&locations=ZJ-CL&start=1990 (accessed on 30 October 2017).
  14. World Bank. Retrieved from World Bank Country. 2017. Available online: http://www.worldbank.org/en/country/chile (accessed on 30 April 2017).
  15. OECD/ECLAC. OECD Environmental Performance Reviews; OECD Publishing: Paris, France, 2016. [Google Scholar]
  16. Conselho Nacional do Meio Ambirnte (CONAMA). First Report of Solid Waste Management in Chile; CONAMA: Santiago, Chile, 2010.
  17. Ministry of Environment (MMA). Biblioteca del Congreso Nacional. Retrieved from Ministerio del Medio Ambiente-Residuos. Available online: https://www.leychile.cl/Consulta/listaMasSolicitadasxnum?agr=1020&sub=501&tipCat=1 (accessed on 30 October 2017).
  18. Ministry of Environment. Waste Report; Ministry of Environment: Santiago, Chile, 2011; Chapter 3. [Google Scholar]
  19. SESMA. Seremi Ministerio de Salud. Obtenido de Información General Relativa a Residuos Domicilarios. Available online: http://www.seremisaludrm.cl/sitio/download/residuos/antecgeralresiduosd.pdf (accessed on 28 October 2017).
  20. Mnistry of Environment (MMA). Chiles Second Biennal Update Report, to the United Framework Convwntion on Climate Change; MMA: Santiago, Chile, 2016. [Google Scholar]
  21. Oscar, C.; Vasquez, A.A. Towards the Estimation of Demand for Recycling in Chile: The Case of Santiago. Resour. Conserv. Recycl. 2013, 82, 94–102. [Google Scholar]
  22. Pontificia Universidad Católica. Estudio Caracterización de Residuos Sólidos Domiciliarios en la Region Metropolitana; UCV: Valparaíso, Chile, 2006. [Google Scholar]
  23. Ingenieria Alemana S.A. Environmental, Social and Economical Tecnical Feasibility Study for Implementation of the Action Plan Santiago Recycles; Ingeniería Alemana S.A.: Santiago, Chile, 2011. [Google Scholar]
  24. Conama, R.M. Estrategia de Reciclaje de Residuos Solidos Domiciliarios de la Region Metropolitana; CONAMA: Santiago, Chile, 2005.
  25. AVINA. Politicas Publicas Para la Inclusion de los Recicladores de Base al Sistema de Gestion de Residuos Municipales en Chile; AVINA: Santiago, Chile, 2013. (In Galician) [Google Scholar]
  26. Vitacura Municipality. Vitacura Municipality. Retrieved from Vitacura Municipality, Descargas. Available online: https://www.vitacura.cl/resources/descargas/pdf/scam/Informe%20reciclaje.pdf (accessed on 30 August 2017).
  27. Brautigam, K.-R.; Gonzalez, G. Evaluation of Municipal Solid Waste Management in Santiago de Chile Regarding Sustainability. In Proceedings of the International Solid Waste Association-World Congress, Hamburg, Germany, 15–18 October 2010. [Google Scholar]
  28. Giugliano, M.; Cernuschi, S.; Grosso, M.; Rigamonti, L. Material and energy recovery in integrated waste management systems. An evaluation based on life cycle assessment. Waste Manag. 2011, 31, 2092–2101. [Google Scholar] [CrossRef] [PubMed]
  29. Sergio Garcia, K.D.M. Slide Share. From Slide Share-Emprendoverde. Available online: https://www.slideshare.net/emprendoverde/reciclaje-kdm-lomas-del-colorado-santiago-de-chile (accessed on 30 September 2012).
  30. Mun. Nuñoa. Programa de Reciclaje 2003=2013; Mun. Nuñoa: Santiago, Chile, 2012. [Google Scholar]
  31. DIGA. DIreccion de Gestion Ambiental. From Zona de Descargas y Transparencia. Available online: http://www.digap.cl/wpress/?page_id=733 (accessed on 28 July 2014).
  32. Ecoing. Evaluacion de Impactos Economicos, Ambientales y Sociales de la Implementacion de la Responsabilidad Extendida del Productor en Chile; MMA: Santiago, Chile, 2012. (In Spanish) [Google Scholar]
  33. Clean Air Institute. Metodologias Para la Estimacion de Emisiones de Transporte Urbano de Carga y Guias Para la Recopilacion y Organizacion de Datos; Clear Air Institute: Washington, DC, USA, 2013. [Google Scholar]
  34. Sericio de Impuestos Internos. From Sevicio Impuesto Interno, UF Valores. Available online: http://www.sii.cl/pagina/valores/uf/uf2015.htm (accessed on 30 July 2014).
  35. MAPS Chile. Proyecto MAPS Chile, Escenarios de Mitigacion de Gases de Efecto Invernadero; MAPS: Santiago, Chile, 2014. [Google Scholar]
  36. Hisao Ida, O.S. Plastic Waste Management in Japan. In Proceedings of the International Symposium on Feedstock Recycling of Polymeric Materials, New Delhi, India, 23–26 October 2013. [Google Scholar]
  37. The Council for PET Bottle Recycling Japan. The Council for PET Bottle Recycling. Retrieved from the Council for PET Bottle Recycling Reports. Available online: http://www.petbottle-rec.gr.jp/english/pdf/reports/5_3R.pdf (accessed on 30 December 2017).
  38. Ministry of Environment (MMA). Report of Climate Change; MMA: Santiago, Chile, 2011. [Google Scholar]
  39. World Bank. World Bank. Retrieved from Data World Bank. 2017. Available online: https://data.worldbank.org/indicator/SI.POV.NAHC?locations=CL (accessed on 30 August 2017).
  40. Ministry of Environment. History and Current State of Waste Management in Japan; Ministry of Environment: Tokyo, Japan, 2014. [Google Scholar]
  41. Biblioteca del Congreso Nacional. Biblioteca del Congreso Nacional. Retrieved from Ley 20920. Available online: https://www.leychile.cl/Navegar?idNorma=1090894 (accessed on 30 January 2017).
  42. Yolin, C. Waste Management and Recycling in Japan Oportunities for European Companies (SMEs Focus); EU-Japan Center for Industrial Cooperation: Tokyo, Japan, 2015. [Google Scholar]
  43. Eurostat newsrelease. Envieonment in the EU. Available online: http://ec.europa.eu/eurostat/documents/2995521/6757479/8-26032015-AP-EN.pdf/a2982b86-9d56-401c-8443-ec5b08e543cc (accessed on 30 December 2017).
  44. EPA. Advancing Sustainable Manterials Management: Facts and Figures. Available online: https://www.epa.gov/smm/advancing-sustainable-materials-management-facts-and-figures (accessed on 30 December 2012).
Figure 1. Map of the continental area of Chile and the waste generation and disposal sites in the metropolitan region, 2009. Data source: [16].
Resources 07 00018 g001
Figure 2. Waste flow in Santiago for 2017 (tons/year), Scenario 1.
Resources 07 00018 g002
Figure 3. Scenario 2 (S2).
Resources 07 00018 g003
Figure 4. Scenario 3.1 and 3.2 (S3.1 and S3.2).
Resources 07 00018 g004
Figure 5. Scenario 4 (S4).
Resources 07 00018 g005
Figure 6. Scenario 5 (S5).
Resources 07 00018 g006
Figure 7. Information flow.
Resources 07 00018 g007
Figure 8. Air pollutant emissions and reductions (tons/year).
Resources 07 00018 g008
Figure 9. Global warming potential (tons/year).
Resources 07 00018 g009
Figure 10. Cost/income balance (USD).
Resources 07 00018 g010
Figure 11. Initial investment cost to reduce an additional ton of CO2eq compared to S1 (USD).
Resources 07 00018 g011
Figure 12. Cost/income analysis if 34.63% of materials sell (Thousand USD).
Resources 07 00018 g012
Figure 13. Sensitivity to variation of aluminum.
Resources 07 00018 g013
Table 1. Treatment efficiencies for each material.
MaterialsEfficiency of Mono CollectionMRF KDMCompost and Vermiculture
Paper and Cardboard95.5%50%
Plastics90.0%80%
Metals92.5%90%
Glass94.2%20%
Kitchen 100%
Garden 100%
Tetra packs95.0%80%
Others90.0%
Data source: [28,29].
Table 2. Santiago waste generation composition and actual recovery rates per material, 2017.
MaterialsWaste CompositionActual Recovery (S1)
%Ton/Year%Tons/Year
Paper and Cardboard16%616,03037.0%227,931
Plastics13%489,8305.0%24,492
Metals7%283,71233.0%93,625
Glass6%219,71710.0%21,972
Kitchen33%1,291,7850.8%10,000
Garden9%355,2530.8%2960
Tetra packs1%22,2460.1%22
Others15%580,1857.0%40,613
Total100%3,858,75910.93%421,615
Data source: [21,22,29] and own elaboration.
Table 3. Recovery ratios for each material and scenario.
MaterialsRatios Recoveries
S2S3.1S3.2S4S5
Paper and Cardboard60.5%59.0%67.0%60.5%67.0%
Plastics20.4%38.8%34.7%20.4%34.7%
Metal60.0%89.0%81.0%60.0%81.0%
Glass30.0%27.0%40.0%30.0%40.0%
Kitchen0.9%0.9%0.9%16.5%28.0%
Garden 1.2%1.2%1.2%16.0%29.0%
Tetra packs0.5%0.5%0.5%0.5%0.5%
Others11.0%17.0%11.0%11.0%11.0%
Total (Ton)785,658977,042977,7091,042,6831,429,059
Source: Own elaboration. Adapted from [23,24,30,31,32].
Table 4. Cost considered for each of the facilities.
TreatmentCapacity (Tons/Year)Dollar/Ton Treated
MRF KDM110,00017.7
MRF Ing. Alemana20,00097.2
Storage Center160,00013.4
Storage Center100,00010.7
Storage Center40,00018.7
Storage Center20,00017.4
Drop Off64001.7
Drop Off32002.7
Drop Off16004.3
Composting Plant13,0006.2
Data Source: [23,29,30,31].
Table 5. Formal sector and mono collection participation.
MaterialCollection Share S3.1Collection Share S3.2Collection Share S4 and S5
Bank CollectionMono CollectionBank CollectionMono CollectionBank CollectionMono Collection
Paper and Cardboard65%35%30%70%30%70%
Plastics80%20%50%50%50%50%
Metals70%30%35%65%35%65%
Glass65%35%30%70%30%70%
Kitchen100% 100% 100%
Garden100% 100% 100%
Tetra packs65%35%30%70%20%80%
Others 100% 100% 100%
Data Source: Own elaboration.
Table 6. Drop-off stations for S2 and S3.1.
Type of FacilityCapacity (Ton/Year)Units S2Units S3.1
Drop Off1100248219
Drop Off550180139
Drop Off27511990
Total Units 547448
Table 7. Recovery and collection ratios.
MaterialRecovery RatiosCollection Ratios (Considers Efficiencies)
S3.1S3.2S3.1S3.2
Paper and Cardboard59.0%67.0%98.3%89.3%
Plastics38.8%34.7%47.4%41.0%
Metals89.0%81.0%98.1%88.4%
Glass27.0%40.0%97.8%89.7%
Tetra packs0.5%0.5%0.6%0.6%
Others17.0%11.0%18.9%12.2%
From total waste25.0%25.0%37.3%32.9%
Table 8. S5 recovery and collection details per material.
S5Recovery RatiosCollection
%Tons%TonsFormalMono Collection
Paper and Cardboard67.0412,740.289.3550,176.2247,644.1302,532.1
Plastics34.7169,971.041.0200,660.2106,231.994,428.3
Metals81.0229,806.988.4250,855.389,369.3161,485.9
Glass40.087,886.889.7197,138.8131,830.265,308.6
Kitchen28.0361,699.928.0361,699.9361,699.9
Garden 29.0103,023.428.6101,602.4101,602.4
Tetra packs0.5111.20.5121.524.393.7
Others11.063,820.412.270,911.5 70,911.5
Total tons 1,429,059.8 1,733,165.81,038,402.1694,760.2
% of the total 37.0% 44.9%59.9%40.1%
Table 9. Type of facilities required for S5.
Type of FacilityCapacity (Tons/Year)Units
MRF Plant110,0005
MRF Plant20,0002
Storage Center100,0005
Storage Center40,0001
Storage Center20,0003
Drop Off110044
Drop Off55025
Drop Off27515
Composting and Vermiculture13,00034
Table 10. Municipal solid waste recovery ratios for different countries.
CountryMunicipal Waste Treated %Year
RecycledComposted
Spain20102013
Japan2027 *2012/2009
America35 **2014
France21172013
Netherlands24262013
Norway24162013
United Kingdom28162013
* Includes raw materials for animal feed and is a % of organic food waste; ** Includes recycling. Source: [42,43,44].

