Decreasing Metal Ore Grades—Is the Fear of Resource Depletion Justified?


Institute for Industrial Ecology, Pforzheim University, Tiefenbronner Str. 65, 75175 Pforzheim, Germany
*
Author to whom correspondence should be addressed.
Resources 2018, 7(4), 88; https://doi.org/10.3390/resources7040088
Submission received: 31 October 2018
/
Revised: 11 December 2018
/
Accepted: 14 December 2018
/
Published: 19 December 2018
(This article belongs to the Special Issue Responsible Sourcing of Materials Required for a Resource Efficient and Low-carbon Society)
Abstract
:Metals are an essential part of modern living. Ensuring the future supply of metals is a key issue in politics, science, and economics because the available amount of mineral resources is limited. To measure the depletion of mineral resources, several indicators are used. Some of them are based on the ore grade, which has been decreasing over time and is thus taken as a sign of resource exhaustion. However, does this assumption hold true? This paper shows that the development of ore grades is mainly the result of the increasing demand and the outstanding technological improvements that made mining of low grade ores profitable. The usage of ore grades as an indicator may, therefore, lead to erroneous conclusions about the safeguard objects. These are not the metals themselves, but the environment that is impacted by their extraction.
1. Introduction
Mineral resources, especially metals, are essential for the development of our society. As the available amount of these resources on Earth is limited, their depletion is a key issue in politics, economics, and science [1,2,3]. To measure resource depletion, several indicators have been developed [4]. Some of these indicators, such as those used by the common impact assessment methods ReCiPe [5], IMPACT 2002, and the EI99 [6,7], are based on the metal content of the ores (ore grade). It is assumed that an ongoing extraction leads to a decline in the quality of the deposits still available, such as a decrease in their ore grade. It has been shown in numerous studies that the ore grades of mined deposits have been falling over time [8,9,10,11]. What has to be questioned, however, is why the ore grades have been decreasing. Is this a geological phenomenon and hence a sign for resource depletion? Or is it rather a complex interplay of geological, economic, technological, and social factors? This question plays a central role, as already discussed by Northey, Mudd, and Werner [12]. It is the starting point for further considerations on the appropriate indicators to evaluate resource scarcity and the actual safeguard objects, and thus leading to corresponding strategies for action. Therefore, this paper examines the influencing factors on the development of ore grades, using the example of copper. Copper has been one of the first metals to be mined and still plays an essential role for our modern society. Its valuable properties—for example, its high conductivity—make it a useful material for a wide range of applications. Nevertheless, other metals are also faced with declining ore grades and, depending on several factors such as demand and extraction, the arguments might hold true for them, although further research is needed to make valid statements.
2. The Development of Ore Grades
There are some basic theoretical concepts describing the quality of the available amount of minerals in our earth. The first investigations on tonnage and grade of metal deposits go back to Lasky [13]. Lasky’s Law states that while the cumulative quantity of ore is increasing logarithmically, the metal content of the total available quantity decreases linearly. This model can be applied to individual deposits as well as to a number of deposits. The density function of the total resource base was examined by Ahrens [14,15] and Skinner [16]. Ahrens assumes a log-Gaussian distribution. Skinner, in contrast, states that the density function follows a bimodal distribution. Even if the bimodal distribution seems plausible, it has not yet been proven, because we do not know the actual density function of the entire resource base on Earth.
Investigations on the development of the actual copper contents of mined ores are also available. A well-known study is provided by Mudd [8]. In his report, “The Sustainability of Mining in Australia”, the author highlights the development of Australian raw material extraction and its implications for the environment. He considers not only copper but also other important mineral raw materials, such as coal, titanium, gold, nickel, and diamonds. The main data sources for his work are reports from mining companies and publications from authorities such as Geoscience Australia. As many reporting systems—for example, the Australasian Code for Reporting of Exploration Results, Mineral Resources, and Ore Reserves (JORC Code)—were not introduced until the 20th century, older data are taken from individual publications on mines or regions and are not complete for all years and raw materials. Nevertheless, the resulting error is negligible for a general trend statement over the long term. With regard to the ore grade, there is a general downward trend for all commodities [8]. Data on copper ore grades are also available for the United States. The United States Geological Survey (USGS) publishes annual reports, such as the Minerals Yearbook (USGS var.), which include production statistics for more than 90 materials. The compiled data are based on industry surveys conducted and statistically evaluated by the USGS. Figure 1 shows the development of the metal content of copper ores for Australia and the United States.
What is interesting about Figure 1 is the sudden drop in the metal content of Australian ores around 1885 from a level of approximately 15% to 5%, despite almost constant production. Taking a look at the data basis, it becomes apparent that the data availability is poor in this period of time. Around the years 1882 to 1889, only about 30% of copper production in Australia is covered, and in some cases, much less. In general, data availability between 1850 and 1890 is less than 50% of production with few exceptions, while in the other periods, it is usually in the upper quarter [8]. In addition, production volumes in Australia are relatively small and spread over a few mines, so individual mines have a relatively large influence. One of the mines, Mt Morgan, was partially destroyed by fire in 1927 and was not fully productive again until the 1930s. Mt Morgan had a low ore grade (0.5–1%) compared with the other mines, but a relatively high production share (approximately 20%), which led to a short-term increase in the average ore grade for these years [8]. Another increase in the ore grade was caused by Olympic Dam, which was discovered at the end of the 1970s, and the associated IOCG (iron oxide copper gold) deposit type was introduced [19]. Such events are more or less random, but have a great influence on the ore contents shown. Also, the base of measurement of ore grades might be different for earlier data. As exploration and sorting was done by eye or hand, respectively, a process of pre-concentration by these activities took place.
Compared with Australian copper ore grades, the metal contents in the United States are lower and their development is smoother. Crowson [11] also confirms this in comparison with the global average for the last decades. One reason is the deposit type available in each region. There are mainly porphyry deposits in the United States, which (as will be discussed later) have a low ore grade on average [11,20]. In Australia, deposits of the IOCG type currently have the largest share of resources (approximately 60% in 2010 and 2013). This type of deposit has an on average higher ore content than porphyry deposits [20,21,22]. Another reason is that the data represent different values. The USGS reports the yield, while for Australia, the mill head grade is given. The yield is the obtained amount of metal per amount of ore extracted. Data from the 19th century to the first half of the 20th century often state this value. Compared with the mill head grade, which indicates the metal content of the ore processed in the mill, the yield also includes the technical efficiency of the processes and is thus slightly lower than the corresponding mill head grade. Yield and mill head grade have become more and more similar with the increase in efficiency over the years [23,24]. This leads to a flattened curve in the case of the United States. The term ore grade is often used for the head grade and the yield, which makes it difficult to clearly separate the different figures. Usually, the ore grade refers to the metal content of the available reserves and/or resources. The reserves are the part of the raw materials that is known and can be mined economically under current conditions. Resources, on the other hand, describe the amount of ore (within a deposit) that cannot be economically extracted under current conditions or is associated with a higher degree of uncertainty, for example, with regard to its shape, quantity, and quality. In addition, there is the geopotential, which contains the existing, but not yet known potential of further raw material deposits. The limits of reserves and resources are thus dynamic and change, for example, with the current price [25]. However, it is important to be aware of which values are stated in order to make valid statements, because the discussed difficulties may lead to interpretations that are not compatible with the original data basis. There are several influencing factors that determine the grade of the ore mined, such as technology. Over time, an increasing efficiency, for example, made the mining of low grade ores economically feasible. This is reflected in the data shown in Figure 1, which refers to ores that actually were or are mined, not to the still available known or even unknown deposits. The influence of these factors often leads to a decrease in ore grades of mined deposits, but does not reflect depletion.
3. Influencing Factors on the Ore Grade
The influencing factors on the ore grades of mined deposits will be discussed in the following section.
3.1. Deposit Types and Demand
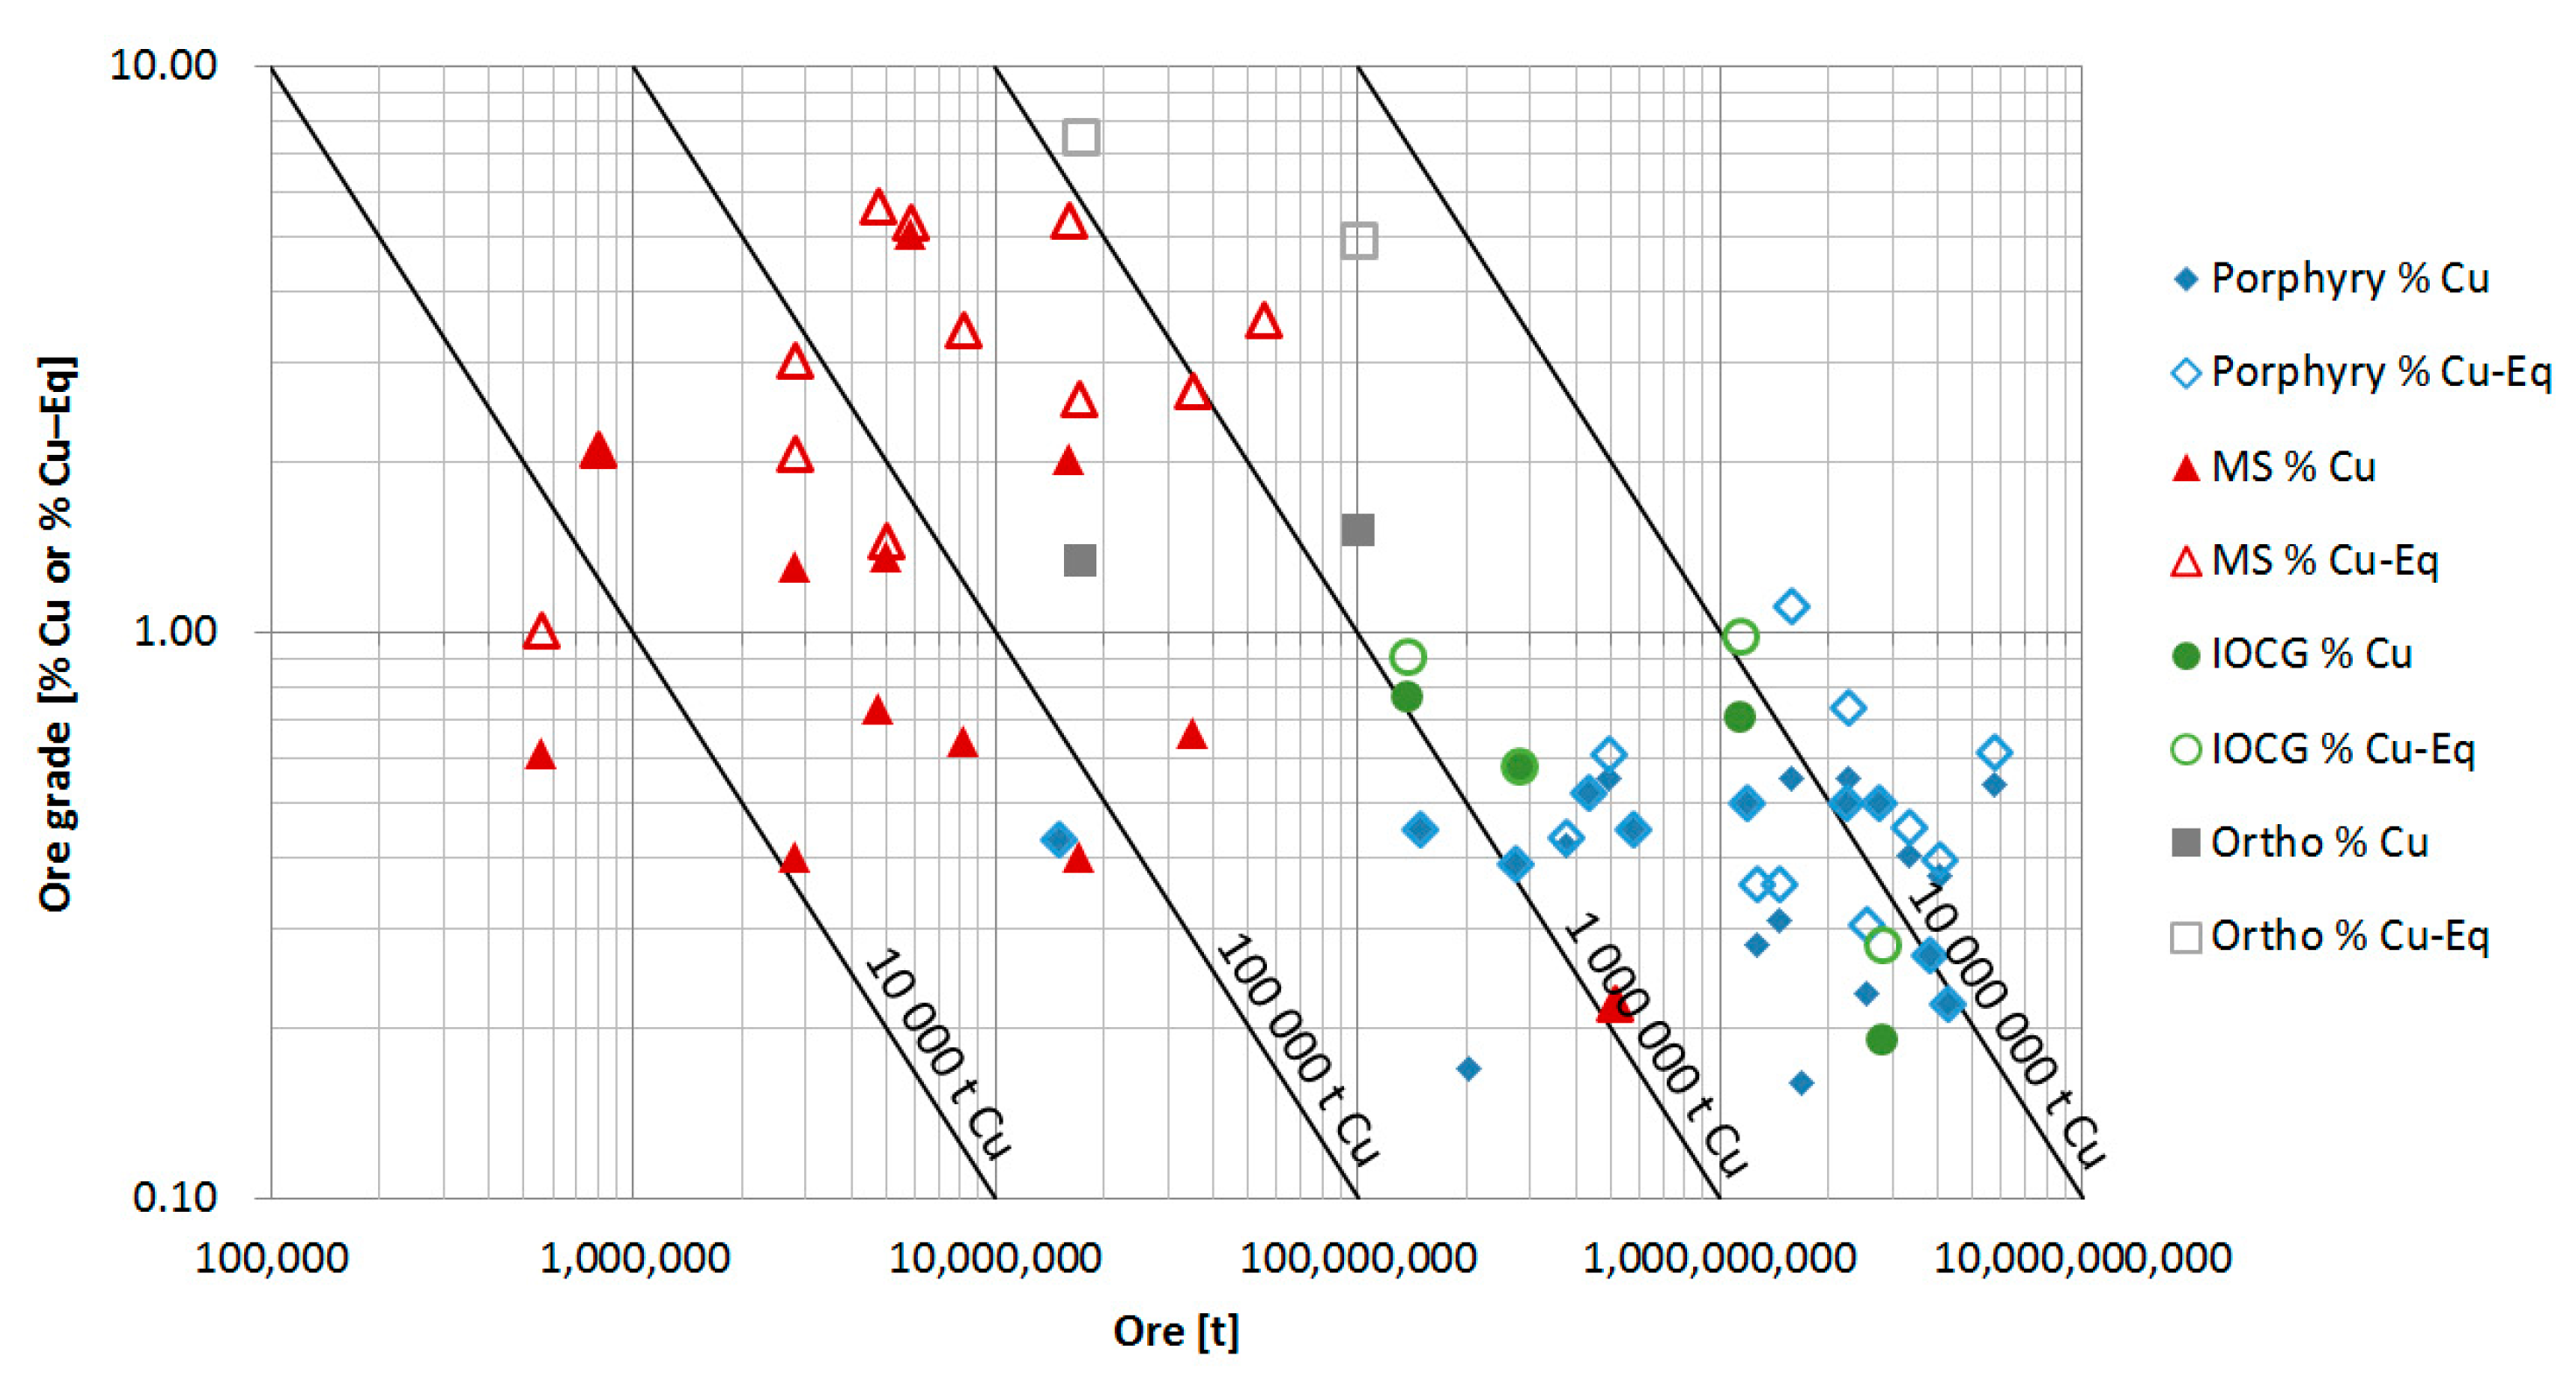
We extract our raw materials from the Earth’s crust, which accounts for about half a percent of the Earth’s total mass and consists mainly of oxygen and silicon [26,27,28]. Metals are contained in very small quantities in the Earth’s crust. For example, the average proportion (Clarke value) of copper is about 28 ppm, while that of gold is only 1.5 ng/g [29]. The extraction of this average concentration is (at the moment) economically impossible. However, local enrichments of these elements took place as a result of different geological processes, and thus offer a suitable starting point for their extraction. The average enrichment factor required for extraction depends on the type of raw material and the currently available technology. To extract aluminum profitably, for example, the enrichment factor has to be approximately four, which leads to an average ore content of 30%. In contrast, chromium, which is also mined with an ore grade of 20% to 30%, must be enriched approximately 3000 times because of the low average crustal concentration. For copper and nickel, the necessary enrichment factor is about 75, while for gold, it is 250 [30,31]. There is also a difference between the deposit types of one metal. Copper offers an illustrative example. Most (about 60%) of the currently known global resources are contained in so-called porphyry deposits, followed by sediment-hosted deposits (about 15%) and IOCG deposits (about 10%), among others [20]. Each of these deposit types is characterized, among other things, by its mass of ore contained and its medium ore grade. Currently mined or under development IOCG deposits have an average of 6 million tons of valuable metal at an average ore grade of approximately 0.9% Cu, sediment-hosted deposits contain 4.5 million tons at about 1.9%, and porphyry deposits contain about 3 million tons at about 0.5%. Massive sulfides (MS), which make up less than 2% of the global resources, have only about 0.3 million tons of copper at an ore grade of about 1.4% Cu (but they have remarkable amounts of other metals like zinc) [20]. Figure 2 shows the currently known resources (deposits) by type, ore content, and ore grade. What can be clearly seen is that most copper is contained in large deposits, which, however, are characterized by a low metal content of the ore. The low ore grade of large deposits reflects not only geology, but also economics. In order to state their resources, companies have to define a so-called cut-off grade, which gives the lower limit of ore grades that distinguishes waste from ore resources. This lower limit is influenced by production costs, which might be lower for bigger operations as a result of economies of scale resulting in a lower stated ore grade [12]. Another point that is important to note here is that in the future, new deposits or part of deposits as well as totally new ore types might still be discovered.
Assuming a rising copper demand in the long term, low-grade deposits offer a valuable source to cover this high demand and, therefore, their extraction is unavoidable [23]. If the ore contents are compared with the production over the past decades, this is made clear once again (see Figure 1). The growing population, its development, and the associated increasing use of technologies lead to a steady increase in the annual demand for raw materials. Initially mined regionally and for the company’s own needs, today, enormous quantities are extracted globally and increasingly large deposits with lower ore contents are used. However, this does not mean that there are no deposits with high ore grades left. An example is the Timok Project [32]. Some of the resources have a copper content of 17% to 19% at a level of about 2.8 million tons of copper [33]. This corresponds to approximately the annual consumption of the United States around the turn of the millennium, while currently, consumption is even lower.
Moreover, ores with a high metal content are often part of a larger deposit. High-grade ores are produced by secondary enrichment, that is, they represent the oxidic zone of a deposit. Whereas in the past, only this part was mined, today, the entire deposit is used, which reduces the average ore grade of the deposit and thus of the mined ore [34]. However, as more of the available resource is extracted, this might be seen as a more efficient use of the deposit in general, which, for example, makes an important contribution to the economy of the communities hosting the mining operations.
At the beginning of copper mining in Australia, the ore content of the secondary enrichment zones was still so high that the ores were shipped to Wales for metallurgical processing, where the necessary know-how was available. Only in the course of the years, when the metal contents of the ore sank, were metal smelters established locally [35]. Thus, if only a few tons of copper were needed today or if only the high grade parts were mined, it would certainly be possible to obtain mineral resources from sources with a higher metal content than the average ore used, and there might be periods of lower demand in the future. It has to be kept in mind that the decision for developing a deposit into a mine is not entirely based on size or ore grade; there are several other factors like economics, accessibility, and political stability that come into play. Porphyry deposits, for example, are not only huge, but also near to the surface, and thus easy to access and mine by mass mining methods.
3.2. Exploration
The fact that low grade deposits are mined today is also the result of growing knowledge of their formation, occurrence, and the corresponding technologies. Whereas exploration used to be done with the naked eye at the beginning of mineral extraction, more sophisticated methods were gradually added. In addition, the economic pressure on mine operators increased, which made more precise exploration necessary, as this was the only way to make a reliable statement about the yield of a deposit and to attract investors. The first institutions dealing with mining from a scientific point of view were founded in the middle of the 18th century. About 100 years later, the USGS was established, and from this time onwards, geological explorations were carried out in all industrial countries. At the end of the 19th century, technical innovations such as diamond drills enabled deeper, more accurate, and cheaper explorations. In the 20th century, further technical developments were added, such as aerial survey and satellite imagery. From the 1980s onwards, geographic information systems (GIS) and computer models were used, for example (see Figure 3). Besides technical innovations, an increasing understanding of the structure of the earth, such as the discovery of plate tectonics in the 1960s, led to a more targeted search. This resulted in more precise models of individual deposits, and thus also to discoveries of new parts of already mined deposits. Altogether, these developments have enabled the resource base to be constantly expanded [35,36,37]. If we look at the reserve figures for copper over the last 50 years, we can also perceive an increase. This shows that the reduction in reserves can be compensated by exploration work and the development of extraction technologies (which will be discussed below). In times of high demand and associated high metal prices resulting from a supply deficit, exploration also increases [38,39,40], and there is no end in sight. In a report from the German Academy of Sciences, it is pointed out that there is no institution in the world with the capability of evaluating all the mineral deposits on Earth [41] (p.26). Therefore, there are still some white spots on the world map, contrary to the assumption that everything has already been explored [42] (p. 123).
3.3. Mine Size and Structural Changes
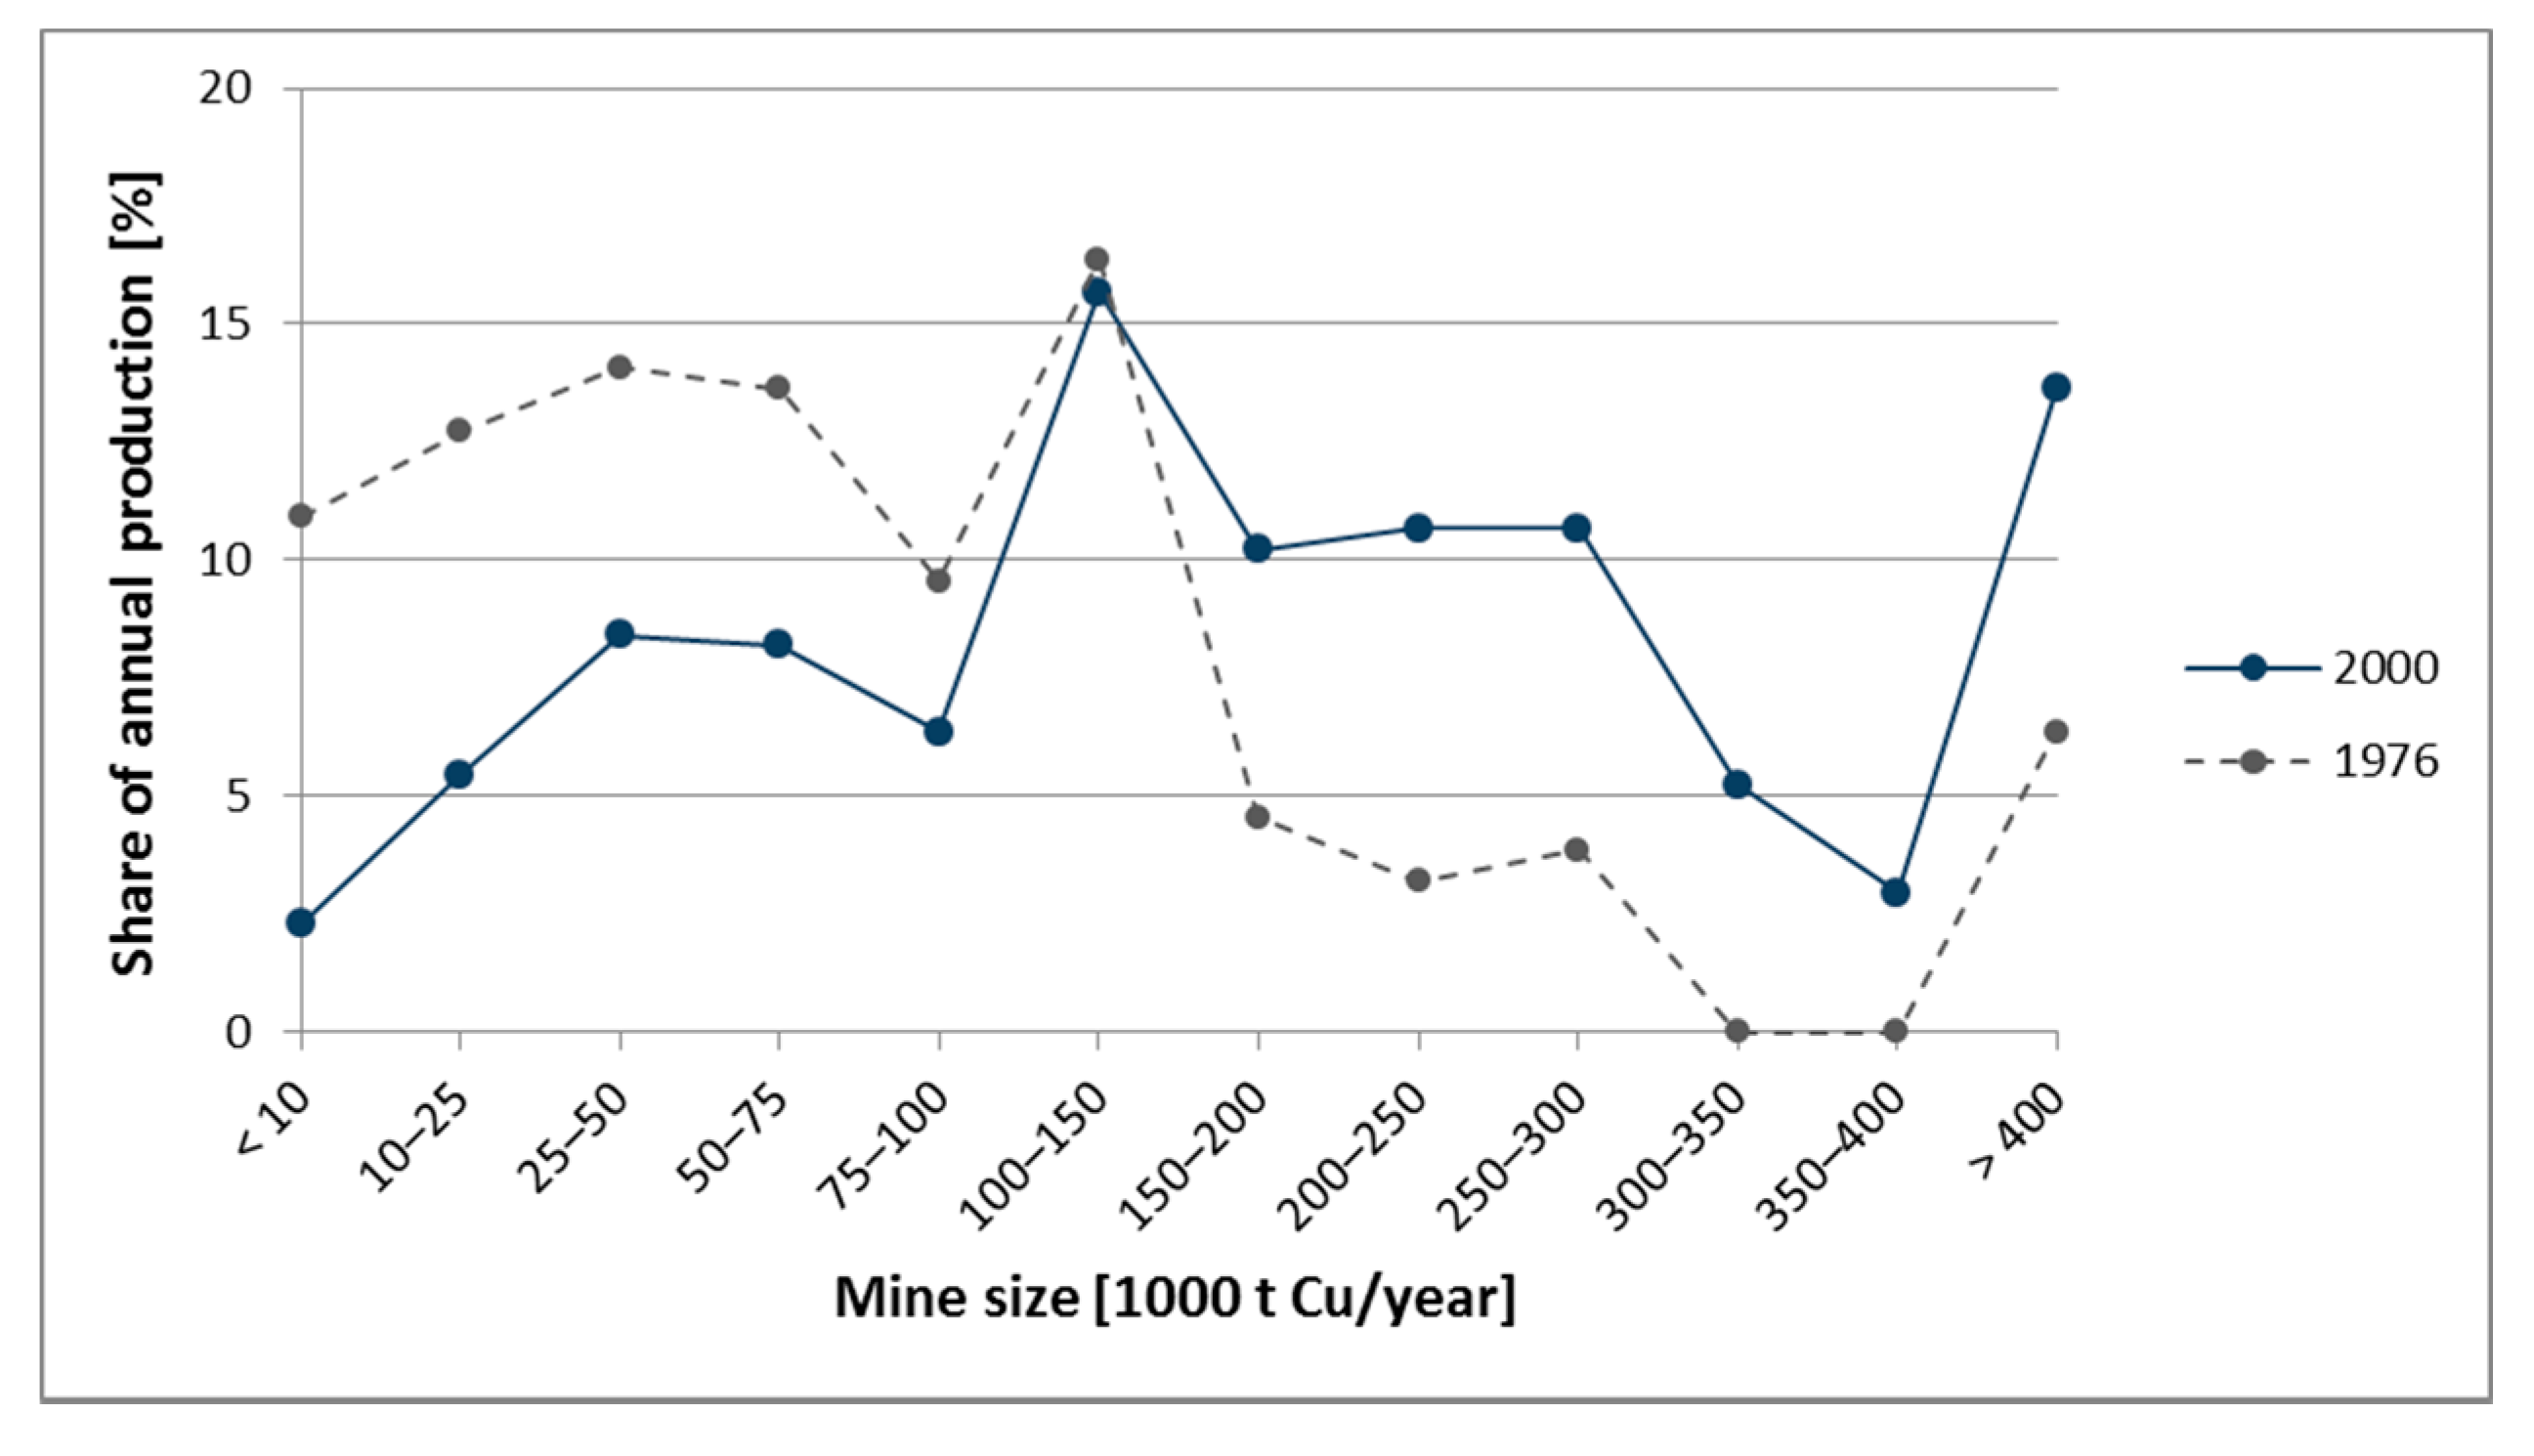
The choice of large deposits is not only the result of the high demand; economic reasons play also a central role. Despite the progress mentioned above, exploration and development of a deposit involves high financial costs. One way companies seek to achieve economies of scale is by spreading their fixed costs over a larger production volume [43]. This can be illustrated by the development of the capacities of mines, which is shown in Figure 4.
While the decision to develop a mine before the 1980s was based on the expected copper price, in recent decades, there has been a trend towards developing only the world’s largest known deposits [44]. Most of these large deposits are porphyry. In the United States, the trend towards these deposits dates back to the beginning of the 20th century. While in 1907, the proportion of porphyry deposits in the United States was still about 10% of the mined ore, in 1914, it was already about 50% and in the mid-1930s, about 70% [23]. Worldwide, porphyry deposits accounted for 34% of global mine production in 1975 and 62% in 1998, followed by a slight decline to 55% in 2009 [11]. This shows that the increasing extraction of porphyry deposits has significantly contributed to the reduction of the average ore grade. The period from the 1920s is also known as “The Porphyry Era” [23]. This era is marked by a regional shift in mine production, as shown in Figure 5. In 2008, almost half of the extracted ore came from Latin America, which has large porphyry deposits for geological reasons. For comparison, in 1931, its share was just under 20% [11,45]. The development towards large porphyry deposits is reflected not only in the size of the individual mines and their geographical location, but also in the structure of the mine operators. In the 1920s, three companies, Anaconda Copper Mining Company, Kennecott Copper Corporation, and Phelps Dodge Corporation, produced approximately 35% of the total American copper production, 10 years later, they produced as much as 74% [18].
3.4. Technological Developments
Porphyry deposits were already known in the 19th century, but it was not feasible to mine them profitably; they were regarded as worthless. Only with the development of corresponding technologies did it become possible to extract low-grade deposits [18,23]. The trend towards porphyry deposits is also linked to the trend towards open-pit mining. This leads to a further decrease in the ore content, as large scale open pit mining methods allow profitable extraction of such ores because of lower mining costs. A comparison of the ores mined above and below ground reveals a clear difference in their ore grade. This is exemplified by the data for the United States from Leong et al. [18] for the years 1917 to 1936 and based on Weber [23] for the year 2013. In the first period, the difference averaged 1.3 percentage points; in 2013, it was around 0.5 percentage points (with a ratio of surface to underground mining operations of around two-thirds to one-third). Open-pit mining is a highly productive mining technique, as many of the large deposits are close to the surface. The associated method is known as the Jackling method and is one of the most important innovations from the beginning of the 20th century. Daniel C. Jackling, who developed the method, is also known as the Henry Ford of copper mining. He successfully applied the mass production methods already used in other industries to copper mining. In Bingham Canyon, for example, all underground mines were quickly converted into open-pit mines and the ore was mined with machines suitable for mass production [46,47,48]. At that time, it was difficult for small underground mines to keep up. In addition, there were numerous technological advances, which were necessary, among other things, to realize mass production in hard rock mining. This progress has been made in both open-pit and underground mining. In open-pit mining, large shovel excavators were used from around the beginning of the 20th century; this technology had been adopted from iron ore mining and led to a further decrease in ore grades, because larger equipment is less selective and the ore is diluted by waste or low grade material. A new invention was the block caving process for the underground extraction of copper ores with a low metal content [18,23]. This method is usable for big ore bodies with favorable rock conditions for natural breakage as it uses the internal rock stresses to fracture the rock. Therefore, an ore block is undercut by blasting; gravity causes the fractures to spread out and forces the ore block to collapse, following that the ore can easily be extracted [49]. Figure 6 shows the development of mining methods from 1880 to 1936. Today, 80% to 95% of copper ore is extracted by open-pit mining [50] (p. 197).
Even before this time, however, progress had already been made. While copper was still largely mined by hand until the 1880s, more mature and increasingly mechanized technologies were gradually used. Initially, workers used shovels to expose the ore and crushed it by hand before loading it onto carriages pulled by animals. The mechanization of these steps took place gradually. This was compounded by the increasing use of electricity instead of steam from the year 1900 (see Figure 7) [18,23,51].
Besides mechanization, the increase in the efficiency of mining, concentration, and refining technologies took place. At the end of the 18th century, drills were gradually optimized and operated using compressed air and explosives were used instead of black powder. This improvement had a particular impact on underground mining and increased the efficiency of the workers employed so that their labor could be used for other purposes. The transport systems were also upgraded and the first ventilation systems were installed. In open-pit mining at the beginning of the 20th century, the more efficient loading devices paid off. Instead of steam-powered ones, electric shovels were used, which were mounted onto a crawler instead of a truck. This allowed an increase of up to 200% of the loaded quantity. In general, larger and/or electrically operated devices were used for transport [18,48]. The mentioned developments could be described as a shift in activities from the selective mining of rich ores to the large-scale mining of low-grade ores [23].
Furthermore, technical improvements and innovations in ore comminution and concentration contributed to the success of low grade ores. The increase in efficiency achieved by technical progress is excellently illustrated by an example from Corry and Kiessling [23]. At the beginning of the 20th century, the yield after grinding was around 60% to 75% and increased to 90% by the mid-1930s. This means that the yield from an ore with 1% copper in 1935 (90% efficiency) was the same as from a 1.5% ore in 1900 (60% efficiency). This also led to the fact that old processing residues were now partly regarded as ore and processed again. Another outstanding invention was the flotation process. So gradually, the mining of more complex and chemically more diverse ores became possible [36]. In addition to purely technological advances, more and more was invested into the training of workers, which also had a positive influence on the yield [18,23].
Recent technological developments include the hydrometallurgical process, in which the metal is dissolved from the rock using chemicals before being further processed by solvent extraction/electrowinning (SX/EW). This method is used for copper oxides, which could not previously be mined, and for sulfide ores with a very low copper content. This process was introduced in 1968 and had its breakthrough in the mid-1980s. Since then, the share of total production has increased from 30% of American production in the 1990s to about 45% in 2005 [17,36]. There are also numerous innovations and process variants, for example, in the smelting process. However, the outstanding technical improvements were introduced at the beginning of the 20th century; today’s innovations (apart from the hydrometallurgical process) are often process improvements to reduce the consumption of consumables and supplies and to reduce emissions. Nevertheless, new disruptive innovations cannot be ruled out (e.g., deep sea mining).
3.5. Price and By-Products
The previously listed improvements were able to offset the increasing production costs due to lower grade ores, so that the real price of copper has been constant over time [19,48]. This clearly contradicts the assumption that there is a shortage. The price is determined by demand and supply. If there is a supply shortage, the price rises. However, the constant real price in this case confirms that demand can be met at reasonable conditions.
The current market price also has a short term influence on the mined ore. Selective mining takes place in times of low metal prices. At times of high market prices, overburden previously considered worthless becomes ore. Looking at the price of copper and the grade of ores in the United States, this effect can be seen around 1930, when the global economic crisis took place. At that time, copper prices fell relatively sharply, leading to reduced mining [45]. At the same time, however, an increase in the average mill head grade can be observed. From 1933 onwards, there was an upward trend in copper prices and the average metal content fell from 1.9% in 1934 to 1.5% in 1936 (as the published reports do not include data from Alaska, this trend is somewhat more pronounced) [52]. Figure 8 shows the relative price and head grade change compared with the previous year for the period from 1920 to 2010; a positive price change is usually associated with a negative change in the copper content of the mined ore and vice versa. Not all aspects are taken into account in the evaluation, for example, a slight time shift of the effects may result from accumulated inventories; furthermore, the price of copper is influenced by a multitude of factors.
In addition to the prices for the main product, the share of by-products also represents a surplus value. Depending on the type of deposit, other different metals can be contained. Porphyry deposits usually contain copper, gold, silver, and molybdenum. Sediment bound deposits, which mainly occur in Africa, contain cobalt in addition to copper. However, there are also deposit types that have zinc and lead included as other valuable materials. Figure 9 shows the metal content of several deposits using copper equivalents. Copper equivalents give the percentage of valuable metal in a deposit, reflecting the monetary value of all metals normalized to that of copper. If the copper equivalents are compared to the copper ore grade, it can be seen that some deposit types like massive sulfides, which are often smaller, have a high added value due to the by-products they contain. On average, about 16% of the economic value of copper deposits is due to their co- and by-products [41] (p. 72).
Figure 10 shows the development of the amount of molybdenum, gold, and silver produced in the United States as a by-product of copper production per ton of copper (over individual years). The amount of silver extracted is quite stable over the period evaluated, whereas the proportion of gold falls over the same period. In 2000, approximately 45% less gold was mined per ton of copper than in 1950. For molybdenum, the case is reversed. Molybdenum production from copper mining more than doubled (the figures also include the by-product quantity from other mass metals, but this proportion is negligible in comparison with that from copper). One reason for this is the demand for molybdenum, which had been increasing steadily since the mid-1930s and only flattened out towards the beginning of the 1980s.
On the other hand, the increasing share of porphyry deposits in the total copper production also contributes to this, as only porphyry deposits contain molybdenum as a by-product. The proportion of molybdenum, which is mainly extracted from copper as a by-product, rose from 27% in 1942 to over 56% in 2015, with the other half of annual production currently being extracted as the main product [17]. Unfortunately, no statement can be made for cobalt, as this is hardly produced in the United States. Apart from the copper content, it can be shown that the amount of by-products obtained has increased overall and thus contributes more to the profitability of a mine.
4. Discussion
The ore contents of the mined copper deposits have been decreasing over the last decades. Mudd, for example, confirms this not only for copper, which has been used here as an example, but also for many other metals that are mined in Australia [8]. Often, this trend is used to support the view that we are running out of resources. However, as shown by this work, this conclusion cannot be drawn from the available data. Instead, we need to interpret this trend positively and see the enormous technological progress associated with it.
Regarding the decreasing ore grades, the first statement may seem appropriate, but we have to acknowledge that these figures show the ore grade of the actual mined deposits, not what is still available in our earth, and there are several other factors that have an influence on the choice of whether or not to mine a deposit. It could be shown that the exponential increase in the consumption of copper, for example, led to the mining of ever larger deposits, which often have lower ore grades. This is because of the preferred deposit types. New technologies have been developed to extract these deposits, and large shovel excavators and froth flotation, for example, have made it possible to use ores with a low concentration of metal. What was called ore at the end of the 20th century was still overburden at the beginning of the same century, because it was not possible to extract the raw material under economic conditions. The long-term constant real copper prices reinforce this statement by showing that people have found a way to serve demand (using low grade ores) at reasonable prices. Therefore, the ore content alone is not suitable for making a statement about the availability of raw materials, but rather to show the enormous progress made by the technologies used.
Nevertheless, the decreasing metal content of the ores leads to an increased expenditure of input materials, overburden, energy, emissions, and so on, which must not be ignored, as it has a considerable influence on our environment, but which was not the subject of the paper here. Further, it is precisely this increasing ecological expenditure associated with falling ore grades, as well as the increasing conflicts of use, that are restricting the availability of resources from a sustainable point of view. In our opinion, these environmental impacts should be placed more at the center of the assessment of resource extraction than a very speculative discussion about possible resource depletion based on the data discussed in this paper.
Author Contributions
Conceptualization, N.R. and M.S.; Investigation, N.R.; Data Curation, N.R.; Writing—Original Draft Preparation, N.R. and M.S.; Writing—Review & Editing, M.S.; Project Administration, M.S.; Funding Acquisition, M.S.
Funding
This research was funded by the Ministry of the Environment, Climate Protection, and the Energy Sector Baden-Württemberg within the NEXUS project (grant number [L7516001]).
Acknowledgments
We thank Leopold Weber for providing the data and Friedrich-Wilhelm Wellmer and the anonymous reviewers for their valuable remarks.
Conflicts of Interest
The authors declare no conflicts of interest.
References
- European Commission. Report on Critical Raw Materials for the EU. Report of the Ad hoc Working Group on Defining Critical Raw Materials; European Commission: Brussels, Belgium, 2014. [Google Scholar]
- Graedel, T.E.; Harper, E.M.; Nassar, N.T.; Nuss, P.; Reck, B.K. Criticality of metals and metalloids. Proc. Natl. Acad. Sci. USA 2015, 112, 4257–4262. [Google Scholar] [CrossRef] [Green Version]
- Meadows, D.H.; Meadows, D.L.; Randers, J.; Behrens III, W.W. The Limits to Growth. A Report for the Club of Rome’s Project on the Predicament of Mankind, 2nd ed.; Universe Books: New York, NY, USA, 1972. [Google Scholar]
- Rørbech, J.T.; Vadenbo, C.; Hellweg, S.; Astrup, T.F. Impact Assessment of Abiotic Resources in LCA: Quantitative Comparison of Selected Characterization Models. Environ. Sci. Technol. 2014, 48, 11072–11081. [Google Scholar] [CrossRef] [PubMed]
- Goedkoop, M.; Heijungs, R.; Huijbregts, M.; de Schryver, A.; Struijs, J.; van Zelm, R. ReCiPe 2008. A Life Cycle Assessment Method Which Comprises Harmonized Category Indicators at the Midpoint and the Endpoint Level; Report I: Characterisation; Ruimte en Milieu, Ministerie van Volkshuisvesting, Ruimtelijke Ordening en Milieubeheer: Amsterdam, The Netherlands, 2008. [Google Scholar]
- Jolliet, O.; Margni, M.; Charles, R.; Humbert, S.; Payet, J.; Rebitzer, G.; Rosenbaum, R. IMPACT 2002+: A new life cycle impact assessment methodology. Int. J. Life Cycle Assess. 2003, 8, 324. [Google Scholar] [CrossRef]
- Goedkoop, M.; Spriensma, R. The Eco-Indicator’99. A Damage Oriented Method for Life Cycle Impact Assessment; Methodology Report; PRé Consultants: Amersfoort, The Netherlands, 2001. [Google Scholar]
- Mudd, G.M. The Sustainability of Mining in Australia: Key Production Trends and Environmental Implications; Research Report No. RP5; Department of Civil Engineering, Monash University and Mineral Policy Institute: Melbourne, Australia, 2009. [Google Scholar]
- Northey, S.; Mohr, S.; Mudd, G.M.; Weng, Z.; Giurco, D. Modelling future copper ore grade decline based on a detailed assessment of copper resources and mining. Resour. Conserv. Recycl. 2014, 83, 190–201. [Google Scholar] [CrossRef]
- Calvo, G.; Mudd, G.M.; Valero, A.; Valero, A. Decreasing ore grades in global metallic mining: A theoretical issue or a global reality? Resources 2016, 5, 36. [Google Scholar] [CrossRef]
- Crowson, P. Some observations on copper yields and ore grades. Resour. Policy 2012, 37, 59–72. [Google Scholar] [CrossRef]
- Northey, S.A.; Mudd, G.M.; Werner, T.T. Unresolved Complexity in Assessments of Mineral Resource Depletion and Availability. Nat. Resour. Res. 2017, 543, 367. [Google Scholar] [CrossRef]
- Lasky, S.G. How tonnage and grade relationships help predict ore reserves. Eng. Mineral. J. 1950, 151, 81–85. [Google Scholar]
- Ahrens, L.H. A Fundamental Law of Geochemistry. Nature 1953, 172, 1148. [Google Scholar] [CrossRef]
- Ahrens, L.H. The lognormal distribution of the elements (A fundamental law of geochemistry and its subsidiary). Geochim. Cosmochim. Acta 1954, 5, 49–73. [Google Scholar] [CrossRef]
- Skinner, B.J. Second iron age ahead. Am. Sci 1976, 64, 258–269. [Google Scholar]
- USGS. Minerals Yearbook: Volume I.—Metals and Minerals. Years 1932–2015. Available online: https://minerals.usgs.gov/minerals/pubs/commodity/myb/ (accessed on 10 October 2018).
- Leong, Y.S.; Erdreich, E.; Burrit, J.C.; Kiessling, O.E.; Nighman, C.E.; Heikes, G.C. Technology, Employment and Output per Man in Copper Mining; Works Projects Administration National Research Project E-12; Work Projects Administration, National Research Project in cooperation with Dept. of the Interior, Bureau of Mines: Philadelphia, PA, USA, 1940. [Google Scholar]
- Schodde, R. The key drivers behind resource growth: An analysis of the copper industry over the last 100 years. Presented at the MEMS Conference Mineral and Metal Markets over the Long Turn, Phoenix, AZ, USA, 3 March 2010. [Google Scholar]
- Weber, L. Interpretation von Reserven- und Ressourcenangaben aus wirtschaftsgeologischer Sicht. Berg Huettenmaenn. Monatsh. 2015, 160, 71–78. [Google Scholar] [CrossRef]
- Jaireth, S.; Porritt, K.; Hoatson, D.M. Australian Copper Resources: Sheet 2: Deposit Types. 1:10,000,000 Scale Map. Available online: https://www.data.gov.au/dataset/australian-copper-resources-sheet-1-resources-by-region-sheet-2-deposit-types-may-2010 (accessed on 20 December 2017).
- Weber, L.; (Vienna, Austria). Personal communication, 2016.
- Corry, A.W.; Kiessling, O.E. Mineral Technology and Output per Man Studies. Grade of Ore; Works Projects Administration National Research Project E-6: Philadelphia, PA, USA, 1938. [Google Scholar]
- Gordon, R.B. Production residues in copper technological cycles. Resour. Conserv. Recyl. 2002, 36, 87–106. [Google Scholar] [CrossRef]
- Wellmer, F.-W. Wie lange reichen unsere Rohstoffvorräte?—Was sind Reserven und Ressourcen? UmweltWirtschaftsForum 2014, 22, 125–132. [Google Scholar] [CrossRef]
- Anderson, D.L. Theory of the Earth; Blackwell Scientific Publ.: Boston, MA, USA, 1989. [Google Scholar]
- Javoy, M. Chemical earth models. C. R. l’Acad. Sci.-Ser. IIA-Earth Planet. Sci. 1999, 329, 537–555. [Google Scholar] [CrossRef]
- Grotzinger, J.; Jordan, T. Press/Siever Allgemeine Geologie, 7th ed.; Springer Spektrum: Berlin/Heidelberg, Germany, 2017. [Google Scholar]
- Rudnick, R.L.; Gao, S. Composition of the Continental Crust. In Treatise on Geochemistry, 2nd ed.; Holland, H.D., Turekian, K., Eds.; Elsevier: Oxford, UK, 2014; pp. 1–51. [Google Scholar]
- Evans, A.M. Erzlagerstättenkunde; Ferdinand Enke: Stuttgart, Germany, 1992. [Google Scholar]
- Evans, A.M. Ore Geology and Industrial Minerals. An Introduction, 3rd ed.; Blackwell Publ.: Malden, MA, USA, 2012. [Google Scholar]
- Nevsun Resources Ltd. Timok Project: Company Website. Available online: https://www.nevsun.com/projects/timok-project/ (accessed on 30 July 2018).
- Nevsun Resources Ltd. 2017 Press Releases: Mineral Resource Statement for Timok Upper Zone Project-Cukaru Peki Deposit-Serbia. Available online: http://www.nevsun.com/news/2017/october26-updated-pea-for-timok-upper-zone-copper-project/ (accessed on 6 December 2018).
- West, J. Decreasing metal ore grades: Are they really being driven by the depletion of high-grade deposits? J. Ind. Ecol. 2011, 15, 165–168. [Google Scholar] [CrossRef]
- Winter Birrell, R. The Development of Mining Technology in Australia. Ph.D. Thesis, University of Melbourne, Melbourne, Australia, 2005. [Google Scholar]
- Wilburn, D.R.; Goonan, T.G.; Bleiwas, D.I. Technological Advancement. A Factor in Increasing Resource Use; Open File Report 2001-197, Version 1.03; 2001. Available online: https://pubs.er.usgs.gov/publication/ofr01197 (accessed on 21 December 2017).
- Peters, W.C. Exploration and Mining Geology, 2nd ed.; John Wiley and Sons Inc.: New York, NY, USA, 1987. [Google Scholar]
- Wellmer, F.-W.; Böttcher, G.; Schmidt, H. Gewinnung mineralischer Rohstoffe und IDNDR. Geographische Rundschau 1994, 46, 450–456. [Google Scholar]
- Tilton, J.E.; Lagos, G. Assessing the long-run availability of copper. Resour. Policy 2007, 32, 19–23. [Google Scholar] [CrossRef]
- Mudd, G.M.; Jowitt, S.M. Growing Global Copper Resources, Reserves and Production: Discovery Is Not the Only Control on Supply. Econ. Geol. 2018, 113, 1235–1267. [Google Scholar] [CrossRef]
- Wellmer, F.-W.; Buchholz, P.; Gutzmer, J.; Hagelüken, C.; Herzig, P.; Littke, R.; Thauer, R.K. Raw Materials for Future Energy Supply; Springer: Cham, Switzerland, 2018. [Google Scholar]
- Bardi, U. Extracted. How the Quest for Mineral Wealth Is Plundering the Planet; Chelsea Green Pub Co.: White River Junction, VT, USA, 2014. [Google Scholar]
- Crowson, P. Mine size and the structure of costs. Resour. Policy 2003, 29, 15–36. [Google Scholar] [CrossRef]
- Schodde, R. What Do We Mean by a World-Class.-Deposit? And Why Are They Special? Presented at the AMEC Conference, Perth, Australia, 8 June 2006. [Google Scholar]
- Julihn, C.E.; Meyer, H.M. Minerals Yearbook 1932–1933; Kiessling, O.E., Ed.; United States Government Printing Office: Washington, DC, USA, 1933.
- Brunn, S.D. Engineering Earth. The Impacts of Megaengineering Projects; Springer: Dordrecht, The Netherlands, 2011. [Google Scholar]
- Arrington, L.J.; Hansen, G.B. The Richest Hole on Earth. A History of the Bingham Copper Mine; Utah State University Press: Logan, UT, USA, 1963. [Google Scholar]
- David, A.P.; Wright, G. Increasing returns and the genesis of American resource abundance. Ind. Corp Chang. 1997, 6, 203–245. [Google Scholar] [CrossRef]
- Hustrulid, W.A.; Bullock, R.C. Underground Mining Methods. Engineering Fundamentals and International Case Studies; Society for Mining, Metallurgy, and Exploration: Littleton, CO, USA, 2001. [Google Scholar]
- Giurco, D. Towards Sustainable Metal Cycles: The Case of Copper. Ph.D. Thesis, University of Sydney, Sydney, Australia, 2005. [Google Scholar]
- Committee on Resources and Man. Resources and Man. A Study and Recommendations; W. H. Freeman and Company: San Francisco, CA, USA, 1969.
- Furness, J.W.; Meyer, H.M. Copper. In Minerals Yearbook 1938; Hughes, H.H., Ed.; United States Government Printing Office: Washington, DC, USA, 1938; pp. 81–108. [Google Scholar]
Figure 1.
Copper ore grades and production in Australia (1844–2007) and the United States (1880–2010). Data for Australia are taken from the work of [8]; data for the United States 1924–2010 are taken from the work of [17], and previous years from the work of [18].

Figure 2.
Resources (measured and indicated in conformity with the Australasian Code for Reporting of Exploration Results, Mineral Resources, and Ore Reserves (JORC) or South African Mineral Codes (SAMREC)) and ore grades of copper mines and projects classified by deposit types [20]. MS—massive sulfides; Ortho—orthomagmatic; IOCG—iron oxide copper gold; diss—disseminated hydrothermal; Por—porphyry; Sk—skarn; Sed-host—sediment hosted.


Figure 4.
Share of annual production according to mine size for the years 1976 and 2000 [43].
Figure 4.
Share of annual production according to mine size for the years 1976 and 2000 [43].


Figure 6.
Shares of mining methods for the years 1880 to 1936 [18].
Figure 6.
Shares of mining methods for the years 1880 to 1936 [18].

Figure 7.
Mechanical power use in US metal mines [51].
Figure 7.
Mechanical power use in US metal mines [51].

Figure 8.
Relative change of copper ore grade and price for the United States from 1920 to 2010 (own calculations based on the work of [17]).
Figure 8.
Relative change of copper ore grade and price for the United States from 1920 to 2010 (own calculations based on the work of [17]).

Figure 9.
Resources and ore grades of copper mines expressed in Cu–Eq (own calculations based on the work of [22], Cu–Eq are calculated using the amount and price of all in a deposit included and extracted metals, efficiencies are neglected).
Figure 9.
Resources and ore grades of copper mines expressed in Cu–Eq (own calculations based on the work of [22], Cu–Eq are calculated using the amount and price of all in a deposit included and extracted metals, efficiencies are neglected).

Figure 10.
By-products per ton of copper production (own calculations based on the work of [17]).
Figure 10.
By-products per ton of copper production (own calculations based on the work of [17]).

© 2018 by the authors. Licensee MDPI, Basel, Switzerland. This article is an open access article distributed under the terms and conditions of the Creative Commons Attribution (CC BY) license (http://creativecommons.org/licenses/by/4.0/).
Share and Cite
MDPI and ACS Style
Rötzer, N.; Schmidt, M. Decreasing Metal Ore Grades—Is the Fear of Resource Depletion Justified? Resources 2018, 7, 88. https://doi.org/10.3390/resources7040088
AMA Style
Rötzer N, Schmidt M. Decreasing Metal Ore Grades—Is the Fear of Resource Depletion Justified? Resources. 2018; 7(4):88. https://doi.org/10.3390/resources7040088
Chicago/Turabian StyleRötzer, Nadine, and Mario Schmidt. 2018. "Decreasing Metal Ore Grades—Is the Fear of Resource Depletion Justified?" Resources 7, no. 4: 88. https://doi.org/10.3390/resources7040088
Note that from the first issue of 2016, this journal uses article numbers instead of page numbers. See further details here.