Article

Building a Sustainability Benchmarking Framework of Ceramic Tiles Based on Life Cycle Sustainability Assessment (LCSA)

by
Anna Maria Ferrari
1,
Lucrezia Volpi
1,
Martina Pini
1,
Cristina Siligardi
2,
Fernando Enrique García-Muiña
3 and
Davide Settembre-Blundo
3,4,*
1
Department of Sciences and Methods for Engineering, University of Modena and Reggio, Emilia, Reggio Emilia 42122, Italy
2
Department of Engineering “Enzo Ferrari”, University of Modena and Reggio, Emilia, Modena 41125, Italy
3
Department of Business Administration (ADO), Applied Economics II and Fundaments of Economic Analysis, Rey-Juan-Carlos University, Madrid 28032, Spain
4
Gruppo Ceramiche Gresmalt, Sassuolo 41049, Italy
*
Author to whom correspondence should be addressed.
Resources 2019, 8(1), 11; https://doi.org/10.3390/resources8010011
Submission received: 10 September 2018 / Revised: 10 December 2018 / Accepted: 27 December 2018 / Published: 4 January 2019

Abstract

:
The purpose of this paper is to determine indices of environmental, economic and social sustainability related to the Italian production of ceramic tiles in porcelain stoneware in order to contribute to the construction of a reference benchmarking useful to decision makers, designers and end users of ceramic tiles. To achieve this goal, this paper is based on the Life Cycle Sustainability Assessment (LCSA) framework that incorporates the three dimensions of sustainability with cradle-to-grave Life Cycle Assessment (LCA), Life Cycle Costing (LCC) and Social Life Cycle Assessment (S-LCA) tools. The study has shown that in the production of porcelain stoneware one of the major environmental problems, in addition to production in the strict sense, is the distribution system of the product to end users and, to a lesser extent but always significant, the process of supplying raw materials. Finally, it was highlighted that the joint use of the three impact assessment tools (LCA, LCC, S-LCA) requires further methodological work to avoid the risk of double counting of sustainability performance. This research has adopted a detailed methodological approach, both in the collection and in the processing of data, keeping the main phases of the production process separate. In this way, it has been possible to highlight that the major environmental criticalities are just beyond the “gate” of the ceramic factories, along the logistics chain. The study also proposes for the Italian ceramic sector not only indicators of environmental sustainability but also economic and social.

Graphical Abstract

1. Introduction

Sustainable development is one of the most important objectives of the European Union. Since the Rio Declaration of 1992 (Rio Declaration on the Environment. It is the reference point for defining and implementing sustainable development. The document is divided into 27 principles that establish rights, responsibilities and behaviours that each state must adopt for the global protection of the environment. (http://www.unesco.org/education/pdf/RIO_E.PDF)), sustainable development has increasingly become the main reference for the European Union, passing from the Treaty of 1997 (Amsterdam) (The Treaty of Amsterdam was adopted by the European Council in June 1997 and entered into force on 1 May 1999, ratified by all Member States. On the one hand, it consolidates the mechanisms established by the Maastricht Treaty and, on the other hand, it defines a series of priority social guidelines at Community level.) to the proposal for a Constitution of the European Union, signed in 2004 (Rome) (On 29 October 2004, the Treaty establishing a Constitution for Europe was signed in Rome but in reality, it is not a real Constitution but a basic Treaty in which the pre-existing Treaties are reorganized and transposed.) by the Heads of State and Government of the 25 Member States. The Gothenburg European Council (2001) defined the European Strategy for Sustainable Development by integrating the social and economic dimensions of the Lisbon Strategy (2000) (The Lisbon Strategy is the instrument through which the European Union has pursued the objective of making Europe the most competitive knowledge-based economy in the world, pursuing sustainable economic growth, creating new jobs and maintaining a good level of social cohesion.) with the environmental dimension. Now the European Union is committed to the implementation of the United Nations Agenda 2030 which, adopted by world leaders in 2015, constitutes the new framework for global sustainability and establishes 17 objectives for sustainable development. It is based on the need to be able to meet the needs of the present generation without compromising the ability of future generations to meet theirs. A responsible use of natural resources, minimizing the impact on the environment but also energy saving and sustainable energy production, are crucial elements for sustainable development. Having sustainability indicators is very important in order to make the result of an analysis or the effects of a forecast easily understandable, while at the same time preserving the scientific nature of the analysis as much as possible. These indicators, of course, vary according to the type of system analysed and must represent in a simple and complete way the interactions of the system under analysis with the environmental, social and economic sectors. The state of sustainable development between different systems can be achieved by horizontally comparing the sustainability indices through a “benchmarking” activity.
Environmental benchmarking is a management tool developed in the United States in the early 1980s [1]. In general, benchmarking means getting closer to the process of understanding and adapting best practices, by oneself or by other organizations, in order to improve business performance [2]. This process develops through a close comparison with the competition and is, therefore, a useful tool designed to strengthen the company’s competitiveness. One of the most innovative corporate environmental management tools is environmental benchmarking. The objectives of environmental benchmarking aim to: improve the environmental performance of a company or a sector and therefore relations with stakeholders [3]; set objectives for new environmental performance, improve production processes, management and human resources [4]; promote competitiveness between companies in the areas of the environment, energy, safety and health [5]; provide companies with support for investment decisions in various areas [6]; enhance the information that companies already prepare for legislative obligations [7]. Recently, some organizations have moved towards the application of benchmarking techniques to the environmental field as well [8]. This declination of the tool is generally used by trade associations or industrial districts to identify, analyse, adapt and share the best industry practices available and already implemented in cases of excellence [9]. One of the first examples of environmental benchmarking has been applied to the ceramic industry in Italy, where the association of ceramic tile producers (Confindustria Ceramica) has promoted the industry-average environmental product declaration (EPD) as a way of promoting the environmental performance achieved by the sector at international level [10]. The EPD is a voluntary report prepared according to international standards (ISO 14025:2006) that highlights the environmental performance of a product or service [11]. The measurement of these performances is carried out using the Life Cycle Assessment (LCA) methodology. The industry-average EPD of Italian ceramics is, therefore, an important benchmarking tool as it represents the environmental impact of the production of Italian ceramic tiles. However, the industry-average EPD brings together some important steps in the production process in a single module: raw materials supply, transport up to the factory plant, manufacturing processes and waste processing. Such aggregation does not allow for a more detailed analysis of some important phases of the production process which can potentially have a significant environmental impact. Finally, there is still a lack of indicators of economic and social impact in order to include all three pillars of sustainability from a holistic perspective.
Benchmarking can be considered a systemic learning process based on the continuous comparison of the operating methods of an organization with those of other operators in the same or related sectors. Benchmarking uses a series of indicators (benchmarks) that are the performance standards suitable to identify practices that lead to higher performance to become the new best in class [12]. Benchmarking suggests strategies for achieving performance improvement. Therefore, the main objective of benchmarking is to identify areas for improvement and to stimulate change [13]. This change can be achieved by identifying and adopting “best practices.” In fact, the advantage of Benchmarking is that, through this operating mode, it is possible to identify the practices that lead to a higher performance and integrate them, after appropriate adaptations, with one’s own organization [14]. Benchmarking is therefore an effective way to photograph and conduct an in-depth analysis of the world outside the organization to find a better alternative, a reference point for measuring or evaluating something but it is not an attempt to invent something new.
They can be of two types: quantitative (e.g., time, weight, cost, etc.) but also qualitative (quality of performance: represent value judgements about the conditions and objectives of effectiveness of the analysed variable and for this reason they are delicate and difficult to determine and/or detect.) [15]. Benchmarking are useful for understanding and comparing the various processes of different companies or business units; they must be representative and evaluated through standardized indicators and observations. The standardization of indicators is fundamental in order to be able to assess the various characteristics of the processes under analysis in a comparative manner. All participants in the comparison will thus be able to compare the profile of the various processes in a standardized way, using unambiguous quantitative indicators. Benchmarking, therefore, uses indicators, also defined as performance standards, creating a comparison for the identification of best practices, in order to define a new best in class standard. For example, the construction industry is increasingly sensitive to requests for environmental performance documents for products used in buildings. Building certification organizations and procedures such as Leed (USA), BREEAM (English and Scandinavian), DGNB (German) and HQE (French) are integrating environmental sustainability parameters based on Life Cycle Assessment analyses [16].
Therefore, in this context, we can consider benchmarking as a valid sustainability management tool that allows to help an organization to continuously improve its processes by learning from the experience of others through specific indicators of reference. Benchmarking also prevents the company from institutionalizing rituals and procedures that have contributed to success in the past but which in a rapidly changing world require continuous evolution.
Sustainability for any type of enterprise and organization can be defined according to the concept of the Triple Bottom Line (TBL), coined by John Elkington [17]. Elkington argues that companies should work simultaneously on three different budget lines: the typical one, based on profits and losses, the one linked to civil society and the one linked to the environment. In other words, the sustainable development of a company is the process of continuous improvement of its economic (profit), environmental (planet) and social (people) performance and sustainability is nothing more than the result of managing this process. From this point of view, it is essential for any organization to define long-term and very long-term objectives first of all but it is equally important to continuously measure the distance from these objectives and the consistency of its actions. Measuring and managing sustainability thus become fundamental steps in the pursuit of a corporate strategy [18].
Therefore, for the organization, the first step in the definition of a policy aimed at sustainability is the mapping of all the factors that actually or potentially affect the selectivity in order to define the improvement objections aimed at minimizing the resources used and/or maximizing value [19]. The most complex part of this process concerns the selection of appropriate indicators to monitor performance against the objectives and performance levels that the organization wants to achieve. These indicators are referred to as Sustainability Performance Indicators (SPIs), precisely because of their function and the key role they play in relation to the pursuit of sustainability strategies [20]. In line with the three pillars of sustainability, the SPIs should also cover the environmental, economic and social aspects of sustainability. In more detail:
  • Environmental performance indicators (KePIs) [21]: Energy consumption, Global warming, Human toxicity, Air pollution, Ozone depletion, Resource depletion etc.;
  • Microeconomic performance indicators [22]: Income from sales, Value added, Gross operating profit (Ebitda), Cash flow, etc.;
  • Social performance indicators [23]: Community engagement, Access to resources, Social responsibility, Fair salary, Hours of work, etc.
A way to determine the sustainability performance indicators of a product/process is the Life Cycle Sustainability Assessment (LCSA), which measures the performance of a product/process with respect to TBL [24]. The LCSA is an interdisciplinary integration framework of different models rather than a model in itself. Indeed, it combines three different tools for environmental (LCA—Life Cycle Assessment) [25], economic (LCC—Life Cycle Costing) [26] and social (S-LCA—Social Life Cycle Assessment) [27] impact assessments. The LCA, LCC and S-LCA results will be discussed in Section 3.1, Section 3.2 and Section 3.3 respectively.
Currently there is no real application approach, in fact, the implementation attempts concern the selection of the three different models (LCA, LCC and S-LCA), which usually takes place according to the sustainability objective to be achieved with a bottom-up approach.
In the European manufacturing context, the Italian ceramic industry is one of the sectors most aware of environmental sustainability [28]. Various initiatives have been undertaken over the years at the level of the production sector. In addition to the certification activities and sustainability policies developed by individual companies, the Italian ceramics sector carries out collective projects and initiatives, with reference to the district of Sassuolo, the territorial area between the provinces of Modena and Reggio Emilia (northern Italy) where the greatest presence of ceramic factories is concentrated [29]. For over 40 years, the Italian ceramic tiles industry has held international leadership in terms of quality and value. In 2016, this sector consisted of about 147 companies employing 8956 people for a production of 416 million square metres. The total turnover thus exceeded 5.4 billion Euros, of which approximately 4.6 billion Euros derived from exports (equal to 85% of turnover) and 829 million Euros from sales on the national territory [30].
The main type of production in the Italian ceramic industry is porcelain stoneware; in 2017, 422 million square metres were manufactured, representing 86% of total production [30]. Porcelain stoneware is a product with a high sintering index obtained from natural raw materials (illitic kaolinitic clays, sodium-potassium feldspars and feldspar sands) with a low chromophoric oxide content (iron and titanium) [31] complete greification of the product allows very low porosity and many mechanical properties [32]. The most recent and exhaustive studies on the sustainability of traditional ceramic tile production (with reference to the standard EN 14411–ISO 13006) are the environmental impact assessments (LCA), carried out on Portuguese [33] and Spanish [34] products. All these authors adopt as functional unit 1 m2 of ceramic tiles and agree in concluding that the most impactful phase at environmental level is that of manufacture (cradle-to-gate). Instead, there is no evidence in the scientific literature of economic (LCC) and social (S-LCA) impact studies on ceramic tiles. So, there is a lack of integrated analysis of the sustainability performance of ceramic tile production.
Based on this theoretical framework, we formulate the following Research Questions (RQ 1 and RQ 2):
  • RQ 1: Can LCSA analysis of the environmental, economic and social performance of leading firms in a sector define a framework of Sustainability Performance Indicators (SPIs)?
  • RQ 2: Can the Sustainability Performance Indicators (SPIs) framework obtained with the LCSA be considered a valid benchmark for the ceramic sector?
In order to answer these research questions, this paper is aimed to pursue the objective of defining a set of environmental, economic and social performance indicators for a representative sample (15%) of Italian porcelain stoneware tile production, manufactured by the leading firms. The purpose of all these indicators is to build a benchmarking of Sustainability Performance Indicators (SPIs) for porcelain stoneware and to fill in the lack of indicators of economic and social impact for the ceramic sector.

2. Methods and Tools

2.1. Life Cycle Assessment

The Life Cycle Assessment is a methodology for evaluating the environmental impacts related to a product or process throughout its whole life cycle, defined by the Society of Environmental Toxicology and Chemistry (SETAC) [35] and standardised by the ISO 14040-14044 [36,37]. The importance of the Life Cycle Assessment and the Life Cycle Thinking, in general, is recognized nowadays to the point that these methodologies have become supporting tools for several international and European policies such as the waste management [38].

2.1.1. Goal and Scope Definition

The goal of the Life Cycle Assessment is the evaluation of the environmental impacts of porcelain stoneware tiles manufactured in the Italian ceramic district during the 2016 reference year.
The functional unit is the production of 52,455,661 m2 of a product used for covering floors and walls; the reference flow is represented by 52,455,661 m2 of porcelain stoneware tiles. This value has been selected because the present work is focused on the assessment of the environmental impact of the Italian ceramic district manufacturing and the selected area represents the annual production of porcelain stoneware tiles in the district during the 2016 reference year.
The environmental analysis is based on a “from cradle to grave” approach. The system boundaries (Figure 1) extend from the raw materials extraction to the finished product manufacturing, including packing, final distribution, installation and end of life. The production, transport and disposal of facilities have been considered as well as the environmental burdens related to the production of chemicals and/or other auxiliary materials used to produce the glazed porcelain stoneware tiles have been also included in the present study.

2.1.2. Life Cycle Inventory

The Life Cycle Inventory was based on an in-depth study of the state of the art of manufacturing process and then the production process of a porcelain stoneware tile was described at each stage of the process as shown in Figure 1. Based on the flow chart, the mass balance has been defined, considering the emissions, the production waste and the water consumption. The inventory has been modelled in SimaPro® 8.5.2.2 [39] software by PRé Consultants, taking the Ecoinvent 3.4 [40] database as a reference especially for background processes related to natural gas, electricity, heat, transport, infrastructure, machinery and waste treatments.
Primary data, referring to atmospheric emissions, water, thermal and electric energy consumptions and production of both raw and fired scraps have been collected directly from measurements of consumption and emissions in the production departments and from the company archives, as well as from the Integrated Environmental Authorizations collected by Italian ceramic producers. When primary data have been missing, the study has been completed based on information obtained from both previous LCA studies concerning the ceramic tile manufacture (e.g., machinery) and the Ecoinvent database version 3.4 [40], especially for background processes, has been used. Indeed, the Ecoinvent database provides data and information about processes and activities, detailing their geographical location in order to locate inventory processes in the space and in the market. In some cases, the level of detail refers to vast regions (for example Europe without Switzerland, Canada without Quebec), in other cases to a specific country. In this analysis, processes referred to the Italian context have been used when available, namely, those related to the electrical energy mix, otherwise the European context has been chosen as reference.
The transportation and the recycling process of the inert waste material are also taken into account; the allocation approach used for the end of life process is based on a mass criterion that the ISO Standards identifies as one of the preferable criteria to adopt when it is not possible to divide the process into different sub-processes [41].
Details of the main data collected during the inventory analysis are included in Appendix A at the end of the paper.

2.1.3. Impact Assessment Methodology

The assessment of the glazed porcelain stoneware tiles life cycle has been carried out with IMPACT 2002+ [42]. This method has been chosen for the reason that it proposes a combination of a midpoint and an endpoint approach; the former reduces the degree of uncertainty but may be less helpful in decision making than the latter. All midpoint scores are related to the four damage categories Human health, Ecosystem quality, Climate change and Resources. Furthermore, normalization can be performed either at the midpoint or at the endpoint level. IMPACT 2002+ method has been modified considering both the midpoint level and the endpoint levels. In order to use a more representative index of the system considered and to take into account some shortcomings and limitation of the method, the authors have implemented the following modifications [43]:
  • Land occupation impact category has been estimated using basic indicators of both land occupation and transformation;
  • Mineral extraction impact category has been characterised considering some additional resources such as silver, gravel, sand, lithium, bromine and water in ground derived from the category minerals of Eco-indicator 99 [44] with the same characterisation factors;
  • Human health indoor and Human health local categories have been introduced in order to evaluate, with a preliminary method, the impacts arising from air emissions, on both workers (indoor scale) and people living in the area surrounding the factories (local scale). However, as these two categories of damage, are not indicated in the tables on the following pages, because they only show the impact categories. In particular, the impact categories Non-carcinogens, indoor, Carcinogens, indoor, Respiratory organics, indoor and Respiratory inorganics, indoor are linked to the Human health, indoor damage category; the impact categories Non-carcinogens, local, Carcinogens, local, Respiratory organics, local and Respiratory inorganics, local are linked to the Human health, local damage category. The method used for the evaluation of indoor and local emissions has been build following Eco-indicator 99 framework and the Gaussian Plume Modelling [45], a stationary model used to simulate the air pollutants dispersion into air emitted from a chimney.
    The damage local factor (DFloc), expressed in DALY/kg, has been calculated by dividing the damage factor of Eco-indicator 99 of the analysed substance, (DFEI99), by the fate factor (FFEI99) and the density population (PDEI99) and multiplying the obtained value by local factor (FFloc) and local population density (PDloc, calculated as the average population density of the ceramic district municipalities). The equation is the following:
    DFloc = DFEI99 × FFloc × PDloc/FFEI99/PDEI99
    where FFloc = Cloc /Eloc is the local fate factor, Eloc is the local emission value (the hypothesized emitted area is 3 × 10⁸ m2, corresponding to the Sassuolo district area), calculated by Eco-indicator 99 formula and Cloc is the local concentration, calculated by Gaussian Plume Modelling formula. The same equation has been used for the evaluation of indoor emissions by replacing FFloc and PDloc with FFind and PDind.
  • Production costs category has been added in order to perform the LCC along with LCA. In particular, the characterisation and damage factors have been set at 1, the normalization factor is represented by the inverse of a European citizen average annual wage and the weighting factor has been set at zero in order to not increase the total final environmental damage and therefore keep separate the two different assessments.

2.2. Life Cycle Costing and Evaluation of Externalities

Another life-cycle based methodology, firstly adopted by the US Department of Defence in the mid-1960s for the acquisition of high-cost military equipment, is the Life Cycle Costing (LCC) [46]. The LCC is defined as the “methodology for the systematic economic evaluation of life cycle costs over a period of analysis, as defined in the agreed scope” by the International Standard for the life-cycle costing is the BS ISO 15686-5:2008 “Buildings and constructed assets—Service life planning—Part 5: Life cycle costing” [47]. The Life Cycle Costing represents a useful complement to the Life Cycle Assessment in order to drive the market towards more sustainable products, taking into consideration both the price and information about costs incurred in the use and end-of-life phases [48]. In addition, the evaluation of the externalities can be assessed. The external costs represent the monetized costs imposed on society of direct and indirect damage caused by pollutants emitted during the manufacture of a product or rendering of services, which are not paid by the producers or the consumers nor considered in production or consumption decisions [49]. The main challenges in this analysis are related to the quantification of the external costs, often very difficult and unclear and their adequate translation into monetary values.
For economic evaluation (LCC) all internal costs related to the porcelain stoneware tiles production, primary data from the analysis of the financial statements of Italian ceramic companies filed with the Chambers of Commerce of Modena and Reggio Emilia, have been collected. In this evaluation, the “from cradle to gate” approach has been adopted hence, only the internal production costs have been assessed. In future research steps, the system boundaries will be extended in order to consider the “from cradle to grave approach” also for the LCC, as suggested by Klöpffer [48]. In the modelling of the system, it has been considered that the raw waste and a certain amount of unused water were reintroduced in the production process given an environmental credit. All primary data refer to the year 2016.
For LCC Inventory the following cost items have been considered:
  • expenses for goods and services;
  • change in raw mat., consume, goods stock;
  • for use of third parties’ assets;
  • cost of human resources;
  • other operating expenses;
  • amortization and depreciation;
  • provisions for risks and others;
  • financial income and charges;
  • extraordinary earnings and charges;
  • taxes;
  • the result of third parties.
In addition to the internal costs, also the evaluation of the externalities has been carried out by using the EPS 2015dx assessment method, implemented in SimaPro, considering the entire life cycle of the tiles. For both LCC and evaluation of externalities, the same functional of the LCA have been adopted.

2.3. Social Life Cycle Assessment

The third dimension of sustainability is the social one; evaluating social sustainability means analysing and estimating both positive and negative impacts of a product or process on the society [50]. The reference document for the social evaluation is the Guidelines for social life cycle assessment of products, published by the United Nations Environment Programme (UNEP) in 2009; the Guidelines are in line with the ISO 14040-14044 and follow the same four-step framework of the LCA. They provide a skeleton for the stakeholder engagement and social assessment; a detailed description of stakeholder groups, impact categories and subcategories that can be considered in the analysis is given, not expecting to provide an exhaustive overview of the system [51].
However, collecting data about the social conditions related to the manufacturing, use and end of life of a specific product is difficult because the supply chain often involves a great number of stakeholders in different countries with different working and living conditions and furthermore there is sometimes a lack of transparency in these supply chains. Moreover, social aspects are often evaluable in a qualitative way and there are some difficulties in translating them into quantitative or otherwise comparable indicators. In order to overcome this obstacle and provide detailed information on supply chain human rights and working conditions, the Social Hotspots Database (SHDB) was launched in 2009, developed by New Earth. The SHDB is a tool for identifying, prioritizing the social hotspots and evaluating the potential impacts for the specific sector related to the analysed product, in a specific country. The SHDB is based on a worker hours model derived from the Global Trade Analysis Project, founded on annual wage payments and wage rates by country and sector; it covers 22 social themes, 113 countries and 57 economic sectors [52]. This tool has been used for a preliminary assessment of the sustainability related to the production of the porcelain stoneware tiles.

2.4. Life Cycle Sustainability Assessment

Assessing the sustainability in a holistic and correct manner is, therefore, a big challenge because of the complexity of each evaluation and the difficulty of integrating and weighting the three dimensions within the framework of sustainability. In addition, Klöpffer underlines the importance of the Life Cycle Thinking as a requirement for measuring sustainability and the importance of taking into account all the three pillars because improving only a phase of the life cycle or a single dimension without considering the possible negative effects in other phases or dimensions does not mean improving sustainability [48]. The methodological framework proposed for the Life Cycle Sustainability Assessment (LCSA) relies on the validity of the following conceptual formula, formalised by Klöpffer:
LCSA = LCA + LCC + S-LCA
The author identifies two options for developing a Life Cycle Sustainability Assessment. The first option plans to perform three independent life cycle assessment without weighting the dimensions; this approach ensures more transparency and clear information on the results but it does not provide compensation nor integration between the three aspects of sustainability. In the second one, impact categories of LCC and S-LCA are added to the typical impact categories of LCA, based on the same Life Cycle Inventory (LCI) model. In the present work, the LCA, LCC and S-LCA assessments are maintained separate, according to the first option; in future insights of the analysis, an integration of the three assessments will be developed in order to define a comprehensive indicator for the sustainability performance.

3. Results and Discussion

3.1. Life Cycle Assessment

3.1.1. Characterization

The assessment of the environmental damage has been made considering the process phases and the annual ceramic tiles production of 52,455,661 m2. Table 1 shows the characterized LCA results at a midpoint level of the analysis.
The results are presented category by category; in order to perform an in-depth analysis, the substance that contributes more to the environmental impact is identified for each impact category. It is not possible to see this further information directly from the table of the results but it is necessary to select each damage category inside the software calculation and identify the reference substance. These data are shown in the form of additional tables that, for the sake of brevity, cannot be presented. In addition, the process responsible for the emission or consumption of each specific substance is indicated with the Ecoinvent name for scientific reasons and accuracy; anyway, a brief description of the process is provided in order to better contextualize it within the system. The results indicate that:
  • the damage in Carcinogens impact category (51,343,182.55 kg C2H3Cl eq) is mainly due to the substance Hydrocarbons, aromatic in the air (62.96%) generated during the tiles production process;
  • the damage in Non-carcinogens impact category (26,955,635.54 kg C2H3Cl eq) is mainly due to the substance Arsenic in water (52.69%) related to the process Waste cement, hydrated {CH} |treatment of, residual material landfill| APOS (Allocation at the Point of Substitution), U that concerns the waste treatment of filter dust arose during the production phase;
  • the damage in Respiratory inorganics impact category (1,427,636.50 kg PM2.5 eq) is mainly due to the substance Particulates, <2.5 μm in air (34.38%) related to the process Electricity, high voltage {ID} |electricity production, lignite| APOS, U used for the production of the adhesive mortar for the installation of the tiles;
  • the damage in Ionizing radiation impact category (8,775,127,595 Bq C-14 eq) is mainly due to the substance Carbon-14 in the air (53.56%) related to the process Low-level radioactive waste {CH} |treatment of, plasma torch incineration| APOS, U referred to the diesel used primarily for the distribution of the tiles;
  • the damage in Ozone layer depletion impact category (125.91 kg trichlorofluoromethane, CFC-11 eq) is mainly due to the substance Methane, bromotrifluoro-, Halon 1301 in air (71.13%) related to the process Petroleum {RoW} |petroleum and gas production, on shore| APOS, U referred to the production of the diesel used primarily for the distribution of the tiles;
  • the damage in Respiratory organics impact category (495,585.56 kg C2H4 eq) is mainly due to the substance NMVOC (non-methane volatile organic compounds), unspecified origin in air (74.43%) related to the process Road {CH} |construction| APOS, U referred to the construction and maintenance of the roads;
  • the damage in Aquatic ecotoxicity impact category (3.04 × 10¹¹ kg TEG water (triethylene glycol equivalents into water)) is mainly due to the substance Aluminium in water (62.49%) related to the process Filter dust from Al electrolysis {CH} |treatment of filter dust from Al electrolysis, residual material landfill| APOS, U that concerns the waste treatment of filter dust arose during the production phase;
  • the damage in Terrestrial ecotoxicity impact category (3.64 × 10¹⁰ kg TEG soil) is mainly due to the substance Zinc in soil (52.58%) related to the process Tyre wear emissions, lorry {RoW} |treatment of| APOS, U referred to the waste treatment of lorries wear tyres;
  • the damage in Terrestrial acid/nutri impact category (20,109,067.27 kg SO2 soil) is mainly due to the substance Nitrogen oxides in the air (74.62%) related to the process Transport, freight, inland waterways, barge {RER} |processing| APOS, U for the provision of the raw materials by barge;
  • the damage in Land occupation impact category (256,577,750.7 m2org.arable) is mainly due to the substance Occupation, an industrial area in raw (48.82%) concerning the soil occupation by the facilities;
  • the damage in Aquatic acidification impact category (5,212,553.65 kg SO2 eq) is mainly due to the substance Sulphur dioxide in the air (53.09%) related to the process Transport, freight, sea, transoceanic tanker {GLO} |processing| APOS, U for the distribution of the tiles;
  • the damage in Aquatic eutrophication impact category (198,727.83 kg PO4 P-lim) is mainly due to the substance Phosphate in water (51.66%) related to the process Sulfidic tailing, off-site {GLO} |treatment of| APOS, U related to the landfilling of the copper that comes from the factory for the production of adhesive mortar used for the installation;
  • the damage in Global warming impact category (1,248,606,269 kg CO2 eq) is mainly due to the substance Carbon dioxide, a fossil in the air (93.04%) related to the tiles production process;
  • the damage in Non-renewable energy impact category (1.44 × 10¹⁰ MJ primary) is mainly due to the substance Oil, crude in raw (57.07%) related to the process Petroleum {RoW} |petroleum and gas production, on shore| APOS, U referred to the production of the diesel used for the distribution of the tiles;
  • the damage in Mineral extraction impact category (1,216,648,100 MJ surplus) is mainly due to the substance Water, turbine use, unspecified natural origin, IT in raw (59.59%) related to the process Electricity, high voltage {IT} |electricity production, hydro, run-of-river| APOS, U used for the tiles production process;
  • the damage in Renewable energy impact category (1,744,976,390 MJ) is mainly due to the substance Energy, gross calorific value, in biomass in raw (61.64%) related to the process Coconut, dehusked {PH} |coconut production, dehusked| APOS, U used for the production the soap required in the used phase;
  • the damage in Non-carcinogens, indoor impact category (2.44 kg C2H3Cl eq) is mainly due to the substance Formaldehyde, indoor in the air (99.33%) related to the air emissions generated by the tiles production process;
  • the damage in Respiratory organics, indoor impact category (0.82 kg C2H4 eq) is mainly due to the substance Formaldehyde, indoor in the air (68.13%) related to the air emissions generated by the tiles production process;
  • the damage in Respiratory inorganics, indoor impact category (0.70 kg PM2.5 eq) is mainly due to the substance Nitrogen oxides, indoor in the air (62.11%) related to the air emissions generated by the tiles production process;
  • the damage in Carcinogens, indoor impact category (307.95 kg C2H3Cl eq) is mainly due to the substance Hydrocarbons, aromatic, indoor in the air (99.86%) related to the air emissions generated by the tiles production process;
  • the damage in Non-carcinogens, local impact category (1,176,960.06 kg C2H3Cl eq) is mainly due to the substance Formaldehyde, local in the air (99.34%) related to the air emissions generated by the tiles production process;
  • the damage in Carcinogens, local impact category (148,436,418.4 kg C2H3Cl eq) is mainly due to the substance Hydrocarbons, aromatic, local in the air (99.86%) related to the air emissions generated by the tiles production process;
  • the damage in Respiratory organics, local impact category (427,021.35 kg C2H4 eq) is mainly due to the substance Formaldehyde, local in the air (70.54%) related to the air emissions generated by the tiles production process;
  • the damage in Respiratory inorganics, local impact category (337,379.13 kg PM2.5 eq) is mainly due to the substance Nitrogen oxides, indoor in the air (62.11%) related to the air emissions generated by the tiles production process.

3.1.2. Damage Assessment

In the previous paragraph, the midpoint approach has been adopted with the detailed analysis of each impact category (see Table 1); in order to evaluate the environmental impacts on both a midpoint and an endpoint level, the results in terms of damage categories are also considered. These two complementary evaluations are assessed with the aim of giving a comprehensive evaluation of the environmental damage, considering both the impact earlier and at the end of the cause-effect chain. The assessment of the environmental damage has been made considering the process phases and the annual ceramic tiles production of 52,455,661 m2. Table 2 shows the LCA results at an endpoint level of the analysis.
The Damage Assessment analysis highlights that:
  • the damage in Human health category (1221.61 DALY) is primarily caused by the substance Particulates, >2.5 μm in air (28.51%); the processes most responsible for this impact are the distribution of ceramic tiles to the customer (23.01%), the manufacturing process (19.38%), the installation phase (19.01%) the supply of raw materials for the mixture (15.75%) and the use phase (13.32%);
  • the damage in Ecosystem quality category (603,753,996.9 PDF*m2*years) is primarily caused by the substance Zinc in soil (25.11%); the processes most responsible for this impact are the distribution of ceramic tiles to the customer (31.07%), the soil occupation by the factories (22.59%), the use phase (19.60%) and the supply of raw materials for the mixture (10.57%);
  • the damage in Climate change category (1,248,606,269 kg CO2 eq) is primarily caused by the substance Carbon dioxide, fossil in air (93.04%); the processes most responsible for this impact are the manufacturing process (36.73%), the distribution of ceramic tiles to the customer (23.03%), the installation phase (14.20%), the supply of raw materials for the mixture (12.51%) and the use phase (12.36%);
  • the damage in Resources category (1.56 × 10¹⁰ MJ primary) is primarily caused by the substance Oil, crude in raw (52.62%); the processes most responsible for this impact are the distribution of ceramic tiles to the customer (30.64%), the installation phase (20.80%), the supply of raw materials for the mixture (15.86%), the use phase (15.73%) and the manufacturing process (14.99%);
  • the damage in Human health, indoor category (0.00136 DALY, Disability-Adjusted Life Years) is primarily caused by the substance Hydrocarbons, aromatic, indoor in the air (63.29%); this impact is related to the air emission during the manufacturing process;
  • the damage in Human health, local category (655.99 DALY) is primarily caused by the substance Hydrocarbons, aromatic, local in the air (63.28%); this impact is related to the air emission during the manufacturing process;
  • the damage in Renewable energy category (1,744,976,390 MJ) is primarily caused by the substance Energy, gross calorific value, in biomass in raw (61.64%); the processes most responsible for this impact are the use phase (56.26%), the manufacturing process (20.73%) and the installation phase (10.98%).
Damage assessment results are displayed also in Figure 2.

3.1.3. Single Score

In order to obtain a total, normalized and weighted score referred to the process, also the Single Score assessment has been performed. With the weighting step, the result of each damage category is multiplied by specific factors that attribute different relevance to the categories. Weighting is an optional phase, useful because the final score allows to easily make a comparison between products and processes and to facilitate the communication of the results. Table 3 shows the results of the Single Score analysis.
The Single Score analysis highlights that the total damage is 537.67 kPt, caused by 32.04% to Human health, 23.45% to Climate change, 19.11% to Resources, 17.20% to Human health, local, 8.20% to Ecosystem quality and 3.57 × 10⁻⁵% to Human health, indoor. The production process is the main responsible for the total damage (35.40%) followed by the distribution of the tiles to the customer (21.17%), the installation phase (14.05%), the supply of raw materials for the mixture (11.88%) and the use phase (11.78%). Single Score evaluation results are displayed also in Figure 3.

3.1.4. Uncertainty and Sensitivity Analysis

In the present work, an evaluation of data uncertainty has been carried out with Monte Carlo (MC) simulation, one of the most used stochastic model for the evaluation of the uncertainty of LCI parameters [53]. The MC analysis has been performed with 1000 iterations at the 95% confidence level by using SimaPro, IMPACT 2002+ assessment method and considering the same system and functional unit of the LCA. Each unit process of the Ecoinvent database is provided with a specification of its uncertainty so it is possible to run the simulation [54]; it should be noted that the uncertainty is related only to the database processes and not to the amount with which each process is allocated in the analysed system.
The results of the MC simulation are illustrated in Table 4 that shows the mean, the median, the standard deviation, the coefficient of variability (CV, that expresses the ratio between the standard deviation and the mean and is useful for evaluating the relative magnitude of the uncertainty), the 2.5th and 97.5th percentile (2.5% and 97.5% respectively).
The results show that the uncertainty mainly affects Ionizing radiation, Non-carcinogens, Aquatic ecotoxicity and Aquatic eutrophication impact categories (CV: 77.0%, 62.6%, 59.6%, 47.4% respectively). A lower degree of uncertainty is introduced into Ozone layer depletion, Mineral extraction, Terrestrial ecotoxicity and Respiratory organics scores (CV: 32.8%, 21.1%, 13.0%, 10.4% respectively) while Non-renewable energy, Aquatic acidification, Terrestrial acid/nutria, Respiratory inorganics, Carcinogens, Land occupation and Global warming are affected less by uncertainty (CV: 9.4%, 7.7%, 6.7%, 6.0%, 5.9%, 5.5%, 3.4% respectively). In particular, for the four most affected categories, the substances that mostly contribute to the environmental damage have been identified (with IMPACT 2002+ assessment method) together with their coefficient of variation:
  • for Ionizing radiation impact category, the impact is mainly due to the substances Carbon-14 in air (CV: 32%) and Radon-222 in air (CV: 160%);
  • for Non-carcinogens impact category, the impact is mainly due to the substance Arsenic in water (CV: 166%);
  • for Aquatic ecotoxicity impact category, the impact is mainly due to the substances Aluminum in water (CV: 64%) and Copper in water (CV: 59%);
  • for Aquatic eutrophication impact category, the impact is mainly due to the substances Phosphate in water (CV: 43%) and COD, Chemical Oxygen Demand in water (CV: 36%).
The selection of the assessment method represents another critical point of the LCA and involves a certain level of uncertainty; therefore, each assessment method considers different impact and damage categories, is based on different pathways for the calculation of the factors and so provides different characterisation-damage assessment-normalisation and weighting factors.
In order to evaluate the incidence of the amendments implemented in IMPACT 2002+ method, a comparison between the original IMPACT 2002+ method and the modified one have been performed in terms of Single Score, as shown in Figure 4 (number 1 refers to the original IMPACT 2002+, number 2 to the modified IMPACT 2002+).
The results highlight that the changes affect mainly the production process (increase of 114%) especially due to the contribution to the environmental damage of the local emissions introduced in the modified method. This is an expected result because the original method does not consider the impact related to local and indoor emissions but only that on a European scale. Table 5 summarizes the increase of the environmental damage for each process, considering the two methods.

3.2. Life Cycle Costing and Evaluation of Externalities

3.2.1. Life Cycle Costing

Life Cycle Costing analysis has been performed considering the internal costs related to the tiles production sample analysed during 2016 and based on the financial statements 2016. The production costs are shown in Table 6, by cost items.

3.2.2. Evaluation of Externalities

In addition, the externalities related to the process under study have been assessed. Due to the IMPACT 2002+ method used for the environmental assessment does not allow to evaluate the external costs, a further analysis with the EPS 2015dx method has been performed. The EPS 2015dx endpoint method provides a single weighted score for the environmental load, based on a monetarization of all the impacts related to a product chain. The willingness to pay to restore environmental changes is the monetary measurement and the ELU (Environmental Load Unit), which correspond to one Euro environmental damage cost, is the unit of measurement.
Table 7 shows the weighting results obtained with EPS 2015dx calculation for the entire life cycle of the porcelain stoneware tiles. The results indicate that:
  • the total damage is 769.16 MPt (=106 ELU = 106 €) due to the distribution of ceramic tiles to the customer (29.66%), the installation phase (24.81%), the use phase (14.28%), the supply of mixture raw materials (13.92%) and the manufacturing stages (13.86%);
  • the damage category that mainly contributes to the total damage is Abiotic resources (68.78%), followed by Human health (30.52%), Ecosystem services (0.66%), Access to water (0.04%), Building technology (0.006%) and Biodiversity (0.002%).

3.3. Social Life Cycle Assessment

In order to carry out a preliminary social analysis, the Social Hotspots Database has been used, considering the construction sector in the Italian context. According to Benoît Norris, the choice of the functional unit should be based on physical properties and then translated into economic value using the price [34]. In particular, this economic value has to be converted into USD 2002 (US Dollars) because this is the reference unit of the Global IO model currently implemented in the SHDB. Therefore, in this study, the functional unit is represented by the economic value, in USD 2002, of the tiles production in 2016 (5,526,070,000 €), in order to consider the same functional unit of LCA and LCC. The results of the preliminary social analysis are shown in Table 8 in terms of impact and damage categories.
Further developments in the study will provide an in-depth analysis of the social dimension by following the indication of the UNI EN 16309:2014 that provides rules for the assessment of the social performance of new and existing buildings, adapting it to the ceramic tiles.
The results, shown in Table 8, indicate that:
  • the total damage is 1.46 × 10¹⁰ Pt, due to Health & Safety (46.39%) followed by Labor Rights & Decent Work (29.14%), Governance (13.93%), Human rights (6.56%) and Community Infrastructure (3.98%);
  • the substance responsible for the main impact in Health & Safety category is OHSTox: LYL airborne particulates: MR (30.43%) related to the process Construction/IT;
  • the substance responsible for the main impact in Labor Rights & Decent Work category is LR&DW:MW: migrant workers treated unfair (qualitative): VH (7.77%) related to the process Electricity/UA;
  • the substance responsible for the main impact in Governance category is Gov: Corruption: Overall Risk of Corruption: HR (48.76%) related to the process Construction/IT;
  • the substance responsible for the main impact in Human rights category is HR: High CZ: Overall Risk for High Conflict: VH (27.21%) related to the process Commerce/CN;
  • the substance responsible for the main impact in Community Infrastructure category is CI: Sanitation: No Access-total: HR (24.05%) related to the process Commerce/CN.
Legend:
  • OHSTox: Occupational Toxics & Hazards
  • LYL: Life Years Lost
  • LR&DW: Labor Rights & Decent Work
  • MW: Migrant Workers
  • Gov: Governance
  • HR: Human Rights
  • High CZ: High Conflict Zones
  • CI: Community Infrastructure
  • IT: ItalyUA: Ukraine
  • CN: China
  • MR: Medium Risk
  • HR: High Risk
  • VH: Very high risk

4. Sustainability Performance Indicators (SPIs) Framework

The Italian ceramic tile industry concentrates 80% of its production on an inter-municipal area of about 350 km2 known as “the ceramic district of Sassuolo”. In 2017, 145 Italian ceramic companies produced 422 million square metres of ceramic tiles, employing around 20,000 people. Of these 338 million square metres were exported to foreign markets [40]. The strengths of the Italian ceramic district are the ability to innovate and compact supply chain. It is in fact the continuous innovation in materials, design and product characteristics that has allowed us to reposition production firmly on the market segments with the highest added value and the lowest rate of competition, expanding the range of use of ceramics (indoor or outdoor and no longer just for bathrooms and kitchens). This innovative capacity is achieved thanks to a complete local supply chain with a strong capacity for interaction between the players who are part of it, from large companies to niche ones. The propensity for innovation of the Italian ceramic industry has made this sector a world reference in terms of technologies (plants and machinery), materials (glazes and inks for decoration, adhesives and additives for laying ceramic tiles) and design (Italian excellence fashion) [55].
At the same time, the Italian district has also developed an avant-garde regulatory framework in the field of the environment, health and safety of workers, which has become the reference for other countries with a great ceramic tradition in Europe (such as Spain and Portugal) and around the world [56]. Therefore, the world’s ceramic producers refer to the Italian ceramic district to acquire the best technologies, materials and the most advanced organizational procedures for manufacturing and logistics. The companies of the district have also enhanced the “made in Italy” in terms of social responsibility, thanks to the development and adoption of numerous best practices in manufacturing aimed at saving the environment and the territory [57]. In this context, the Italian ceramic industry is already a global reference point for technological innovation, design and environmental regulations, so the environmental and socio-economic assessment of a representative sample of ceramic tile manufacturers of porcelain stoneware in the district of Sassuolo, is a significant benchmark because it can provide a quantitative representation of the best current technologies in this industrial field.
In order to define reference values in terms of sustainability indices for the production and use of porcelain stoneware tiles, after having carried out the analyses to assess the impact on the population of tile producers taken from the sample, the calculation was repeated by changing the reference flow: from the total production (52,455,661 m2) to 1 m2 of ceramic tiles.
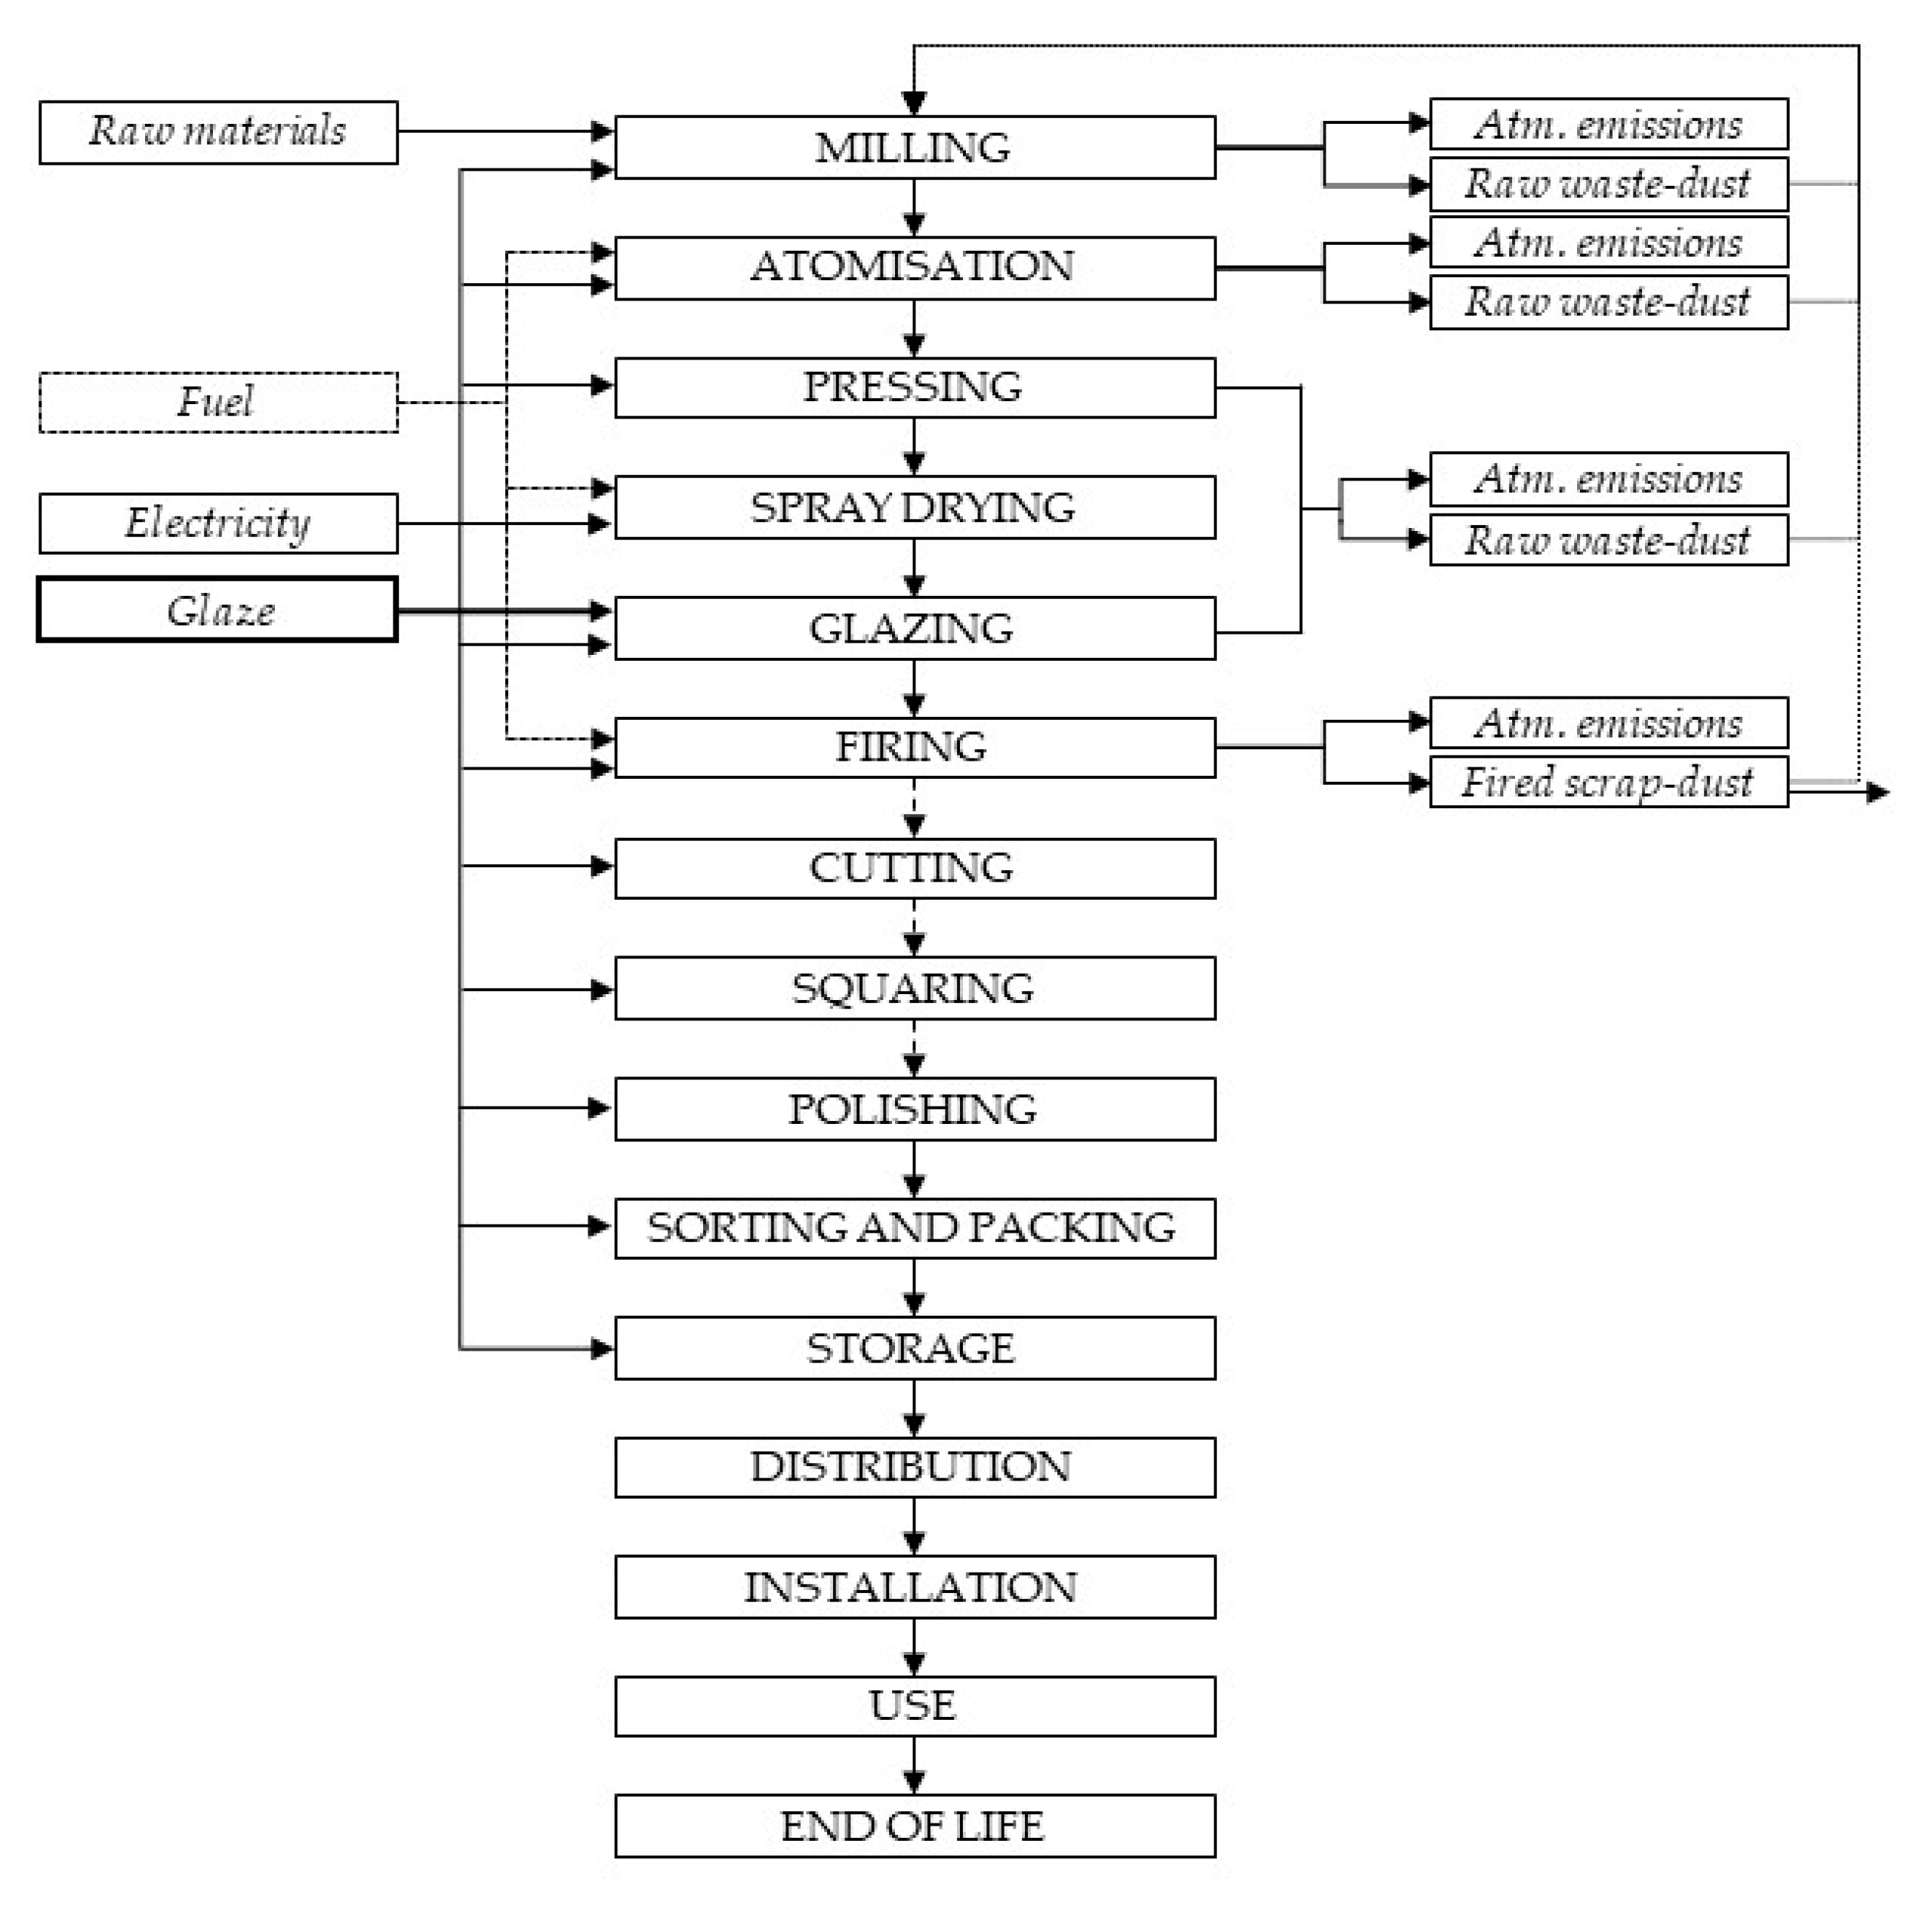
Table 9 crosses the environmental impacts, subdivided by impact category, with the three main phases of the production process: procurement of raw materials (for ceramic bodies and glazes), manufacturing (production and packaging), use and disposal (distribution, installation, use and end of life). The high level of detail of these indicators (impact category for each stage of the process) and their reference to 1 m2 of porcelain stoneware tiles, allows us to consider them as effective Environmental Performance Indicators (KePIs). In addition, the results related to the damage assessment (a) and single score (b) are shown in Table 10, with respect to 1 m2 of stoneware tiles in order to consider also the endpoint indicators as KePIs from an endpoint perspective.
As in the case of environmental impact, the reference flow has also been changed in the case of economic impact. The new LCC calculation made it possible to determine internal costs (broken down by cost factors) and externalities (broken down by impact categories) for 1 m2 of porcelain stoneware tiles. The new microeconomic performance indicators and externalities are shown in terms of internal costs (Table 11) and externalities (Table 12). As far as external costs are concerned, the results obtained from the processing of the economic performances of the manufacturing companies on a sample basis, mediate very different results. In fact, operational efficiency can be very different even between companies in the same industry and in the same district and this, of course, has an impact on the cost structure. For example, the purchasing power of factors of production (raw materials and labour) can differ according to company size and production volumes. On the contrary, external costs can be considered representative because they relate to the technologies used and the production process, which are standardized for the entire Italian ceramic industry.
With regard to the social dimension, the social performance indicators were determined at the midpoint level and endpoint level (Table 13); this is a preliminary assessment that will be investigated in more detail in further development of the study.
For the strategic planning of sustainable development, that is, to include the three dimensions of sustainability within the business model of each company, it will be necessary to plan and implement an action of engagement of shareholders, managers and stakeholders to set sustainability objectives (in the three dimensions: environment, economy and society) with respect to SPIs [20].
The world ceramic industry shows a tendency to organize itself in supply chains, clusters and districts, the district of Sassuolo in Italy and that of Castellón in Spain, are the most obvious paradigms of this trend for their production capacity and technological innovation. Other important ceramic clusters are located in Santa Catarina (Brazil), Monterrey (Mexico), Foshan (China), in addition to the cluster that is emerging between Tennessee and Kentucky (USA) thanks to the implementation of production units of Italian ceramic companies established to meet the strong demand for tiles in the American market. In common among these ceramic supply chains are the availability of raw materials (clays, feldspars, sands), abundance of water, ease of settlement and high demand for construction goods. Within these industrial networks, knowledge sharing [58] is widespread, that is, the exchange and accumulation of technical and managerial knowledge at district level. This creates a so-called “contextual knowledge” [59], that is, the basic knowledge of the district, which has also been the basic prerequisite for the construction of this benchmark of sustainability performance in the ceramic sector. This “stock of knowledge” [60] can then spread among district operators through direct observation for imitative purposes [61] to identify opportunities for growth and improvement and to set new targets for sustainability performance and best practices observed at sector level can be adapted and incorporated into individual company processes. In this way, the proposed framework can be a tool to support decisions by encouraging benchmarking between companies in the sector and the development and promotion of best practices. For example, when choosing alternative technological solutions, different organizational systems or alternative raw materials and supply conditions, the individual company can compare itself with the sustainability performance of the sector and decide whether to align itself with this target or whether to encourage further improvement. Finally, public institutions can also use the sustainability benchmark to support the definition of new industrial and social policies or the updating of existing ones.

5. Discussion

In this research, an in-depth environmental, economic and social impact assessment study was carried out, using the tools of the Life Cycle Sustainability Assessment (LCSA). Compared to other studies carried out on ceramic tiles, in this case, the inventory analysis separated the production process into phases in order to consider the effect that each production factor can have on overall sustainability in accordance with the principles of the TBL (Triple Bottom Line). In response to Research Question 1 (RQ 1), this methodological approach, which is much more detailed than other studies conducted previously, was aimed at quantifying sustainability performance indicators with the best possible degree of accuracy in order to create a benchmark framework for the ceramic industry, not only in Italy.
It is believed that the level of detail adopted is important above all for the final result because the input factors (raw materials for ceramic bodies and glazes) are variables that can change significantly for technological and market reasons. Indeed, the composition of the ceramic bodies can be changed according to the volatility of raw materials prices and the substitution of one raw material by another can radically change the transport mix and thus the overall environmental impact. Similarly, technological innovation is pushing companies towards the complete digitalisation of glazing and decorating processes. This will involve the use of inks and glazes that are no longer water-based but organic-based, with a consequent increase in the emissions of volatile organic compounds (VOCs) during the firing of the tiles due to the decomposition of solvents.
Therefore, the results obtained, based on a representative sample of the production of porcelain stoneware tiles, may constitute a reference point for possible future scenarios such as, for example, plant variations, changes in technologies and processes or changes in raw materials or logistical solutions, providing positive answer to the Research Question 2 (RQ 2). Comparison with a benchmark framework can provide decision-makers with useful information to guide strategic and investment choices based on the environmental and socio-economic impacts of the alternative options considered. In this regard, it is important to underline that LCSA’s tool is not only useful for the assessment of current processes but it is also an eco-design tool to predict the sustainability performance of different operational options. To use this benchmark, individual companies will have to carry out an internal assessment using the same analytical tools and following the same methodology used in this study, albeit within the scope of international ISO standards. This approach could be an obstacle in the adoption of the model, not so much for “leading firms” as for “small firms”, certainly less endowed with resources (including human resources) and skills to implement this sustainability analysis. However, as always happens in industrial districts, smaller companies follow sector leaders in innovation when technologies are consolidated and and can be more easily diffused.
Environmental impact data have been integrated with economic impact data (internal and external costs) and social impact data, contributing to a better quantification of the level of sustainability that the production of porcelain stoneware tiles has reached in Italy. The representativeness of the sample of producers analysed and the final adoption of the functional unit of 1 m2 of porcelain stoneware, allows us to consider the indices we have calculated as a sustainability benchmarking for this type of ceramic production. In fact, the unit of measurement of the square metre is the most widely used parameter of comparison among operators in the ceramic industry worldwide to relate results and performance of both a technological and economic and financial nature. Therefore, the adoption of m2 as a functional unit is intended to adopt the same language as the sector’s operators and therefore to facilitate the comparison of sustainability performance.
The study showed that, overall, the greatest environmental impact, even in terms of externalities, is attributable not only to the production process in the strict sense but also to the process of distribution of the finished product to users, as well as to the raw materials procurement system. This shows that in the supply chain, the logistics system upstream and downstream of tile manufacturers presents critical environmental issues and therefore opportunities for improvement [62]. On the contrary, the production process (from the gate-to-gate) is standardized and has already achieved good performance in terms of sustainability with proven technologies. This result contributes to broadening the knowledge on the impact of ceramic tile production compared to the results shown in the most recent literature [43,44].

6. Conclusions

The main scientific contribution of this study is to have applied for the first time the LCSA framework to an industrial sector in aggregate terms and specifically to the Italian ceramic district, in order to build a comprehensive benchmark for the sustainability of the ceramic industry. The Italian ceramic district represents a world leading industrial system in terms of technologies and organizational models and therefore constitutes a valid and internationally recognized standard of reference suitable for building a sustainability benchmark. This operation allowed to “observe” the supply chain also from the point of view of environmental, economic and social sustainability, going beyond the only and already used environmental impact assessments. In this way, companies can plan corporate social responsibility strategies, having at their disposal a series of objective sustainability indicators, to the benefit of their competitiveness on the reference markets. The availability of sustainability indicators also allows companies to actively integrate sustainability principles into their business models, going beyond general conceptual statements regarding intentions to adopt responsible behavior towards the environment and society. The LCSA is therefore an operational tool that is simple enough to use and can help companies control their environmental, economic and social performance against industry and internal reference standards. In fact, with the LCSA tools (LCA, LCC and S-LCA), it is possible to monitor the trend of these performances over time, verifying whether the sustainability objectives have been achieved and quantifying the deviations.
The research has also highlighted the critical integration of the three impact assessments (LCA + LCC + S-LCA), in fact, while conducting separate analyses, the risk is to arrive at a double counting of sustainability indices and that is why it was decided to present a separate framework for each dimension of sustainability. Finally, future research should extend the system boundaries of the economic assessment to the cradle-to-grave approach and investigate deeply the social dimension; the final aim is to experiment solutions to associate the social impact (and related indexes) to the functional unit and not to the process, solving the problem of temporal asynchrony between S-LCA and LCA+LCC.

Author Contributions

Conceptualization, F.E.G.-M.; Data curation, C.S.; Formal analysis, L.V.; Methodology, M.P.; Project administration, A.M.F.; Writing—review & editing, D.S.-B.

Funding

This research was funded by European Union under the LIFE Programme (LIFE16 ENV/IT/000307: LIFE Force of the Future).

Conflicts of Interest

The authors declare no conflict of interest.

Appendix A

The tables below list some of the most relevant data collected during the inventory analysis.
Table A1. Inventory data on the composition of the ceramic slip and the transport of raw materials.
Materials (Slip Production)
Raw MaterialsComposition (%)TransportSource
Lorry (km)Train (km)Barge (km)
Clay (Germany)43.12.20 × 1011.00 × 103-Directly from suppliers of raw materials
Clay (Ukraine)3.00 × 10²-3.10 × 10³
Clay (Italy)2.50 × 10²--
Feldspar (Italy)24.12.50 × 102-3.57 × 10²
Feldspar (Turkey)2.00 × 10²-2.20 × 10²
Sand (Italy)7.503.20 × 102-6.50 × 10²
Sodium silicate (Italy)0.301.16 × 102--
Water25.0---
Table A2. Inventory data on the composition of the glaze and the transport of raw materials.
Raw Materials (Glaze Production)
CategoryComposition (%)TransportsSource
Lorry (km)Train (km)Barge (km)
Alumina52.00 × 102--Directly from companies
Clay102.00 × 102--
Feldspar252.00 × 102--
CaCo3102.00 × 102--
Quartz102.00 × 102--
Zirconium silicate52.00 × 102--
Water35---
Table A3. Inventory data on atmospheric emissions.
Atmospheric Emissions
CategoryAmountUnitSource
Particulates6.27 × 104kg/yearsDirectly from companies
Fluoride6.32 × 103kg/years
Lead2.89 × 101kg/years
SOV4.46 × 104kg/years
Aldehydes7.01 × 103kg/years
SOx2.30 × 105kg/years
NOx2.79 × 105kg/years
CO1.28 × 105kg/years
CO23.00 × 108kg/years
Table A4. Inventory data on the energy consumption.
Energy Input
CategoryAmountUnitSource
Electricity consumption6.31 × 102TJ/yearsDirectly from companies
Natural gas consumption5.74 × 103TJ/years
Table A5. Inventory data on the distribution of the tiles.
Distribution
DestinationPercentage (%)Lorry (km)Tanker (km)Source
Italy20.245.00 × 102-Directly from companies
Europe39.882.78 × 103-
North America15.9527.45 × 1021.00 × 104
South America15.9527.45 × 1021.50 × 104
Asia7.9767.45 × 1021.43 × 104
Table A6. Inventory data on the installation and use phase.
Installation and Use
CategoryAmountUnitSource
Cementitious adhesive6.00kg/sqmEPD Ceramic Tile
Water4.50 × 10−3kg/sqmEstimated from literature
Detergent5.00 × 10−4kg/sqm
Tile use cycle2.60 × 103n°/servicelife

References

  1. Yim, H.-J.; Lee, K.-M. Environmental benchmarking methodology for the identification of key environmental aspects of a product. In Proceedings of the 2002 IEEE International Symposium on Electronics and the Environment, San Francisco, CA, USA, 6–9 May 2002; pp. 21–26. [Google Scholar]
  2. Battagello, F.M.; Cricelli, L.; Grimaldi, M. Benchmarking strategic resources and business performance via an open framework. Int. J. Prod. Perform. Manag. 2016, 65, 324–350. [Google Scholar] [CrossRef]
  3. Rodrigue, M.; Magnan, M.; Boulianne, E. Stakeholders’ influence on environmental strategy and performance indicators: A managerial perspective. Manag. Account. Res. 2013, 24, 301–316. [Google Scholar] [CrossRef]
  4. Welford, R.; Young, W. An Environmental Performance Measurement Framework for Business. In Sustainable Measures; Routledge: Abingdon-on-Thames, UK, 2017; pp. 98–116. [Google Scholar]
  5. Lin, Y.H.; Chen, Y.S. Determinants of green competitive advantage: The roles of green knowledge sharing, green dynamic capabilities, and green service innovation. Q. Quant. 2017, 51, 1663–1685. [Google Scholar] [CrossRef]
  6. Sarkis, J. Corporate Environmental Sustainability and DEA. In Handbook of Operations Analytics Using Data Envelopment Analysis; Springer: Boston, MA, USA, 2016; pp. 483–498. [Google Scholar]
  7. Sonnemann, G.; Gemechu, E.D.; Sala, S.; Schau, E.M.; Allacker, K.; Pant, R.; Adibi, N.; Valdivia, S. Life Cycle Thinking and the use of LCA in policies around the world. In Life Cycle Assessment; Springer: Cham, Switzerland, 2018; pp. 429–463. [Google Scholar]
  8. Castro, M.D.F.; Mateus, R.; Serôdio, F.; Bragança, L. Development of benchmarks for operating costs and resources consumption to be used in healthcare building sustainability assessment methods. Sustainability 2015, 7, 13222–13248. [Google Scholar] [CrossRef]
  9. Lerro, A.; Schiuma, G. Assessing performance and impact of the Technological Districts (TDs): General modelling and measurement system. Meas. Bus. Excell. 2015, 19, 58–75. [Google Scholar] [CrossRef]
  10. Confindustria Ceramica. Environmental Product Declaration (EPD). 2016. Available online: http://www.confindustriaceramica.it/site/home/eventi/documento4981.html (accessed on 1 December 2018).
  11. Ibáñez-Forés, V.; Pacheco-Blanco, B.; Capuz-Rizo, S.F.; Bovea, M.D. Environmental Product Declarations: Exploring their evolution and the factors affecting their demand in Europe. J. Clean. Prod. 2016, 116, 157–169. [Google Scholar] [CrossRef]
  12. Goh, S.; Richards, G. Benchmarking the learning capability of organizations. Eur. Manag. J. 1997, 15, 575–583. [Google Scholar] [CrossRef]
  13. Lai, M.C.; Wang, W.K.; Huang, H.C.; Kao, M.C. Linking the benchmarking tool to a knowledge-based system for performance improvement. Expert Syst. Appl. 2011, 38, 10579–10586. [Google Scholar] [CrossRef]
  14. Castro, V.F.D.; Frazzon, E.M. Benchmarking of best practices: An overview of the academic literature. Benchmarking 2017, 24, 750–774. [Google Scholar] [CrossRef]
  15. Li, Y.; You, S.; Brown, M.S.; Tan, R.T. Haze visibility enhancement: A survey and quantitative benchmarking. Comput. Vis. Image Underst. 2017, 165, 1–16. [Google Scholar] [CrossRef]
  16. Hamedani, A.Z.; Huber, F. A comparative study of DGNB, LEED and BREEAM certificate systems in urban sustainability. Sustain. City VII 2012, 1, 121–132. [Google Scholar]
  17. Elkington, J. Accounting for the triple bottom line. Meas. Bus. Excell. 1998, 2, 18–22. [Google Scholar] [CrossRef]
  18. Schaltegger, S.; Burritt, R. Measuring and managing sustainability performance of supply chains: Review and sustainability supply chain management framework. Supply Chain Manag. 2014, 19, 232–241. [Google Scholar] [CrossRef]
  19. Rachuri, S.; Sarkar, P.; Narayanan, A.; Lee, J.H.; Witherell, P. Towards a methodology for analyzing sustainability standards using the Zachman framework. In Glocalized Solutions for Sustainability in Manufacturing; Springer: Berlin/Heidelberg, Germany, 2011; pp. 543–548. [Google Scholar]
  20. Kamali, M.; Hewage, K. Development of performance criteria for sustainability evaluation of modular versus conventional construction methods. J. Clean. Prod. 2017, 142, 3592–3606. [Google Scholar] [CrossRef]
  21. Singhal, P.; Ahonen, S.; Rice, G.; Stutz, M.; Terho, M.; van der Wel, H. Key Environmental Performance Indicators (KEPIs): A new approach to environmental assessment. In Electronics Goes Green; Curran Associates, Inc.: New York, NY, USA, 2004; pp. 6–8. [Google Scholar]
  22. Pissourios, I.A. An interdisciplinary study on indicators: A comparative review of quality-of-life, macroeconomic, environmental, welfare and sustainability indicators. Ecol. Indic. 2013, 34, 420–427. [Google Scholar] [CrossRef]
  23. del Mar Alonso-Almeida, M.; Llach, J.; Marimon, F. A closer look at the ‘Global Reporting Initiative’sustainability reporting as a tool to implement environmental and social policies: A worldwide sector analysis. Corp. Soc. Responsib. Environ. Manag. 2014, 21, 318–335. [Google Scholar] [CrossRef]
  24. Onat, N.C.; Kucukvar, M.; Tatari, O. Integrating triple bottom line input–output analysis into life cycle sustainability assessment framework: The case for US buildings. Int. J. Life Cycle Assess. 2014, 19, 1488–1505. [Google Scholar] [CrossRef]
  25. Chang, D.; Lee, C.K.M.; Chen, C.H. Review of life cycle assessment towards sustainable product development. J. Clean. Prod. 2014, 83, 48–60. [Google Scholar] [CrossRef]
  26. Goh, B.H.; Sun, Y. The development of life-cycle costing for buildings. Build. Res. Inf. 2016, 44, 319–333. [Google Scholar] [CrossRef]
  27. Petti, L.; Serreli, M.; Di Cesare, S. Systematic literature review in social life cycle assessment. Int. J. Life Cycle Assess. 2018, 23, 422–431. [Google Scholar] [CrossRef]
  28. Gabaldón-Estevan, D.; Criado, E.; Monfort, E. The green factor in European manufacturing: A case study of the Spanish ceramic tile industry. J. Clean. Prod. 2014, 70, 242–250. [Google Scholar] [CrossRef]
  29. Hervas-Oliver, J.L.; Davide, M. The case of the European ceramic tile districts in Spain and Italy. In Local Clusters in Global Value Chains: Linking Actors and Territories Through Manufacturing and Innovation; Routledge: Abingdon-on-Thames, UK, 2017; Chapter 10. [Google Scholar]
  30. Confindustria Ceramica. National Statistical Survey on Italian Ceramic Tile Industry, 38th ed.; EDICER: Sassuolo, Italy, 2017. [Google Scholar]
  31. Martín-Márquez, J.; Rincón, J.M.; Romero, M. Effect of firing temperature on sintering of porcelain stoneware tiles. Ceram. Int. 2008, 34, 1867–1873. [Google Scholar] [CrossRef] [Green Version]
  32. Pérez, J.M.; Romero, M. Microstructure and technological properties of porcelain stoneware tiles moulded at different pressures and thicknesses. Ceram. Int. 2014, 40, 1365–1377. [Google Scholar] [CrossRef] [Green Version]
  33. Almeida, M.I.; Dias, A.C.; Demertzi, M.; Arroja, L. Environmental profile of ceramic tiles and their potential for improvement. J. Clean. Prod. 2016, 131, 583–593. [Google Scholar] [CrossRef]
  34. Ibáñez-Forés, V.; Bovea, M.D.; Simó, A. Life cycle assessment of ceramic tiles. Environmental and statistical analysis. Int. J. Life Cycle Assess. 2011, 16, 916. [Google Scholar] [CrossRef]
  35. Fava, J.A.; Denison, R.; Jones, B.; Curran, M.A.; Vigon, B.; Selke, S.; Barnum, J. (Eds.) A Technical Framework for Life-Cycle Assessment. SETAC Workshop Report: August 18–23, 1990. Smugglers Notch, Vermont; SETAC: Washington, DC, USA, 1991. [Google Scholar]
  36. ISO 14040 International Standard. Environmental Management. Life Cycle Assessment, Principles and Framework; International Organization for Standardization: Geneva, Switzerland, 2006. [Google Scholar]
  37. ISO 14044 International Standard. Environmental Management. Life Cycle Assessment, Requirements and Guidelines; International Organization for Standardization: Geneva, Switzerland, 2006. [Google Scholar]
  38. EU Commission. Taking Sustainable Use of Resources Forward: A Thematic Strategy on the Prevention and Recycling of Waste; COM (2005) 666 Final; Communication from the Commission of the European Communities: Brussels, Belgium, 2005. [Google Scholar]
  39. Pré Sustainability SimaPro 8.5.2.2 Multi user. Available online: https://www.pre-sustainability.com/simapro (accessed on 1 December 2018).
  40. Wernet, G.; Bauer, C.; Steubing, B.; Reinhard, J.; Moreno-Ruiz, E.; Weidema, B. The ecoinvent database version 3 (part I): Overview and methodology. Int. J. Life Cycle Assess. 2016, 21, 1218–1230. [Google Scholar] [CrossRef]
  41. International Organization of Standardization. ISO 14041—Environmental Management—Life Cycle Assessment—Goal and Scope Definition and Inventory Analysis; ISO: Geneva, Switzerland, 1998; 22p. [Google Scholar]
  42. Jolliet, O.; Margni, M.; Charles, R.; Humbert, S.; Payet, J.; Rebitzer, G.; Rosenbaum, R. IMPACT 2002+: A new life cycle impact assessment methodology. Int. J. Life Cycle Assess. 2003, 8, 324. [Google Scholar] [CrossRef]
  43. Pini, M.; Ferrari, A.M.; Gamberini, R.; Neri, P.; Rimini, B. Life cycle assessment of a large, thin ceramic tile with advantageous technological properties. Int. J. Life Cycle Assess. 2014, 19, 1567–1580. [Google Scholar] [CrossRef]
  44. Ribakov, Y.; Halperin, I.; Pushkar, S. Using Eco-indicator 99 and a two-stage nested analysis of variance test to evaluate building mitigation measures under hazard risks. Adv. Struct. Eng. 2016, 19, 860–870. [Google Scholar] [CrossRef]
  45. Zannetti, P. Gaussian models. In Air Pollution Modeling; Springer: Boston, MA, USA, 1990; pp. 141–183. [Google Scholar]
  46. Sherif, Y.S.; Kolarik, W.J. Life cycle costing: Concept and practice. Omega 1981, 9, 287–296. [Google Scholar] [CrossRef]
  47. British Standard Institute/British Cost Information Service. Standardized Method of Life Cycle Costing for Construction Procurement, A Supplement to BS ENISO 15686-5 Building and Constructed Asset—Service Life Planning; Part 5–Life Cycle Costing; BSI/BCIS: London, UK, 2008. [Google Scholar]
  48. Kloepffer, W. Life cycle sustainability assessment of products. Int. J. Life Cycle Assess. 2008, 13, 89. [Google Scholar] [CrossRef]
  49. National Research Council. Hidden Costs of Energy: Unpriced Consequences of Energy Production and Use; National Academies Press: Washington, DC, USA, 2010. [Google Scholar]
  50. Finkbeiner, M.; Schau, E.M.; Lehmann, A.; Traverso, M. Towards life cycle sustainability assessment. Sustainability 2010, 2, 3309–3322. [Google Scholar] [CrossRef]
  51. UNEP/SETAC. Guidelines for social life cycle assessment of products; Life-Cycle Initiative; United Nations Environment Programme and Society for Environmental Toxicology and Chemistry: Paris, France, 2009; Available online: http://www.unep.fr/shared/publications/pdf/dtix1164xpa-guidelines_slca.pdf (accessed on 29 October 2018).
  52. Norris, C.B.; Norris, G.; Aulisio, D. Social Hotspots Database. 2013. Available online: http://socialhotspot.org (accessed on 1 December 2018).
  53. Bieda, B. Application of stochastic approach based on Monte Carlo (MC) simulation for life cycle inventory (LCI) to the steel process chain: Case study. Sci. Total Environ. 2014, 481, 649–655. [Google Scholar] [CrossRef] [PubMed]
  54. Goedkoop, M.; Oele, M.; Leijting, J.; Ponsioen, T.; Meijer, E. Introduction to LCA with SimaPro; PRé Consultants: Amersfoort, The Netherlands, 2016; pp. 39–40. [Google Scholar]
  55. Hervás-Oliver, J.L.; Albors-Garrigos, J.; Estelles-Miguel, S.; Boronat-Moll, C. Radical innovation in Marshallian industrial districts. Reg. Stud. 2018, 52, 1388–1397. [Google Scholar] [CrossRef]
  56. Da Ronch, B.; Di Maria, E.; Micelli, S. Clusters go green: Drivers of environmental sustainability in local networks of SMEs. Int. J. Inf. Syst. Soc. Chang. 2013, 4, 37–52. [Google Scholar] [CrossRef]
  57. Garcia-Muiña, F.; González-Sánchez, R.; Ferrari, A.; Settembre-Blundo, D. The Paradigms of Industry 4.0 and Circular Economy as Enabling Drivers for the Competitiveness of Businesses and Territories: The Case of an Italian Ceramic Tiles Manufacturing Company. Soc. Sci. 2018, 7, 255. [Google Scholar] [CrossRef]
  58. Carbonara, N. Innovation processes within geographical clusters: A cognitive approach. Technovation 2004, 24, 17–28. [Google Scholar] [CrossRef]
  59. Gabaldón-Estevan, D.; Manjarrés-Henríquez, L.; Molina-Morales, F.X. An analysis of the Spanish ceramic tile industry research contracts and patents. Eur. Plan. Stud. 2018, 26, 895–914. [Google Scholar] [CrossRef] [Green Version]
  60. Villar, C.; Alegre, J.; Pla-Barber, J. Exploring the role of knowledge management practices on exports: A dynamic capabilities view. Int. Bus. Rev. 2014, 23, 38–44. [Google Scholar] [CrossRef]
  61. Camuffo, A.; Grandinetti, R. I distretti industriali come sistemi locali di innovazione. Sinergie Ital. J. Manag. 2011, 69, 33–60. [Google Scholar]
  62. Mohamed Abdul Ghani, N.M.A.; Egilmez, G.; Kucukvar, M.; Bhutta, M.K.S. From green buildings to green supply chains: An integrated input-output life cycle assessment and optimization framework for carbon footprint reduction policy making. Manag. Environ. Q. 2017, 28, 532–548. [Google Scholar] [CrossRef]
Figure 1. Flow chart of the porcelain stoneware tiles life cycle.
Resources 08 00011 g001
Figure 2. Damage assessment results (damage categories) related to the life cycle of 52.5 × 10⁶ m2 of porcelain stoneware tiles with IMPACT 2002+ modified method.
Resources 08 00011 g002
Figure 3. Single Score results (damage categories) related to the life cycle of 52.5 × 10⁶ m2 of porcelain stoneware tiles with IMPACT 2002+ modified method.
Resources 08 00011 g003
Figure 4. Single Score results (damage categories) of the comparison between original IMPACT 2002+ and modified IMPACT 2002+ assessment method (Legend: D. E.: Direct emissions; Prod.: Production; Pack.: Packaging; Distr.: Distribution; Inst.: Installation; EoL: End of life).
Resources 08 00011 g004
Table 1. Characterised results related to the life cycle of 52.5 × 10⁶ m2 of porcelain stoneware tiles with midpoint indicators with IMPACT 2002+ modified method. (Legend: Manufact.: Manufacturing; I. C.: Impact Categories; D.E.: Direct emissions; Prod.: Production; Pack.: Packaging; Distr.: Distribution; Install.: Installation; EoL: End of Life; C.: Carcinogens; N. C.: Non Carcinogens; R. I.: Respiratory Inorganics; I. R.: Ionizing Radiation; O. L. D.: Ozone Layer Depletion; R. O.: Respiratory Organics; A. E.: Aquatic Ecotoxicity; T. E.: Terrestrial Ecotoxicity; T. A/N.: Terrestrial Acid/Nutri; L. O.: Land Occupation; A. A.: Aquatic Acidification; A. E.: Aquatic Eutrophication; G. W.: Global Warming; N. R. E.: Non Renewable Energy; M. E.: Mineral Extraction; R. E.: Renewable Energy; P. C.: Production Costs; N. C. I.: Non Carcinogens, indoor; R. O. I.: Respiratory Organics, indoor; R. I. I. Respiratory Inorganics, indoor; C. I.: Carcinogens, indoor; N. C. I.: Non Carcinogens, indoor; C. L.: Carcinogens, local; R. O. L.: Respiratory Organics, local; R. I. L.: Respiratory Inorganics, local).
I. C.UnitTotalD.E.Raw Mat.Manufact.Usage and Disposal
BodyGlazesProd.Pack.Distr.Install.UseEoL
C.kg C2H3Cl eq5.13 × 107-3.32 × 1066.05 × 1052.70 × 1071.81 × 1067.08 × 1066.47 × 1064.96 × 106 1.34 × 10⁵
N. C.kg C2H3Cl eq2.7 × 107-2.13 × 1068.08 × 1051.14 × 1076.96 × 1045.49 × 1063.45 × 1063.68 × 106−9.05 × 10⁴
R. I.kg PM2.5 eq1.43 × 106-2.52 × 1051.40 × 1051.84 × 1055.63 × 1033.50 × 1052.91 × 1051.97 × 1057.13 × 103
I. R.Bq C-14 eq8.78 × 109-1.67 × 1096.03 × 1072.03 × 1096.41 × 1072.43 × 1091.51 × 1099.26 × 1088.12 × 107
O. L. D.kg CFC-11 eq1.26 × 102-2.32 × 1011.351.71 × 1013.12 × 10−15.32 × 1011.60 × 1011.45 × 1012.50 × 10−1
R. O.kg C2H4 eq4.96 × 105-7.45 × 1043.02 × 1034.90 × 1043.35 × 1031.33 × 1058.05 × 1041.52 × 1052.21 × 102
A. E.kg TEG water3.04 × 1011-9.96 × 1091.21 × 1091.93 × 10112.70 × 1082.64 × 10106.33 × 10101.00 × 10101.29 × 108
T. E.kg TEG soil3.64 × 1010-5.15 × 1094.00 × 1081.81 × 1098.59 × 1072.07 × 10103.89 × 1093.99 × 1093.82 × 108
T. A/N.kg SO2 eq2.01 × 107-5.55 × 1061.39 × 1053.59 × 1066.79 × 1044.03 × 1063.30 × 1063.38 × 1066.75 × 104
L. O.m2org.arable2.57 × 1081.25 × 1081.54 × 1074.68 × 1059.04 × 1063.45 × 1061.69 × 1079.81 × 1067.60 × 1074.58 × 105
A. A.kg SO2 eq5.21 × 106-9.63 × 1054.19 × 1049.07 × 1052.03 × 1041.31 × 1061.23 × 1067.15 × 1052.21 × 104
A. E.kg PO4 P-lim1.99 × 105-2.38 × 1049.60 × 1021.75 × 1041.02 × 1036.73 × 1044.55 × 1044.10 × 1041.67 × 103
G. W.kg CO2 eq1.25 × 109-1.56 × 1088.82 × 1064.59 × 1084.85 × 1062.88 × 1081.77 × 1081.54 × 1088.06 × 105
N. R. E.MJ primary1.44 × 107-2.40 × 1091.34 × 1081.64 × 1091.26 × 1084.72 × 1093.01 × 1092.35 × 1091.14 × 107
M. E.MJ surplus1.22 × 109-7.70 × 1077.23 × 1066.96 × 1084.20 × 1066.44 × 1072.37 × 1081.04 × 1082.80 × 107
R. E.MJ1.74 × 109-8.89 × 1074.34 × 1063.62 × 1083.23 × 1077.16 × 1071.92 × 1089.82 × 1081.30 × 107
P. C.5.21 × 109---5.21 × 10⁹-----
N. C. I.kg C2H3Cl eq2.44---2.44-----
R. O. I.kg C2H4 eq8.19 × 10−1---8.19 × 10⁻¹-----
R. I. I.kg PM2.5 eq7.00 × 10−1---7.00 × 10⁻¹-----
C. I.kg C2H3Cl eq3.08 × 102---3.08 × 10²-----
N. C. I.kg C2H3Cl eq1.18 × 106---1.18 × 10⁶-----
C. L.kg C2H3Cl eq1.48 × 108---1.48 × 10⁸-----
R. O. L.kg C2H4 eq4.27 × 105---4.27 × 10⁵-----
R. I. L.kg PM2.5 eq3.37 × 105---3.37 × 10⁵-----
Table 2. Damage assessment results (damage categories) related to the life cycle of 52.5 × 10⁶ m2 of porcelain stoneware tiles with IMPACT 2002+ modified method (Legend: Manufact.: Manufacturing; D. C.: Damage Categories; D.E.: Direct emissions; Prod.: Production; Pack.: Packaging; Distr.: Distribution; Install.: Installation; EoL: End of Life; Eco. quality: Ecosystem quality; H. health, indoor: Human health, indoor; H. health, local: Human health, local; Ren. Energy: Renewable energy; MJ p.: MJ primary).
D. C.UnitTotalD.E.Raw Mat.Manufact.Usage and Disposal
BodyGlazesProd.Pack.Distr.Install.UseEoL
Human healthDALY1.22 × 103-1.92 × 1021.02 × 1022.37x 1029.232.81 × 1022.32 × 1021.63 × 1025.13
Eco. qualityPDF*m2*year6.04 × 1081.36 × 1086.38 × 1073.88 × 1063.76 × 1024.52 × 1061.88 × 1084.81 × 1071.18 × 1083.60 × 106
Climate changekg CO2 eq1.25 × 109-1.56 × 1088.82 × 1064.59 × 1084.85 × 1062.88 × 1081.77 × 1081.54 × 1088.06 × 1025
ResourcesMJ p.1.56 × 1010-2.48 × 1091.41 × 1082.34 × 1091.30 × 1084.78 × 1093.25 × 1092.46 × 1093.95 × 107
H. health, indoorDALY1.36 × 103---1.36 × 10³-----
H. health, localDALY6.56 × 102---6.56 × 10²-----
Ren. EnergyMJ1.74 × 109-8.89 × 1074.34 × 1063.62 × 1083.23 × 1077.16 × 1071.92 × 10289.82 × 1081.30 × 107
Production costs5.21 × 109-0.000.005.21 × 109-0.000.000.000.00
Table 3. Single Score results (damage categories) related to the life cycle of 52.5 × 10⁶ m2 of porcelain stoneware tiles with IMPACT 2002+ modified method (Legend: DAM. CAT.: Damage Categories; D.E.: Direct emissions; Prod.: Production; Pack.: Packaging; Distr.: Distribution; Install.: Installation; EoL: End of Life; Eco. quality: Ecosystem quality; H. h., indoor: Human health, indoor; H. h., local: Human health, local).
D. C.UnitTotalD.E.Raw Mat.Manufact.Usage and Disposal
BodyGlazesProd.Pack.Distr.Install.UseEoL
TotalkPt5.38 × 1029.956.39 × 1011.65 × 1011.90 × 1022.981.14 × 1027.55 × 1016.33 × 1011.33
Human healthkPt1.72 × 102-2.71 × 1011.44 × 1013.34 × 1011.303.96 × 1013.27 × 1012.29 × 1017.23 × 10−1
Eco. qualitykPt4.41 × 1019.954.662.83 × 10−12.743.30 × 10−11.37 × 1013.518.642.63 × 10−1
Climate changekPt1.26 × 102-1.58 × 1018.90 × 10−14.63 × 1014.90 × 10−12.90 × 1011.79 × 1011.56 × 1018.14 × 10−2
ResourceskPt1.03 × 102-1.63 × 1019.27 × 10−11.54 × 1018.57 × 10−13.15 × 1012.14 × 1011.62 × 1012.60 × 10−1
H. h, indoorkPt1.92 × 10−4---1.92 × 10⁻⁴-----
H. h., localkPt9.25 × 101---9.25 × 101-----
Table 4. Uncertainties for characterized LCIA results related to the life cycle of the porcelain stoneware tiles with IMPACT 2002+ assessment method.
Impact CategoryUnitMeanMedianSDCV2.5%97.5%
Aquatic acidificationkg SO2 eq5.23 × 1065.19 × 1064.04 × 1057.734.54 × 1066.10 × 106
Aquatic ecotoxicitykg TEG water3.07 × 10112.52 × 10111.83 × 10115.96 × 1011.41 × 10118.02 × 1011
Aquatic eutrophicationkg PO4 P-lim1.99 × 1051.78 × 1059.45 × 1044.74 × 1011.19 × 1054.29 × 105
Carcinogenskg C2H3Cl eq3.64 × 1073.61 × 1072.15 × 1065.903.35 × 1074.15 × 107
Global warmingkg CO2 eq1.25 × 1091.24 × 1094.23 × 1073.391.17 × 1091.33 × 109
Ionizing radiationBq C-14 eq9.03 × 1097.17 × 1096.96 × 1097.70 × 1013.84 × 1092.47 × 1010
Land occupationm2org.arable1.97 × 1081.96 × 1091.08 × 1075.461.80 × 1082.21 × 108
Mineral extractionMJ surplus3.10 × 1073.00 × 1076.55 × 1062.11 × 1012.23 × 1074.73 × 107
Non-carcinogenskg C2H3Cl eq2.62 × 1072.16 × 1071.64 × 1076.26 × 1011.41 × 1076.81 × 107
Non-renewable energyMJ primary1.44 × 10101.44 × 10101.35 × 1099.381.21 × 10101.72 × 1010
Ozone layer depletionkg CFC-11 eq1.27 × 1021.17 × 1024.18 × 1013.28 × 1017.74 × 1012.28 × 102
Respiratory inorganicskg PM2.5 eq1.11 × 1061.10 × 1066.68 × 1046.019.99 × 1051.26 × 106
Respiratory organicskg C2H4 eq4.79 × 1054.72 × 1054.98 × 1041.04 × 1014.02 × 1055.96 × 105
Terrestrial acid/nutrikg SO2 eq2.02 × 1072.01 × 1071.36 × 1066.721.80 × 1072.32 × 107
Terrestrial ecotoxicitykg TEG soil3.64 × 10103.54 × 10104.74 × 1091.30 × 1013.13 × 10104.79 × 1010
Table 5. Increase of the damage between the calculation with IMPACT 2002+ original method and the modified one.
IncreaseTotalD. E.BodyGlazesProd.Pack.Distr.Inst.UseEoL
(%)36.1232.6210.2229.87113.9414.4512.8814.819.6253.75
Table 6. Internal costs related to production of the porcelain stoneware tiles.
Cost FactorsUnitCosts
Expenses for goods and services3.36 × 108
Use of third parties assets7.36 × 106
Cost of Human Resources1.10 × 108
Other operating expenses1.44 × 107
Amortization and depreciation3.27 × 107
Provisions for risks and others8.92 × 105
Revaluations and impairments2.21 × 106
Taxes1.61 × 107
Result of third parties1.40 × 106
Total production costs5.21 × 108
Table 7. Weighting results (damage categories) related to the life cycle of 52.5 × 10⁶ m2 of porcelain stoneware tiles with EPS 2015dx method (Legend: D. C.: Damage Categories; Product.: Production; Packag.: Packaging; Distrib.: Distribution; Install.: Installation; EoL: End of Life; E. S.: Ecosystem services; A. W.: Access to water; Biod.: Biodiversity; B. T.: Building Technology; H. H.: Human Health; A. R.: Abiotic Resources).
D. C.UnitTotalBodyRaw Mat.Manufact.Usage and Disposal
GlazesProduct.Packag.Distrib.Install.UseEoL
TotalMPt7.69 × 1021.07 × 1021.76 × 1011.07 × 1024.462.28 × 1021.91 × 1021.10 × 1024.63
E. S.MPt5.046.62 × 10−1−2.18 × 10−31.852.04 × 10−21.157.40 × 10−16.14 × 10−11.78 × 10−3
A. W.MPt3.03 × 10−13.78 × 10⁻²−1.83 × 10−31.15 × 10−11.24 × 10−36.98 × 10−24.35 × 10−23.80 × 10−29.78 × 10⁻⁵
Biod.MPt1.91 × 10−22.15 × 10⁻³−8.28 × 10−57.96 × 10−36.67 × 10−53.82 × 10−32.51 × 10−32.72 × 10−39.30 × 10⁻⁶
B. T.MPt4.30 × 10−25.53 × 10⁻³−3.33 × 10−41.72 × 10−21.75 × 10−49.66 × 10−35.87 × 10−34.88 × 10−3−1.39 × 10⁻⁵
H. H.MPt2.35 × 1022.99 × 1011.26 × 1016.47 × 1019.89 × 10−15.23 × 1014.04 × 1013.33 × 1014.95 × 10−1
A. R.MPt5.29 × 1027.64 × 1015.003.99 × 1013.451.75 × 1021.50 × 1027.58 × 1014.14
Table 8. Preliminary Single Score results of the Social Life Cycle Assessment, by impact categories (a) and damage categories (b), with Social LCA Method 2 V2.00/Standard of the porcelain stoneware tiles.
(a) (b)
Impact CategoriesUnitImpactDamage CategoriesUnitDamage
Child LaborPt3.42 × 108Labor Rights & Decent WorkPt4.27 × 109
Forced LaborPt3.54 × 108Health & SafetyPt6.79 × 109
Excessive Working TimePt4.18 × 108Human RightsPt9.60 × 108
Injuries & FatalitiesPt3.07 × 109Human RightsPt2.04 × 109
Toxics & HazardsPt3.72 × 109Community InfrastructurePt2.04 × 109
Poverty Wage 2Pt2.30 × 108
Poverty Wage 1Pt1.88 × 108
Migrant LaborPt5.29 × 108
Collective Bargaining etc.Pt1.78 × 109
Indigenous RightsPt0.00
Gender EquityPt5.06 × 108
High ConflictPt4.54 × 108
Legal SystemPt5.95 × 108
CorruptionPt1.45 × 109
Drinking WaterPt2.28 × 108
Improved SanitationPt2.52 × 108
Hospital BedsPt1.02 × 108
Inadequate social benefitsPt4.25 × 108
TOTALPt1.46 × 1010 Pt1.46 × 1010
Table 9. Characterised results of 1 m2 of ceramic tiles with midpoint indicators with IMPACT 2002+ modified method (Legend: I. C.: Impact Categories; D.E.: Direct emissions; Prod.: Production; Pack.: Packaging; Distr.: Distribution; Install.: Installation; EoL: End of Life; C.: Carcinogens; N. C.: Non Carcinogens; R. I.: Respiratory Inorganics; I. R.: Ionizing Radiation; O. L. D.: Ozone Layer Depletion; R. O.: Respiratory Organics; A. E.: Aquatic Ecotoxicity; T. E.: Terrestrial Ecotoxicity; T. A/N.: Terrestrial Acid/Nutri; L. O.: Land Occupation; A. A.: Aquatic Acidification; A. E.: Aquatic Eutrophication; G. W.: Global Warming; N. R. E.: Non Renewable Energy; M. E.: Mineral Extraction; R. E.: Renewable Energy; P. C.: Production Costs; N. C. I.: Non Carcinogens, indoor; R. O. I.: Respiratory Organics, indoor; R. I. I. Respiratory Inorganics, indoor; C. I.: Carcinogens, indoor; N. C. I.: Non Carcinogens, indoor; C. L.: Carcinogens, local; R. O. L.: Respiratory Organics, local; R. I. L.: Respiratory Inorganics, local).
I. C.UnitTotalD.E.Raw Mat.Manufact.Usage and Disposal
BodyGlazesProd.Pack.Distr.Install.UseEoL
C.kg C2H3Cl eq9.79 × 10−1-6.33 × 10−21.15 × 10−25.14 × 10−13.45 × 10−21.35 × 10−11.23 × 10−19.45 × 10−22.55 × 10−3
N. C.kg C2H3Cl eq5.14 × 10−1-4.05 × 10−21.54 × 10−22.18 × 10−11.33 × 10−31.05 × 10−16.58 × 10−27.02 × 10⁻²−1.73 × 10⁻³
R. I.kg PM2.5 eq2.72 × 10−2-4.81 × 10−32.67 × 10−33.51 × 10−31.07 × 10−46.67 × 10−35.55 × 10−33.76 × 10−31.36 × 10−4
I. R.Bq C-14 eq1.67 × 10−2-3.18 × 1011.153.87 × 1011.224.64 × 1012.88 × 1011.76 × 1011.55
O. L. D.kg CFC-11 eq2.40 × 10−6-4.43 × 10−72.58 × 10−83.26 × 10−75.95 × 10−91.01 × 10−63.04 × 10−72.76 × 10−74.76 × 10−9
R. O.kg C2H4 eq9.45 × 10−3-1.42 × 10−35.75 × 10−59.34 × 10−46.39 × 10−52.53 × 10−31.53 × 10−22.90 × 10−34.21 × 10−6
A. E.kg TEG water5.80 × 103-1.90 × 1022.31 × 1013.67 × 1035.155.04 × 1021.21 × 1031.91 × 1022.47
T. E.kg TEG soil6.94 × 102-9.82 × 1017.633.45 × 1011.643.94 × 1027.42 × 1017.61 × 1017.28
T. A/N.kg SO2 eq3.83 × 10−1-1.06 × 10−12.65 × 10−36.84 × 10−21.29 × 10−37.68 × 10−26.28 × 10−26.43 × 10−21.29 × 10−3
L. O.m2org.arable4.892.382.93 × 10−18.93 × 10−31.72 × 10−16.57 × 10−23.23 × 10−11.87 × 10−11.458.72 × 10−3
A. A.kg SO2 eq9.94 × 10−2-1.84 × 10−27.99 × 10−41.73 × 10−23.88 × 10−4 2.49 × 10−22.35 × 10−21.36 × 10−24.21 × 10−4
A. E.kg PO4 P-lim3.79 × 10−3-4.53 × 10−41.83 × 10−53.34 × 10−41.94 × 10−51.28 × 10−38.68 × 10−47.82 × 10−43.19 × 10−5
G. W.kg CO2 eq2.38 × 101-2.981.68 × 10−18.749.24 × 10−25.483.382.941.54 × 10−2
N. R. E.MJ primary2.74 × 102-4.57 × 10−12.553.14 × 1012.409.00 × 1015.74 × 1014.49 × 10−12.18 × 10⁻¹
M. E.MJ surplus2.32 × 101-1.471.38 × 10−11.33 × 1018.01 × 10−21.234.511.975.34 × 10−1
R. E.MJ3.33 × 101-1.698.28 × 10−26.896.16 × 10−11.373.651.87 × 10−12.47 × 10⁻¹
P. C.9.93 × 101---9.93 × 101-----
N. C. I.kg C2H3Cl eq4.66 × 10−8---4.66 × 10⁻⁸-----
R. O. I.kg C2H4 eq1.56 × 10−8---1.56 × 10⁻⁸-----
R. I. I.kg PM2.5 eq1.33 × 10−8---1.33 × 10⁻⁸-----
C. I.kg C2H3Cl eq5.87 × 10−8---5.87 × 10⁻⁶-----
N. C. I.kg C2H3Cl eq2.24 × 10−2---2.24 × 10⁻²-----
C. L.kg C2H3Cl eq2.83---2.83-----
R. O. L.kg C2H4 eq8.14 × 10−3---8.14 × 10⁻³-----
R. I. L.kg PM2.5 eq6.43 × 10−3---6.43 × 10⁻³-----
Table 10. Damage Assessment (a) and Single Score (b) indicators with IMPACT 2002+ modified method related to 1 m2 of porcelain stoneware tiles (Legend: DAM. CAT.: Damage Categories; D.E.: Direct emissions; Product.: Production; Pack.: Packaging; Distr.: Distribution; Install.: Installation; EoL: End of Life; H. H.: Human Health; Eco. Q.: Ecosystem Quality; Cl. Ch.: Climate Change; Res: Resources; H. H.,i.: Human Health, indoor; H. H.,l.: Human Health, local; R. En.: Renewable Energy; P. C.: Production Costs).
(a)
D. C.UnitTotalD.E.Raw Mat.Manufact.Usage and Disposal
BodyGlazesProd.Pack.Distr.Install.UseEoL
H. H.DALY2.33 × 10−5 -3.67 × 10−61.95 × 10−64.51 × 10−61.76 × 10−75.36 × 10−64.43 × 10−63.10 × 10−69.78 × 10−8
Eco. Q.PDF*m2*year1.15 × 1012.601.227.40 × 10−27.16 × 10−18.61 × 10−23.589.17 × 10−12.266.86 × 10−2
Cl. Ch.kg CO2 eq2.38 × 101-2.981.68 × 10−18.749.24 × 10−25.483.382.941.54 × 10−2
Res.MJ primary2.98 × 102-4.72 × 1012.694.46 × 1012.489.12 × 10−16.19 × 1014.68 × 1017.52 × 10−1
H. H., i.DALY2.59 × 10−11---2.59 × 10⁻¹¹-----
H. H., l.DALY1.25 × 10−5---1.25 × 10⁻⁵-----
R. En.MJ3.33 × 101-1.698.28 × 10−26.896.16 × 10−11.373.651.87 × 1012.47 × 10−1
P. C.9.93 × 101-0.000.009.93 × 101-0.000.000.000.00
(b)
D. C.UnitTotalD.E.Raw Mat.Manufact.Usage and Disposal
BodyGlazesProduct.Pack.Distr.Install.UseEoL
TotalkPt1.02 × 10−51.90 × 10−71.22 × 10−63.14 × 10−73.63 × 10−65.68 × 10−82.17 × 10−61.44 × 10−61.21 × 10−62.53 × 10⁻⁸
H. H.kPt3.28 × 10−6-5.17 × 10−72.74 × 10−76.36 × 10−72.48 × 10−87.56 × 10−76.24 × 10−74.37 × 10−61.38 × 10−8
Eco. Q.kPt8.40 × 10−71.90 × 10−78.88 × 10−85.40 × 10−95.23 × 10−86.29 × 10−82.61 × 10−76.69 × 10−81.65 × 10−75.00 × 10⁻⁹
Cl. Ch.kPt2.40 × 10−6-3.01 × 10−71.70 × 10−88.83 × 10−79.33 × 10−95.54 × 10−73.41 × 10−72.97 × 10−71.55 × 10−9
Res.kPt1.96 × 10−6-3.11 × 10−71.77 × 10−82.94 × 10−71.63 × 10−86.00 × 10−74.07 × 10−73.08 × 10−74.95 × 10−9
H. H., i.kPt3.66 × 10−12---3.66 × 10⁻¹²-----
H. H., l.kPt1.76 × 10−6---1.76 × 10⁻⁶-----
Table 11. Microeconomic performance indicators related to 1 m2 of porcelain stoneware tile.
Cost FactorsUnitInternal Costs
Expenses for goods and services€/m26.40
Use of third parties assets€/m20.14
Cost of Human Resources€/m22.09
Other operating expenses€/m20.27
Amortization and depreciation€/m20.62
Provisions for risks and others€/m20.02
Revaluations and impairments€/m20.04
Taxes€/m20.31
Result of third parties€/m20.03
Total production costs€/m29.93
Table 12. Externalities related to 1 m2 of porcelain stoneware tile (Legend: D. C.: Damage Categories; Prod.: Production; Pack.: Packaging; Distr.: Distribution; Install.: Installation; EoL: End of Life; E. S.: Ecosystem services; A. W.: Access to water; Biod.: Biodiversity; B. T.: Building Technology; H. H.: Human Health; A. R.: Abiotic Resources).
D.C.UnitTotalBodyRaw MaterialsManufacturingUsage and Disposal
GlazesProd.Pack.Distr.Inst.UseEoL
E. S.MPt9.61 × 10−81.26 × 10⁻⁸−4.16 × 10−113.53 × 10−83.89 × 10−102.20 × 10−81.41 × 10−81.17 × 10−83.40 × 10−11
A. W.MPt5.78 × 10−97.21 × 10⁻¹⁰−3.48 × 10−112.18 × 10−92.36 × 10−111.33 × 10−98.29 × 10−107.25 × 10−101.86 × 10⁻¹²
Biod.MPt3.65 × 10−104.09 × 10⁻¹¹−1.58 × 10−121.52 × 10−101.27 × 10−127.29 × 10−114.78 × 10−115.18 × 10−111.77 × 10⁻¹³
B. T.MPt8.19 × 10−101.05 × 10⁻¹⁰−6.34 × 10−123.28 × 10−103.34 × 10−121.84 × 10−101.12 × 10−109.31 × 10⁻¹¹−2.65 × 10⁻¹³
H. H.MPt4.47 × 10−65.71 × 10−72.40 × 10−71.23 × 10−61.89 × 10−89.97 × 10−77.69 × 10−76.36 × 10−79.43 × 10−9
A. R.MPt1.01 × 10−51.46 × 10−69.53 × 10−87.60 × 10−76.58 × 10−83.33 × 10−62.85 × 10−61.45 × 10−67.89 × 10−8
TOT.MPt1.47 × 10−52.04 × 10−63.35 × 10−72.03 × 10−68.51 × 10−84.35 × 10−63.64 × 10−62.09 × 10−68.83 × 10−8
Table 13. Social performance indicators at a midpoint level (Impact) and endpoint level (Damage), related to 1 m2 of porcelain stoneware tile.
Impact CategoriesUnitImpactDamage CategoriesUnitDamage
Child LaborPt6.52Labor Rights & Decent WorkPt8.13 × 101
Forced LaborPt6.75Health & SafetyPt1.29 × 102
Excessive Working TimePt7.97Human RightsPt1.83 × 101
Injuries & FatalitiesPt5.85 × 101GovernancePt3.89 × 101
Toxics & HazardsPt7.09 × 101Community InfrastructurePt1.11 × 101
Poverty Wage 2Pt4.38
Poverty Wage 1Pt3.58
Migrant LaborPt1.01 × 101
Collective Bargaining etc.Pt3.39 × 101
Indigenous RightsPt0.00
Gender EquityPt9.65
High ConflictPt8.65
Legal SystemPt1.13 × 101
CorruptionPt2.76 × 101
Drinking WaterPt4.35
Improved SanitationPt4.80
Hospital BedsPt1.94
Inadequate social benefitsPt8.10
TOTALPt2.79 × 102 4.20 × 10²

