The Resource Base of Silica Glass Sand versus Glass Industry Development: The Case of Poland


Mineral and Energy Economy Research Institute, Polish Academy of Sciences, J. Wybickiego 7A, 31-261 Kraków, Poland
*
Author to whom correspondence should be addressed.
Resources 2020, 9(11), 134; https://doi.org/10.3390/resources9110134
Submission received: 6 October 2020
/
Revised: 16 November 2020
/
Accepted: 17 November 2020
/
Published: 20 November 2020
(This article belongs to the Special Issue Mineral Resource Management: Assessment, Mining and Processing)
Abstract
:The production of glass in Poland, especially of container and flat glass, has constantly risen for at least 30 years. New investments in this sector, which have recently been completed or are currently in progress, create optimistic prospects for further development of this industry, whose total annual production capacities in the next few years is expected to exceed 4 million tons. This will result in increasing demand for basic glass-making raw materials, especially high-quality silica sand (glass sand), which can be satisfied almost entirely from domestic sources. Poland as a country with a considerable resource base of these mineral raw materials, has noted a constantly growing production level that currently reaches approximately 2.8 million tons per year. This paper aims to characterize and interpret the development trends in the Polish glass industry in an international context, as well as the resulting increase in demand for glass sand. In this context, an attempt was made to answer questions concerning the sufficiency of the Polish domestic resource base for the production of glass sand. For this study, the leading recent international and Polish analyses, related to glass industry development, the resource base of glass silica sand, and the management of these types of sand, were taken into account, and were complemented by official statistical data and surveying of domestic glass producers. The performed analysis showed that when taking into account the available glass sand resources in developed deposits in Poland, it is possible to continue production at the existing or a slightly increasing level for another 20–25 years. Based on a more comprehensive perspective, however, it would be a good approach to continue providing access to those parts of currently extracted deposits of silica sand and sandstone that are now located outside of the existing exploitation licenses, as well as enabling the development of some satellite deposits in the Tomaszów Basin, which may prove difficult due to environmental factors.
1. Introduction
Glass production has been carried out for over 5000 years. Until the 1st century BC, glass objects were mainly ornaments and small containers for cosmetics. During Roman times, glassworks were common in Rome, as well as in other important cities of the Roman Empire. In the Middle Ages, stained glass windows appeared in numerous churches and cathedrals that were built all over Europe. The crusades enhanced the glass production movement with new techniques coming from the East, especially methods using main batch components. New types of glass furnaces, their growing sizes, as well as improvement of melting processes and forming processes and advanced glass production automation were introduced in the 19th century, and glass products became widely available during this time. Throughout the 20th century, the trend towards automation accelerated and melting tanks were applied to all types of glass. Finally, the last 60 years saw revolutionary inventions of float flat glass and insulation glass [1,2,3,4].
In Poland, glass making, primarily carried out in artisanal glassworks, dates back to at least the 12th century. The first factories, described as glass works, were established in the 14th century, producing mostly household glass [5]. The dynamic development of the glass industry in Poland, which was related primarily to the construction of large flat and container glass factories, took place after World War II. A substantial technical and ownership transformation of this industry, resulting in the tripling of the total glass production, was reported over the last 60 years [6].
Annual global glass production has been estimated to be ca. 150 million tons during recent years, with container glass making up a 45–50% share and flat glass making up a 30–35% share of. Fiberglass, table glass, and specialty (technical) glass have made up the remainder of global glass production. There are currently more than 1300 glass companies with ca. 2400 furnaces producing different types of glass in almost 100 countries [4]. The EU’s annual glass production recently returned to constituting over 35 million tons, with Germany, France, Spain, Italy, the UK, and Poland as the main glass manufacturers [7]. Glass containers represent more than 60% of total glass production in the European Union and flat glass accounts for another 30% [8].
The Polish glass industry is very diversified in terms of its range of manufactured products, the scale of its production, as well as the types of applied technologies that it uses. A substantial majority of manufactured glass is soda-lime silicate glass. This type of glass is made using silica (SiO2) and is introduced to the raw material batch partially in the form of pure silica sand (with a ratio of 70–75% silica sand) and partially in the form of glass cullet (including both one’s own and a post-consumer cullet) [9]. Having a strong domestic base of glass silica sand enables Poland to systematically meet almost all of the growing needs of its glass industry for silica raw materials. As a result of this, further development of the glass industry in Poland can be expected in the near future. This development would primarily include the establishment of new factories producing flat glass using the float method, particularly for the purpose of developing highly specialized products such as: low emissivity glass, a solar control, and an absorptive glass for highly energy-efficient buildings [10,11] for the developing automotive industry; and products used in the increasingly developing renewable energy sources sector (e.g., solar collectors [12]). A rapid increase in the production of container glass, in turn, has been recently noted both in Europe as a whole and in Poland as the result of growing ecological awareness of consumers and withdrawal of food containers made using plastic (such as beverage bottles) and their gradual replacement with glass containers. At the same time, constant growth in the rate of container glass recycling has been noted [13].
A constantly growing glass industry in Europe demands increasing amounts of appropriate raw materials, including the most important one: glass silica sand. Silica sand is mostly composed of quartz grains with a size of 0.1–2.0 mm, which are characterized by having a high content of quartz (min. 95%, even up to 99.9% SiO2) and a low amount of impurities (e.g., Fe2O3 even down to 0.01%). Silica sand can be produced from both loosely consolidated sand and by crushing weakly cemented sandstones. Silica sand is valued for its physical and chemical properties, especially a very high SiO2 content; a very low impurities content; as well as a commonly narrow grain size distribution, e.g., 0.1–0.5 mm for glass silica sand [14,15,16]. Silica sand with an adequate quality level may be used not only for glass production, but also as casting molds in foundries, ingredients of ceramics batches, proppants in shale hydrocarbons extraction, fillers and extenders in polymers, paints and rubber, for water filtration, and for many other uses. Silica sand can also be the starting point for the manufacturing of water-soluble sodium silicates and other downstream silicon chemicals [14,15]. The global market for silica sand is estimated to be at over 300 million tons per year, while in the EU the market for silica sand exceeds 30 million tons per year (including over 15 million tons per year for glass production), which is sourced through domestic production, especially in the Netherlands, Italy, France, Germany, Poland, the UK, Spain, Bulgaria, Belgium, and Czechia. Silica resources for high-quality silica sand production are limited mostly to the above-mentioned countries, especially the Netherlands, Germany, Poland, Czechia and the UK [14,15,16,17,18,19,20,21].
To obtain a high-quality glass silica sand, a set of processes must be employed, including most commonly screening to remove oversize, washing to remove the fines fraction (<0.1 mm), classification to produce appropriate sand grain ranges, as well as the physical cleaning of sand particles by attrition (commonly during washing). The production of the highest grades requires further physical and/or chemical processing, such as gravity separation (spiral classifiers); froth flotation; high-intensity magnetic separation; and also acid leaching with the use of, e.g., sulfuric acid [15,16,22,23]. Currently investigated, more sophisticated methods of glass sand beneficiation, especially with the aim to obtain the highest quality grades for solar and optical glass, include, e.g., reverse flotation techniques [24], power ultrasound techniques [25], bacterial treatment [26], combined oxalic acid leaching and photocatalytic effluent treatment [27], combined ultrasound techniques and oxalic acid leaching [28], and combined thermal treatment and acid leaching [29]. On the other hand, work is underway to obtain high-purity silica from renewable sources—e.g., from rice hulls [30]. Undoubtedly, some of these techniques are not environmentally friendly—e.g., flotation or acid leaching [31].
The expected further development of the Polish glass industry will result in continuously increasing demand for basic glass-making raw materials, and, in particular, for its most important group, which is high-purity glass silica sand. The demand for glass sand has been and presumably will be covered practically entirely by production from domestic sources. In this context, it is, however, important to provide long-term access to the high-purity silica sand and sandstone deposits that are located in Poland almost exclusively in two areas: the Tomaszów Basin in the central part of Poland and the North-Sudetic Basin in south-western Poland (see: Figure 4) [21].
Against this background, the paper aims characterize and interpret the development trends in the Polish glass industry in an international context, as well as the resulting increase in demand for primary mineral raw material batches for glass production, with special attention paid to the main component—glass silica sand. In this context, on the basis of the analyzed resource base of glass sand in Poland and the use of this base, the authors have attempted to answer the questions of whether the further expected development of the Polish glass industry has sufficient security in the long term with regard to the supply of glass silica sand and what are the main factors influencing the sufficiency of the domestic resource base for the production of glass silica sand.
2. Materials and Methods
For the analysis of trends of world glass technology development, the leading recent international analyses were taken into account [8,32,33,34,35,36,37]. For an in-depth analysis of glass industry development in Poland in the years 1990–2019, official data published by Statistics Poland (GUS) [38] were analyzed. Moreover, the main glass producers were identified and surveyed in the middle of 2019 by phone or e-mail to estimate their production capacities, type of manufactured glass products, expansion plans, and demand for glass sand and other raw materials, as well as the quality parameters of the glass silica sand used by them. Out of the 42 largest domestic operations representing all the glass-making branches (container, float, household, technical, glass fiber) that were canvassed, data were received for 30 glass plants. This survey was fully voluntary and did not cover all glass producers but only the largest ones; however, according to Statistics Poland’s (GUS) data, it can be concluded that, in the glass container sector, the answered surveys captured 82% of the market, while in the case of flat glass responses were obtained from 3 out of 4 existing producers, representing 57% of the market in terms of production volume.
In the case of the resource base of silica sand deposits in Poland and its use, the most important sources of information which were taken into account included annual publications referring to the mineral resource base in Poland [39,40], comprehensive reviews of this resource base [41,42,43,44], and previous analyses of the glass sand market in Poland [45,46], as well as the official data published by Statistics Poland (GUS) for the years 1990–2019 [38]. Moreover, all 4 glass sand producers were identified and surveyed by phone or e-mail in the first half of 2020 to estimate their production capacities, types of offered products, and quality parameters of glass sand.
3. Results
3.1. Trends of Glass Industry Development in Poland Compared to Other EU Countries
Glass production in Poland has been continuously growing since the beginning of the 1990s, when substantial technological changes and the related construction of new plants combined with the closing of multiple technologically obsolete plants took place. At the moment, the Polish glass industry represents generally a very high technological level with a strong diversification in terms of the types of obtained products, applied technologies, as well as the scale of manufacturing of individual products [6]. The production of the largest plants, mainly flat glass factories and some container glass factories, usually is even at a level of above 300 thousand tons per year, while the production of the smallest artisan-type works does not exceed 1–2 thousand tons per year. The total production of glass products in Poland is systematically growing, reaching the level of almost 3.5 million tons in 2019 (Table 1). It is strongly dependent on and related to container and flat glass production development—two of the most dynamically growing branches of the glass industry. In the structure of glass production in Poland, similarly to the whole of Europe, glass containers prevail. According to the Glass Alliance Europe Association, glass containers represented in 2018 more than 61% of the total glass production in the European Union and flat glass accounted for another 30% [8]. The major sectors of glass container consumption are the beverage segment, with a market share of 75%; the food segment, with 20% (mostly jars); as well as perfumery, cosmetics, pharmaceuticals, and technical products containers, using mostly small bottles, and accounting for the remaining 5% [36]. As far as flat glass is concerned, the two main types of products are rolled glass and float glass (with the latter accounting for a 95% market share). The most important flat glass markets are the construction sector, accounting for 75–85% of the flat glass consumption, and the automotive industry, with a 15–25% share. Solar glass is a significant emerging user of flat glass (requiring special types of bright clear glass [47]), however at the moment its share is still negligible (below 2%), despite the reported rapid growth of demand (especially in Germany and the UK).
Due to the global economic crisis of 2008, the EU glass production level was greatly reduced, but finally in the years 2017–2018 it returned to the previously noted level of above 35 million tons per year [9,10,32,33]. The share of Poland in the European glass production in this period has been estimated at ca. 10%, and as a result of this it has become one of the major European glass suppliers among countries such as Germany, France, Spain, Italy, and the UK. According to the data of the European Association of Flat Glass Manufacturers [34], Poland is the third largest European producer of flat glass, following Germany and France (accounting for a 10% market share). According to the data of the European Container Glass Federation [35], 7 out of 160 container glass factories operating in Europe are located in Poland, including the largest of this kind in Jarosław. Simultaneously, Poland is 6th largest container glass producer in Europe, following Italy, Germany, France, Spain, and the UK.
Container glass (mainly bottles and jars) accounted for 51% of the total glass product sales in Poland in 2019 (Figure 1), while flat glass (mainly for construction and automotive purposes) represented about 42% of domestic production (with a 98% share of float glass). Other glass products are of lower importance, with household glass (tableware, craft, crystal glass) accounting for 2–5% of the total sales, technical glass (laboratory, lighting, electrotechnical) at ca. 1–2%, and a wide array of products based on glass fiber at ca. 4–5%.
In the analyzed period 1990–2019, the volume of glass production in Poland more than tripled to almost 3.5 million tons (Table 1). The greatest increase in the production volume has been noted for container glass (from 577 to 1801 thousand tons) and flat glass (from 345 to 1463 thousand tons), owing to substantial investments in these sectors. The dynamic growth of flat glass production using the float method, with a diminishing role of traditional methods of flat glass production (drawn, rolled), has been characteristic for this period. In the case of other glass industry sectors, representing a significantly lower scale of production, a significant increase has been noted for glass fiber (six-fold increase to more than 100 thousand tons per year; Figure 1). On the other hand, the production of crystal glass in the category of household glass has almost completely disappeared.
The production of glass containers has recently reached the level of 1.8 million tons per year (Table 1). The largest domestic producers currently are (1) O-I Produkcja Polska S.A., which owns the Jarosław factory, the world’s largest O-I plant, and the smaller Antoninek factory; (2) BA Glass, belonging to the Spanish Bavidro group with glass factories in Sieraków and Jedlice; (3) Polampack S.A. Orzesze Glass Factory; (4) Ardagh Glass plc, with glass factories in Ujście, Gostyń, and Wyszków; (5) Stölzle Glass Group, with glass factories in Częstochowa and Wymiarki (Table 2). Other smaller manufacturers specialize in the production of selected types of glass containers, including, for example, cosmetic containers, lanterns, jars, etc. [48].
Flat glass production has currently reached the level of almost 1.5 million tons per year (Table 1). It is dominated by four large manufacturers belonging to the world’s most important players, whose total production capacities in Poland exceed 1.5 million tons per year (Table 2). They are: (1) Pilkington Polska Sp. z o.o., with the first glass factory established in Poland in 1995 in Sandomierz (belonging to the British Pilkington firm, currently the NSG Group); (2) Polfloat Saint Gobain Sp. z o.o. in Dąbrowa Górnicza-Strzemieszyce (belonging to the French firm Saint Gobain), (3) Guardian Industries Poland Sp. z o.o. in Częstochowa (owned by the American firm Guardian Industries Corp.); (4) Euroglas Polska Sp. z o.o. in Ujazd near Łódź (in the structure of the German and Swiss company Press-Glas S.A.; Table 2). In the years of 2018–2019, the plants in Dąbrowa Górnicza and Ujazd were extended, while the plant in Częstochowa will undergo extension in 2020 [48]. The main recipient of flat glass (75–85% of production) is the construction materials industry. The main processed product of this sector is windows, in the form of one- and two-chamber glazed units, and recently even three-chamber glazed units. The remaining 15–25% of flat glass is processed into panes for the automotive industry [36].
In the structure of household glass production, tableware glass and craft items made of soda-lime silicate glass are prevalent. The main two manufacturers of this type of glass are Krosno S.A. in Krosno and Irena S.A. in Inowrocław. Krosno S.A. specializes in the production of manually formed and automatically formed glass tableware. Irena S.A., on the other hand, is one of the main manufacturers of crystal glass and automatically formed glass tableware. Smaller factories supplying a similar assortment include HSK Violetta in Stronie Śląskie (crystal glass); HSG Tarnów S.A. (automatically formed glass tableware); Tadeusz Wrześniak Group with plants in Tarnów, Grzybów, Iwonicz-Zdrój, Chełm, Parczew, Dubeczno, Skrzyszów, Polanica, and Dąbrowa near Warsaw (manually formed household glass).
In the technical glass sector, individual factories specialize in the production of bulbs—Philips Lighting Poland in Piła; manually formed lighting glass—Biaglass in Białystok; headlamps and lamp shades for the automotive industry—HS Jasło in Jasło; glass blocks—Vitrosilicon with factories in Żary and Iłowa; frits for glazes—Quimicer in Opoczno; optical lenses—JZO in Jelenia Góra. Where glass fiber is concerned, there is only one entity operating on the market—Krosglass S.A. with its production in the range of 6 thousand tons per year. Products made of glass fiber, in the form of e.g., glass mats, are manufactured also by other companies on the basis of imported glass fiber.
The glass and glass products manufactured in Poland find consumers both in the country and abroad. Within the last 25 years, the volume of their exports increased by nearly an order of magnitude, reaching the level of more than 1 million tons per year (Table 1). In the structure of exports, container glass is by far the most prevalent (47% in 2019), with a smaller share of flat glass (21%) and household glass (18%). At the same time, the growing volume of glass, in particular flat float glass, comes from imports. The volume of supplies over the same period usually exceeded the level of exports, reaching nearly 1.5 million tons in 2019 (Table 1). In the structure of imports, flat glass dominates (49%), with container glass (30%), technical glass (8%), glass fiber (7%), and household glass (6%) prevailing. Growing imports of flat glass with the concurrent launching of new float glass factories by Euroglas in Ujazd (2019) and Guardian Industries in Częstochowa (planned opening in August 2020) clearly indicate that the demand for this type of products is sharply rising (Table 1).
3.2. Primary Mineral Raw Materials Used in the Glass Industry
The vast majority of the glass produced is soda-lime silicate glass made with silica (usually at an amount of 70–75% SiO2 in a raw material batch), sodium oxide (12–16% Na2O), and calcium oxide (10–15% CaO), as well as small admixtures of other chemical ingredients to impart specific characteristics to the glass [9,35,48,49,50,51]. These kinds of glass are broadly used in the production of both container and flat glass [52,53].
Silica is introduced to a raw material batch primarily in the form of silica sand, meeting the stringent standard requirements, especially with respect to the contents of coloring oxides (Fe2O3 and TiO2; [54]) and graining (fraction 0.1–0.5 mm; [55,56]). Another important source of silica is glass cullet in the form of own and post-consumer cullet [6,15].
In some glass-making batches, a part of calcium oxide may be replaced with magnesium oxide (MgO) and a part of sodium oxide with potassium oxide (K2O). The carrier of calcium and magnesium oxides are limestone and/or dolomite flours, while the carriers of Na2O and K2O are synthetic carbonate raw materials, such as soda ash Na2CO3 and, to a lesser extent, potash K2CO3, as well as nepheline syenite or feldspars [15,21,57].
A chemical composition different from that of soda-lime silicate glasses can be found in less popular lead glasses (limestone is typically replaced with PbO, accounting for 18–38% by weight), aluminosilicate glasses (15–25% Al2O3), or borosilicate (B2O3 > 8%) glasses. Diversified chemical composition combined with the presence of various admixtures, which modify glass properties, result in the fact that individual kinds of glass substantially differ one from another with respect to the possibilities of their commercial use [52].
3.3. Silica Sand as a Basic Raw Material Used in Glass Production
The glass industry places strict requirements on glass sand that depend on the type of glass products to be made and their coloring. Silica sand of the highest quality (meeting Sp and 1 class requirements - in accordance with those that are traditionally used but are no longer binding industry standard BN-80/6811-01), with contents of coloring oxides (TiO2+Fe2O3) below 0.03%, is used to produce optical lenses, solar panel glasses, and laboratory equipment made of transparent silica glass. Sand of class 1 and more rarely of class 2 is used in the production of crystal glass; sand of class 3 is mainly used in the production of tableware glass; and sand of class 3 and 4 is used in window flat glass and other types of construction glass, as well as transparent container glass. The lowest classes of sand—5 and 6—are used in the production of colored container glass and insulators (Table 3). The introduction of the float method in flat glass production resulted in more stringent requirements placed on mineral raw materials for the glass industry, mainly with respect to graining (90% of a fraction must be in the range of 0.1–0.4 mm), SiO2 contents above 99%, maximum Fe2O3 contents in the range of 0.02–0.05%, as well as Al2O3 contents within the range 0.25–0.35% [58]. The last parameter makes it necessary to use mineral raw materials of higher classes (Class 2 and 3), despite the fact that individual producers more and more often set limit parameters with respect to the expectations of main recipients [21].
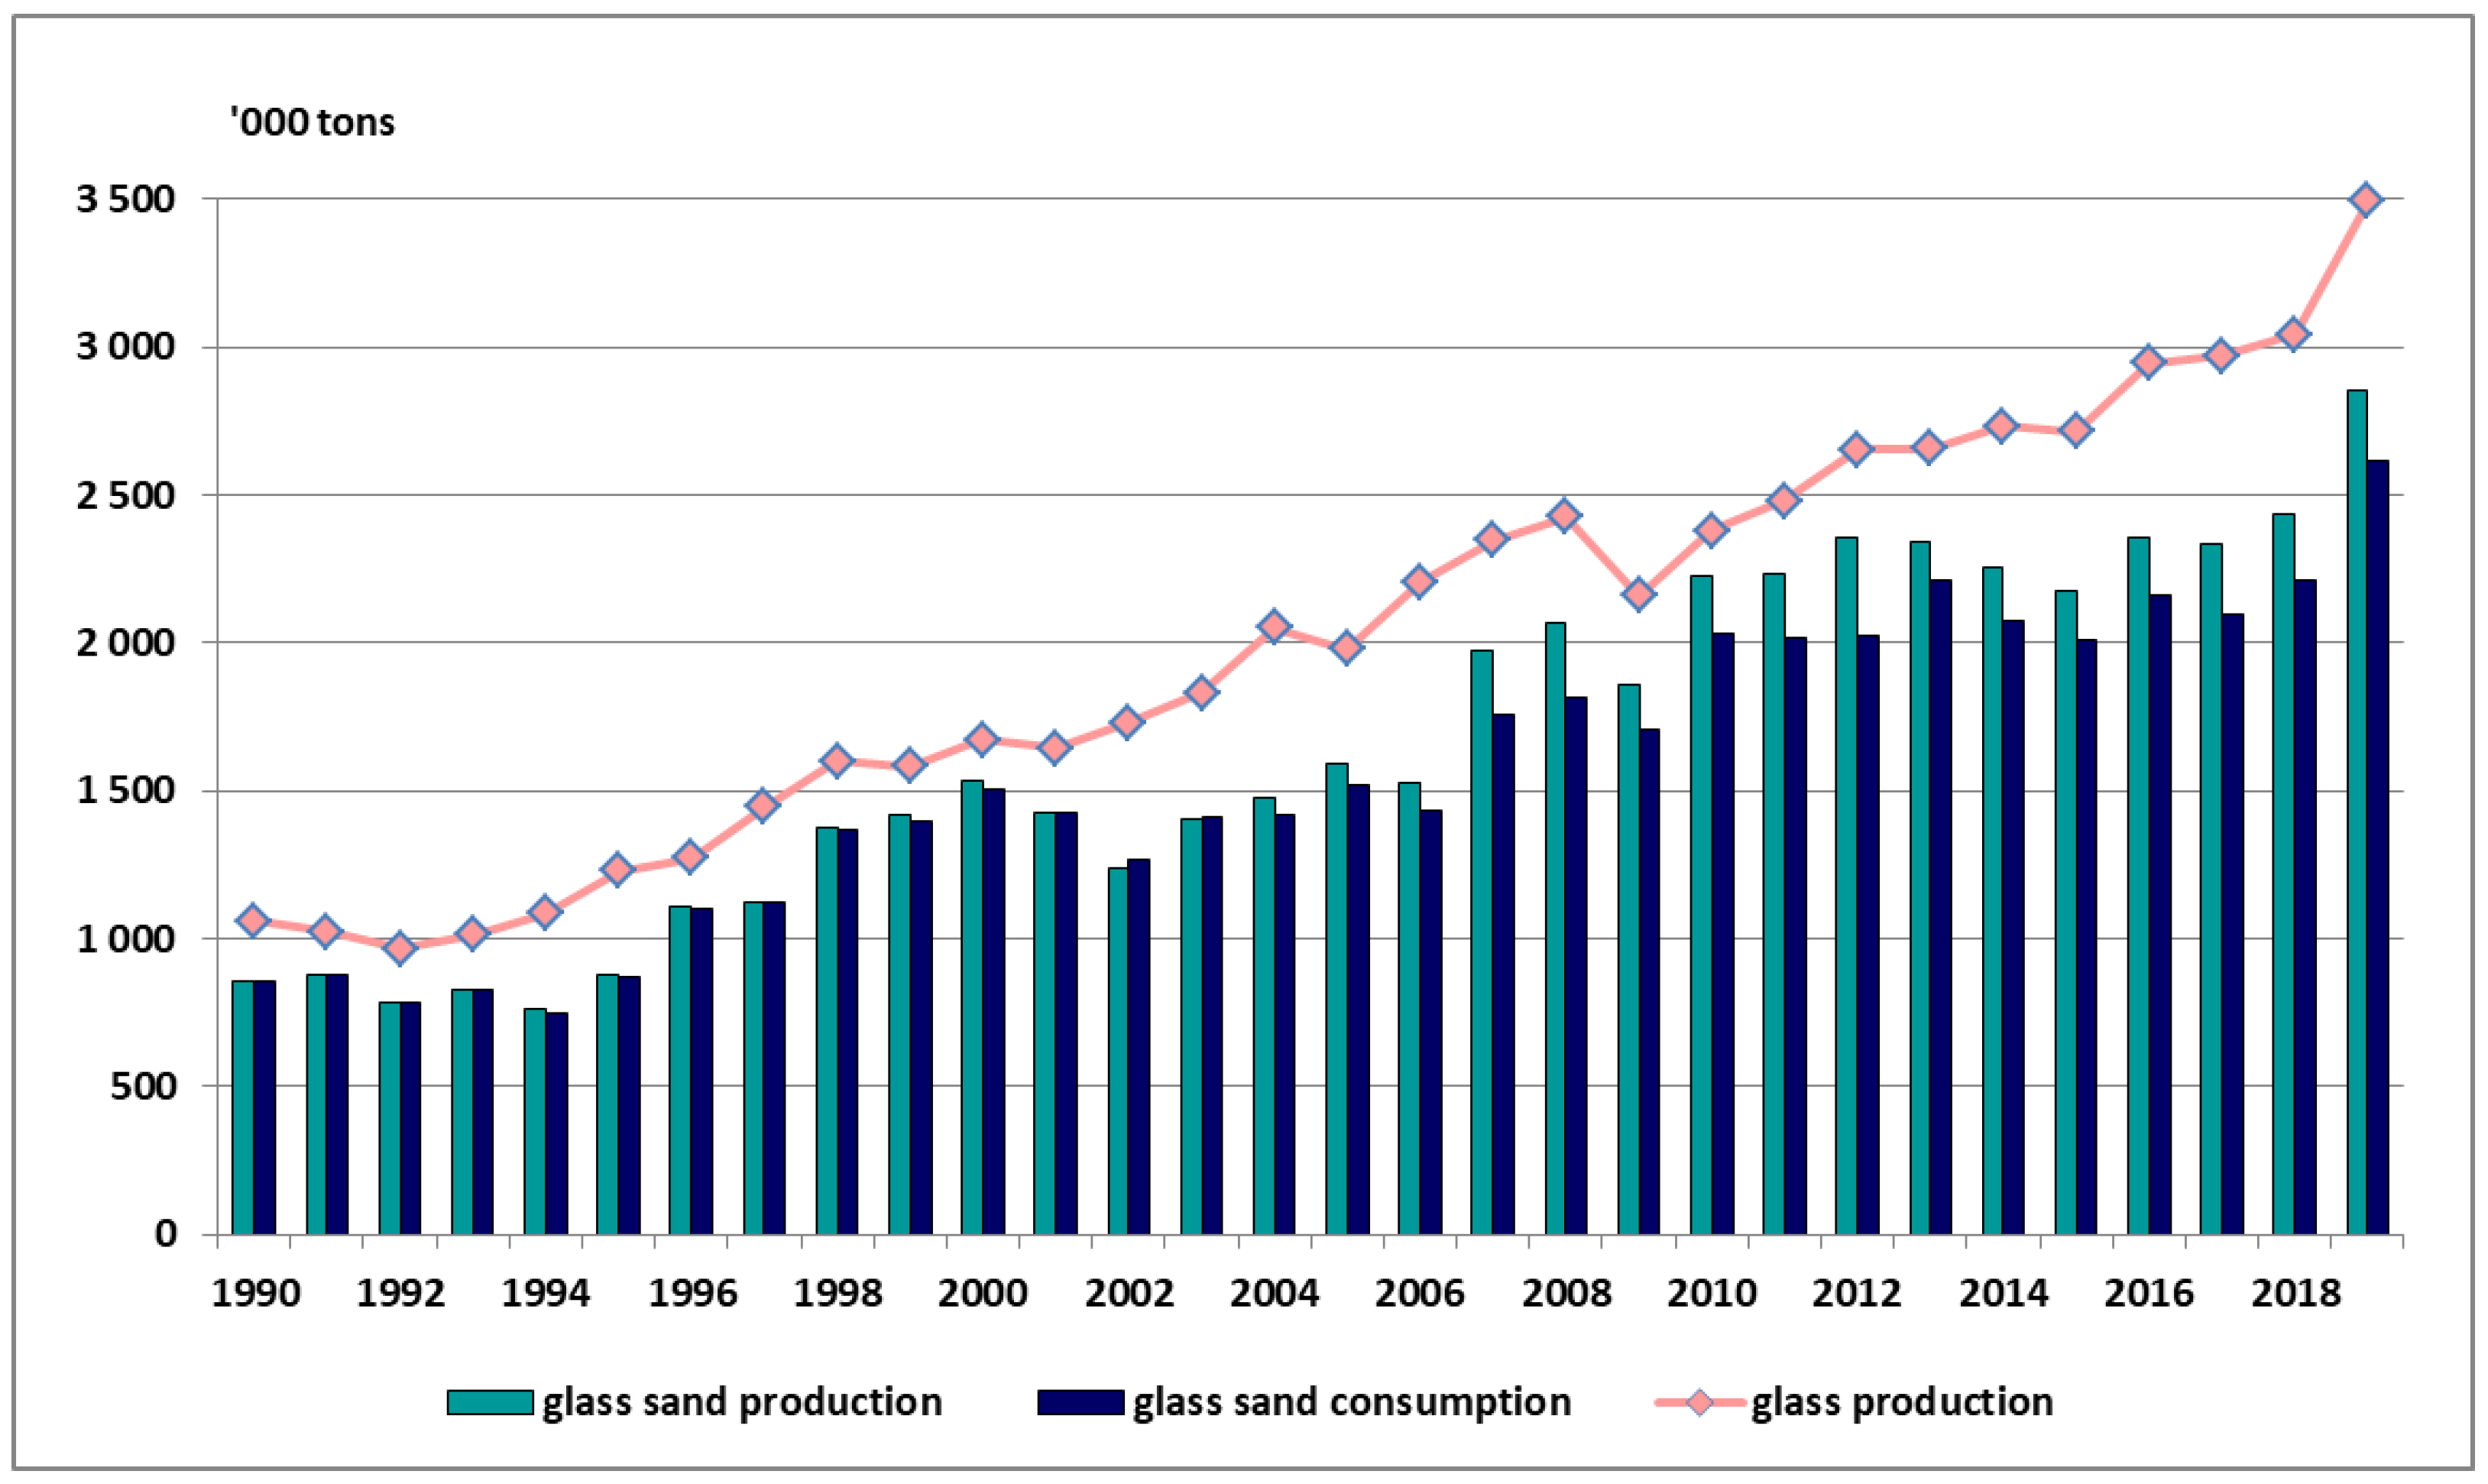
Poland is a country with considerable amounts of mineral raw materials required for the production of glass. It particularly concerns silica raw materials. The domestic resource base of high-purity silica sand and the production of glass silica sand developed on this basis make it possible to meet almost all the needs of the Polish glass industry with respect to this raw material. Only small amounts of the highest quality sand (mainly from Germany) have been periodically imported, as well as cheaper mineral raw materials from Ukraine for container glass production in the Jarosław factory [21]. The substantial development of domestic glass sand production, especially after 2007, has been also related to the increase in exports to neighboring countries (Czechia and Slovakia) in amounts representing 10–12% of domestic sales of these raw materials (Table 4, Figure 2).
3.4. The Resource Base of Glass Sand in Poland and Its Use
3.4.1. Volume of the Resource Base and Its Changes
Poland is relatively abundant in terms of its deposits of silica sand and sandstones suitable for the needs of the glass industry. Some of the largest and purest deposits of silica sand in Europe are located in Poland [42]. Due to this fact, the production of domestic glassworks is almost entirely based on the extraction of such sand from domestic deposits.
The total domestic resources of deposits of sandstone and silica sand recognized as suitable for the glass industry reached the volume of approx. 644 million tons at the end of 2019 (Figure 3, [39]). Since 1990, their total volume has risen by ca. 10%, with the most rapid growth in the years 1990–2005. During the last decade, the total volume of recognized resources of glass sand has not changed significantly. Many deposits already recognized in the 1970s and 1980s, as a result of more detailed exploration, have been divided into smaller deposit areas, taking into account land ownership rights and environmental conditions. It is worth mentioning that they were recognized according to non-uniform criteria and, additionally, some deposits where mineral raw materials may be partially useful for the production of glass sand are recognized as silica sand for other applications (e.g., foundry sand). However, the majority of these mineral resources are recognized within the Polish resource category C1, which is approximately equivalent to the Indicated Mineral Resources according to the CRIRSCO Template. This means that the possible error in estimating the size of these mineral resources is below 30% [21].
3.4.2. Main Areas of Occurrence and Quality Parameters
The silica sand and sandstone deposits recognized for glass industry purposes in Poland are related to sedimentary formations of various age (from the Cretaceous to Quaternary periods) and are unevenly distributed across the country (Table 5). They occur primarily in the Tomaszów Basin in the central part of Poland, where ¾ of the total domestic resources can be found. In this region, 11 deposits with a total resource amount of ca. 490 million tons have been recognized [39]. These include sand and loosely kaolinite-cemented sandstones from the Early Cretaceous period, which are a part of the so-called Biała Góra formation [21,43]. They have wide range of possible applications, including foundry sand, sand for construction adhesives, high-quality construction sand, and filtration gravel, while the fine fraction recovered during sand beneficiation finds use in the production of kaolin [45,46]. The stringent quality requirements of the glass industry with respect to grain size and chemical composition are primarily met by sand from the Potok and Smardzewice units, where the silica content is usually higher than 98%, while the Fe2O3 and TiO2 contents are below 0.08% and 0.10%, respectively [42]. Class 2–4 glass sand (and, until recently, also class 1a) can be obtained from this kind of sandstone after appropriate enrichment (multiple washes and the removal of heavy minerals).
The second most important area of occurrence of silica sand and sandstone suitable for the glass industry is the North-Sudetic Basin (Table 5). The total resources of seven deposits recognized in this region are estimated at ca. 80 million tons [39]. The sand and loose sandstone of the Late Cretaceous period that occur in these deposits are of very high purity (Table 6), enabling the production of top-quality glass sand (including Sp and 1st class sands). The average contents of SiO2 in recognized deposits exceed 99%, the Fe2O3 is up to 0.04%, and the TiO2 is below 0.07%. The average contents of the prevalent 0.1–0.5 mm fraction are usually above 80% (Table 6).
Deposits in other regions of Poland in general have smaller resources with poorer quality parameters, including lower SiO2 contents and a higher share of coloring oxides. They represent genetically diversified sand sediments of the Miocene and Quaternary age. Miocene glass sand occurs in the Zamość and Tarnobrzeg regions (south-eastern Poland), the Żary region (south-western Poland), and in northern Poland. In total, nine deposits have been discovered in the territory of six provinces, with resources representing more than 23 million tons (Table 5). The mineral raw materials recognized in these deposits are suitable primarily for the production of glass sand of lower classes (from class 3 to 6). The Quaternary sand, belonging to fluvioglacial and dune sediments, occurs in seven deposits, with total resource amounts of over 22 million tons (Table 5). This is a clayey sand with a relatively low content of SiO2 (usually 95–96%) and high contents of Fe2O3 and Al2O3, which strongly limits the possibilities of their use in the glass industry. In general, they meet the requirements of the lowest class, class 6, and therefore may be used solely for the production of container colored glass. The amount of their primary 0.1–0.5 mm fraction is considerably lower than that of Cretaceous and Miocene sands. The larger Quaternary sand deposits are located in the regions of Wyszków, Ujście Noteckie, and Lubartów [39,59].
3.4.3. The Status of Resource Base Development and Its Sufficiency
The resource base of glass silica sand and sandstone in Poland has been, in recent years, systematically depleted as a result of the growing scale of exploitation. In particular, this refers to the highest quality Cretaceous sand and sandstone of the Tomaszów Basin, currently mined from five out of eleven recognized deposits, and, to a lesser extent, Cretaceous sand and sandstone of the North-Sudetic Basin, where only one out of seven recognized deposits is mined. In the first region, the developed deposits constitute 30% of the total recognized deposits, while in the latter one this share does not exceed 20%. All the deposits of Miocene sands and nearly all the deposits of Quaternary sand currently remain undeveloped. These varieties of glass sand have considerably lower quality parameters and a smaller volume of resources.
The relatively short period of mineral reserve sufficiency is very unfavorable with respect to ensuring the continuity of glass sand supplies from the long-term perspective. At the current levels of mining, this is estimated at ca. 25 years. The volume of these reserves has been considerably reduced from the level of ca. 200 million tons in 2011 to ca. 66 million tons in 2019 due to the issuing of new exploitation licenses and the continuing mining extraction (Figure 3). In these circumstances, with no appropriate actions being taken in the last several years, it is possible that the mineral reserves of valuable exploited deposits in the Tomaszów Basin will be depleted, especially the reserves of the deposits Biała Góra II–Wschód and Unewel–Zachód–Nowy (in 2019, they accounted for 40% of the extraction in this region; Table 7). Over the nearest decade, the reserves of high-purity sand in the only mined deposit of the North-Sudetic Basin region (Osiecznica II deposit) will also be depleted. As the majority of resources of currently mined deposits are currently not qualified as mineral reserves (mostly due to the lack of land ownership rights), it will be necessary to extend their mining license areas to extend the lives of these mines. On the other hand, the development of new deposits, especially within the Tomaszów Basin, is also important. The acquisition of exploitation licenses for new deposits may be limited in many cases due to existing environmental constraints—e.g., the occurrence of deposits within the borders of landscape parks, Natura 2000 areas, or concise forested areas. In accordance to the valorization of undeveloped deposits carried out in 2013 [43], this problem may in particular refer to three deposits in the Tomaszów Basin area (Góry Trzebiatowskie, Radonia, and Zajączków) and four deposits in the North-Sudetic Basin area (Ołobola, Osiecznica-Stanisław, Parowa, and Władysław) that are considered as the deposits with the most stringent environmental limitations.
3.4.4. Prospects for Resource Base Expansion
According to the Balance of Prospective Mineral Resources in Poland as of the end of 2018 [44], the possibilities of expanding the national resource base of silica sand and sandstone for the glass industry are quite high, however they basically concern only a few areas located in the Tomaszów Basin. In the neighborhood of the recognized deposits, four prospective areas with a total amount of inferred resources equivalent to 270 million tons have been designated [44]. Additionally, one prospective area with a small amount of inferred resources of approx. 3.7 million tons has been designated in the North-Sudetic Basin, two small prospective areas of Miocene sands have been designated in the Żary region (south-western Poland), and one very small prospective area of Miocene sands has been designated in the Sławno region (northern Poland).
3.4.5. Extraction and Production of Glass Sand in Poland with Its Quality Parameters
The extraction and production of glass sand in Poland is currently dominated by three producers operating in two main areas of high-purity sand and sandstone occurrence in Poland—i.e., in the Tomaszów Basin and the North-Sudetic Basin.
Recently, Tomaszowskie Kopalnie Surowców Mineralnych Biała Góra Sp. z o.o. (TKSM) in Smardzowice near Tomaszów Mazowiecki (since 2007, in the structure of the Quarzwerke GmbH group) has been the largest producer of glass sand. Currently, the mining extraction has been carried out in the deposits of Biała Góra I–Wschód, Biała Góra II–Wschód, and Unewel–Zachód–Nowy (earlier, Unewel–Zachód as well). In the course of beneficiation with the use of hydrocyclones and spiral classifiers, it is possible to obtain glass sand of classes 2 and 3 (Table 6). Until 2011, with the mining of the better-quality sand, it was also possible to obtain glass sand of 1a class. The construction of a new processing plant, which commenced in 2019, will enable the expansion of the TKSM products’ range and the improvement of their quality, including the re-upgrading of sands to class 1a. The volume of silica sand and sandstone extraction in TKSM mines over the last decade has greatly fluctuated between 730 and 1400 thousand tons per year (Table 7), with the production of glass-making grades in the range of 880–1270 thousand tons per year. In the structure of production, which is nearly waste-free, glass sand accounted for 79–86%, while the remaining part was represented by foundry sand and, to a lesser extent, kaolin and filtration gravel.
The second producer of glass sand within the Tomaszów Basin is Grudzeń Las Sp. z o.o., supplying glass sand falling under classes 2–4 (Table 8). In its two processing plants (Grudzeń Las and Syski), glass sand is obtained as a result of the enrichment of silica sand and sandstone extracted from the Grudzeń-Las deposit (formally, it is the foundry sand deposit), Piaskownica-Zajączków, and Unewel-Zachód-Las in varying amounts of 130–630 thousand tons per year. Additionally, the plant produces foundry sand and sand for construction adhesives.
Apart from the Tomaszów Basin area, a large and important producer of top-quality glass sand (classes 1–3, Table 8) is Kopalnia i Zakład Przeróbczy Piasków Szklarskich Osiecznica sp. z o.o. (since 1995, belonging to the Quarzwerke GmbH group). The glass sand produced at this plant is sold within the country as well as abroad. Glass sand—in terms of the coloring oxide contents, falling under class 3—is also obtained as a by-product from the processing of kaolinitic sandstone from the Maria III deposit near Bolesławiec by Kopalnie Surowców Mineralnych Surmin-Kaolin S.A. in Nowogrodziec (since 1998, also in Quarzwerke GmbH group).
Small amounts of glass sand are currently also obtained by Ardagh Glass S.A from the Mirosław AG deposit (part of the previously exploited deposit Ujście Noteckie II) for the needs of glassworks nearby. Until 2012, this firm has also exploited the Wyszków-Skuszew deposit (Table 7). Despite the low quality (class 6), the obtained sand meets the requirements of container glass suppliers for the production of dark glass (Table 8).
The problem related to meeting the glass industry’s demand for glass sand is the uneven distribution of its resource base, which is limited basically to two regions (central Poland—the Tomaszów Basin area; south-western Poland—the North-Sudetic Basin area), while glass factories are scattered across nearly the whole country (Figure 4). It is also noticeable that the production of glass sand in recent years has been concentrated in the hands of one entity—i.e., the Quarzwerke GmbH Group (KiZPPS Osiecznica, TKSM Biała Góra, and KSM Surmin Kaolin companies), which currently accounts for above 3/4 of the glass sand market in Poland (Figure 5).
3.4.6. Consumption of Glass Sand in Poland
In the domestic glass industry, the greatest amounts of glass sand are, without doubt, used for the production of container glass. It is estimated that, even with the assumption of the 63% level of container cullet recycling reached in 2018 (over 750 thousand tons of cullet), the consumption of glass sand for the production of glass containers currently reaches 750–800 thousand tons per year.
The second primary user of glass sand in Poland is float flat glass factories. In this case, the share of recycled cullet is small and is mostly based on the cullet obtained in glassworks or the cullet purchased from companies professionally dealing with the acquisition and recycling of flat glass from windows and automotive waste. It is estimated that the volume of glass sand consumed in Polish flat glass factories in recent years could exceeded 1 million tons per year [48].
Significant amounts of glass silica sand are also used in Poland for the production of soluble sodium silicates (so-called water glass). Their production is reported in the group of chemical products (not glass products), and for their production ca. 220–240 thousand tons of glass sand are consumed annually [38].
4. Discussion and Conclusions
The growing production of glass in Poland (mainly container and flat glass) in the last few years together with the new investments in this sector bring optimistic prospects for the further development of the glass industry. The significant investments made recently include, among others, the commissioning of a second float glass production line by Euroglas in Ujazd near Łódź, the extension of a container glass plant belonging to the O-I company in Jarosław, and the modification and modernization of the Saint-Gobain float glass factory in Dąbrowa Górnicza and of the Krosglass glass fiber factory in Krosno. On the other hand, some investments are still underway—e.g., another plant for float glass production in Guardian Industries in Częstochowa and the modification of Stőlzle Glass group factory in Częstochowa. The total production capacity of the Polish glass industry has already exceeded 3.5 million tons per year, and in subsequent years it is expected to rise to more than 4 million tons per year. This will result in a growing demand for basic glass-making raw materials and high-quality silica sand in particular, which can be—as before—satisfied almost entirely from domestic sources. The majority of companies producing glass in Poland—especially regarding glass containers and flat glass—are international companies, with their own strategies regarding the structure and volume of production of plants in individual countries, as well as regarding the possible international trade of these products. However, in this paper neither the development strategies of international glass companies nor the competitiveness issues related to these were analyzed in this paper, as, in our opinion, this requires a separate, detailed analysis.
Undoubtedly, for environmental reasons a factor hindering the development of glass production in Poland is the increase in the level of glass recycling, and the recycling of glass containers in particular. The current level of container glass recycling, estimated by the Central Statistical Office in 2018 to be at the level of 63% (i.e., more than 750 thousand tons), will have to be further increased due to EU requirements. The amended directive of the European Parliament and of the Council EU 2018/852 of 30 May 2018 on packaging and packaging waste provides for reaching the minimum level of container glass recycling of 70% in 2025 and 75% in 2030. Meanwhile, already in 2017 the average ratio of container glass recycling in the European Union has reached a record value of approx. 76% [35]. The growing consumption of glass cullet in EU countries is in line with efforts to decarbonize the glass sector. The beneficial environmental impact is, on the one hand, related to the lower energy consumption in the glass melting process and, on the other hand, to the lower demand for mineral raw materials [37,57]. However, the relationship between glass recycling development and the expected level of demand for glass sands requires a deeper analysis. Although these trends are quite clear for container glass, they are much more complex in the case of flat glass and technical and laboratory glass, where the degree of cullet recovery is difficult to estimate. For example, it is known that flat glass producers mostly use their own cullet, flat glass waste from other companies dealing in the processing and processing of this type of glass, and glass from specialized companies dealing with the purchase and recovery of flat glass from window and automotive waste. However, the common collection of this type of cullet is not carried out, as in the case of glass containers [57].
The main component for the production of various types of glass is silica, introduced to the production batch mainly in the form of high-purity glass silica sand with very low contents of coloring oxides, mainly Fe2O3 and TiO2 [21]. Poland is a country with considerable resources of silica sand and sandstone that are suitable for the production of high-quality glass sand. Due to the systematic development of the Polish glass industry since the beginning of the 1990s and despite the concurrent development of glass recycling, the production of glass sand in Poland has reported unceasing growth, and recently reached the level of ca. 2.8 million tons per year. The concentration of glass sand production, currently accounting for 3/4 of the domestic sales of these mineral raw materials, in the hands of a single entity—the Quarzwerke GmbH group—which is a relatively disadvantageous factor.
Considering the available resource base for the production of glass silica sand in terms of both the developed and undeveloped deposits as well as prospective areas, there are—in general—good conditions for the further development of glass silica sand production in Poland. However, it should be noted that the developed deposits’ reserves will allow us to carry out glass silica sand production at today’s level only for the next 20–25 years [44]. To secure the possibility of producing glass in Poland in the long term (over 25 years), the following activities are of the highest importance: (1) providing access to the parts of the currently exploited deposits of glass silica sand and sandstone that are located outside the existing borders of exploitation licenses (for ownership and environmental reasons); (2) enabling the development of some satellite deposits in the Tomaszów Basin that may encounter environmental constraints due to the location of deposits within the landscape park, Natura 2000 areas, or concise forest areas [43]. The first issue depends largely on arrangements between the current glass sand producers and the main owners of these parts of the deposits—i.e., the state forests. The second issue depends primarily on the proper valorization of mineral deposits, along with the prioritization of the land use of these areas (e.g., concise forest areas or mining use to meet the mineral needs of an important industry sector—in this case, the glass industry). The proposal of such solutions, including the introduction of the institution of Mineral Deposits of Public Importance, were presented in 2009, 2013, and 2018 [21,43,61]. However, the introduction of such solutions requires actions at the government level, including the approval and implementation of the Mineral Policy of Poland, the initial draft of which was presented in 2019 [62].
The aim of this manuscript was to characterize and interpret the development trends in the Polish glass industry in an international context, together with the resulting increase in demand for glass sand, and—in this context—to answer questions concerning the sufficiency of the domestic resource base for the production of glass sand. We have tried to show that securing this sufficiency in the long term can be a problem and needs some actions, even at the government level. In the study, some other potential limitations that may affect the demand for glass sands in Poland were not subjected to a detailed analysis but only briefly mentioned. These are, primarily, the development strategies of international glass companies together with the competitiveness issues related to these; the relationship between glass recycling development and the expected level of demand for glass sands; and—to an extent—also the possible competition of imported glass sand in the Polish market, or the low environmental friendliness of some techniques of glass sand beneficiation. Undoubtedly, these are topics for further detailed investigation.
Author Contributions
Conceptualization, A.B., K.G. (Krzysztof Galos), and K.G. (Katarzyna Guzik); methodology, A.B., K.G. (Krzysztof Galos), and K.G. (Katarzyna Guzik); validation A.B., K.G. (Krzysztof Galos), and K.G. (Katarzyna Guzik); investigation, A.B., K.G. (Krzysztof Galos), and K.G. (Katarzyna Guzik); writing—original draft preparation, A.B., K.G. (Krzysztof Galos), and K.G. (Katarzyna Guzik); writing—review and editing, A.B., K.G. (Krzysztof Galos), and K.G. (Katarzyna Guzik). All authors have read and agreed to the published version of the manuscript.
Funding
This research was financed from the statutory subsidy of the Mineral and Energy Economy Research Institute, Polish Academy of Sciences.
Acknowledgments
Preparation of this paper has been supported by the Polish National Agency for Academic Exchange under grant no. PPI/APM/2019/1/00079/U/001.
Conflicts of Interest
The authors declare no conflict of interest.
References
- Chopinet, M.H. The History of Glass. In Springer Handbook of Glass; Musgraves, J.D., Hu, J., Calvez, L., Eds.; Springer International Publishing: Basel, Switzerland, 2019. [Google Scholar]
- Kurkjian, C.R.; Prindle, W.R. Perspectives on the History of Glass Composition. J. Am. Ceram. Soc. 1998, 81, 795–813. [Google Scholar] [CrossRef]
- Shelby, J.E. Introduction to Glass Science and Technology; Royal Society of Chemistry: London, UK, 2005. [Google Scholar]
- Hubert, M. Brief Overview of Global Glass Production. In Springer Handbook of Glass; Musgraves, J.D., Hu, J., Calvez, L., Eds.; Springer International Publishing: Basel, Switzerland, 2019. [Google Scholar]
- Kamieńska, Z. Polish Glass until 19th Century; Ossolineum: Wrocław, Poland, 1987. (In Polish) [Google Scholar]
- Burkowicz, A. Trends in demand for raw materials consumed by the glass industry with an assessment of their possible supplies from current and future domestic sources. Gór. Odkryw. 2013, 54, 59–65. (In Polish) [Google Scholar]
- Glass Factories under the Industrial Emissions Directive. Sites, Competition and Investment Potentials in Europe; Ecoprog GmbH: Cologne, Germany, 2014; Available online: https://www.ecoprog.com/fileadmin/user_upload/leseproben/ext_market_report_glass_factories_in_europe_IED_ecoprog.pdf (accessed on 20 June 2020).
- Glass Alliance Europe. Available online: https://www.glassallianceeurope.eu/en/industries (accessed on 20 June 2020).
- Vieitez, E.R.; Eder, P.; Villanueva, A.; Saveyn, H. End-of-Waste Criteria for Glass Cullet: Technical Proposals; Publications Office of the European Union: Luxembourg, 2011; Available online: www.ferver.be/sites.default/files/120209_jrc_final_report_eow_glass.pdf (accessed on 20 June 2020).
- Vitkala, J. Global Glass Trends—Summary of Glass Performance Days 2017. Świat Szkła 2018, 4, 23–28. (In Polish) [Google Scholar]
- Żelazowska, E. Emissivity and low-emission coated glass. Part 3 Applications. Świat Szkła 2013, 12, 41–45. (In Polish) [Google Scholar]
- Egenhofer, C.; Schrefler, L.; Marcu, A.; Roth, S.; Stoefs, W. Final Report for Study on Composition and Drivers of Energy Prices and Costs in Energy Intensive Industries. The Case Study of the Flat Glass Industry; Centre for European Policy Studies: Brussels, Belgium, 2014. [Google Scholar]
- Greenfield, M. Glass production: A global look at demand for 2018. Ind. Miner. 2018, 1. Available online: https://www.statista.com/statistics/1059469/distribution-of-glass-production-globally-by-type/ (accessed on 20 June 2020).
- European Commission. Study on the EU’s list of Critical Raw Materials (2020), Factsheets on Non-critical Raw Materials; European Commission: Brussels, Luxemburg, 2020.
- Bide, T. Silica Sand. Mineral Planning Factsheet; British Geological Survey (BGS): Nottingham, UK, 2020. [Google Scholar]
- A Study of Silica Sand Quality and End Uses in Surrey and Kent. GWP Consultants LLP, 2010. Available online: https://gwp.uk.com/wp-content/uploads/2016/04/Silica-Sand-March-2010-Report-Final.pdf (accessed on 20 June 2020).
- Harben, P.W.; Kuzvart, M. A Global Geology; London, Industrial Minerals Information Ltd.: London, UK, 1997. [Google Scholar]
- Van Loon, A.J. Unravelling the enigmas of the silver sands in the Dutch/German/Belgian border area. Neth. J. Geosci. 2009, 88, 133–145. [Google Scholar] [CrossRef]
- Van der Meulen, M.J.; Westerhoff, W.E.; Menkovic, A.; Gruijters, S.H.; Dubelaar, C.W.; Maljers, D. Silica sand resources in the Netherlands. Neth. J. Geosci. 2009, 88, 147–160. [Google Scholar] [CrossRef] [Green Version]
- Mineral Commodity Summaries of the Czech Republic 2019; Czech Geological Survey: Prague, Czech Republic, 2020.
- Galos, K. (Ed.) Valorization of the Resource Base of Glass Sand in the Light of Contemporary Requirements of the Glass Industry; IGSMiE PAN: Kraków, Poland, 2009; (In Polish, with English abstract). [Google Scholar]
- Bulativic, S.M. Beneficiation of Silica Sand. In Handbook of Flotation Reagents: Chemistry, Theory and Practice. Volume 3: Flotation of Industrial Minerals; Bulatovic, S., Ed.; Elsevier: Kidlington, UK, 2015. [Google Scholar]
- Banza, A.N.; Quindt, J.; Cock, E. Improvement of the quartz sand processing at Hohenbocka. Int. J. Min. Process. 2006, 79, 76–82. [Google Scholar] [CrossRef]
- Mowla, D.; Karimi, G.; Ostadnezhad, K. Removal of hematite from silica sand ore by reverse flotation technique. Sep. Purif. Technol. 2008, 58, 419–423. [Google Scholar] [CrossRef]
- Zhao, H.; Wang, D.; Cai, Y.; Zhang, F. Removal of iron from silica sand by surface cleaning using power ultrasound. Miner. Eng. 2007, 20, 816–818. [Google Scholar] [CrossRef]
- Styriakova, I.; Styriak, I.; Malachovsky, P.; Vecera, D. Bacterial clay release and iron dissolution during the quality improvement of glass sands. Hydrometallurgy 2007, 89, 89–106. [Google Scholar] [CrossRef]
- Tarasova, I.I.; Dudeney, A.W.; Pilurzu, S. Glass sand processing by oxalic acid leaching and photocatalytic effluent treatment. Miner. Eng. 2001, 14, 639–646. [Google Scholar] [CrossRef]
- Du, F.; Li, J.; Li, X.; Zhang, Z. Improvement of iron removal from silica sand using ultrasound-assisted oxalic acid. Ultrason. Sonochem. 2011, 18, 389–393. [Google Scholar] [CrossRef] [PubMed]
- Khalifa, M.; Ouertani, R.; Hajji, M.; Ezzaouia, H. Innovative technology for the production of high-purity sand silica by thermal treatment and acid leaching process. Hydrometallurgy 2019, 185, 204–209. [Google Scholar] [CrossRef]
- Glushankova, I.; Ketov, A.; Krasnovskikh, M.; Rudakova, L.; Vaisman, I. Rice Hulls as a Renewable Complex Material Resource. Resources 2018, 7, 31. [Google Scholar] [CrossRef] [Green Version]
- Grbeš, A. A Life Cycle Assessment of Silica Sand: Comparing the Beneficiation Processes. Sustainability 2016, 8, 11. [Google Scholar] [CrossRef] [Green Version]
- Devlin, K. The world of glass. How shifting markets and new players are transforming the float glass industry. Glass Magazine, 14 February 2016. [Google Scholar]
- Wintour, N. The Glass Industry: Recent Trends and Changes in Working Conditions and Employment Relations; Working Paper No. 310; Internal Labour Office: Geneva, Switzerland, 2015. [Google Scholar]
- Glass for Europe. Available online: https://glassforeurope.com/the-sector/key-data (accessed on 20 June 2020).
- European Container Glass Federation FEVE. Available online: https://feve.org/record-collection-of-glass-containers-for-recycling-hits-76-in-the-eu (accessed on 20 June 2020).
- Best Available Techniques (BAT). Reference Document for the Manufacture of Glass; EC JRC Institute for Prospective Technological Studies: Seville, Spain, 2013. [Google Scholar]
- Methodology for the free Allocation of Emissions Allowances in the EU ETS Post 2012, Sector Report for the Glass Industry; Ecofys (project leader); Fraunhofer Institute for Systems and Innovation Research, Öko-Institut: Ecofys, The Netherlands, 2009.
- Statistics Poland (GUS). Production of Industrial Products in 2019 (and Unpublished Data); GUS: Warszawa, Poland, 2019. Available online: https://stat.gov.pl/obszary-tematyczne/przemysl-budownictwo-srodki-trwale/przemysl/produkcja-wyrobow-przemyslowych-w-2019-roku (accessed on 31 July 2020).
- Malon, A. Glass raw materials. In The Balance of Mineral Resources Deposits in Poland as of 31 XII 2019; PIG-PIB: Warszawa, Poland, 2020; pp. 452–454. (In Polish) [Google Scholar]
- Szuflicki, M.; Malon, A. The Balance of Mineral Resources Deposits in Poland as of 31 XII 2009–2019; Tymiński, M., Ed.; PIG-PIB: Warszawa, Poland, 2020. (In Polish) [Google Scholar]
- Galos, K.; Burkowicz, A. Possibilities of further development of the Polish glass industry in the light of the documented and prospective resource base of glass sand. Bull. MEERI PAS 2009, 76, 17–29. (In Polish) [Google Scholar]
- Poręba, E.; Nieć, M.; Dróżdż, S. Deposits of quartz sand in the Tomaszów Basin, the condition and problems of their documentation. Gór. Odkryw. 2018, 59, 84–99. (In Polish) [Google Scholar]
- Nieć, M. (Ed.) Valorization of Undeveloped Rock Minerals Deposits; IGO Poltegor–Instytut: Wrocław, Poland; Kraków, Poland, 2013. (In Polish) [Google Scholar]
- Galos, K. Glass sand, glass sandstone, quartz sand for the glass industry. In Balance of Prospective Mineral Resources in Poland as at the End of 2018; Szamałek, K., Szuflicki, M., Mizerski, W., Eds.; PIG-PIB: Warszawa, Poland, 2020. (In Polish) [Google Scholar]
- Burkowicz, A.; Galos, K. Sand, glass. In Minerals Yearbook of Poland 2013; Burkowicz, G., Guzik, K., Lewicka, K., Smakowski, S., Eds.; PIG-PIB: Warszawa, Poland, 2015. [Google Scholar]
- Lewicka, E. Rational use of selected mining by-products in the ceramic industry in Poland. Gospod. Surowcami Miner. Miner. Resour. Manag. 2020, 36, 59–76. [Google Scholar]
- Green Rhino Energy. Value Chain Activity: Manufacturing Solar Glass. Available online: http://greenrhinoenergy.com/solar/industry/ind_15_solarglass.php (accessed on 20 June 2020).
- Burkowicz, A. Silica sand for glass production. In Market Analysis of Selected Raw Materials for the Ceramic and Glass Industries in Poland over the Years 1990–2012; Lewicka, E., Ed.; IGSMiE PAN: Kraków, Poland, 2014. [Google Scholar]
- Bauccio, M.L. (Ed.) Engineered Materials Reference Book; ASM International: Materials Park, OH, USA, 1994. [Google Scholar]
- Pfaender, H.G. Short Guide to Glass; Chapman & Hall: London, UK, 1996. [Google Scholar]
- Żelazowska, E. Functional coatings for industrial glasses. Świat Szkła 2015, 1, 42–47. (In Polish) [Google Scholar]
- Hasanuzzaman, M.; Rafferty, A.; Sajjia, M.; Olabi, A.-G. Properties of Glass Materials. In Reference Module in Materials Science and Materials Engineering; Hashmi, S., Ed.; Elsevier: Amsterdam, The Netherlands, 2016. [Google Scholar] [CrossRef]
- Schmitz, A.; Kamiński, J.; Scalet, B.M.; Soria, A. Energy consumption and CO2 emissions of the European glass industry. Energy Policy 2011, 39, 142–155. [Google Scholar] [CrossRef]
- Platias, S.; Vatalis, K.I.; Charalampides, G. Suitability of quartz sands for different industrial applications. Procedia Econ. Financ. 2014, 14, 491–498. [Google Scholar] [CrossRef] [Green Version]
- Valchev, A.; Marinov, M.; Grigorova, I.; Nishkov, I. Low iron silica sand for glassmaking. In Proceedings of the 22nd World Mining Congress, Volume III, Istanbul, Turkey, 11–16 September 2011; pp. 755–760. [Google Scholar]
- BN-80/6811-01 Standard—Glass Raw Materials. Glass sand. Requirements and Investigation Methods, Wydawnictwa Normalizacyjne Warszawa, 1987 (original version), 2015 (digital version) (In Polish). Available online: http://bc.pollub.pl/Content/9344/PDF/BN_80_6811_01.pdf (accessed on 20 June 2020).
- Musgraves, J.D.; Hu, J.; Calvez, L. (Eds.) Springer Handbook of Glass; Springer International Publishing: Basel, Switzerland, 2019. [Google Scholar] [CrossRef]
- Wyszomirski, P.; Galos, K. Mineral and Chemical Raw Materials of the Ceramics Industry; UWND AGH: Kraków, Poland, 2007; pp. 133–140. (In Polish) [Google Scholar]
- Nieć, M.; Poręba, E. Industrial sand deposits. In Minerals of Poland. Rock Minerals: Natural Aggregates and Industrial Sand (Surowce Mineralne Polski. Surowce Skalne: Kruszywa Naturalne i Piaski Przemysłowe); Ney, R., Ed.; IGSMiE PAN: Kraków, Poland, 2003; pp. 63–102. (In Polish) [Google Scholar]
- MIDAS Information System. Available online: http://geoportal.pgi.gov.pl/portal/page/portal/midas (accessed on 20 June 2020).
- Galos, K.; Tiess, G.; Kot-Niewiadomska, A.; Murguia, D.; Wertichova, B. Mineral Deposit of Public Importance (MDoPI) in relation to the Project of National Mineral Policy of Poland. Gospod. Surowcami Miner. Miner. Resour. Manag. 2018, 34, 5–23. [Google Scholar]
- Mineral Policy of Poland—Project, 2019—Polityka Surowcowa Państwa—Projekt. Available online: http://psp.mos.gov.pl/images/pdf/PSP_projekt.pdf (accessed on 20 June 2020).
Figure 1.
Structure of glass production in Poland ([38], authors’ calculations).
Figure 1.
Structure of glass production in Poland ([38], authors’ calculations).

Figure 2.
Glass sand production and consumption versus glass production in Poland in the years 1990–2019 ([38], producers’ survey data, authors’ calculations).
Figure 2.
Glass sand production and consumption versus glass production in Poland in the years 1990–2019 ([38], producers’ survey data, authors’ calculations).

Figure 3.
Resources, reserves, and extraction of silica sand and sandstone suitable for the glass industry in Poland in the period 1990–2019 [40].
Figure 3.
Resources, reserves, and extraction of silica sand and sandstone suitable for the glass industry in Poland in the period 1990–2019 [40].

Figure 4.
Location of the largest glass producers and occurrence of the exploited glass sand deposits in Poland (authors’ own study).
Figure 4.
Location of the largest glass producers and occurrence of the exploited glass sand deposits in Poland (authors’ own study).

Figure 5.
Structure of glass sand production in Poland in the years 2008 and 2018 ([38], authors’ calculations).
Figure 5.
Structure of glass sand production in Poland in the years 2008 and 2018 ([38], authors’ calculations).


Table 1.
Glass statistics in Poland (‘000 tons).
| Year | 1990 | 1995 | 2000 | 2005 | 2006 | 2007 | 2008 | 2009 | 2010 |
|---|---|---|---|---|---|---|---|---|---|
| Production | 1058 | 1229 | 1672 | 1977 | 2205 | 2346 | 2425 | 2159 | 2377 |
| including glass container | 577 | 777 | 976 | 1083 | 1116 | 1210 | 1270 | 1202 | 1281 |
| float flat glass | 0 | 65 | 341 | 540 | 651 | 644 | 720 | 718 | 820 |
| Exports | na | 140 | 405 | 677 | 643 | 748 | 870 | 655 | 751 |
| including glass container | na | 121 | 215 | 220 | 219 | 262 | 197 | 166 | 214 |
| float flat glass | na | 11 | 114 | 239 | 273 | 216 | 284 | 185 | 329 |
| Imports | na | 217 | 562 | 829 | 847 | 880 | 901 | 700 | 710 |
| including glass container | na | 33 | 81 | 162 | 133 | 179 | 201 | 165 | 175 |
| float flat glass | na | 85 | 183 | 288 | 287 | 407 | 393 | 266 | 344 |
| Consumption (apparent) | NA | 1152 | 1448 | 1825 | 2001 | 2214 | 2394 | 2114 | 2418 |
| including glass container | NA | 689 | 842 | 1025 | 1030 | 1127 | 1274 | 1201 | 1242 |
| float flat glass | NA | 139 | 410 | 589 | 665 | 835 | 829 | 799 | 835 |
| Year | 2011 | 2012 | 2013 | 2014 | 2015 | 2016 | 2017 | 2018 | 2019 |
| Production | 2479 | 2652 | 2656 | 2732 | 2715 | 2944 | 2968 | 3043 | 3492 |
| including glass container | 1305 | 1422 | 1409 | 1506 | 1531 | 1689 | 1733 | 1772 | 1801 |
| float flat glass | 903 | 957 | 962 | 945 | 905 | 962 | 921 | 990 | 1441 |
| Exports | 788 | 716 | 691 | 619 | 811 | 793 | 965 | 1059 | 1141 |
| including glass container | 225 | 227 | 259 | 305 | 384 | 383 | 497 | 575 | 536 |
| float flat glass | 335 | 354 | 315 | 241 | 231 | 237 | 206 | 192 | 237 |
| Imports | 769 | 795 | 788 | 829 | 890 | 987 | 1079 | 1470 | 1424 |
| including glass container | 233 | 237 | 202 | 368 | 261 | 222 | 231 | 309 | 422 |
| float flat glass | 334 | 272 | 274 | 401 | 401 | 508 | 564 | 695 | 700 |
| Consumption (apparent) | 2498 | 2573 | 2560 | 2942 | 2794 | 3138 | 3082 | 3454 | 3775 |
| including glass container | 1313 | 1432 | 1352 | 1569 | 1408 | 1528 | 1467 | 1506 | 1687 |
| float flat glass | 902 | 875 | 921 | 1105 | 1075 | 1233 | 1279 | 1493 | 1926 |
Source: [38].
Table 2.
The most important glass producers in Poland (as of mid-2019).
| Glass Type | Company | Glassworks Location | Type of Glass | Production Capacity (‘ 000 Tons) |
|---|---|---|---|---|
| Glass containers | O-I Produkcja Polska | Jarosław, Poznań-Antoninek | Food glass containers | 440 |
| BA Glass | Sieraków, Jedlice | Food glass containers | 430 | |
| Polampack | Orzesze | Food glass containers | 350 | |
| Ardagh Glass | Gostyń, Ujście Noteckie, Wyszków | Food glass containers | 370 | |
| Stölzle Glass Group | Częstochowa, Wymiarki | Pharmaceutical glass, lanterns, jars | 180 | |
| HS Czechy | Trąbki | Cosmetic packaging glass | 50 | |
| Hainz Glas Działdowo | Działdowo | Cosmetic packaging glass | 35 | |
| HS Sława | Kielce | Lanterns | 9 | |
| HS Veni | Szubin | Food glass containers | 9 | |
| Flat glass | Euroglas Polska | Ujazd (two plants) | Float flat glass | 640 |
| Guardian Industries Poland | Częstochowa | Float flat glass | 360 | |
| Saint-Gobain | Dąbrowa Górnicza | Float flat glass | 350 e | |
| Jaroszowiec | Rolled flat glass | 30 e | ||
| Pilkington Polska | Sandomierz | Float flat glass | 150 | |
| Glass tableware | Krosno | Krosno | Glass tableware | 50 |
| Irena | Inowrocław | Crystal glass tableware | 7 | |
| Tadeusz Wrześniak | Grzybów, Iwonicz, Chełm, Parczew, Dubeczno, Polanica, Tarnów, Skrzyszów | Glass tableware | 13 | |
| HSK Violetta | Stronie Śląskie | Crystal glass tableware | <2 e | |
| Technical glass | Philips Lighting Poland | Piła | Light bulbs | 70 |
| Biaglass | Białystok | Lighting glass | <2 | |
| HS Jasło | Jasło | Headlamps, lamp shades | NA | |
| Vitrosilicon | Żary, Iłowa | Glass blocks | NA | |
| QuimiCer Polska | Opoczno | Frits | NA | |
| JZO | Jelenia Góra | Lenses | NA | |
| Glass fiber | Krosglass | Krosno | Fiberglass, mats, fabrics, fiber profiles | 6 |
e – estimation, Source: producers’ survey data, authors’ calculations.
Table 3.
Classification of glass sand traditionally used in Poland.
| Class of Sand | Content (wt. %) | |||||
|---|---|---|---|---|---|---|
| SiO2 (min.) | Fe2O3 (max.) | TiO2 (max.) | Al2O3 (max.) | CaO (max.) | SO3 (max.) | |
| Special (Sp) | 99.5 | 0.006 | 0.02 | 0.15 | 0.10 | 0.01 |
| 1 | 99.5 | 0.010 | 0.02 | 0.20 | 0.10 | 0.01 |
| 1a | 99.4 | 0.015 | 0.03 | 0.30 | 0.10 | 0.01 |
| 2 | 99.3 | 0.020 | 0.05 | 0.40 | 0.10 | 0.01 |
| 3 | 98.5 | 0.030 | 0.08 | 0.80 | 0.20 | 0.02 |
| 4 | 98.5 | 0.050 | 0.08 | 0.80 | 0.20 | 0.02 |
| 5 | 97.5 | 0.080 | 0.10 | 0.80 | 0.30 | 0.05 |
| 6 | 95.0 | 1.000 | 0.20 | 3.50 | 1.50 | 0.15 |
Source: [56].
Table 4.
Glass sand statistics in Poland (‘000 tons).
| Year | 1990 | 1995 | 2000 | 2005 | 2006 | 2007 | 2008 | 2009 | 2010 |
|---|---|---|---|---|---|---|---|---|---|
| Production | 859 | 874 | 1532 | 1593 | 1525 | 1970 | 2070 | 1857 | 2227 |
| Exports | 0 | 9 | 39 | 87 | 107 | 228 | 270 | 156 | 205 |
| Imports | 0 | 2 | 10 | 12 | 11 | 16 | 15 | 8 | 7 |
| Consumption (apparent) | 859 | 867 | 1503 | 1519 | 1429 | 1759 | 1815 | 1708 | 2029 |
| Year | 2011 | 2012 | 2013 | 2014 | 2015 | 2016 | 2017 | 2018 | 2019 |
| Production | 2232 | 2354 | 2354 | 2257 | 2172 | 2356 | 2337 | 2435 | 2854 |
| Exports | 231 | 231 | 169 | 207 | 180 | 213 | 259 | 246 | 263 |
| Imports | 12 | 19 | 26 | 24 | 19 | 19 | 22 | 24 | 27 |
| Consumption (apparent) | 2013 | 2021 | 2210 | 2075 | 2011 | 2162 | 2099 | 2213 | 2618 |
Source: [38].
Table 5.
Resources and reserves of silica sand and silica sandstone deposits recognized in Poland for the glass industry as of the end of 2019.
Table 5.
Resources and reserves of silica sand and silica sandstone deposits recognized in Poland for the glass industry as of the end of 2019.
| Specification | Number of Deposits | Province | Mineral Resources [‘000 Tons] | Mineral Reserves [‘000 Tons] |
|---|---|---|---|---|
| DEVELOPED DEPOSITS | 8 | 162,281 | 64,652 | |
| Cretaceous glass sand deposits | 6 | 156,393 | 59,419 | |
| Tomaszów Basin | 5 | łódzkie | 141,251 | 49,515 |
| North Sudetic Basin | 1 | dolnośląskie | 15,142 | 9904 |
| Quaternary glass sand deposits | 2 | mazowieckie, wielkopolskie | 5888 | 5233 |
| UNDEVELOPED DEPOSITS | 28 | 482,073 | 1259 | |
| Cretaceous glass sand deposits | 14 | 441,970 | - | |
| Tomaszów Basin | 6 | łódzkie | 348,789 | - |
| North Sudetic Basin | 6 | dolnośląskie | 64,541 | - |
| Others regions | 2 | dolnośląskie, łódzkie | 28,640 | - |
| Miocene glass sand deposits | 9 | 23,467 | - | |
| Zamość region | 2 | lubelskie, podkarpackie | 4236 | - |
| Tarnobrzeg region | 2 | świętokrzyskie | 6872 | - |
| Żary region | 3 | lubuskie | 337 | |
| Northern Poland | 2 | pomorskie, zachodniopomorskie | 12,021 | - |
| Quaternary glass sand deposits | 5 | wielkopolskie, mazowieckie, lubelskie | 16,636 | 1259 |
| TOTAL | 36 | 644,354 | 65,911 |
Source: [39].
Table 6.
The main chemical and grain size parameters of the washed glass silica sand in recognized deposits in Poland.
Table 6.
The main chemical and grain size parameters of the washed glass silica sand in recognized deposits in Poland.
| Raw material | Number of Deposits | Component (wt. %) | Grain Fraction 0.1–0.5 mm (%) | |||
|---|---|---|---|---|---|---|
| SiO2 | Fe2O3 | TiO2 | Al2O3 | |||
| DEVELOPED DEPOSITS | ||||||
| Cretaceous glass sand deposits | ||||||
| Tomaszów basin | 5 | 97.84–99.71, | 0.01–0.97, | 0.01–0.24, | 0.01–1.34, | 31.80–98.10 |
| av. 99.25 | av. 0.13 | av. 0.07 | av. 0.20 | |||
| North Sudetic Basin | 1 | 98.69–99.87, | 0.00–0.15, | 0.00–0.15, | 0.02–0.69, | 43.35–99.43, |
| av. 99.36 | av. 0.04 | av. 0.05 | av. 0.23 | av. 80.46 | ||
| Quaternary glass sand deposits | 2 | 93.10–97.53, | 0.15–0.28, | 0.02–0.09, | 1.22–2.15, | 81.54–88.34 |
| av. 95.72 | av. 0.20 | av. 0.04 | av. 1.70 | |||
| UNDEVELOPED DEPOSITS | ||||||
| Cretaceous glass sand deposits | ||||||
| Tomaszów basin | 6 | 92.87–99.70, | 0.00–0.85, | 0.00–0.20, | 0.01–1.45, | 71.40–90.40 |
| av. 99.30 | av. 0.06 | av. 0.06 | av. 0.25 | |||
| North Sudetic Basin | 6 | 95.29–99.88, | 0.02–0.18, | 0.01–0.50, | 0.02–2.20, | 76.31–94.80 |
| av. 99.22 | av. 0.03 | av. 0.05 | av.0.59 | |||
| Others regions | 2 | 96.13–99.58, | 0.02–0.13, | |||
| av. 97.89 | av. 0.07 | |||||
| Miocene glass sand deposits | 9 | 96.60–99.90, | 0.01–0.31, | 0.01–0.35, | 0.02–2.08, | 67.50–98.02 |
| av. 98.62 | av. 0.07 | av. 0.08 | av. 0.48 | |||
| Quaternary glass sand deposits | 5 | 91.55–99.78, | 0.01–0.47, | 0.03–0.11, | 0.65–3.19, | 42.36–94.11 |
| av. 97.32 | av. 0.22 | av. 0.06 | av. 1.50 | |||
Source: [60].
Table 7.
Mining output of silica sand and sandstone from glass sand deposits in Poland (‘000 tons).
| 1995 | 2000 | 2005 | 2010 | 2011 | 2012 | 2013 | 2014 | 2015 | 2016 | 2017 | 2018 | 2019 | |
|---|---|---|---|---|---|---|---|---|---|---|---|---|---|
| Total output | 1229 | 1621 | 1969 | 1995 | 2290 | 2149 | 1644 | 2070 | 2578 | 2261 | 2453 | 2800 | 2960 |
| TKSM Biała Góra | 692 | 762 | 938 | 764 | 927 | 850 | 848 | 825 | 1072 | 910 | 971 | 1125 | 1136 |
| Grudzeń Las | - | 2 | 92 | 471 | 524 | 473 | 489 | 504 | 521 | 550 | 631 | 832 | 955 |
| KiZPPS Osiecznica | 414 | 721 | 859 | 695 | 789 | 797 | 775 | 727 | 656 | 782 | 830 | 829 | 858 |
| Ardagh Glass Wyszków | 24 | 36 | 16 | 17 | 5 | - | - | - | - | - | - | - | - |
| Ardagh Glass Ujście | 99 | 100 | 64 | 48 | 45 | 29 | - | 14 | 20 | 19 | 21 | 14 | 11 |
| Lutynka mine | 16 | - | - | - | - | - | - | - | - | - | - | - |
Source: [40].
Table 8.
Comparison of the quality parameters of glass sand offered by its main producers in Poland (as of mid-2020).
Table 8.
Comparison of the quality parameters of glass sand offered by its main producers in Poland (as of mid-2020).
| Producer/Product/Parameter | SiO2 | Fe2O3 | TiO2 | Al2O3 | Humidity | Grain fraction 0.1–0.5 mm (%) |
|---|---|---|---|---|---|---|
| wt. % | % | % | ||||
| KiZPPS Osiecznica | ||||||
| Class 1/0.08–OS 03/08 | 99.5 | 0.008 | 0.02 | 0.15 | 0.2 | 94 |
| Class 1–OS 03/10 | 99.5 | 0.010 | 0.02 | 0.20 | 0.2 | 94 |
| Class 1a/0.012–OS 03/12 | 99.4 | 0.012 | 0.03 | 0.30 | 0.2 | 90 |
| Class 1a/0.015–OS 3/15 | 99.4 | 0.015 | 0.03 | 0.30 | 0.2/5.5 | 90 |
| Class 2–OS 03/20 | 99.3 | 0.020 | 0.05 | 0.40 | 5.5/0.2 | 90 |
| Class 3–OS 14/30 | 98.5 | 0.030 | 0.08 | 0.80 | 5.5/0.2 | 87 |
| TKSM Biała Góra | ||||||
| Class 2 | 99.3 | 0.020 | 0.05 | 0.40 | 0.2/7 | 90 |
| Class 3 | 98.5 | 0.030 | 0.08 | 0.80 | 0.2/7 | 94 |
| Class 4 | 98.5 | 0.050 | 0.08 | 0.80 | 7 | 94 |
| Grudzeń Las | ||||||
| Class 2 | 99.4 | 0.018 | 0.04 | 0.14 | dry or wet | 94 |
| Class 3 | 99.3 | 0.025 | 0.06 | 0.11 | dry or wet | 94 |
| Class 4 | 99.2 | 0.035 | 0.07 | 0.12 | dry or wet | 94 |
| KSM Surmin-Kaolin | ||||||
| Class 3 NG 14/30 | 98.9 | 0.024 | 0.05 | 0.60 | 7.0 | 97.6 |
| Ardagh Glass Ujście | ||||||
| Class 6 | 96.6 | 0.32 | 0.08 | 1.41 | wet | 96.4–97.0 |
Source: producers’ survey data.
Publisher’s Note: MDPI stays neutral with regard to jurisdictional claims in published maps and institutional affiliations. |
© 2020 by the authors. Licensee MDPI, Basel, Switzerland. This article is an open access article distributed under the terms and conditions of the Creative Commons Attribution (CC BY) license (http://creativecommons.org/licenses/by/4.0/).
Share and Cite
MDPI and ACS Style
Burkowicz, A.; Galos, K.; Guzik, K. The Resource Base of Silica Glass Sand versus Glass Industry Development: The Case of Poland. Resources 2020, 9, 134. https://doi.org/10.3390/resources9110134
AMA Style
Burkowicz A, Galos K, Guzik K. The Resource Base of Silica Glass Sand versus Glass Industry Development: The Case of Poland. Resources. 2020; 9(11):134. https://doi.org/10.3390/resources9110134
Chicago/Turabian StyleBurkowicz, Anna, Krzysztof Galos, and Katarzyna Guzik. 2020. "The Resource Base of Silica Glass Sand versus Glass Industry Development: The Case of Poland" Resources 9, no. 11: 134. https://doi.org/10.3390/resources9110134
Note that from the first issue of 2016, this journal uses article numbers instead of page numbers. See further details here.