1. Introduction
The provision and use of synthetic fuels as well as synthetic bulk chemicals are increasingly attracting interest as a result of the debate about environmental concerns caused by the use of fossil, crude oil-based raw materials [
1,
2]. One way of providing synthetic and basically greenhouse gas (GHG) neutral fuels and bulk chemicals is the Power-to-Liquid (PtL) process. Based on such a thermo-chemical process, various materials such as diesel, kerosene, wax, or gasoline can be provided, e.g., by using Fischer–Tropsch synthesis. For such a synthesis, electrical energy, water, as well as a climate-neutral carbon source (e.g., CO
2 from ambient air or biogenic sources) are required as feedstock. This applies as well for various other Power-to-X (PtX) processes, e.g., the production of synthetic natural gas (SNG), synthetic methanol, etc.
Within such processes, water is decomposed into its components—hydrogen and oxygen—based on electrical energy in water electrolysis. Next, the provided hydrogen combined with a carbon-containing gas is transformed further into a synthesis gas to be used—with additional hydrogen—within further synthesis; the methanol- or the Fischer–Tropsch synthesis are two prominent examples. Based on Fischer–Tropsch synthesis, a so-called syncrude is provided to be further processed with conventional refinery processes into standardized transportation fuels and/or bulk chemicals.
CO
2, as the most important carbon source for such processes, can be obtained from numerous sources. These include, e.g., CO
2 from ambient air, from industry, and the energy sector as well as from the processing of biogenic/organic material. More fundamentally, CO
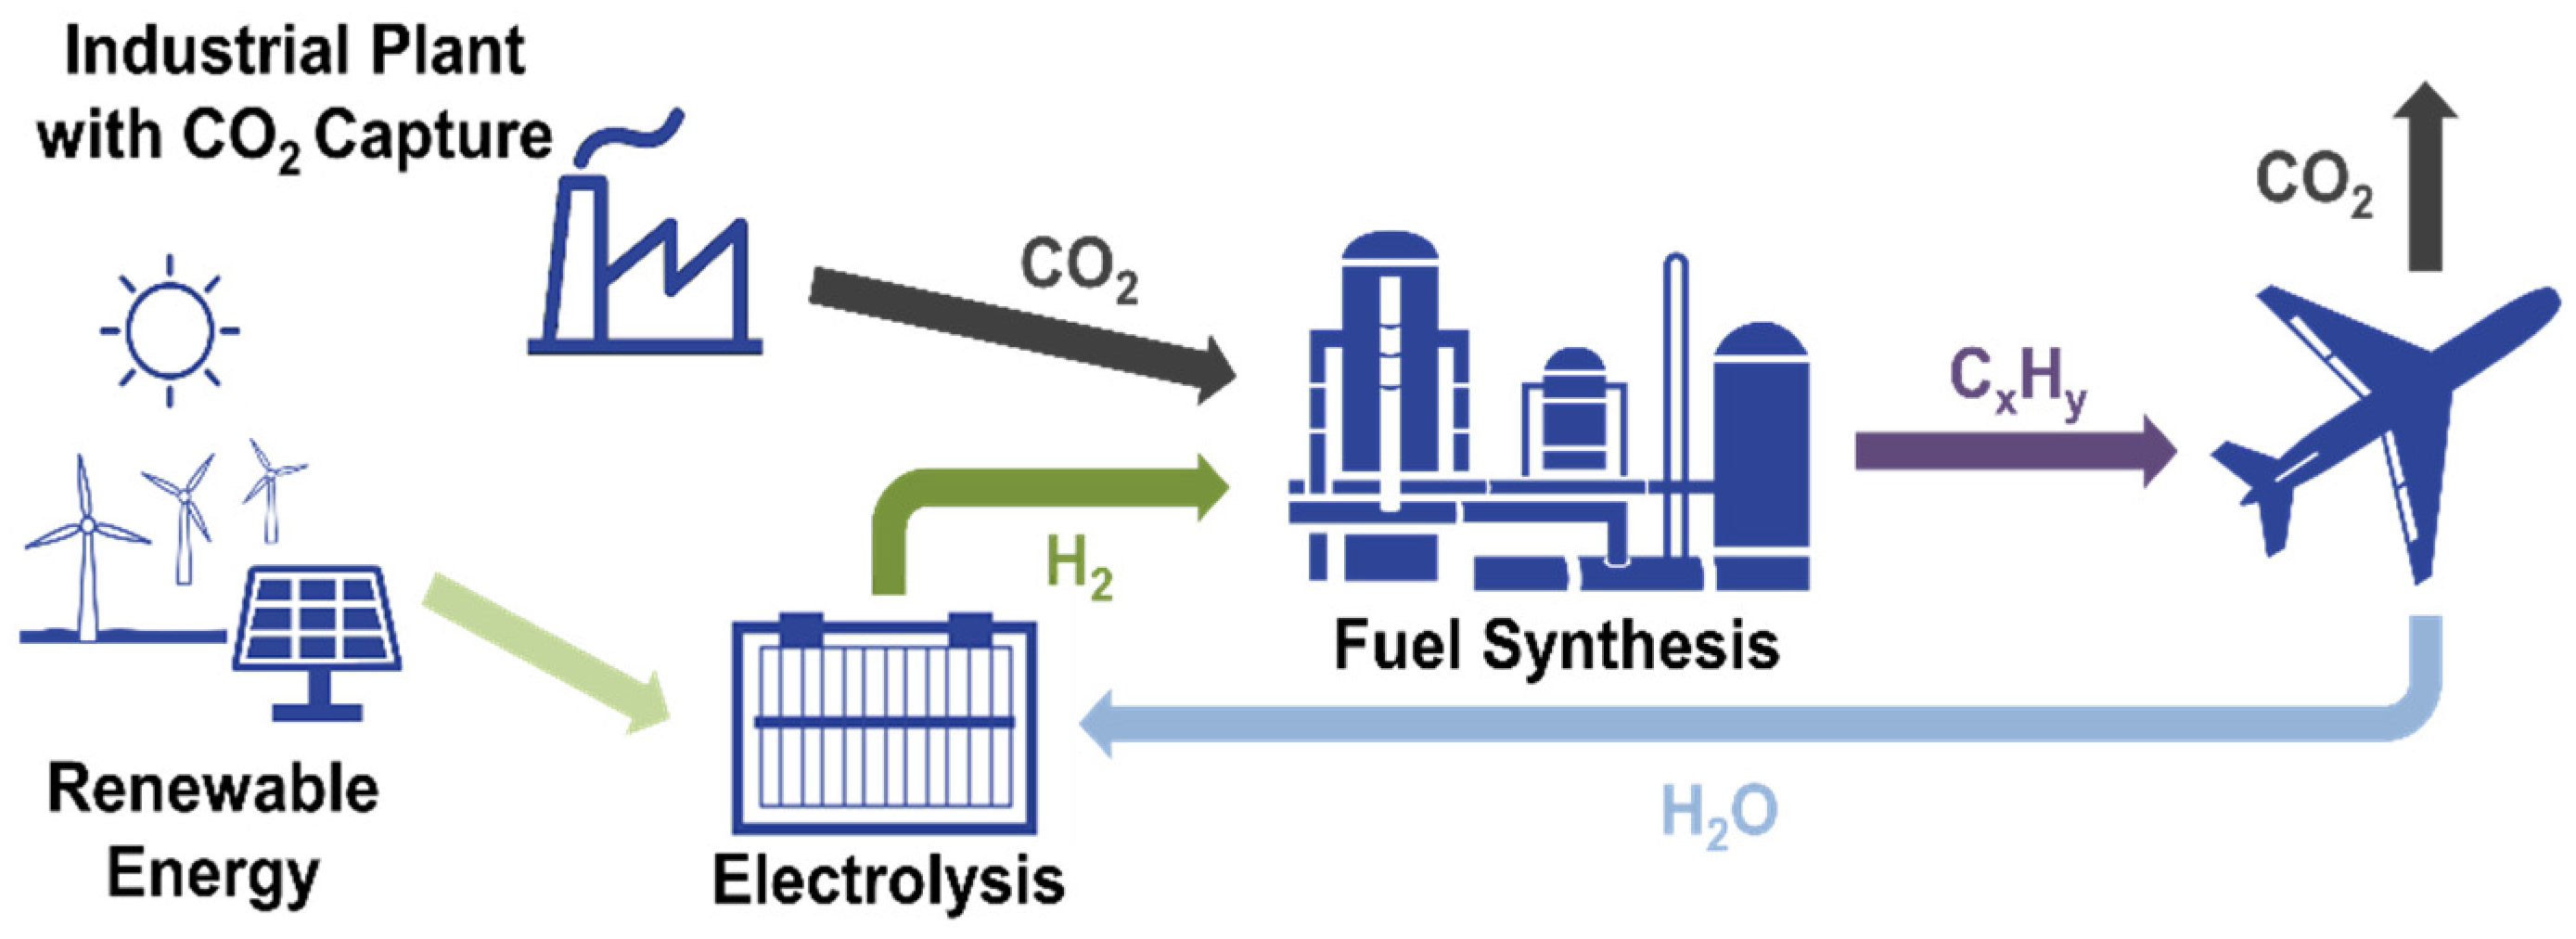
2 emissions from human activities can be categorized according to energy provision or non-energy-related material conversion. Besides this, the CO
2 emissions can be sub-categorized further according to their origin in biogenic or fossil provenance. Thus, only CO
2 emissions originating from the use of fossil fuel energy and the processing of natural material of fossil origin (e.g., limestone) increase the overall CO
2 inventory within the atmosphere. This fact is independent of the respective CO
2 emissions that are directly emitted into the atmosphere or used within a usage cascade (
Figure 1). For the latter option, the absolute proportion of CO
2 within the atmosphere increases with a certain delay.
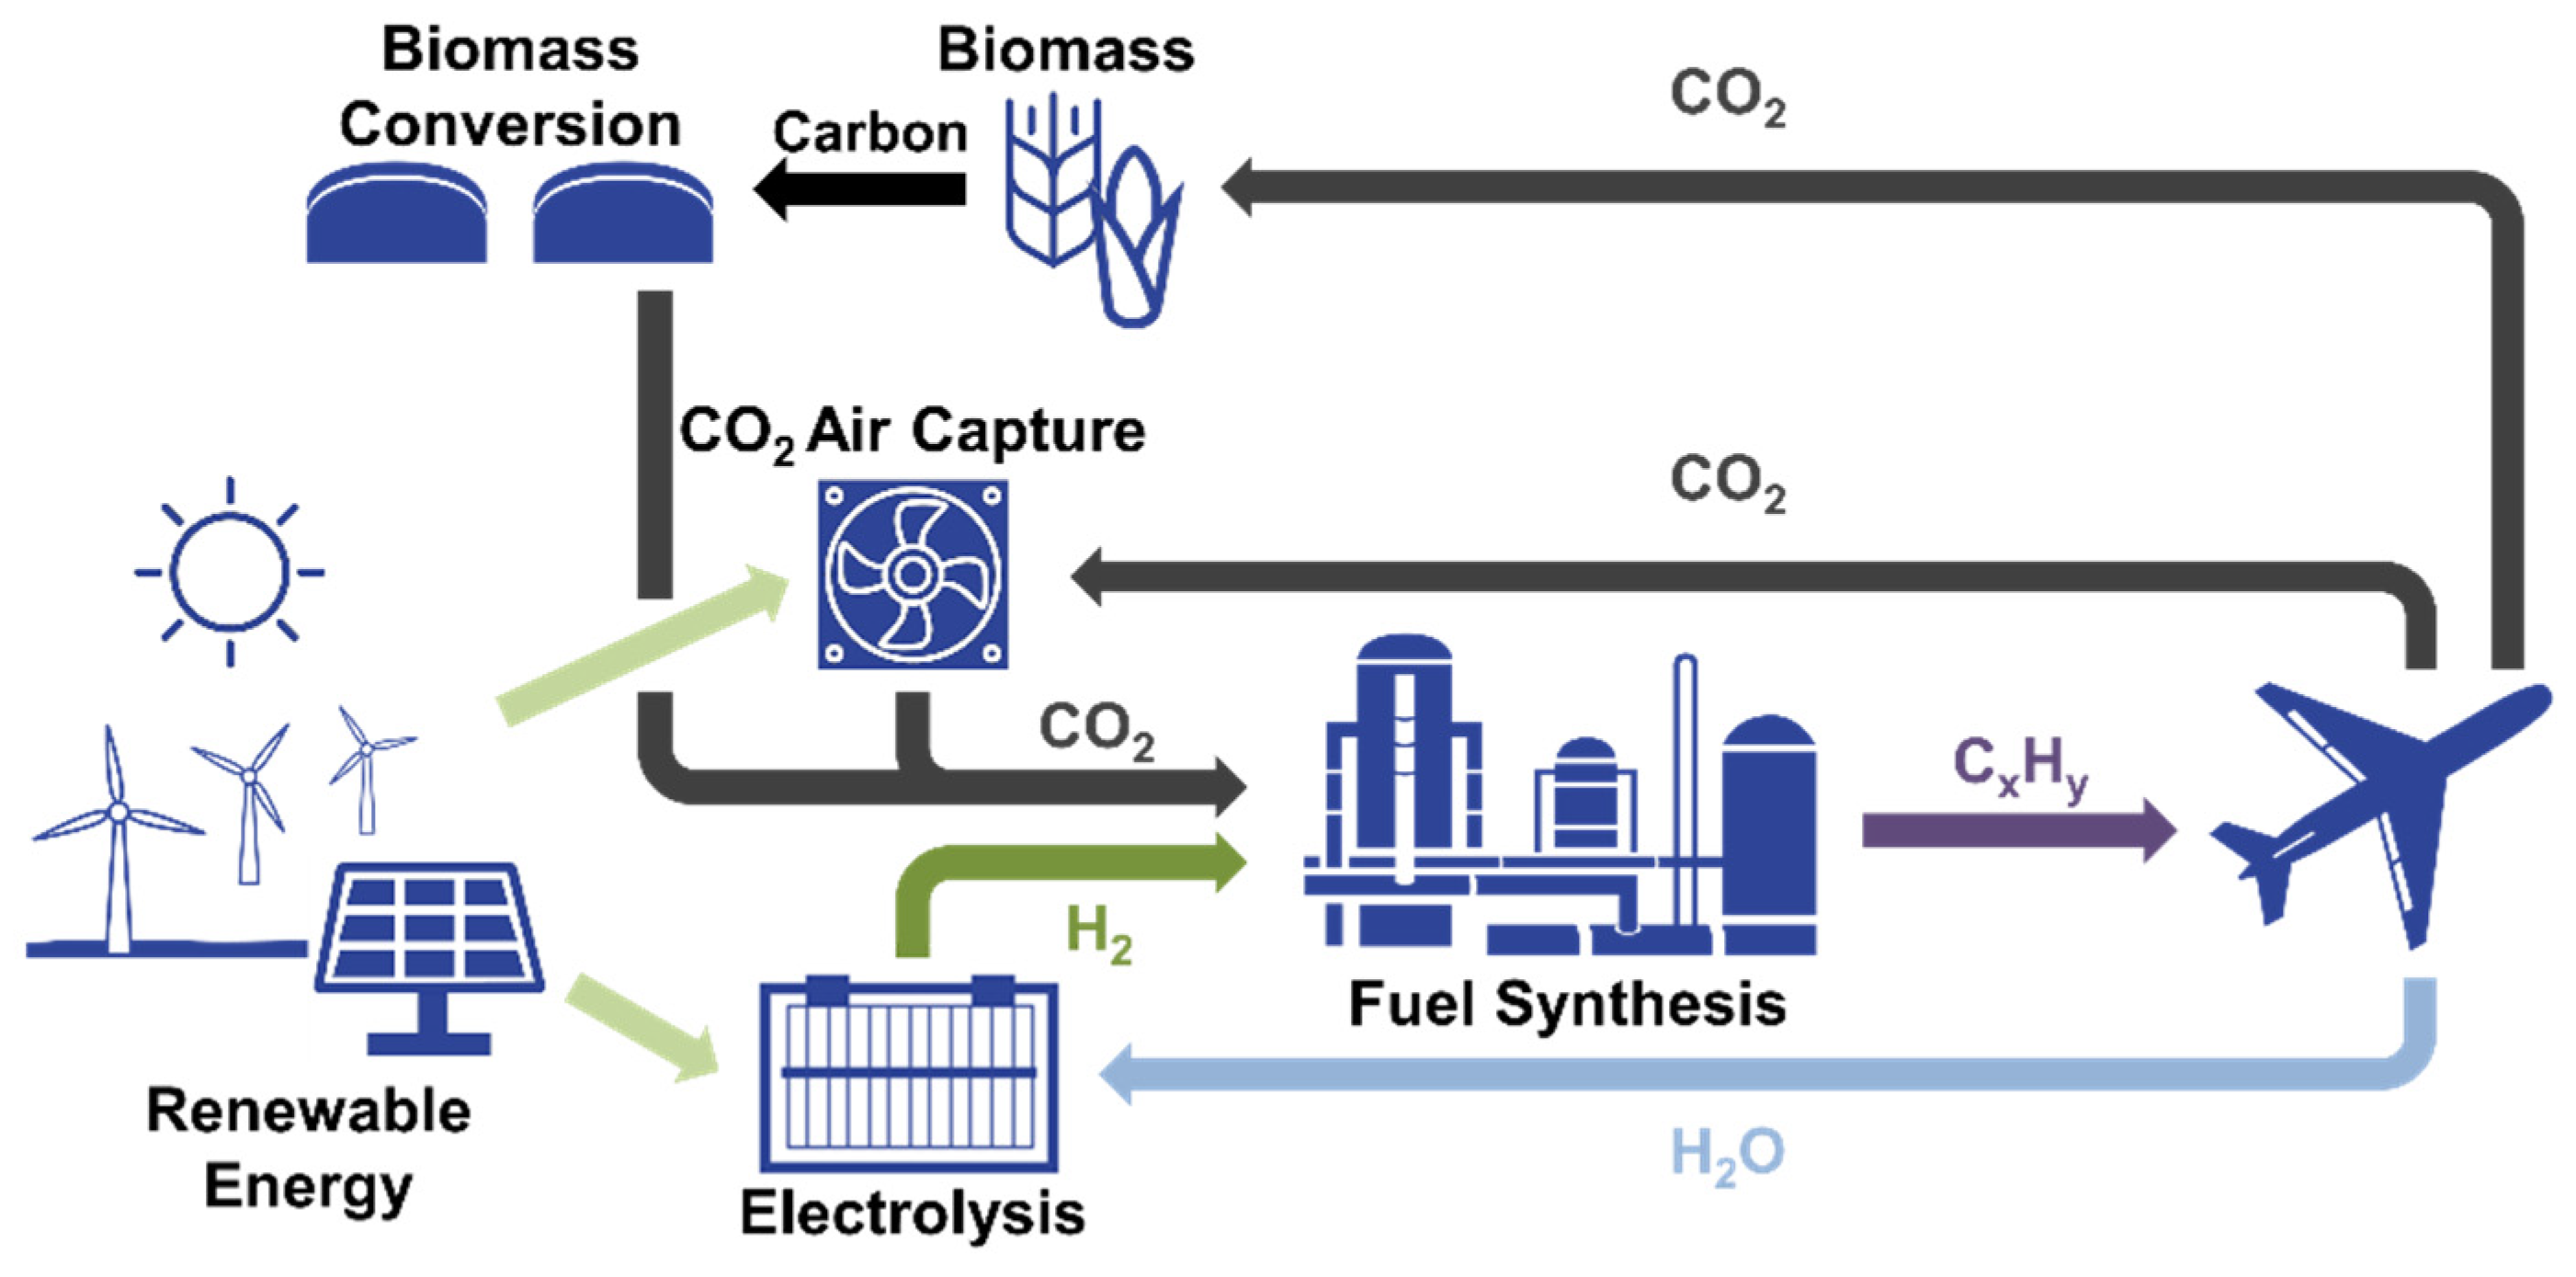
The use of CO
2 from processing sustainably provided biomass is essentially GHG neutral and results in an almost closed carbon circle (
Figure 2). The utilization of CO
2 from direct air capture (DAC) reveals comparable behavior if renewable energies are used for the process.
For a comprehensive analysis of the prospects and limitations of PtX-processes within a defossilized energy system in the years to come, it is necessary to understand to what extent CO
2 from which resources is available by taking technical constraints into consideration. Various studies have been carried out on the possible use of CO
2 for different applications [
3,
4,
5]. However, these studies do not provide a complete analysis, because, e.g., not all industrial sectors are considered or no categorization according to process- and energy-related CO
2 emissions was applied. In this context, the goal of this paper is to identify and quantify various CO
2 sources available as a feedstock for the provision of PtX products today and in a preferably defossilized economy in 2050. This will be realized exemplarily for the German industrial sector.
2. Approach and Delimitation
One overarching goal of this work is to determine the amount of CO2 emitted locally from industrial point sources within the year 2017 and in the future within a fully defossilized energy system (perspective 2050). The aim is to assess the amount of CO2 available as a point source to be used as a raw material for subsequent synthesis processes. The focus is on the calculation of the total CO2 emissions per site. This includes both fossil, i.e., climate-relevant, CO2 and CO2 resulting from the conversion of carbon from biogenic sources (i.e., sustainable sources).
Within the scope of this work, industrial point sources are examined which, according to the European classification system NACE, mainly belong to Section C—Manufacturing [
6]. Installations exclusively classified in other sections, e.g., Section D—Electricity supply […], or Section E—Waste management […], are not included here, as the focus is on classic manufacturing industries. Furthermore, CO
2 from, e.g., the electricity supply by coal-fired power plants will not remain in a future defossilized energy system. CO
2 emitting installations in the Sections D and E are, e.g., power plants, waste incineration plants, or sewage treatment plants. Exceptional cases are power plants directly linked to the respective industrial plant; i.e., CO
2 emissions from explicitly designated industrial power plants or heating plants are taken into account if they are part of an integrated industrial site. In contrast, CO
2 caused by electricity obtained from the national grid is not taken into consideration below because it is not emitted at the specific spot.
The manufacturing industry covers a wide range of different sectors. In order to identify the relevant point sources and their location, the CO
2 intensive sectors of the German industry are assessed first. For the estimation of the respective amount of CO
2 emitted per site today and in the future (i.e., within a fully defossilized world), it is necessary to analyze the origin of the various CO
2 sources within the respective production processes to evaluate possible CO
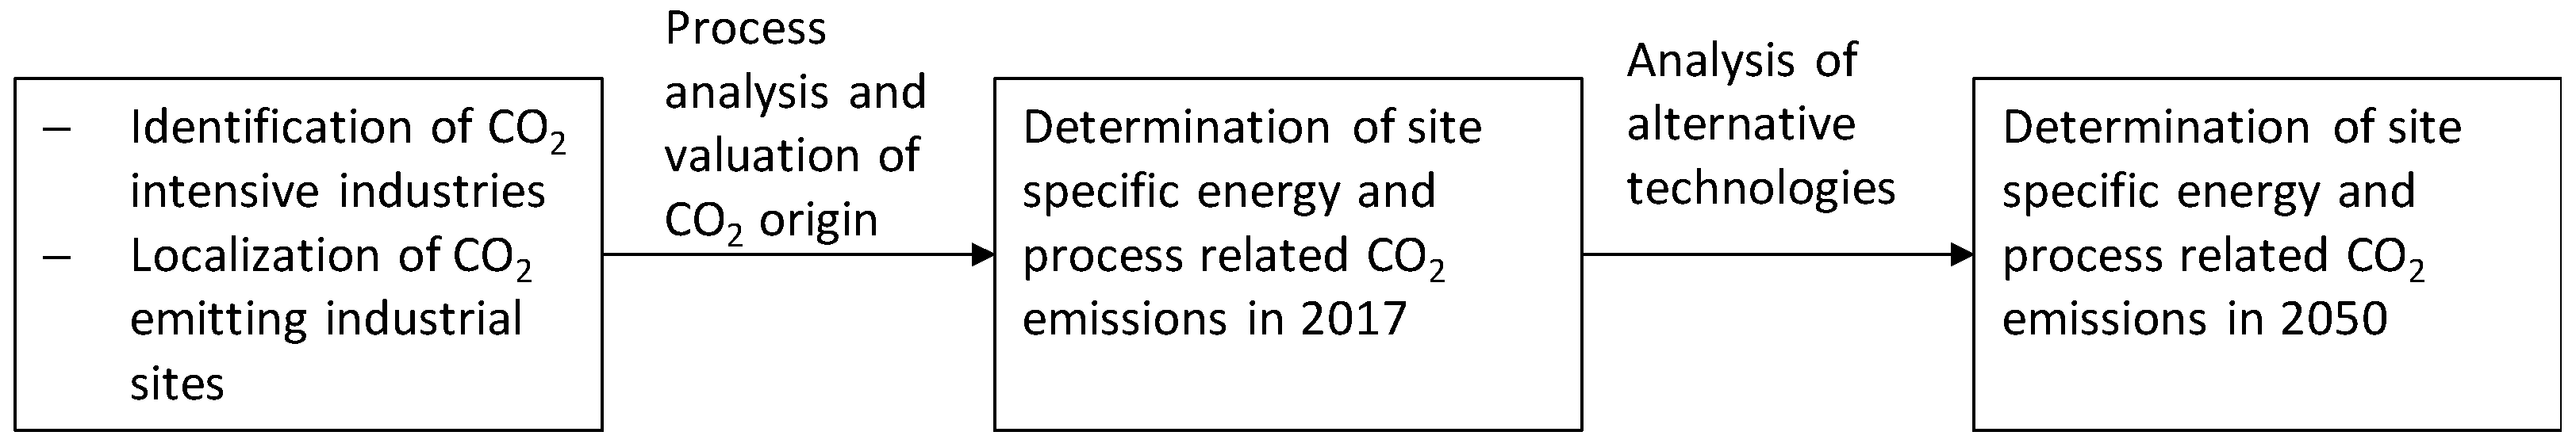
2 savings by application of new or emerging technologies and/or other measures. The general approach applied here for the determination of the resource potential is given in
Figure 3.
CO2 emitted by industry can be divided into process-related and energy-related emissions. The former are emerged during the production process by converting input and/or auxiliary materials essential for the properties of the manufactured products; i.e., these CO2 emissions do not result directly from the use of energy (e.g., solid fuels such as coal) as it is the case for the latter category. This classification is made because it can be assumed that, based on the research conducted to date, substitution possibilities for climatic sound energy-related CO2 emissions can be more easily and more effectively implemented (e.g., “renewable” fuels, “renewable” electricity) than alternative process technologies allowing to reduce process-related CO2 emissions substantially by guaranteeing the same product characteristics. To determine these potentials, it is first analyzed which industrial processes emit process-related CO2. Subsequently, it is assessed in which process and respective conversion step these emissions result.
In order to assess the development of CO2 emissions in the respective sectors up to the year 2050 (i.e., a fully defossilized world), an extensive analysis of alternative technologies has been carried out, which may contribute to a reduction of both energy-related and especially process-related CO2 emissions. For this purpose, various studies have been assessed, providing possible technologies to substitute or avoid CO2 emissions in the medium to long term within the respective industrial production processes. Based on the determination of site-specific energy-related and process-related CO2 emissions in 2017 and the implementation of such alternative technologies, two scenarios are developed for each sector assessing the possible changes in CO2 emissions related to the target year 2050.
2.1. Data Basis
In order to identify CO
2 intensive industries, the 2017 VET—Report of the German Emissions Trading Authority (DEHSt) was analyzed [
7]. This report gives an overview of the total greenhouse gas (GHG) emissions for each sector. These GHG emissions serve as a first classification of relevant industries indicating, e.g., that industries with the greatest proportion of the overall emissions in 2017 have been refineries and the chemical industry (43.2 Mt CO
2 eq.), the iron and steel production (37.8 Mt CO
2 eq.), and the mineral industry (36.3 Mt CO
2 eq.). Additionally, the paper and pulp industry emitted about 5.5 Mt CO
2 eq. and the non-ferrous industry 2.6 Mt CO
2 eq. These industries are subdivided into the sectors presented in
Table 1.
Data basis overall CO2 emissions. The location and amount of CO2 emissions of the various production sites within the respective sectors are mainly obtained from the following two databases.
The thru register (formerly Pollutant Release and Transfer Register) [
8] is appropriate for identifying emitters with an annual CO
2 freight of more than 100 kt/year. This register contains pollutant and waste data from 5398 facilities in Germany [
8]. It gives information about, inter alia, the company name, postal code, coordinates of the emitting site, type of pollutant or waste as well as the released amount. However, only the emissions of the respective plants exceeding a certain pollutant-specific limit value are listed. This limit is 100 kt/year for CO
2 (Annex II, E-PRTR Regulation [
9]. For an installation to be included in the register, it is sufficient that a limit value of one pollutant or waste is exceeded. However, only the value of the exceeded pollutant is indicated. Values not exceeding this limit are not listed within that entry. A further criterion for the reporting obligation is defined by the size of the plant. This means that, e.g., plants for the production of cement clinker are only required to report if their production capacity exceeds 500 t/d (Annex I, E-PRTR Regulation [
10]. In general, the emissions are listed for a plant site as a whole and the production processes within the site are indicated, without an explicit listing of the individual units.
The register of installations of the DEHSt [
11] can be used as the data source for determining the plants below the limit of 100 kt/year. Here, the lower limit of the site assessment is defined by annual CO
2 emissions of at least 40 kt/year. The reason is that the register of installations also lists many emitters with relatively small amounts of CO
2 assumed here to be inappropriate as a carbon source for medium to large scale PtX synthesis plants. This register lists installations obligated to emission trading [
12]. It provides information about, inter alia, the name of the installation, the postcode, the allocated emissions of previous trading periods, etc., and the annually reported GHG emissions. In this register different units of an integrated plant may be listed individually.
For the site-specific analysis of the plants, the data from the register of installations is agglomerated and compared with the data from thru. This comparison shows that the majority of the CO2 emissions recorded in the register of installations corresponds to the overall CO2 emissions in thru. In the iron and steel, chemical, and refinery industries, this analysis revealed some discrepancies between thru data and the register of installations data. This is, for example, true for the following exemplary case: A specific electro steel plant emitted about 141 kt CO2 in 2017 according to the register of installations. The register lists four different units within the integrated steel plant (i.e., the melting shop and steel casting in molds, the rolling mill, and two different heat-treating furnaces). The entry of this plant in thru includes the main activity of iron and steel production as well as the secondary activities of incineration plants > 50 MW and hot rolling of ferrous metals > 20 t/h. These activities correspond approximately to the units described above, which means that it is to be expected that the limit value of 100 kt/year CO2, and thus the reporting obligation for thru, was exceeded. However, there are no entries for CO2 or other GHG emissions.
To create a sound data basis, the values from both databases—if available—were therefore compared. In the case that the CO
2 emissions of a plant are below the limit value, but other GHG emissions (e.g., N
2O) are listed, these were deducted from the entries in the register of installations using the corresponding global warming potential (GWP) factor according to the 5th IPCC Assessment Report [
13].
Nevertheless, in most cases, the values of the two databases correspond. However, the case exemplarily discussed above show that an exact determination of the CO2 emissions at a certain spot might be difficult. If a plant is only listed in the register of installations and no differentiated GHG entries are made within the thru register, it is assumed that the respective amount of CO2 eq. is approximately similar to the amount of CO2.
Data basis process-related CO
2 emissions. The National Inventory Report on the German Greenhouse Gas Inventory [
14] is used as a data basis for the identification of relevant process-related CO
2 emissions within the industrial sectors assessed here. In this inventory, CO
2 emissions are classified into the categories energy, industrial processes and agriculture. Within the category addressing industrial processes, the mineral, chemical, and metal producing sectors show process-related CO
2 emissions. An overview of these industries is given in
Table 1. The different sectors of the mineral industry emit process-related CO
2 mainly from processing carbonate-containing raw minerals. In the metallurgy and chemical industries, process-related CO
2 is also emitted in the majority of the processes, apart from the copper production and to some extent the production of bulk chemicals. The pulp and paper industry only emits energy-related CO
2.
2.2. Site-Specific CO2 Emissions
Due to the inhomogeneous data availability, specific approaches have been developed for each sector to quantify the CO
2 emissions in a site-specific manner. These approaches are outlined in the methodology of the respective industries. This is true for the iron and steel, cement, lime/quicklime, glass and ceramics, as well as aluminum industries, which were subjected to a more detailed analysis. An overview of the respective determination factors for the site-specific process-related CO
2 emissions can be obtained from
Table 2. The total site-specific CO
2 emission is obtained from thru and the register of installations as described above.
The sectors zinc, lead, carbon black, petrochemistry/refinery, and soda production also show process-related emissions (
Table 1). However, it was not possible to determine the site-specific energy and process-related CO
2 emissions due to no or insufficient data. The site-specific results of these sectors show the total CO
2 emissions only.
To determine the process- and energy-related CO
2 emissions of the cement, lime/quicklime, and glass and ceramic sectors, the proportions of process-related and energy-related emissions (
Table 2) were applied to the total emissions of the individual sites. The determination of the proportions is explained in the methodology of the respective sector.
The process-related CO
2 emissions of the iron and steel industry were determined from steel production figures in 2016 using emission factors based on own calculations and assumptions. The site-specific production figures obtained from the German steel association [
15] are only available until 2016. The calculation of the emissions factors is presented in detail in the methodology of the iron and steel industry section.
The process-related emission factor for primary aluminum given in
Table 2 was applied to site-specific production figures, which are based on own calculations. The approach for the determination of these production figures is given in the methodology of the aluminum section.
Ammonia production also emits process-related CO
2. Based on the specific process and energy-related emission factors, the proportions shown in
Table 2 were determined and applied to the absolute CO
2 emissions of the respective sites.
2.3. Scenarios
The two scenarios are based on the assumption that the production of goods remains constant until 2050. The basis for the calculation of the results in 2050 is therefore the real emitted amounts of CO2 per site in 2017 changing according to the assumptions and conditions assumed within the respective scenarios. The analysis for these various CO2 sources and their potential development focuses on a spatially resolved quantification. Depending on the distribution of energy and process-related emissions in each sector, the two scenarios outlined below are developed.
Scenario RFS (renewable fuel supply): the calculation of future CO
2 emissions in the scenario RFS is based on the assumption that fossil fuel energy is replaced by methane produced from renewable sources of energy. A differentiation of whether the fuel is, e.g., biomethane or synthetically produced methane has not been realized. In order to calculate the effects of the substitution on the site-specific CO
2 emissions, the CO
2 emissions from the use of this “renewable” methane are calculated using the specific emission factor of methane and the respective amount of energy provided so far by the substituted fossil fuels. The proportional emission reduction is then applied to the CO
2 emissions of each site to determine the remaining emissions for 2050. The specific emission factors used for the calculation are given in
Table 3 [
14]. The share of fossil fuels in the different sectors is given in the respective sections.
Scenario ATRES (alternative technologies and renewable energy supply): this scenario assumes the implementation of alternative production technologies and the substitution of fossil fuels by renewable fuels and/or electricity. Thus, this scenario describes a more drastic change of the considered processes. The studies, Climate-neutral industry [
16], Energy consumption and CO
2 emissions of industrial process technologies—saving potentials, barriers and instruments [
17] and Greenhouse gas neutral Germany 2050 [
18], are used as a basis for the technology analysis. For the estimation of the remaining CO
2 emissions, the results of these investigations are adapted into the scenario ATRES. If electricity is used instead of fuels to provide energy, it is assumed that it is produced GHG neutral, i.e., from renewable energies. A description of the adapted technologies is given in the respective sections of the different sectors.
3. Mineral Industry
Below, the industry sector producing cement, limestone/quicklime, glass, and ceramic is analyzed in detail.
3.1. Cement
Cement is a heterogeneous composition of different pure materials. The specific composition of each type of cement depends on the required properties for different areas of application (e.g., durability or sulfate resistance). One of the main components in almost every type of cement is cement clinker (between 5 and 100%, DIN EN 197-1). In addition to clinker, cement may also consist of granulated slag, pozzolana, fly ash, silica dust, plaster, and burnt oil shale.
3.1.1. Process Description
Cement production is based on three steps. First, various raw materials (e.g., clay and limestone) are extracted from the ground and crushed. Then, further components (if necessary with, e.g., quartz sand and iron ore) are added, the mixture is homogenized, dried, grinded, and burned in kilns. The thermally treated material is again homogenized, grinded, and intermingled with additives to meet the required standards.
The process step of clinker production emits the largest quantities of CO
2 throughout the overall process chain of cement production. These CO
2 emissions can be divided into energy-related and process-related emissions. The latter are released during the burning of the input material at high temperatures (gas temperature up to 2000 °C) within a rotary or shaft kiln. During the chemical transformation resulting from this thermal treatment, CO
2 is released from the carbonate, known as “deacidification” (Equation (1)).
This reaction takes place in presence of SiO2, Al2O3, and Fe2O3 at temperatures above 550 °C and strongly increases above 900 °C.
The provision of heat for the kiln contributes to the majority of energy-related CO2 emissions in the cement industry. The average specific thermal energy consumption was 2824 MJ/t cement in 2017. This amounts to a total need of 96.9 PJ in Germany. Approximately one third of this energy is provided by burning fossil fuels and two thirds by burning refuse-derived fuels, such as scrap tires or waste.
Additionally, electricity is needed as auxiliary energy for the electric driven devices (e.g., grinders, exhaust gas treatment) resulting in 110 kWh/t cement or a total of 3.77 TWh in 2017 [
19].
3.1.2. Methodology
The CO
2 emissions from the production of cement originate from burning fuel for heat provision, electricity demand for auxiliary energy supply and process-related emissions from processing the material itself. The share of the process- and energy-related CO
2 emissions from the kilns and furnaces varies depending on the mixture of the input material (fuels, clay, limestone, etc.). Nevertheless, the variations are relatively small. Therefore, it is assumed that the share of the process- and energy-related CO
2 is similar for each cement production site. To determine the process-related share of CO
2 related to the overall CO
2 emissions for the emission data received from thru, the total emissions for the year 2017 of approx. 21.9 Mt CO
2 are recalculated [
20] to exclude the possibility that larger quantities of CO
2 are integrated into the emission data of thru that are not process- or energy-related. The overall process emissions in 2017 sum up to 13.4 Mt CO
2 according to [
21]. The difference of 8.4 Mt CO
2 is assumed to be emitted by fuel burning (i.e., energy-related). The quantities of input fuel for heat supply, broken down by fuel, are published annually [
19]. On the basis of these quantities, the total amount of energy-related emissions is calculated using the specific CO
2 emissions per TJ of fuel [
14,
21].
The calculated data for the CO
2 emissions from burning fuel deviate by approximately 126 kt (2017) being less than 0.6% compared to the overall emissions of 21.9 Mt (2017). Another uncertainty lies in the specific emission factor of the refuse-derived fuels used for the energy-related emission calculations, as they are based on average values. The calculated share of process-related emission is about 61% being similar to the given share of 60% by [
19]. Thus, the CO
2 emissions from each cement producing facility is multiplied with the raw material related share of 61% to obtain the process-related CO
2 amount.
3.1.3. Scenarios
Scenario RFS: for the scenario RFS it is assumed that the heat provision is still based on fuels. The share of refuse-derived fuels remains constant while fossil fuels are substituted by methane from renewable sources. The amount of energy provided by each fossil fuel is obtained from [
19]. Lignite (20.5 PJ/year) and hard coal (8.2 PJ/year) have the greatest share within the overall heat provision based on fossil fuel energy. A complete list of substituted energy by fuel is given in
Table 4. The resulting CO
2 emissions in 2050 for scenario RFS are calculated assuming that the sole use of “renewable” methane as fuel enables almost the complete avoidance of energy-based CO
2 emissions from fossil origin (fossil carbon in the refuse-derived fuels remains). This results in the fact that mainly process-related fossil and energy-based biogenic CO
2 remain on site.
Scenario ATRES: for the scenario ATRES, it is assumed that the overall heat provision is covered by electricity based on an approach called LEILAC process [
16]. It contains an indirectly heated steel tank as the calciner. It is assumed that, in 2050, the electricity provided completely GHG-free will be obtained from the public grid. The present-day technology readiness level (TRL) is given as 4 to 5 and the earliest possible large-scale application is assumed for the years between 2030 and 2035 [
16].
3.2. Limestone and Quicklime
Limestone consists of more than 90% CaCO
3 and a small percentage of MgCO
3, whereas dolomite is a mixture of about 55% CaCO
3 and 45% MgCO
3. The German lime industry, however, is dominated by limestone processing [
22]. A special case within this section is the production of refined sugar, for which lime is also processed to quicklime, resulting in energy-related and process-related emissions. For this reason, emissions from the sugar industry’s lime kilns are also considered.
3.2.1. Process Description
The processing of limestone starts with the extraction of raw material typically in open-pit mines located close to the lime plant. Besides certain chalk deposits in Northern Germany, the majority of limestone is quarried by the use of explosives. Apart from lime, dolomite is also mined in a few quarries and further processed at several locations. After blasting, the material is crushed, washed and screened. Then it is fed into kilns for calcination or processed (e.g., lime putty) without burning for other purposes, such as aggregates for the cement or steel industry.
Process-related CO
2 is emitted during the processing of limestone or dolomite during the calcination in kilns. This process takes place at temperatures between 900 and 1200 °C for limestone and between 500 and 750 °C for dolomite. At these temperatures, calcium and magnesium carbonates are thermally destroyed by emitting CO
2 originally bound within the mineral according to Equation (2) for calcium carbonate and to Equation (3) for magnesium carbonate.
After the kiln, quicklime is stored and can be hydrated to form calcium and magnesium hydroxide, which is used, e.g., in mortar. There are also various applications for the direct use of quicklime, such as desulphurization of raw steel or as a fertilizer [
23].
The production of refined sugar also depends on limestone and quicklime. It is used for the purification of the raw sugar juice after the extraction process. Therefore, the sugar industry operates its own lime kilns, most of which are located onsite of the sugar refineries [
23].
3.2.2. Methodology
The emissions from the limestone industry result from fuel burning and the calcination process. The share of 35% energy and 65% process-related CO
2 emissions according to [
24] is applied to the site-specific data. This share is also used for the determination of the CO
2 emissions from the sugar industry since the input feed of fuel and limestone is more or less the same. Most CO
2 recombines in the limed juice and forms CaCO
3 to be sold to agriculture for pH adjustment of farmland. The share of 35 to 65% of energy-related and process-related emissions is still applicable since the CO
2 used in the purification process (CaCO
3 is formed) is separated from the entire exhaust gas stream [
23] and, therefore, assumed to be not included in the site-specific emission data.
3.2.3. Scenarios
CO2 in this sector is emitted mainly from the processing of the raw materials dolomite and limestone. Furthermore, the product properties of the processed raw material are the reason for their use for a wide variety of applications. Additionally, no information on possible adequate substituents is available.
Scenario RFS: against this background, within scenario RFS, process-related emissions stay constant and energy-related emissions are caused solely by the use of “renewable” methane for heat supply. The reduction of energy-related emissions is calculated via the reduction factor obtained by substituting various fossil fuels (coal, mineral oil) with methane. The fuel mix of the lime/quicklime industry in 2012 is given by [
25] and dominated by fossil solid fuels (51%) and by natural gas (34%) (
Table 5). The former is assumed to consist of half lignite and half hard coal.
Scenario ATRES: the scenario ATRES is based on an electrified heat supply comparable to the LEILAC-process described in
Section 3.1.3.
3.3. Ceramics and Glass
There are numerous different types of glass and ceramics available on the market. Nevertheless, production processes are similar. Therefore, the analysis is presented in one section.
3.3.1. Process Description
Raw materials used for glass production are silica sand, limestone caustic soda, and several additives for purification, dyeing, or melting point reduction. The first process step is the batch preparation and mixture with recycled material, which is then fed into the melting process. Afterwards, the melt is formed, conditioned as well as cured and dried. The final steps are cutting, milling, and packaging. The majority of process-related and energy-related CO
2 emissions of the overall process occur during the melting process [
17]. The sources of process-related emissions are the used carbonates CaCO
3, Na
2CO
3, MgCO
3, and BaCO
3. During the melting, CO
2 is driven out of these carbonates, similar to the clinker and quicklime production [
14]. The process-related energy for the kilns is mainly provided by natural gas.
The process of ceramic production is similar to that of glass production. However, the basic production path for all ceramics is characterized by the extraction and preparation of silicates and oxidic raw materials, followed by shaping, drying, surface finishing and the subsequent burning process. If necessary, further finishing treatment follows as the last processing step. The drying and burning process consumes most of the overall energy demand. The process-related emissions also occur during the burning process and result from both the carbonate and fossil components of the raw material. Porosification agents, such as sawdust, also contribute partly to the overall emissions [
14].
3.3.2. Methodology
A distribution of processes is used to identify the share of process-related emissions in the total emissions of each plant. The applied values of the glass industry are listed in
Table 6 and those of the ceramic industry in
Table 7 [
17]. Thus for the site-specific determination, the percentages of process-related CO
2 per sector (
Table 6 and
Table 7, right column) are multiplied by the absolute CO
2 emissions of the corresponding sites. Although the absolute values are given in CO
2 eq., this is negligible as only the share is applied. As described below, the production category of plants with CO
2 emissions of less than 40 kt/year has not been accurately recorded. This share is therefore undefined.
The share of process-related CO
2 in total emissions of undefined production facilities (no information on the type of glass or ceramics production provided) is calculated with the weighted mean of the different categories. The total output per category is obtained from [
14]. The weighted mean of process-related CO
2 relative to the overall CO
2 assigned to the glass facilities is 15% and that of the ceramic industry is 55%.
The available list of glass producing plants sums up to a total of 74 records and that of the ceramic production facilities to 133 plus 7 plants manufacturing mineral wool. However, these lists lack data that is essential for a comprehensive analysis including the location and product category. Therefore, these parameters are partly obtained from [
11] and completed by manual search.
3.3.3. Scenarios
Since the CO
2 emissions are directly linked to the used raw materials, a potential reduction might only be possible by substituting the whole production process and/or by using other basis materials without carbonates. For the latter no realistic substitutions are visible. Thus, only the reduction of energy-related emissions is analyzed so far [
17,
26,
27]. This analysis shows that it is possible to obtain the required process heat by furnaces powered by electricity as it is already implemented for furnaces with smaller capacities (<100 t/d).
Scenario RFS: for scenario RFS, the heat supply is covered by “renewable” methane. This results in the same amount of CO
2 as the reference amount in 2017 because natural gas is already the main fuel used in these industries (>97%) [
17].
Scenario ATRES: scenario ATRES assumes a 100% substitution of fossil or rather natural gas fired furnaces with electric furnaces.
3.4. Summary
Below, the overall emissions of the mineral industry are summed up for today (2017) and the future (perspective 2050).
3.4.1. Cement
Results: in 2017, 36 cement clinker producing facilities are under operation in Germany, of which two facilities produce oil shale clinker and white clinker, respectively, together with grey clinker at one site. Therefore, only 34 facilities are listed in the
Supplementary Material.
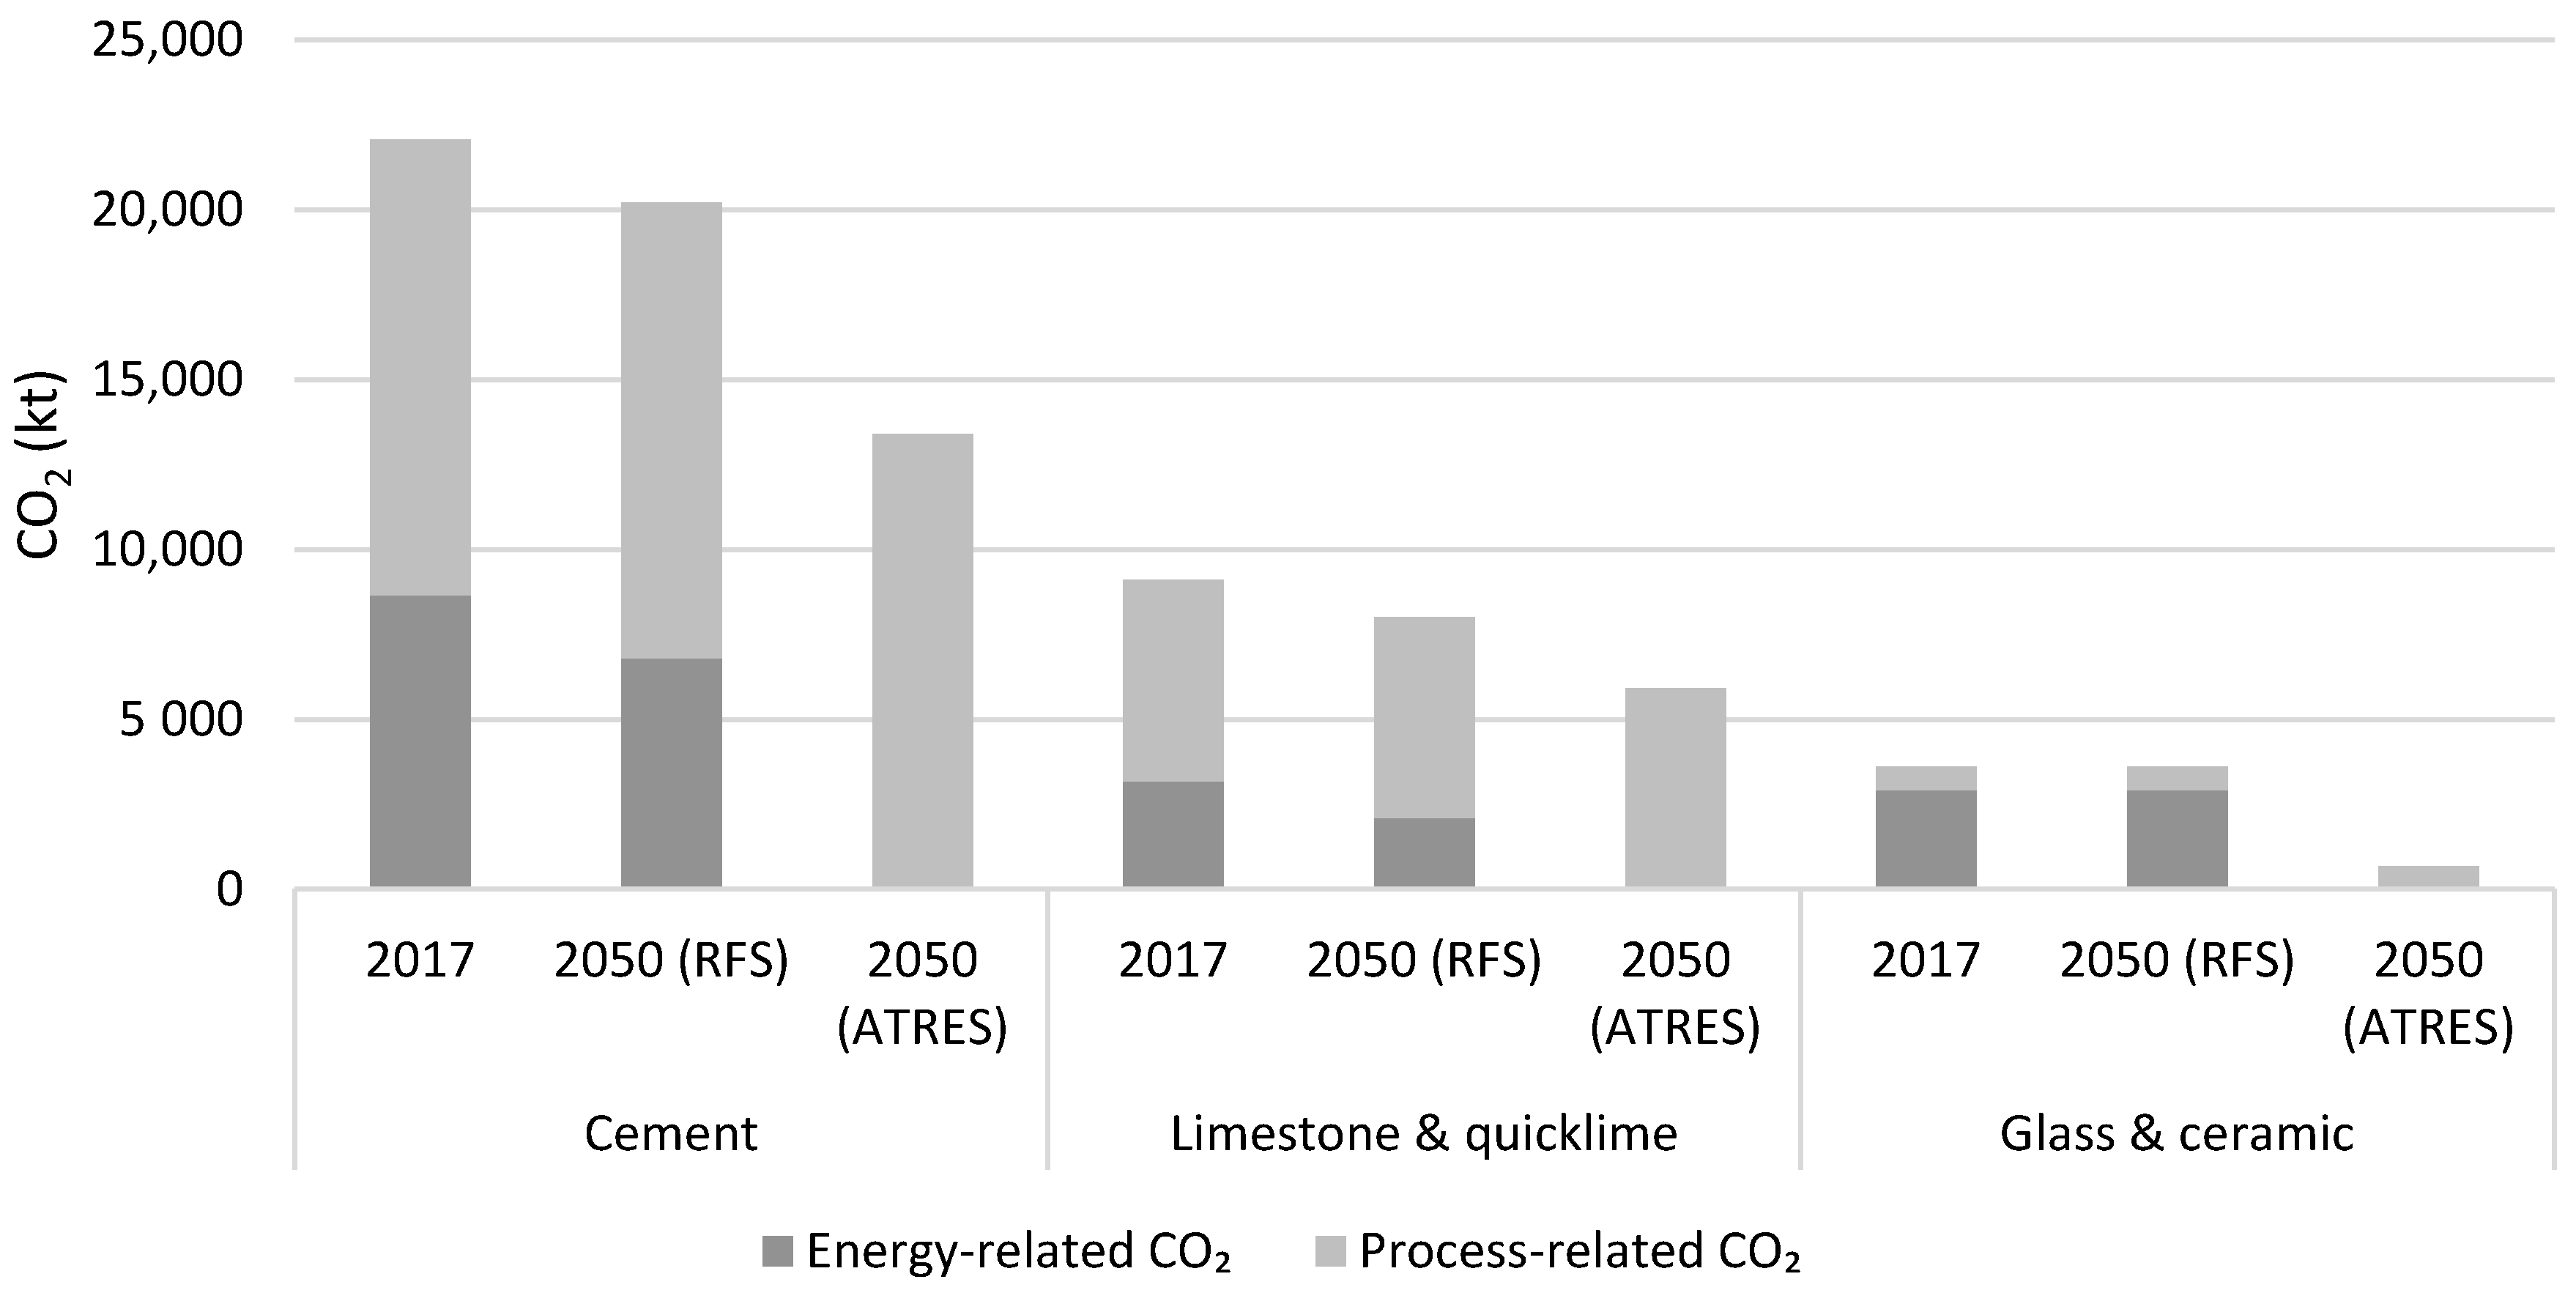
The overall CO
2 emissions in 2017 were 22,062 kt, of which approx. 13,400 kt are process-related and 8660 kt are energy-related (
Figure 4). The site-specific CO
2 emissions show a wide range. The lowest emissions of a production site amount to approx. 180 kt CO
2 and the largest emitter released almost 1.7 Mt CO
2 in 2017. Within the mineral sector, cement production sites show the highest CO
2 emissions with an average of 630 kt CO
2 per site in 2017.
The site-related emissions in 2017 and their locations are presented in
Figure 5. An agglomeration of cement plants is found in the region between Paderborn and Erwitte in the north-east of North Rhine-Westphalia and in the south of Germany. This is due to the local deposits of the required raw materials lime, dolomite, and lime marl. In north Germany, production facilities with corresponding deposits can only be found in the Hannover area and north of Hamburg. An overview of the various production sites is listed in the
Supplementary Material.
If “renewable” methane substitutes the share of fossil fuels used in 2017 by 2050, the total CO
2 emissions are reduced to 20,211 kt/year in scenario RFS (
Figure 4) and if the process heat is only provided by electricity from renewable sources (Scenario ATRES) only process-related emissions remain (
Table 8), which is a reduction of approx. 40% compared to 2017. The remaining CO
2 emissions in scenario RFS are slightly lower than the emissions in 2017 as the specific CO
2 emissions from methane combustion are lower compared to e.g., lignite or refuse-derived fuels (
Table 3). The distribution of CO
2 emissions in the scenarios RFS and ATRES (2050) is shown in
Figure 5. The absolute number of CO
2 emitting cement plants remains the same compared to 2017. The average CO
2 emissions of the sites decrease by approx. 6% (scenario RFS) and 37% (scenario ATRES), respectively, compared to 2017.
Discussion: when determining the process-related and fuel-related CO2 proportions for the cement sector, a verified but flat-rate proportion for the respective emissions is assumed. However, it can be presumed that the fuel composition and, thus, also the resulting CO2 emissions vary from plant to plant. As a result, the real proportions may differ for each plant location. Furthermore, a comprehensive plant-specific list of the fuels used is not available Germany-wide. The determination of process-related and energy-related CO2 from the oil shale plant and white clinker plant was not possible, which leads to an incomplete presentation, as only the absolute emissions of this site are listed.
There are several different approaches to the reduction of process-related CO
2 emissions within the cement industry. The gradual substitution of clinker in multi-component cement, as well as the development of alternative binders, are the two most promising approaches subject to currently ongoing research activities [
28]. Concrete made by the application of new binder systems varies fundamentally from concrete made by the use of cement. Most of the alternative new binders are still in a research stage or pilot scale and require further investigation to achieve an appreciable substitution potential of Portland cement. Because of the lack of long-term tests on the behavior of concrete produced from these binders, they were not considered here. However, some new binder systems may be produced on a large scale by 2050 and, thus, lead to a further reduction of CO
2 emissions in the cement sector.
3.4.2. Limestone and Quicklime
Results: limestone and quicklime were produced at 49 sites in 2017, of which 18 plants produced quicklime for the sugar industry. One plant is allocated to the iron and steel industry and three plants have been excluded because they are about to be closed or have been closed already. The overall emissions amount to 9100 kt CO
2, of which about 3200 kt are energy-related and 5900 kt are process-related in 2017 (
Figure 4). Limestone and quicklime production requires roughly the same raw materials as clinker production. Therefore, the plants are located in the same regions as the cement plants (
Figure 5). However, the capacity and the associated CO
2 emissions are, on average, lower in the lime industry compared to the cement industry. The range of CO
2 emissions per site is between almost 40 kt CO
2 and about 1.3 Mt CO
2 (2017), representing average site-specific emissions of 152 kt CO
2 (2017). An overview of the various production sites is given in the
Supplementary Material.
The emissions in 2050 for both scenarios are presented in
Table 8 and
Figure 5. Process-related CO
2 remains at about 5900 kt for both scenarios. Overall emissions are reduced by 12% (scenario RFS) and 35% (scenario ATRES) compared to 2017. The slight decrease in emissions in the scenario RFS is due to the substitution of mainly fossil solid fuels (lignite and hard coal) by “renewable” methane characterized by a lower specific emission factor. Since “renewable” electricity is used for heat provision in scenario ATRES only process-related CO
2 remain (
Figure 4).
Discussion: the direct CO2 emissions from the manufacture of quicklime result from the process-related proportion and use of fuels. However, it cannot be ruled out that additional fuel-related emissions may also occur at some of the plants, e.g., due to the drying of ground limestone. It is therefore possible that the 35% proportion of energy-related emissions used in the potential analysis is exceeded.
The production of quicklime in the sugar industry has a seasonal availability since the production of sugar is directly linked to the sugar beet harvest.
Regarding the CO
2 emitted by the burning of lime for the production of, e.g., mortar, a natural reduction of CO
2 occurs when quicklime is used in the construction industry, especially in mortar and plaster. The setting of mortar and plaster removes CO
2 from the ambient air and leads to carbonation. The maximum degree of carbonation of mortar is between 80 and 92%. For such a high degree of carbonation, however, ideal conditions are required, such as the ambient temperature, thickness and composition of the walls in which the mortar is embedded [
29]. This does not change the total CO
2 emissions from this industrial sector. However, this special case represents a natural CO
2 sink.
3.4.3. Ceramics and Glass
Results: five out of 133 ceramic production sites emit more than 40 kt of CO
2 (2017); the same applies for six out of seven mineral wool producing plants. Glass is produced at 74 sites, of which 35 plants emit more than 40 kt/year.
Figure 4 shows the overall emissions of about 3600 kt CO
2, of which about 700 kt are process-related and 2900 kt are energy-related in 2017. The location and respective amounts of CO
2 are shown in
Figure 5. A complete list of these sites is given in the
Supplementary Material. The distribution of the ceramics and glass production sites is parallel to that of cement and limestone production. However, this is less pronounced. The site-specific CO
2 emissions are significantly lower than in the other mineral sectors assessed here. The given range varies between 40 kt and 245 kt CO
2 in 2017 with an average of 80 kt.
The prospective emissions in 2050 are presented in
Table 8 as well as in
Figure 4. It can be seen that the CO
2 reduction potential in scenario ATRES is about 82%, which can be explained by the increased share of energy-related CO
2 emissions in this sector compared to cement and limestone facilities. The remaining site-specific CO
2 in 2050 are presented for both scenarios in
Figure 5.
Discussion: by determining the limit value of 40 kt/year, 130 plants in the ceramics industry and around 40 plants in the glass industry are not considered in the site location analysis. However, the shares of these plants in the process-related emissions of these sectors are approx. 85% and almost 17%, respectively. Although the share of 85% is quite high, the respective emissions of more than 100 plants are less than 10 kt CO2/year, respectively. A certain uncertainty of the results is caused by the fact that the process- and energy-related shares originate from 2007 when determining the weighted averages, which are applied to the total CO2 emissions in 2017. These shares may have changed since 2007, but this cannot be verified since no recent data are available. In addition, only 96% of total production in 2017 can be allocated to the production of bricks (80%), refractory ceramics (10%) and tiles (6%). Accordingly, 4% are assumed for the remaining three production areas.
5. Non-Ferrous Metal Industry
Below, the production of primary aluminum, lead, zinc, copper, and silica are discussed in detail.
5.1. Primary Aluminum
In the following sections, the process description of primary aluminum and the methodology for the site-specific CO2 emission determination in 2017 and 2050 is presented.
5.1.1. Process Description
The production of aluminum consists of three process steps. The raw material bauxite is extracted in open-pit mines located at various locations all over the world; major producers are Australia, China, and Guinea [
33]. Then, aluminum oxide (Alumina) is extracted from this bauxite by applying the Bayer process using sodium hydroxide to solve aluminum hydroxide and separate iron-containing minerals. The provided aluminum hydroxide is then burned in kilns to obtain aluminum oxide. No process-related CO
2 emissions, as defined above, are caused during this process. However, the high energy demand for mining and the Bayer process result in energy-related and indirect emissions mainly related to the provision of the desired electricity.
The provided aluminum oxide is further refined within the Hall–Héroult process by dissolving the aluminum oxide in molten cryolite to decrease the required melting point of the electrolyte. The electrolyte is embedded in a steel tub lined with graphite that acts as a cathode. The anode in form of graphite blocks (prebaked electrode cells) is immersed from above in the electrolyte. A DC voltage and high ampere current are applied to the poles forcing the dissociated aluminum cations to migrate to the cathode at the bottom of the cell and the acid-containing ions to the anode on top.
The overall chemical reaction is shown in Equations (9) and (10). The process-related CO
2 emissions from primary aluminum production mainly result from the combustion of the carbon anodes during the electrolysis of the aluminum oxide.
The carbon–oxygen compounds formed at the anode are predominantly CO
2. During their formation, carbon from the anodes is continuously consumed requiring a replacement from time to time. The liquid elemental aluminum at the bottom of the cell is collected and discharged via a siphon since it is denser than molten cryolite [
34].
Aluminum electrolyzing cells might be equipped with prebaked anodes (so-called prebaked cells). Thus pre-baked anode manufacturing is—besides its consumption during the process—another CO
2 emission source [
35]. These prebaked anodes are manufactured in oil- or gas-fired furnaces. A mixture of petroleum coke, coal tar pitch and crushed spent anodes are pressed in pits and baked between 22 and 32 h at about 1200 to 1300 °C [
36]. After the anodes are cooled down, steel stubs are inserted in stub holes on top of the block and fixed with poured cast iron. These are connected to an aluminum or copper rod to conduct the electrical flow into the anode [
34].
5.1.2. Methodology
Carbon from the anodes reacts with oxygen separated from alumina to form CO
2. The average anode consumption per ton of aluminum is 430 kg [
14]. Assuming an average carbon content of the anode of 857 kg/t and a stoichiometric conversion to CO
2, this results in a specific emission factor of 1367 kg CO
2/t aluminum [
14]. Due to Equation (9), CO is also formed during the electrolysis. It is assumed that this CO is further oxidized to CO
2 by contact with ambient air and is thus included in the emission factor mentioned above [
37].
CO
2 emissions from anode baking result basically from three combustion processes: the combustion of fuel for firing the furnace, the combustion of volatile matter, and the combustion of baking furnace packing material [
37]. Half of the total emissions from anode manufacturing are emitted by burning fuel. The other 50% are process-related emissions from the combustion of pitch volatiles and packing coke. Total emissions from prebaked anode production vary between 320 and 575 kg CO
2/t product [
38]. As an approximation the arithmetic mean of about 448 kg CO
2/t baked anode is applied, of which ca. 224 kg CO
2/t are process-related.
The anode baking capacities are given for the refineries in Hamburg and Voerde [
39]. The third anode baking facility in Germany is located at the refinery in Neuss. The determination of process-related emissions from the anode baking facility is based on data obtained from the register of installations. The total CO
2 values of each aluminum refinery in 2017 are obtained from thru. Because of the lack of detailed primary aluminum production values of each refinery, these values have been approximated by reducing the installed capacity of each facility by the proportionate amount of the total primary aluminum production of 550 kt in 2017 [
40]. This aluminum output in 2017 was about 75 kt below the installed capacity of 625 kt. Since the specific production output for each refinery is not available, this 75 kt (2017) gap is allocated to the four refineries. The quantity distributed to each refinery is based on the share of each production capacity related to the overall capacity of 625 kt.
Furthermore, there are four aluminum foundries/processing facilities emitting more than 40 kt CO
2 in 2017. These sites only emit energy-related CO
2 mainly caused by burning oil (13%) and gas (87%) [
41].
5.1.3. Scenarios
Scenario RFS: there are research activities in which bio-oil has been produced by fast pyrolysis, having similar properties to fossil petroleum coke, and could be used for the production of anodes [
42]. Based on these research activities in scenario RFS, the use of biomass-based anodes and “renewable” methane as a fuel for the anode baking process is assumed. Therefore, the CO
2 emissions remain constant compared to 2017 but change from fossil to biogenic carbon. For the prospective emissions of aluminum foundries and processing sites, it is assumed that the heat supply is provided by “renewable” methane for scenario RFS. The proportional emission reduction was then applied to the emissions of each site to determine the remaining emissions for 2050.
Scenario ATRES: there is no scenario ATRES defined for the primary aluminum production (electrolysis) since there are no promising alternative technologies to enter the market until 2050. An alternative for reducing process-related emissions at all is the use of inert anodes. This technology has been investigated for more than 50 years already without making promising progress for industrial-scale implementation [
17]. For the prospective emissions of aluminum foundries and processing sites, it is assumed that “renewable” electricity is used for heat provision.
5.2. Zinc, Lead, Copper, and Silica
Zinc: in Germany, primary zinc is produced by the hydrometallurgical process. In this process, ore concentrates (mainly so-called zinc blende) are desulfurized in a roasting process. By adding carbon carriers, zinc oxide and sulfuric acid are formed at approx. 900 °C; the latter is removed as a by-product. The zinc oxide is then fed to the electrolysis, where pure zinc is accumulated on the anode. In secondary zinc production, secondary materials containing zinc are oxidized to zinc oxide in rotary kilns by adding petroleum coke, which is fed into the production process of leaching and electrolysis [
43]. Process heat is obtained from using oil (22%) and natural gas (78%) [
41].
Concerning alternative technologies for CO2 reduction, it can be assumed that biomass might also be applicable as an alternative to coke. In principle, direct reduction using hydrogen also seems possible in this sector, but further verification is required. If oil and natural gas fossil fuels are substituted by “renewable” methane and biomass is used as a reduction agent until 2050, the total emissions would decrease by the proportion of the substituted fossil fuels (scenario RFS). If hydrogen is applied as a reduction agent and process heat is provided by “renewable” electricity, the overall CO2 emissions in 2050 are negligible (scenario ATRES).
Lead: the production of primary and secondary lead emits process-related CO2 by the usage of fossil reduction agents coal and coke in the direct smelting process in bath smelting furnaces (Isasmelt-Ausmelt) or QSL-Reactors (primary). Short rotary furnaces or shaft furnaces processes are used for secondary lead production.
The substitution of fossil fuels with “renewable” methane and coke with biomass would result in a small reduction of the overall emissions (scenario RFS). The use of “renewable” electricity for the provision of process heat and the application of hydrogen as a reduction agent would lead to insignificant CO2 emissions in 2050 (scenario ATRES).
Copper and silica: primary copper is obtained from copper concentrates, which are produced from copper ore at the mining site. The concentrate is processed in further enrichment stages up to a copper content of 98%. This so-called blister copper is refined in a subsequent electrolytic refining process to pure copper (>99.99%). The CO
2 emissions from the production of copper are mainly energy-related due to the needed thermal energy during the enrichment stages. Process-related CO
2 emissions are relatively low [
14].
In the large-scale production of silica, quartz sand and gravel (SiO2) together with carbon (coke, coal, wood) are fed into an electric arc furnace where SiO2 is reduced to metallic Si. Process-related CO2 is emitted by the reaction of the reducing agent with the oxygen obtained from quartz sand. The determination of process-related CO2 from silica production was not possible.
If process heat is provided by “renewable” methane instead of fossil fuels, these emissions would decrease according to the proportion of substituted fossil fuels (Scenario RFS). If hydrogen is applied as a reduction agent and process heat is provided by “renewable” electricity, the overall CO2 emissions in 2050 are negligible (scenario ATRES).
5.3. Summary
Below the calculated results are summarized and discussed.
5.3.1. Aluminum
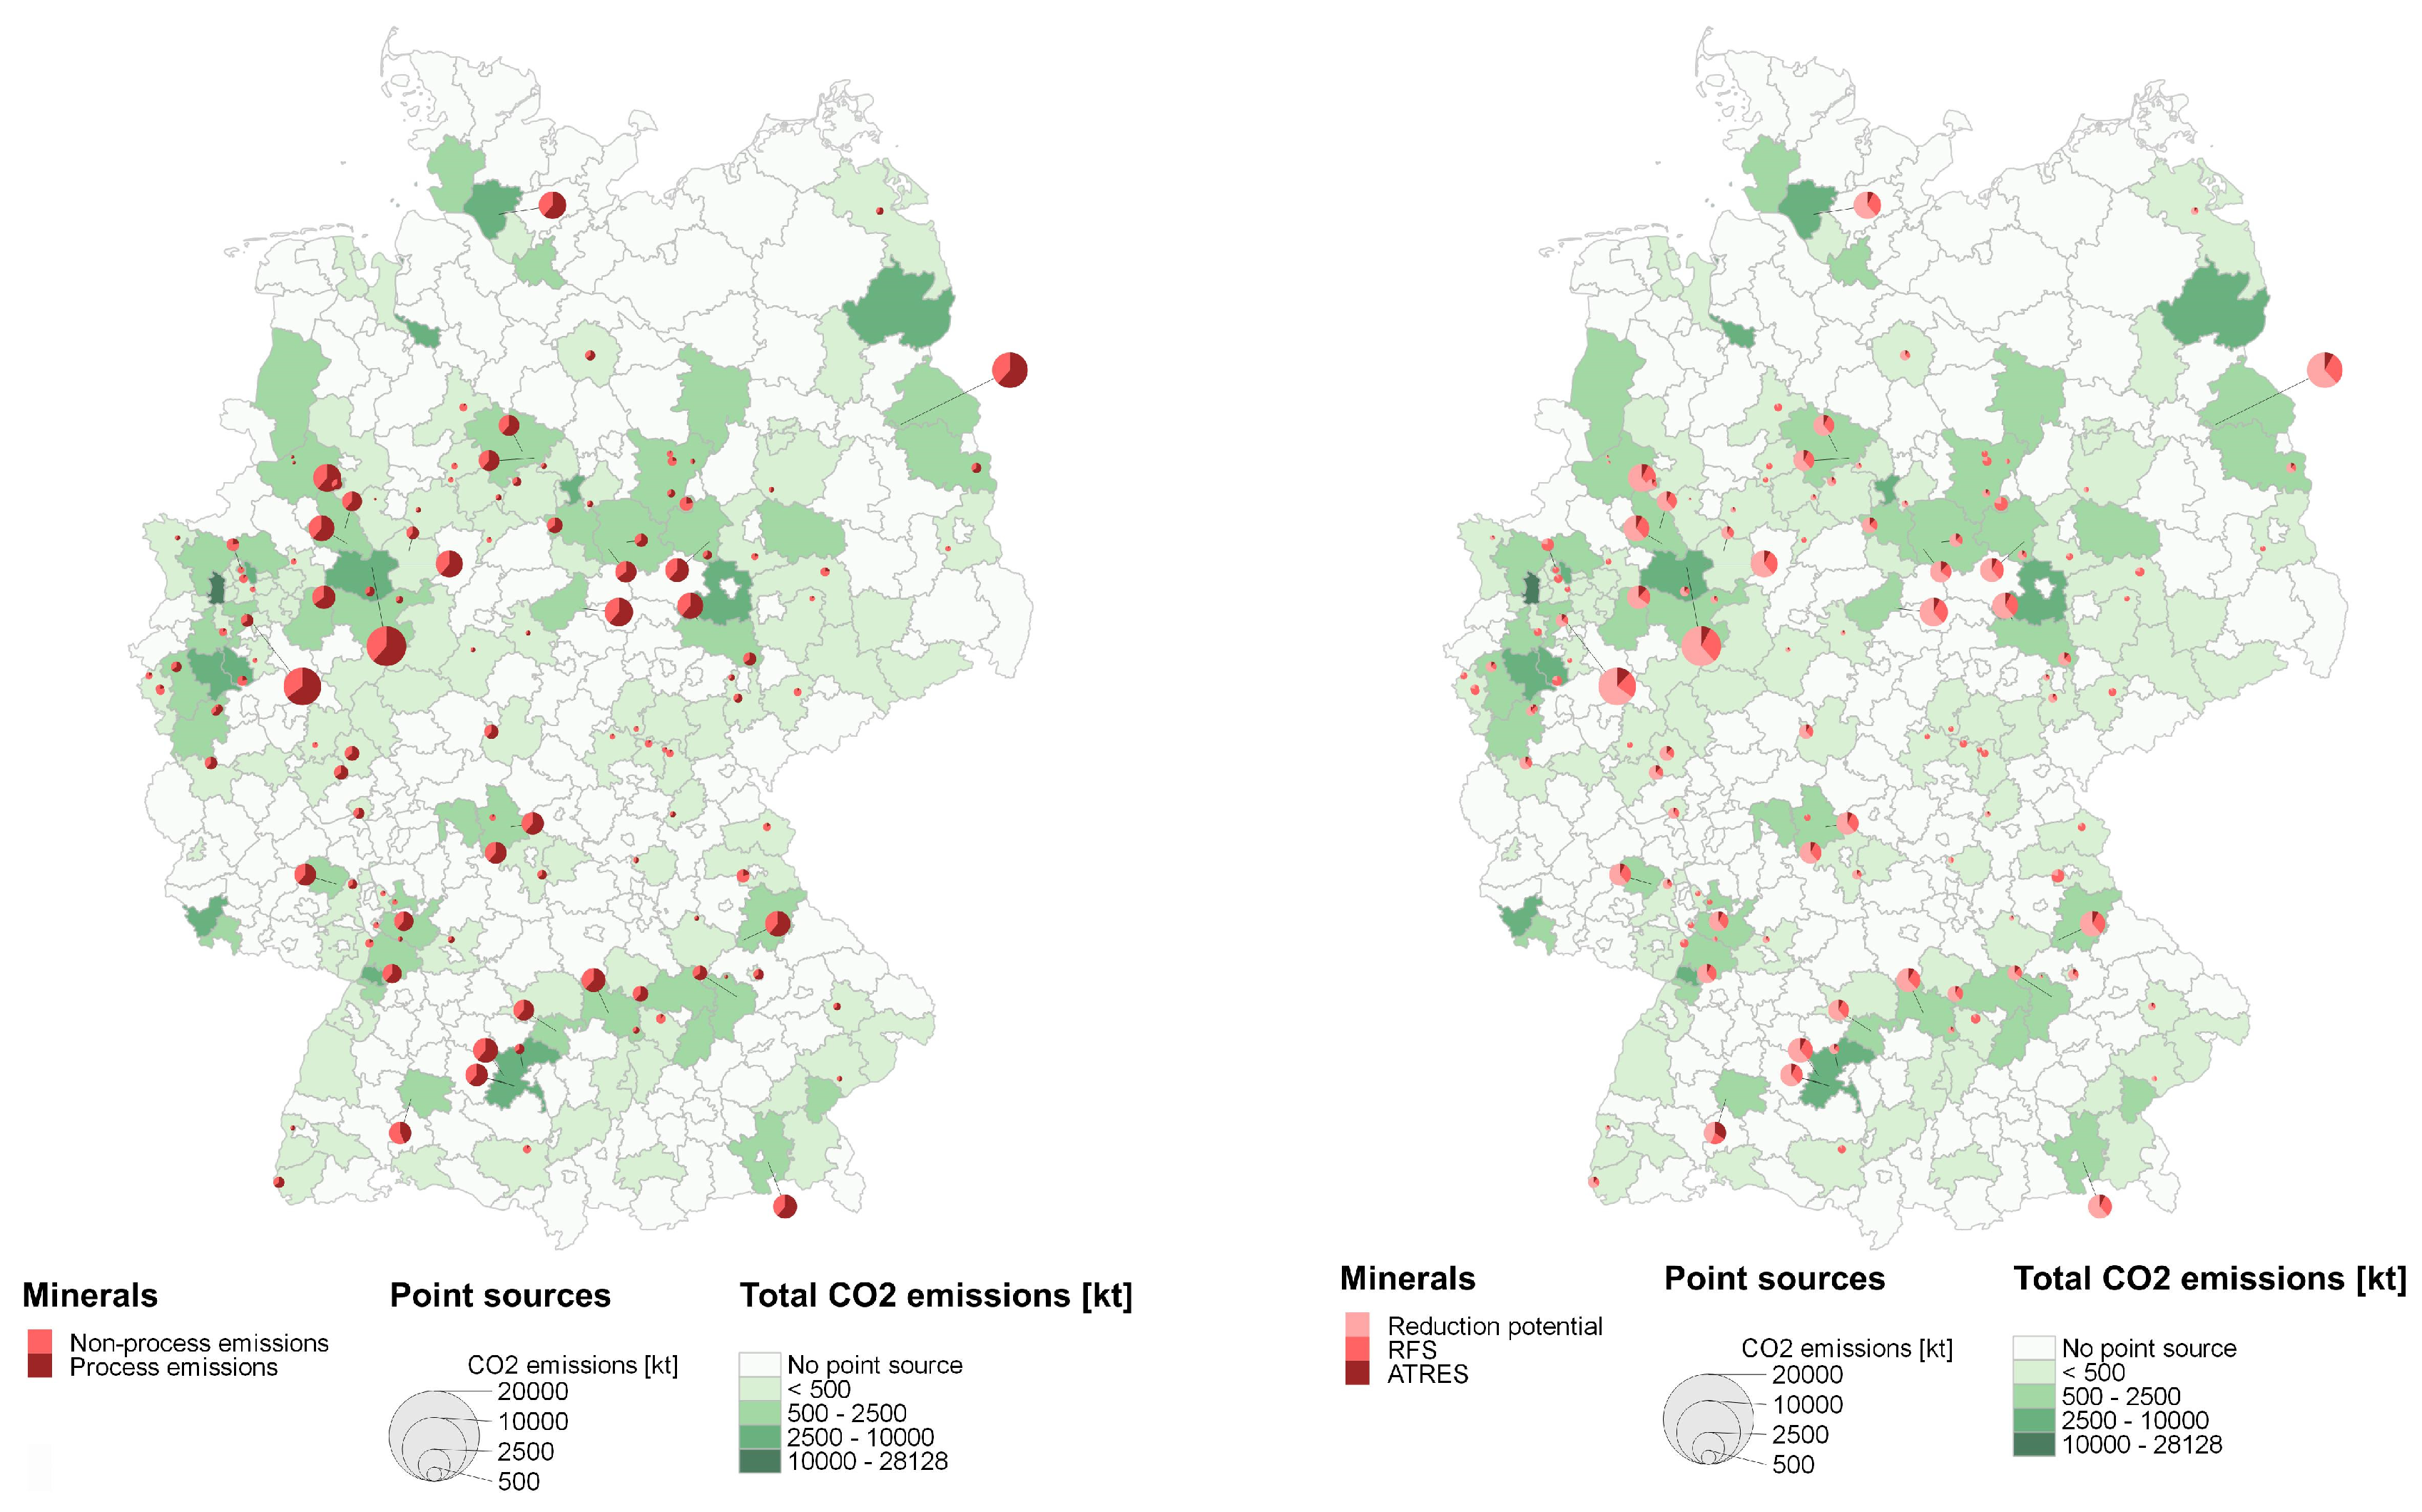
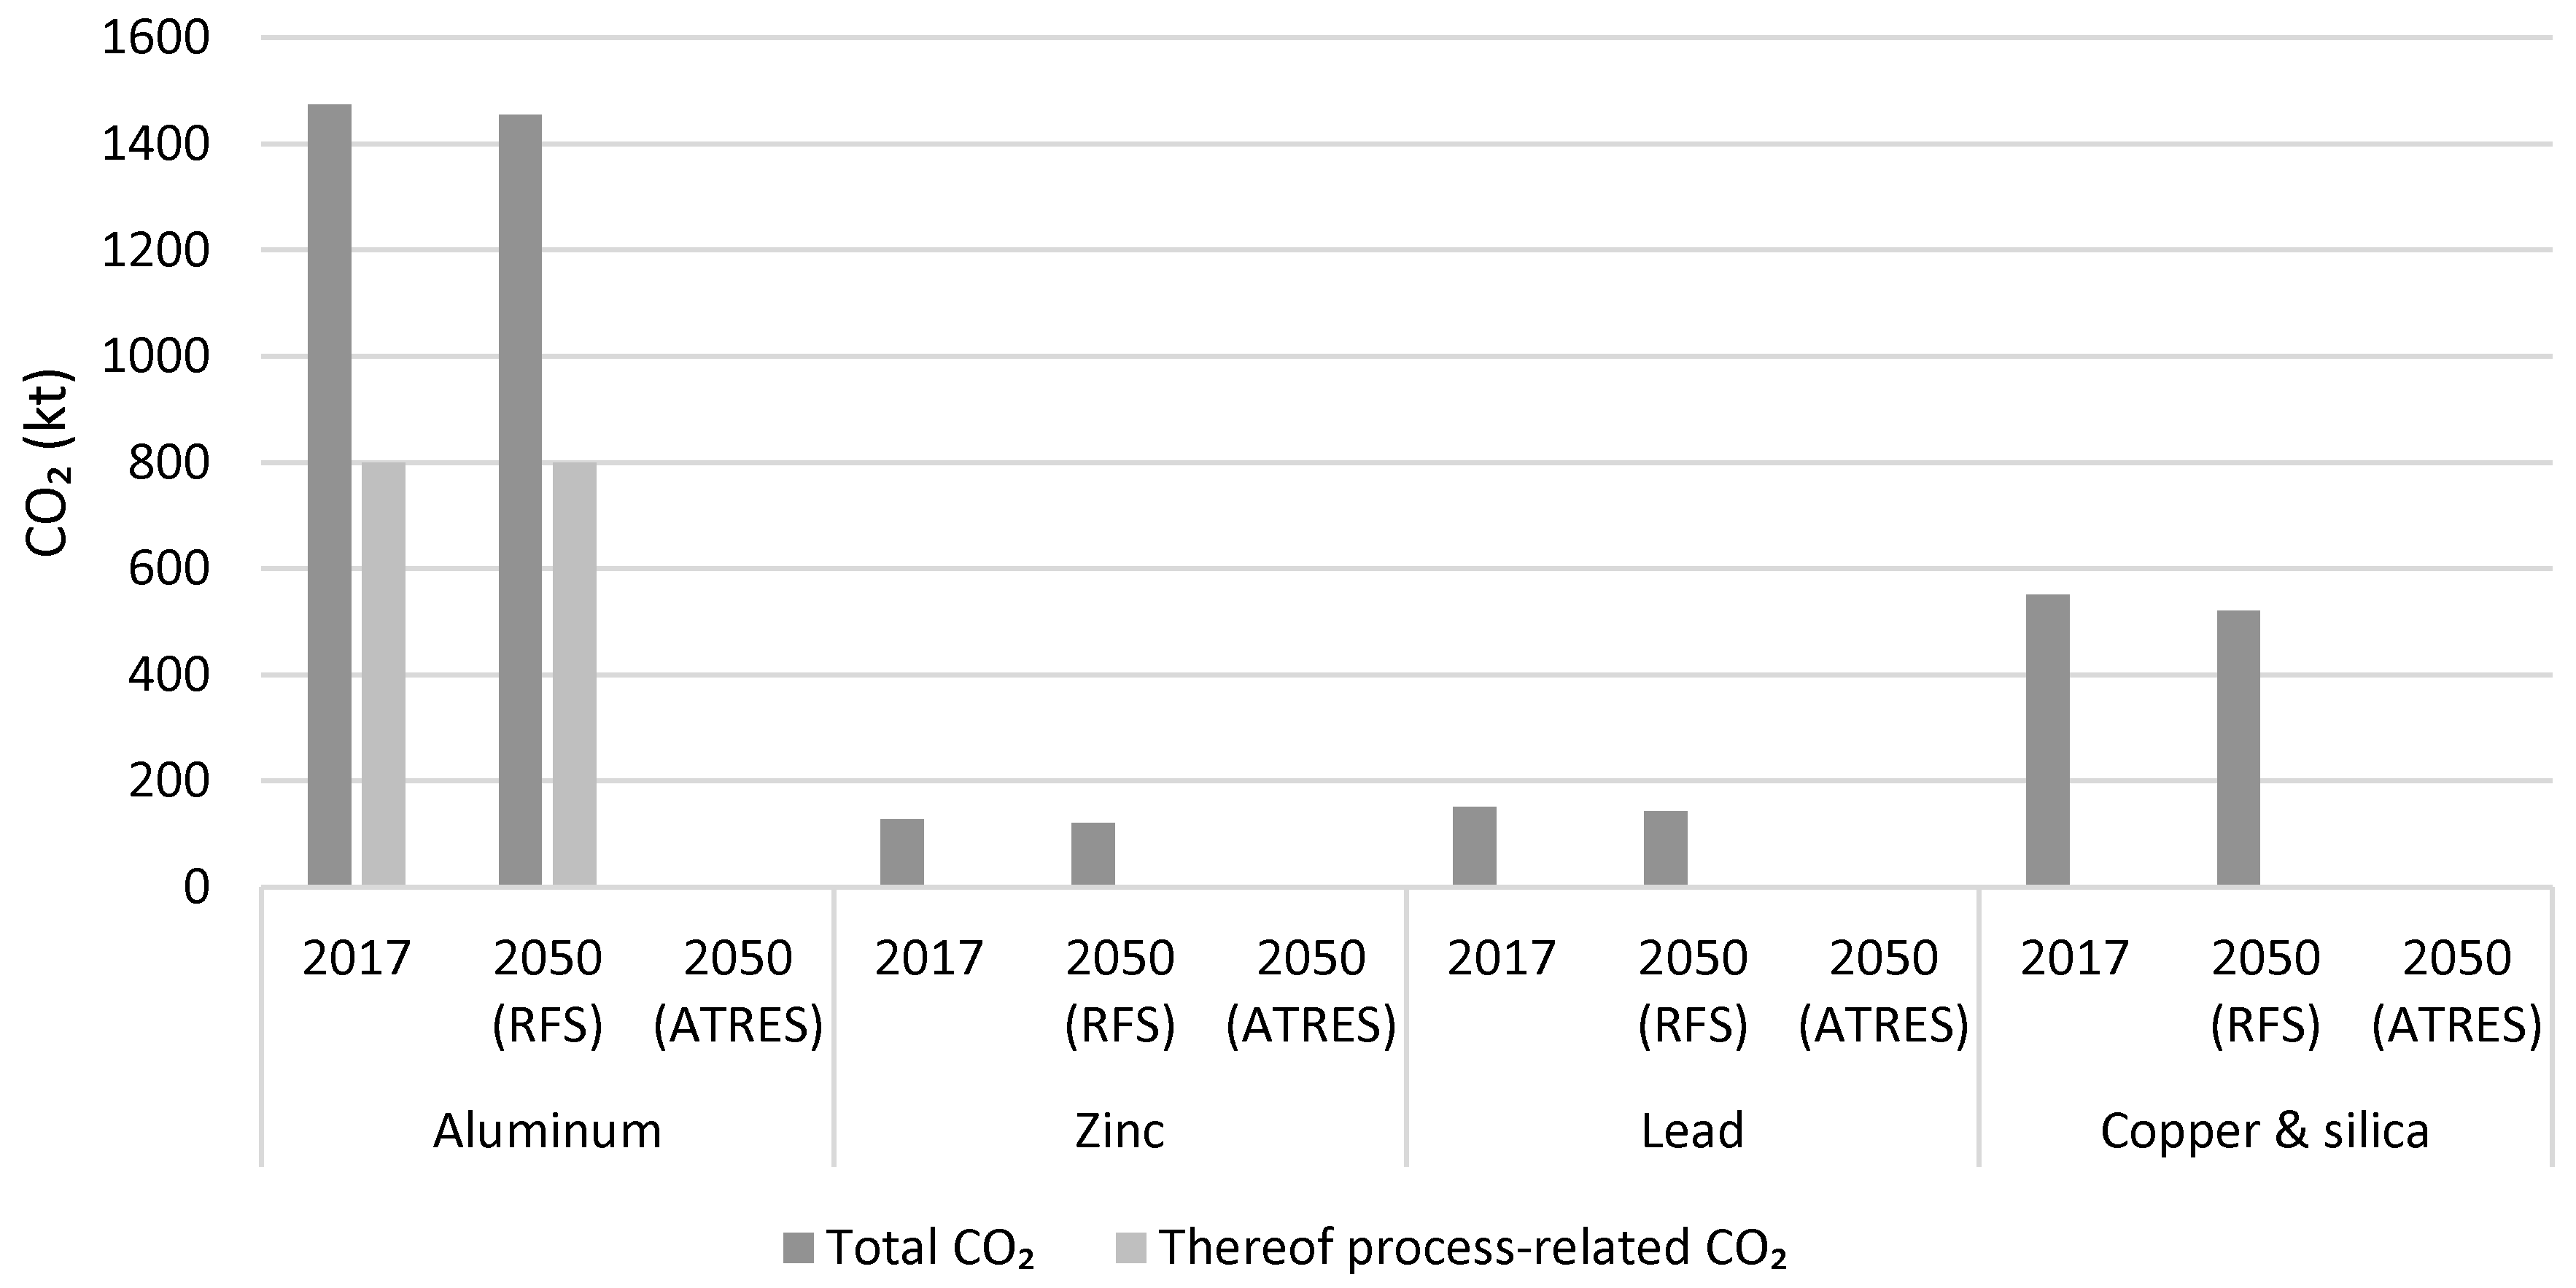
Results: there are four primary aluminum refineries in Germany, of which three have their own anode backing facilities. The overall CO
2 emissions in 2017 amount to roughly 1.4 Mt, of which around half are process-related. The distribution is caused by the anode consumption during electrolysis (process-related CO
2) and the limited use of fuels, which are mainly used in anode baking. The majority of the energy required for primary aluminum production is provided by electricity which does not cause direct emissions at the respective production site. A list of the different facilities and their emitted amount of CO
2 is given in the
Supplementary Material. The regional distribution of the point sources is presented in
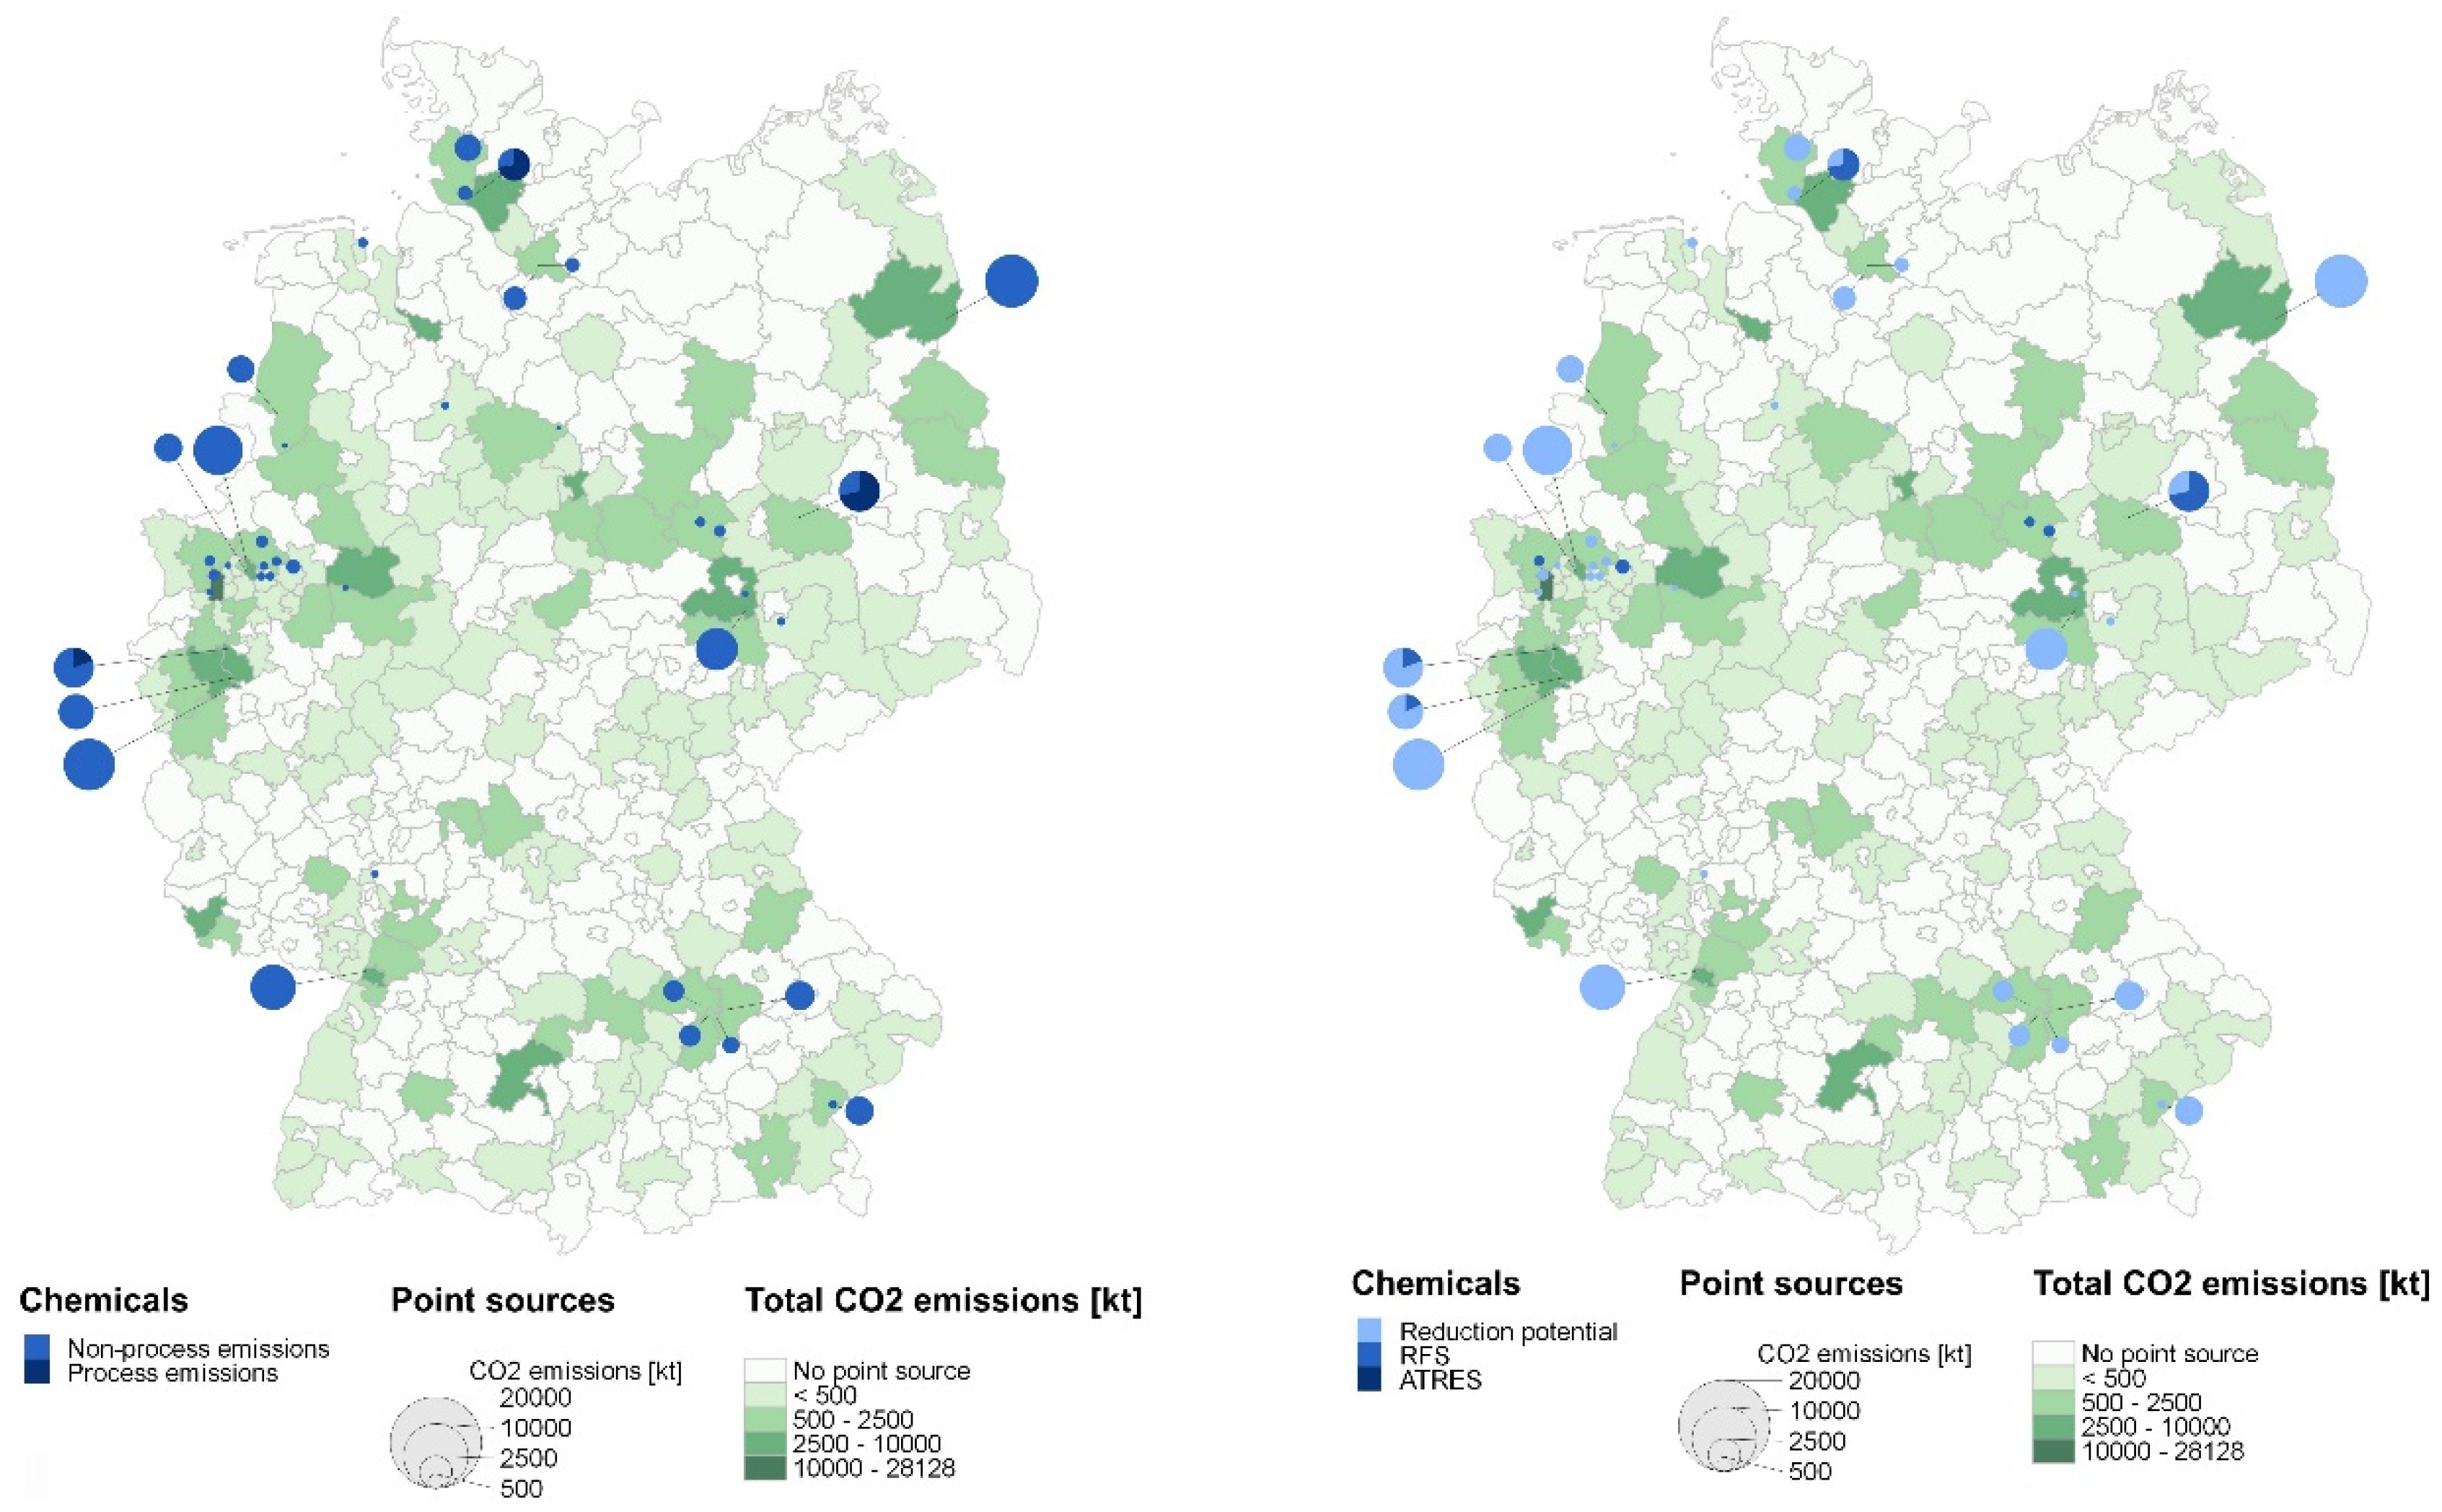
Figure 8. The facilities are located in Hamburg as well as in the south of North Rhine-Westphalia.
The emissions in the scenario RFS show similar quantities as for 2017 (
Figure 9) which is due to the high share of natural gas as fuel for the anode backing and the assumption that the anodes are made of biogenic carbon which would result in similar emissions as for use of fossil carbon. The emissions in scenario ATRES are not determined because the analysis showed no promising alternative technologies to enter the market until 2050.
The total emissions of the aluminum foundries and processing sites amount to 472 kt in 2017. Process-related CO2 is not emitted. The emissions stem from heat provision, using mainly natural gas as fuel. When “renewable” methane is used for heat provision in 2050 (scenario RFS) the emissions decrease to about 452 kt CO2. The provision of heat by “renewable” electricity in scenario ATRES leads to negligible emissions in 2050.
Discussion: the calculated production quantities for 2017 of the primary aluminum sector may differ from the real production figures, as these are calculated based on the total production of all plants and their corresponding share of the total production alone. Thus, the CO2 emissions of the respective plant can also vary from the actual quantities emitted. Emissions from cathode production are not included in the calculation. It is assumed that the cathodes are much more durable than the anodes since literature only reports the consumption of the anode as a relevant CO2 source. However, the emissions from cathode production should still be included for an all-embracing analysis. However, these emissions are likely to be marginal compared to those from anode production and consumption.
5.3.2. Zinc, Lead, Copper, and Silica
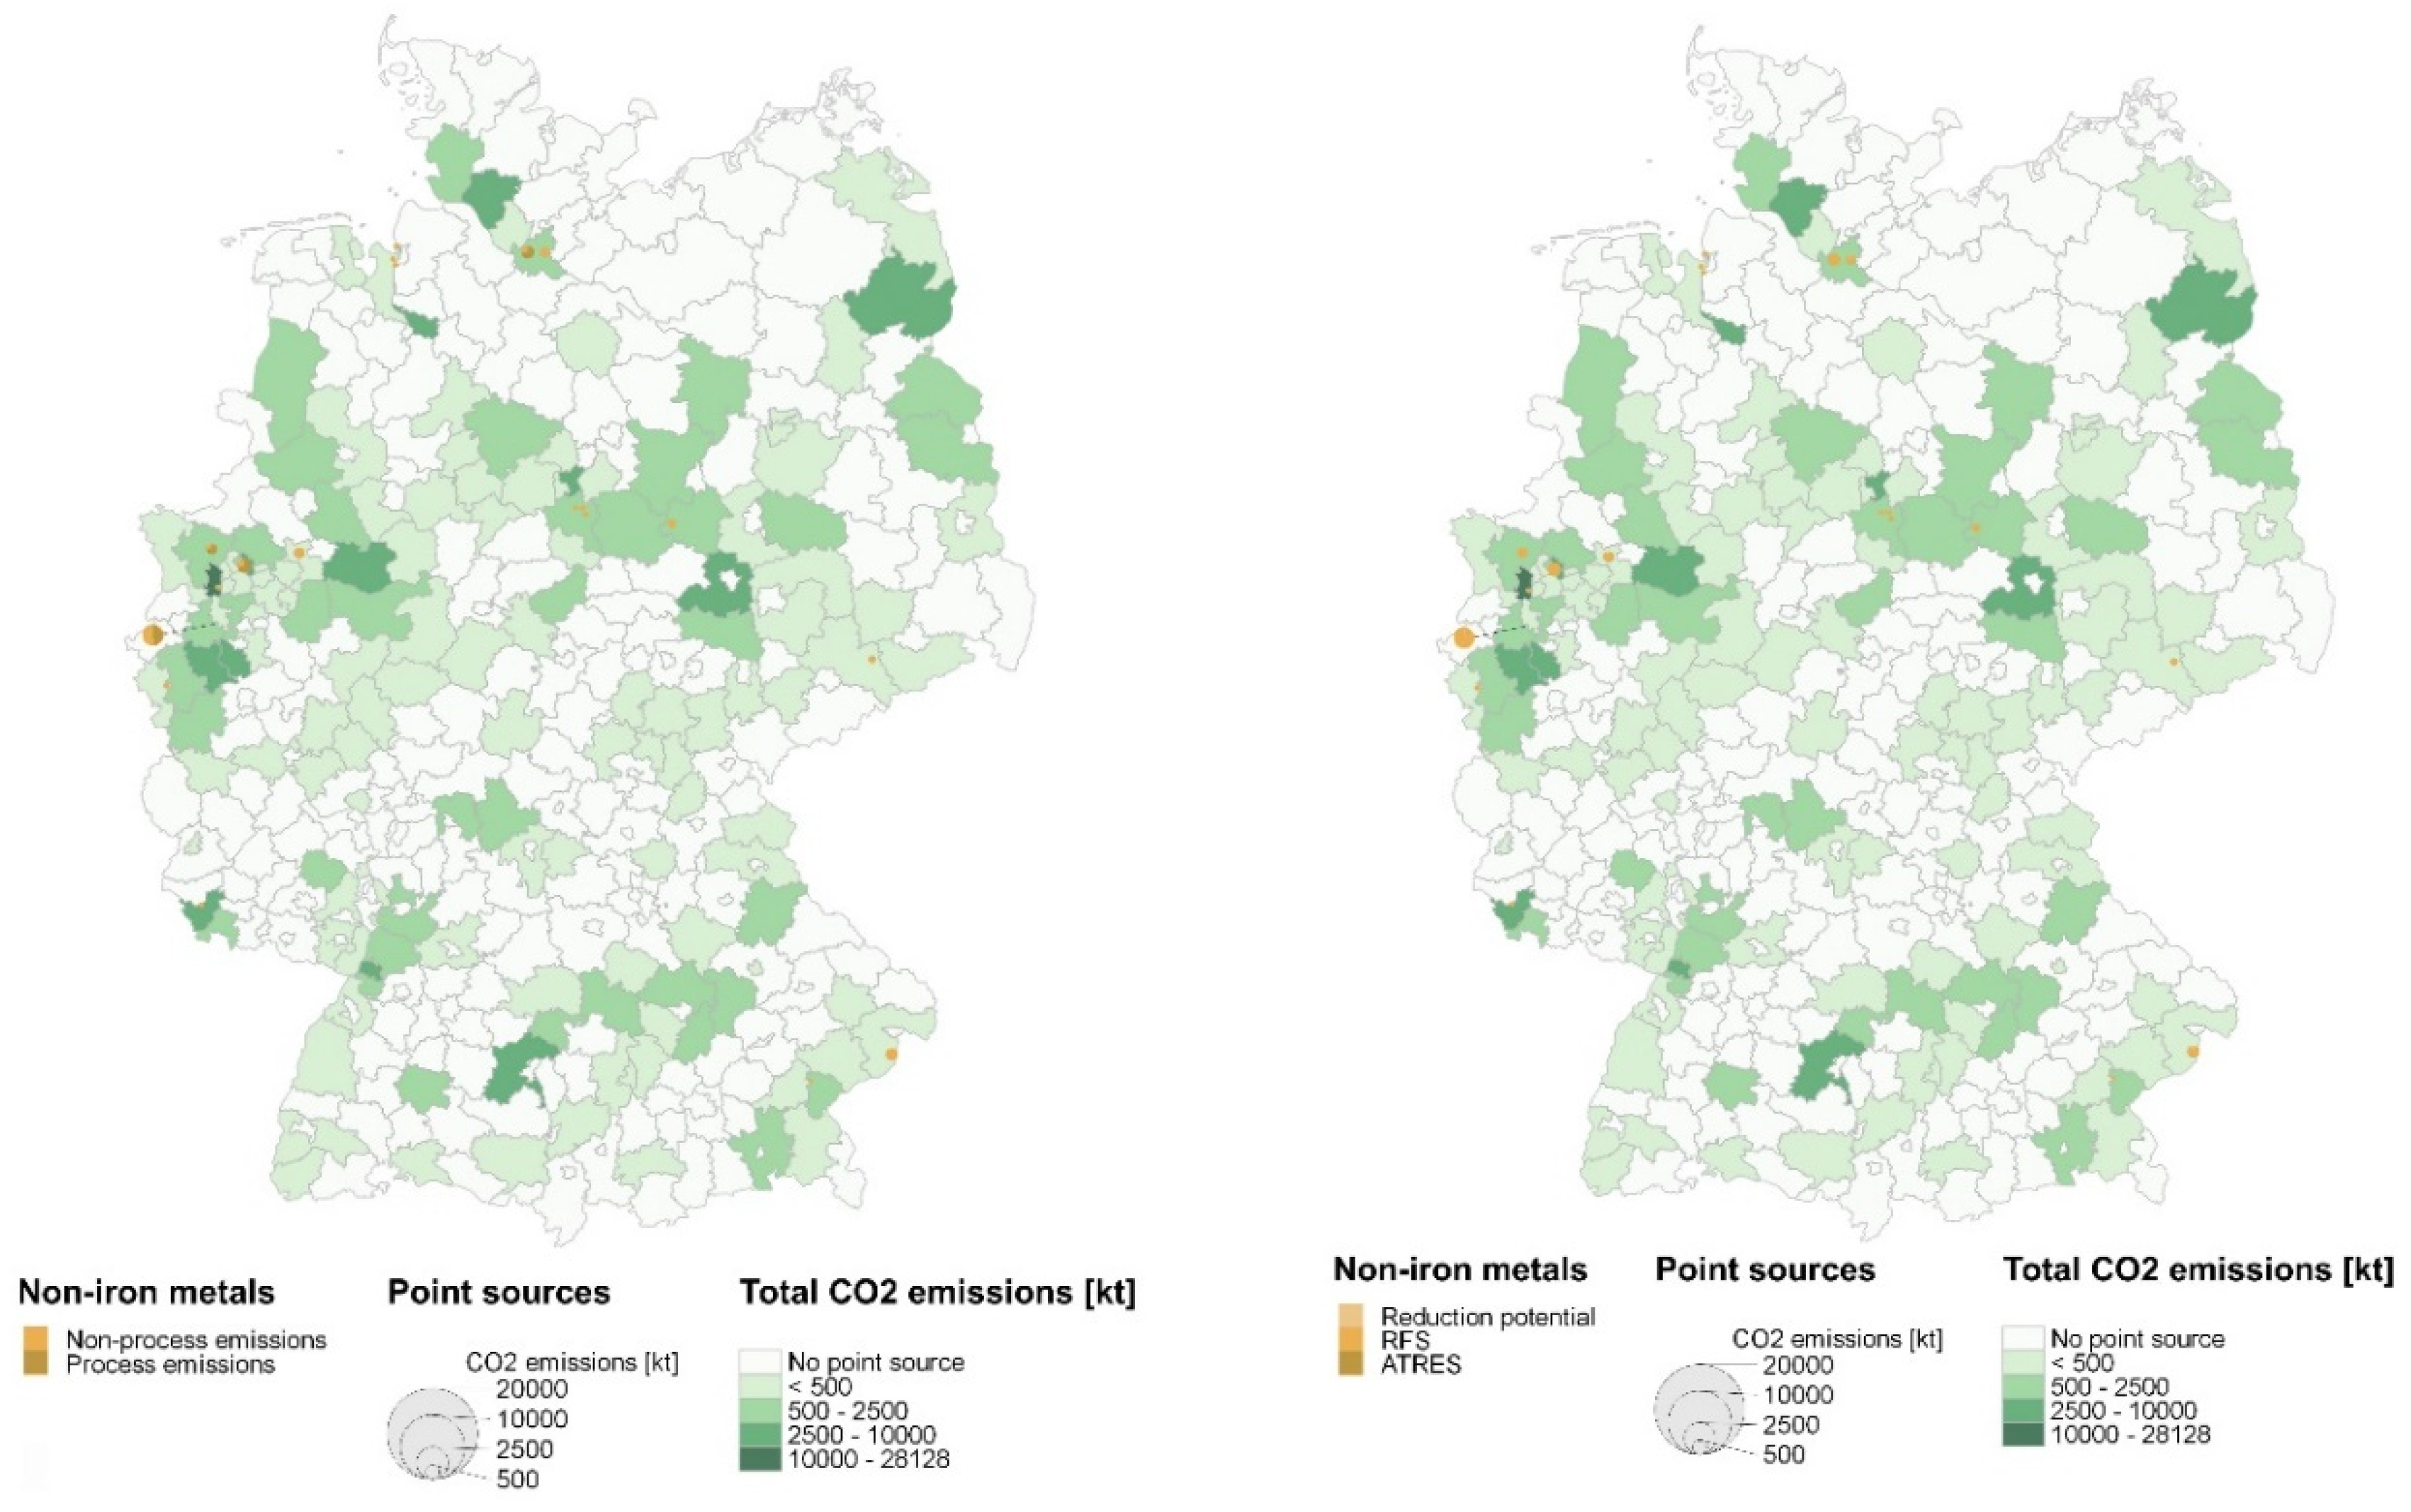
Results: CO
2 emissions from these sectors are relatively small compared to the primary aluminum production and casting and rolling of aluminum (
Figure 9). In 2017, the overall CO
2 emissions amount to 830 kt, of which the two copper production sites shows the greatest proportion (342 kt CO
2). Two zinc-producing facilities released 128 kt CO
2 and three lead-producing plants emitted a total of 151 kt CO
2. The silica production at one site emitted 209 kt CO
2. A specific determination of energy-related and process-related emissions within the total amount is not possible due to a lack of data. The spatial distribution is inhomogeneous at different locations (
Figure 8). The emissions in the scenario RFS amount to 785 kt CO
2 and show similar quantities as for 2017 due to the high share of natural gas as fuel for these sectors in 2017. The emissions of the sites are reduced by an average of 5%. The results of scenario ATRES show negligible emissions.
Figure 8 shows the distribution of the remaining CO
2 for the scenario RFS and ATRES.
Discussion: the total process-related emissions (zinc 300 kt, lead 77 kt) obtained from literature [
14] may exceed the total amount given in
Table 8 since these process-related emissions represent the agglomerated amount of all processing facilities in Germany. The analyzed data do not indicate where the other zinc factories are located. It is not possible to specify the proportions of process-related and energy-related CO
2 per site (zinc and lead) because the required data is not available. These circumstances cause an incomplete determination of the CO
2 resource potential of the zinc and lead production. Therefore, the results of the determination of 2050 emissions in the two scenarios may also be approximate.
8. Conclusions
The aim of this paper is to determine the CO2 emissions from the German industry as a resource for PtX applications in 2017 and potentially in 2050 for two different scenarios.
8.1. Overall Results
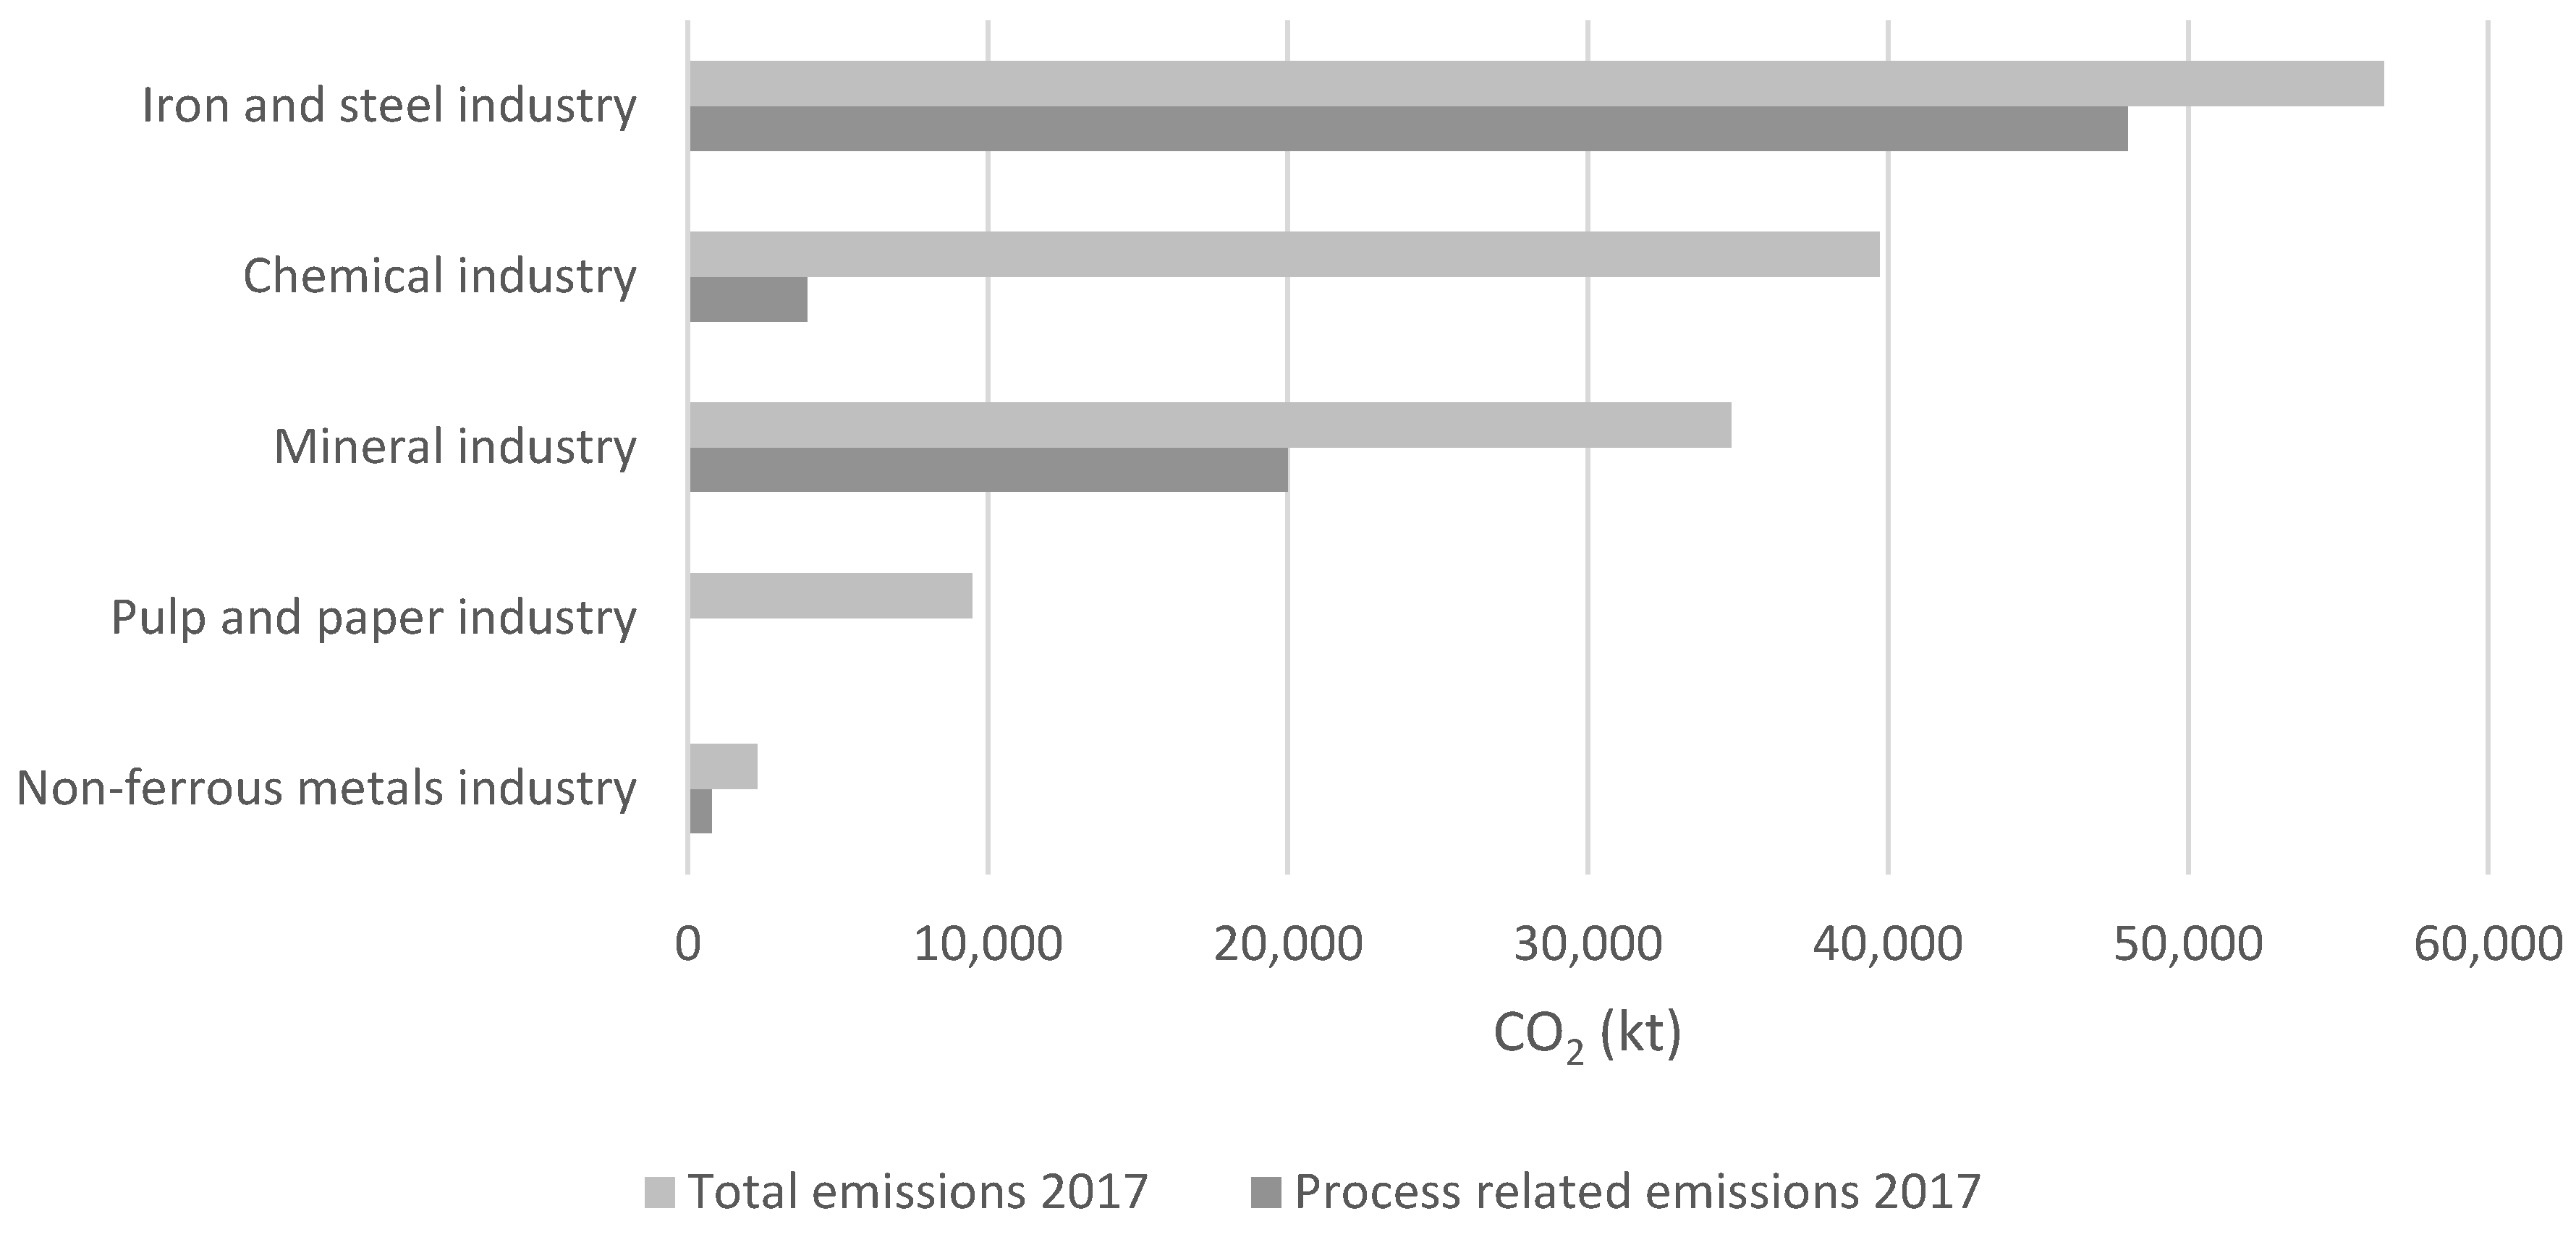
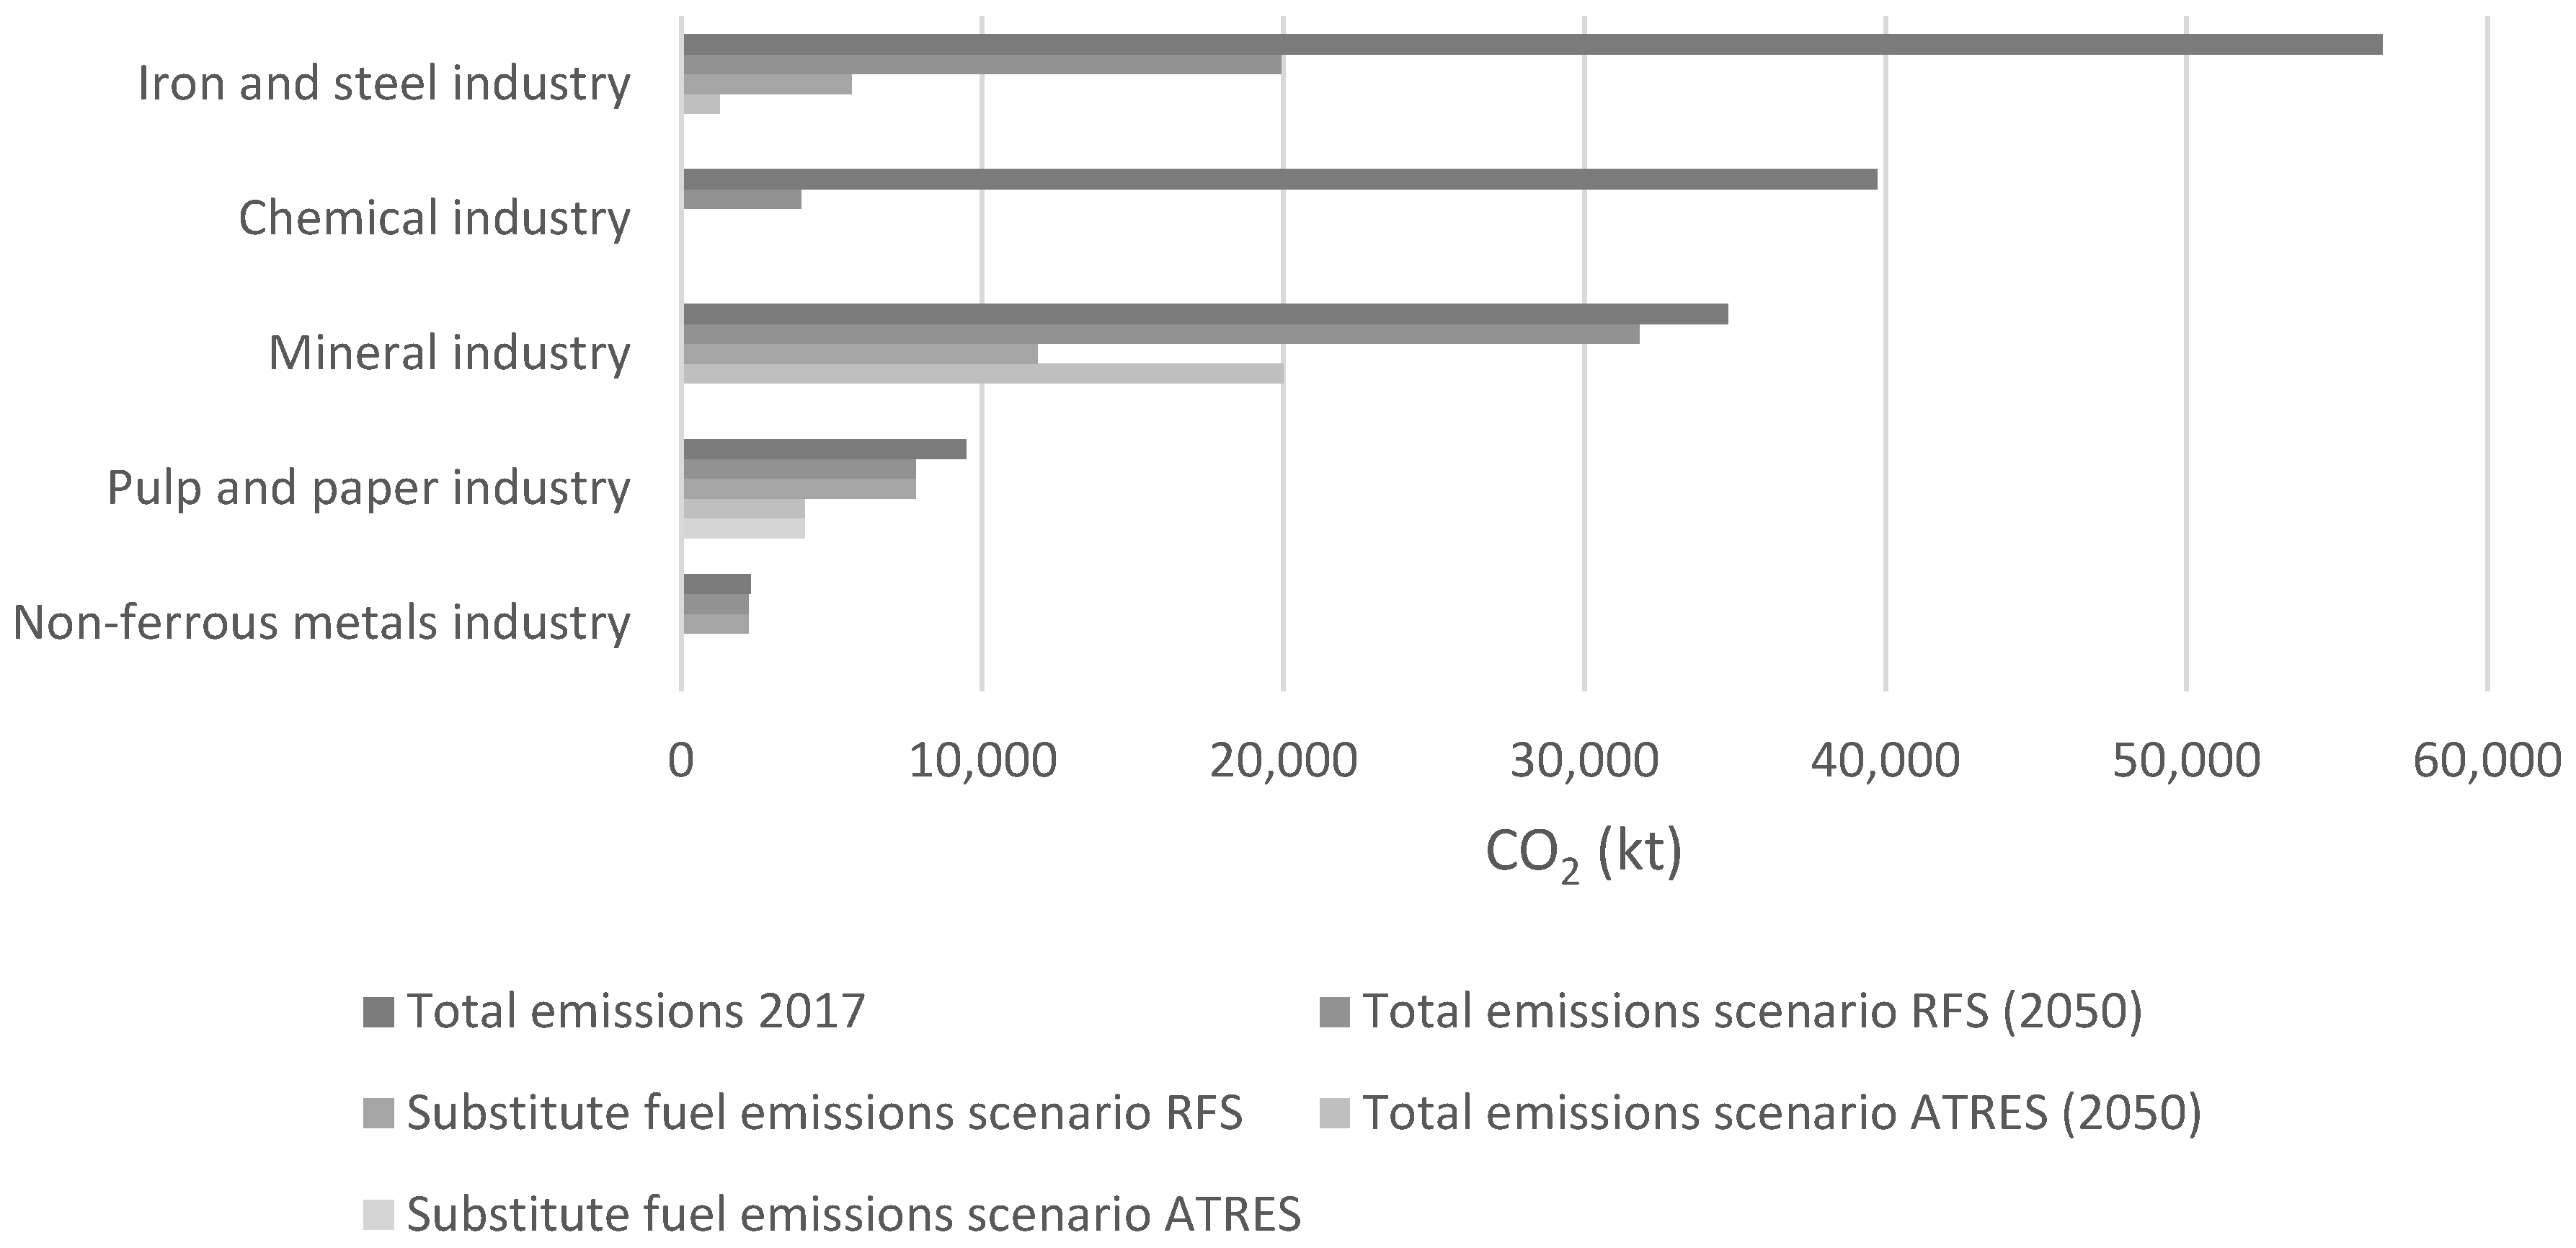
2017: the overall CO
2 emissions of the analyzed industrial sectors amount to approx. 143 Mt CO
2 in 2017. The largest proportion of 56.5 Mt CO
2 results from the iron and steel industry, followed by the chemical industry with about 40 Mt CO
2. The largest share of process-related emissions in 2017 results from the iron and steel industry, followed by the mineral industry (
Figure 13). The largest number of emitters can be found in the glass and ceramics industry and in the chemical industry; thus, the various production sites and therefore the different emitter of the glass and ceramic are relatively small. The pulp and paper industry only emit energy-related CO
2 emissions.
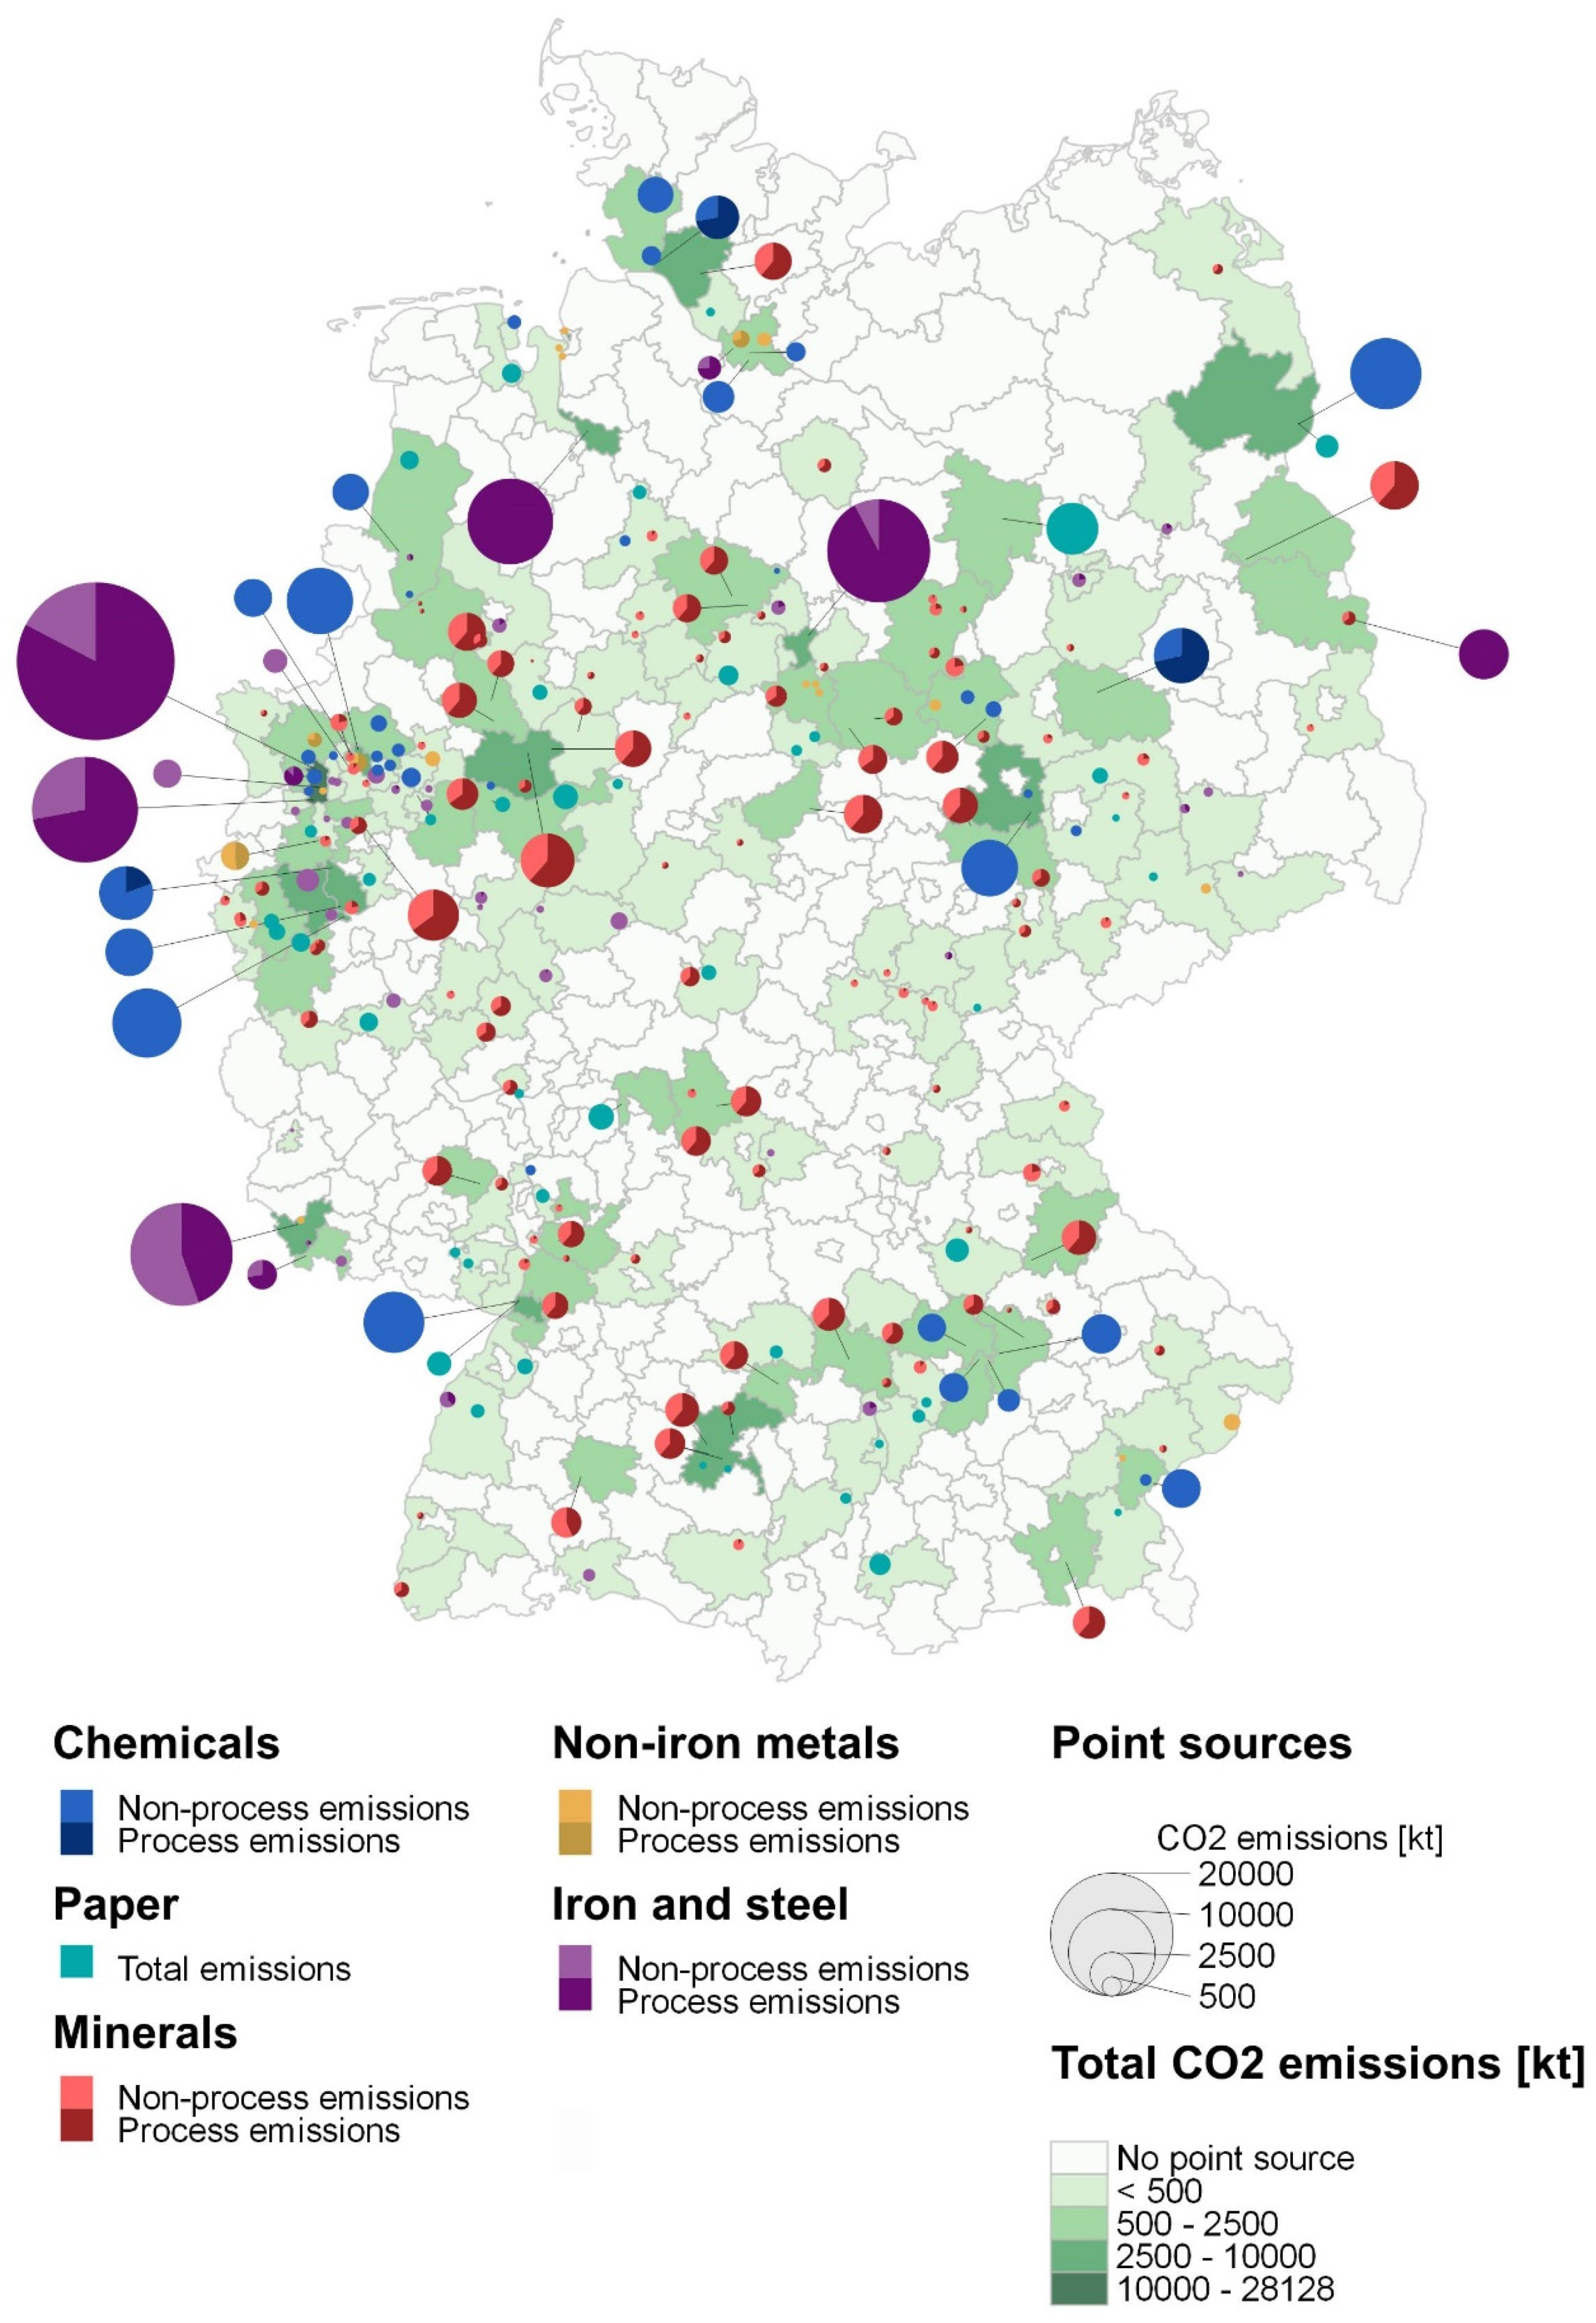
The distribution of point sources in 2017 and the potential plotted on NUTS3 level is presented in
Figure 14. An agglomeration of point sources can be seen in the Ruhr valley area. This is due to the relatively large proportion of industry (e.g., integrated steel mills and chemical parks) in this region.
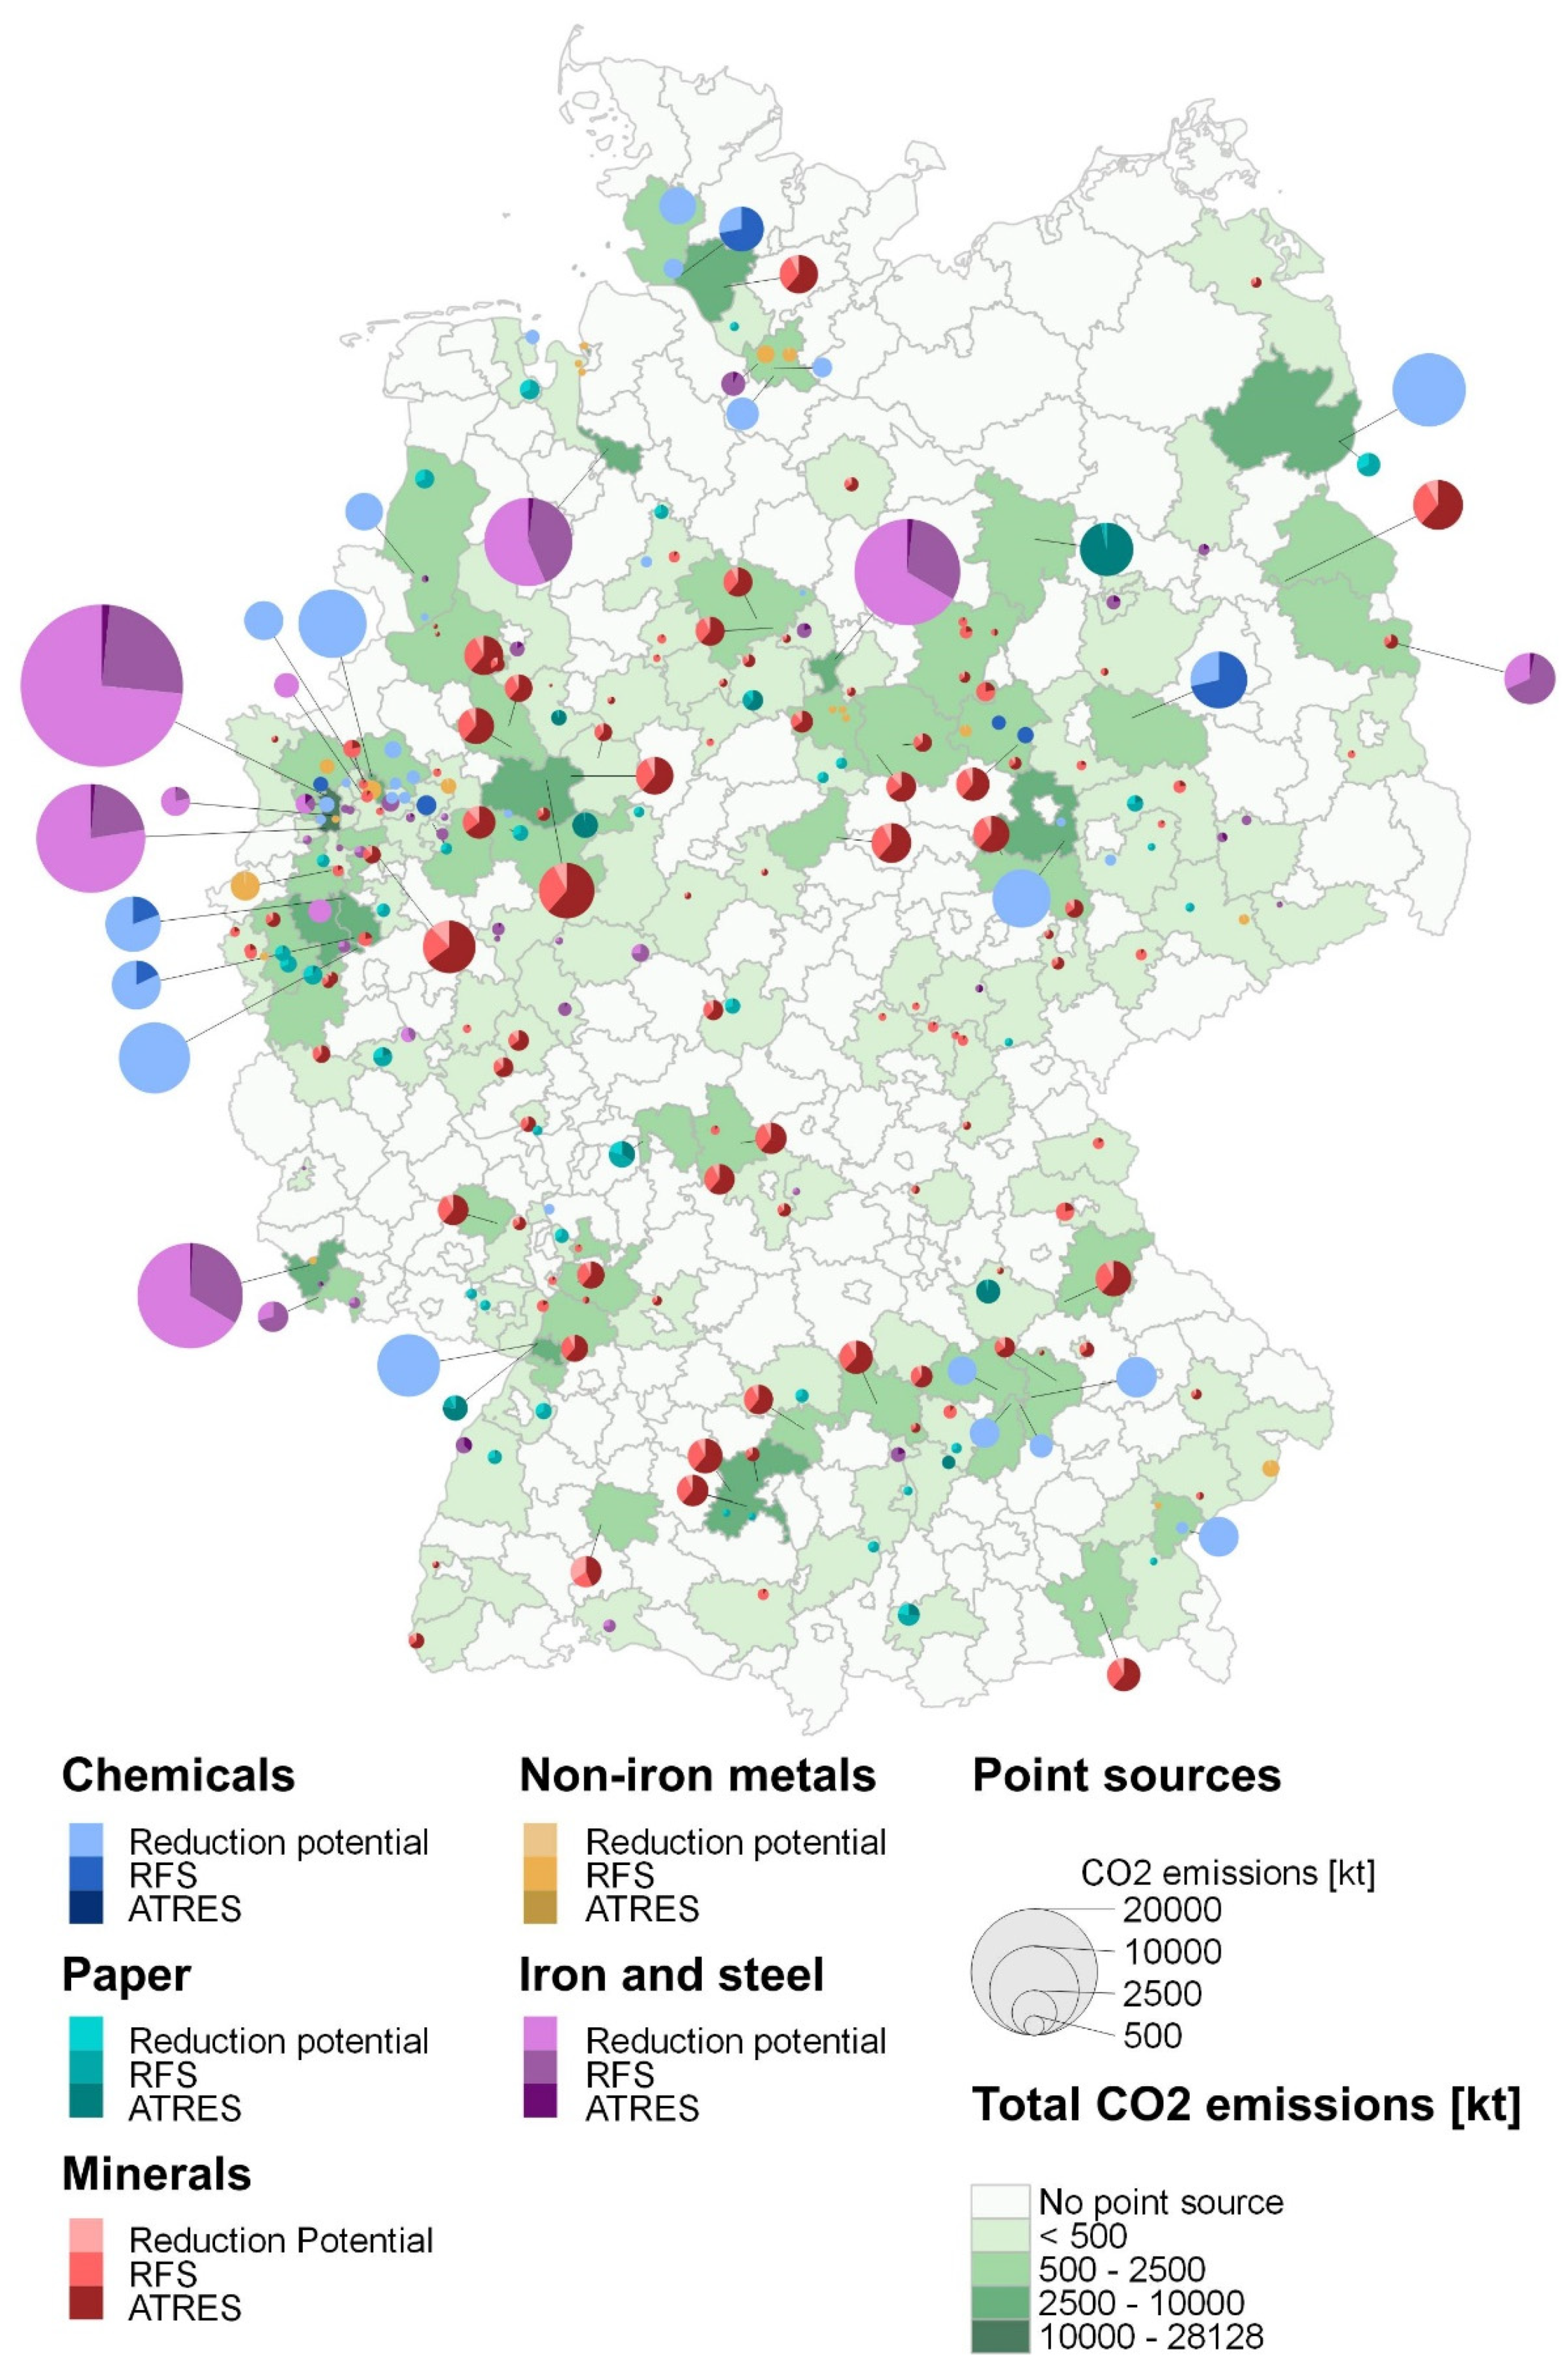
2050: the development of CO
2 emissions in the respective scenarios is given in
Figure 15 and
Figure 16. The overall emissions in 2050 can be decreased by approx. 77 Mt to 117 Mt CO
2 against the assumptions and framework made in this study. Scenario RFS shows a great proportion of biogenic CO
2 in 2050 due to the assumed extensive use of “renewable” methane for heat supply (
Figure 16). The decrease in CO
2 emissions is particularly evident in scenario ATRES. In the mineral as well as pulp and paper industries, emissions will be reduced by about half compared to 2017, while in the iron and steel and non-ferrous industries, they will be almost completely reduced.
Figure 15 shows the remaining CO
2 sources in 2050 if scenario ATRES is applied. The map shows a significant decrease in emissions if in 2050 the corresponding alternative technologies with a high CO
2 saving potential are fully implemented. The most significant reduction in potential point sources is in the chemical industry. The number of plants that will still be emitting CO
2 in 2050, if the corresponding technologies are applied on a large-scale, is small compared to the initial situation in 2017 (
Figure 15)
The potential to reduce or completely avoid these process-related emissions in the (near) future varies greatly by sector. Emissions from the mineral processing industry are currently difficult to reduce because there are no appropriate alternatives. In other industries, such as iron and steel production, technologies are already available, but not yet implemented on a large scale. In aluminum manufacturing, there are alternative production technologies that, however, do not yet go beyond the research and development status. Some of these technologies have been a subject of research for a very long time, without getting closer to any market launch.
In general, process-related emissions from all considered sectors might be reducible in the long-term perspective besides the mineral processing industry, especially the various applications of limestone, glass and ceramics.
Based on the results of the TRL and market penetration level of the respective alternative technologies it can be assumed that process-related CO2 from the mineral sector will be available as feedstock in the long term. If biomass is implemented in the production of crude iron and steel (reduction agent, electrode material) as well as for the anode manufacturing in the aluminum industry these CO2 emissions will also be available in the long term. If only hydrogen is used as a reduction agent, CO2 from blast furnaces and iron sponge production will not be available in the future.
8.2. Comparison and Analysis of Results
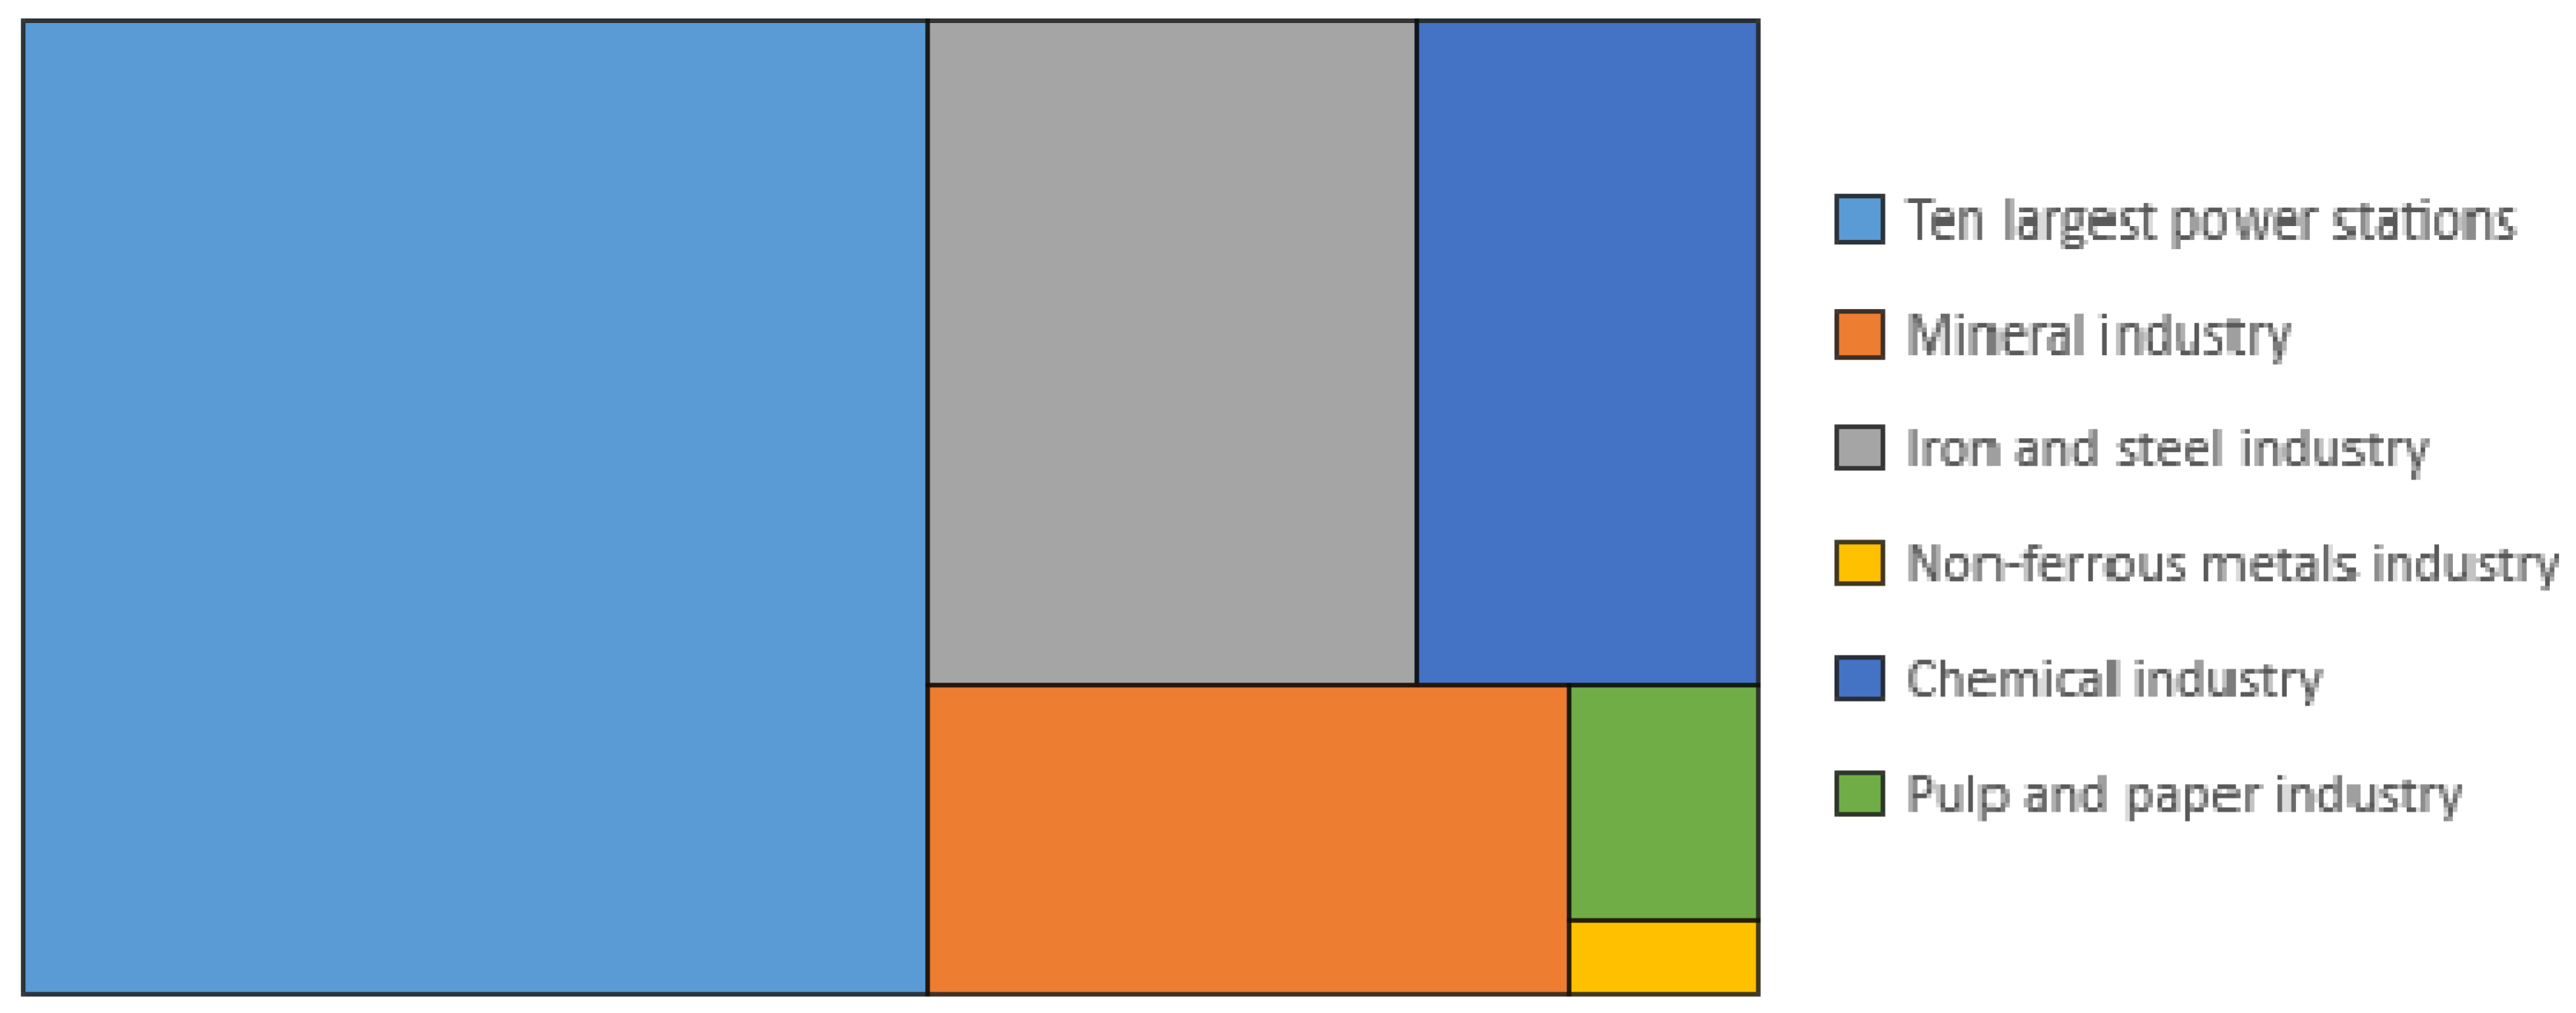
In order to give a classification of the achieved results in comparison to other CO
2 emitters in Germany,
Figure 17 shows the ratios of the amount of CO
2 emitted by the industries analyzed in 2017 compared to the amount of CO
2 emitted by the 10 largest German power plants in 2017 [
7]. The total amount of CO
2 from power generation in these power plants is in the same order of magnitude as the emissions of the entire industrial sectors analyzed. It becomes apparent that CO
2 from the energy provision dominates the total German emissions. However, it also becomes obvious that CO
2 from the iron and steel industry has the greatest proportion compared to the other analyzed industries. The contribution of the non-ferrous metals industry is relatively small.
The analysis and development of industrial CO
2 emissions was also addressed in other studies. The study CO
2 sources for PtX production in Germany [
3] also gives an outlook on the expected CO
2 emissions in 2050, assuming a 95% reduction compared to 1990. The results show remaining CO
2 emissions of 10 Mt for the cement production and 4.5 Mt CO
2 emitted by the limestone and quicklime sector. The overall process-related emissions will decrease from 52 Mt in 2020 to 5 Mt in 2050 assuming an extensive application of carbon capture and storage (CCS). Metal production and processing is not considered a prioritized source of CO
2 in 2050. The chemical industry shows CO
2 emissions of 20 Mt in 2050 by the use of biomass for heat provision. In comparison, the results of this work show remaining emissions in cement production of 13.4 Mt to 20.2 Mt CO
2, depending on the applied scenario. Emissions from the limestone industry range from 8 Mt to approx. 6 Mt CO
2 in 2050. One possible explanation for the large deviation is the use of CCS in the study.
The economic aspects of CO
2 capture and utilization were not part of the scope here. Nevertheless, they have a great influence on the future situation, especially against the background of the progressive results of the scenario ATRES. It is highly uncertain whether and to what extent the alternative technologies discussed will be used by 2050. This is particularly critical against the background of the massive need for investment in the individual sectors. However, the study Climate neutral industry [
16] shows that the investment requirements in the iron and steel (53% of blast furnace capacity), chemical (59% of steam cracker capacity) and cement industries (30% of the cement kiln capacity) in the years up to 2030 are high due to plant renewal, and therefore offer a certain chance of implementing these technologies. Therefore, a more detailed study of the economic aspects would be helpful in the future.
Assorting the location of the various CO2 sources provides the basis for determining the potential of the raw material CO2. Thus, the results for the site selection of Power-to-X plants, which require CO2 as a raw material, can be used as a basis for the determination of the potential for the raw material CO2.


