Applications of Geophysical Logs to Coal Mining—Some Illustrative Examples


CSIRO Mineral Resources, PO Box 883, Kenmore, QLD 4069, Australia
*
Author to whom correspondence should be addressed.
Resources 2020, 9(2), 11; https://doi.org/10.3390/resources9020011
Submission received: 5 December 2019
/
Revised: 10 January 2020
/
Accepted: 20 January 2020
/
Published: 22 January 2020
(This article belongs to the Special Issue Advances in Mining Technology: The Digital Mine)
Abstract
:Geophysical logs can be used not only for qualitative interpretation such as strata correlation but also for geotechnical assessment through quantitative data analysis. In an emerging digital mining age, such a use of geophysical logs helps to establish reliable geological and geotechnical models, which reduces safety and financial risks due to geological and geotechnical uncertainty for new and existing coal mining projects. This paper presents some examples of geological and geotechnical characterizations from geophysical logs at various coal mines in Australia and India. The applications include rock strength and coal quality estimations, automated lithological/geotechnical interpretation and geophysical strata rating, all based on geophysical logs. These derived parameters could provide input to modelling, control, even ‘digital twin’ generation in a form of geological and geotechnical models as part of the future digital mining. The outcomes can be visualized in 3D space and used for identifying the key geotechnical strata units that are responsible for caving behaviors during longwall mining. This could assist site geologists and planning and production engineers predict and manage mining conditions on an ongoing basis. Both conventional logs such as density, natural gamma and sonic and less common logging data, such as full waveform sonic, televiewer and SIROLOG spectrometric natural gamma logging data are examined for their potential applications. The geotechnical strata classification and rock strengths predicted from the geophysical logs match the laboratory tests, drill core geotechnical strata classification, core photos and the mining condition/behavior observed. These illustrate the usefulness and effectiveness of using geophysical logs for geological and geotechnical characterizations.
1. Introduction
Geophysical borehole logging can play an important role in the digital mining age as it can help to establish reliable geological and geotechnical models required for safe and productive mining operations. Unexpected geological and geotechnical mining conditions have resulted in significant loss of production in some mines in Australia and other countries. In general, geotechnical data are obtained by analyzing drill cores and cuttings from boreholes. However, coring is expensive and in many cases the core cannot be fully recovered. In such cases, geophysical logging could be an alternative way to provide the required information from non-cored boreholes. This provides for either the substitution of diamond drilling or the extension of drilling programs within the same budget, based on the fact that non-cored holes are cheaper to drill.
Geophysical borehole logging, which consists of measuring various in-situ petrophysical parameters such as the acoustic, radiometric and electric properties of the rocks down boreholes, is carried out routinely at coal mines. The logs provide a rich source of rock property information and can be used for qualitative interpretation such as picking coal seams from density log and strata correlation [1,2,3], in addition to litho-stratigraphic interpretation [4,5], orebody delineation and grade estimation [6,7] and geotechnical and rock mass characterization [8,9,10,11,12,13,14,15].
In this paper, we will demonstrate various applications of geophysical logs such as the estimation of the strength of intact rock or the unconfined (or uniaxial) compressive strength (UCS), geophysical strata rating and coal quality parameters. These derived parameters could provide input to modelling, control, even ‘digital twin’ generation in a form of geological and geotechnical models as part of the future digital mining. Both conventional logs such as density, natural gamma and sonic and less common logging data such as full waveform sonic, televiewer and the SIROLOG spectrometric natural gamma logging data are examined for different applications. The examples used in this paper are derived directly from research conducted in Australia and India by the authors and their collaborators.
2. Geotechnical Characterization from Geophysical Logs
Geotechnical assessments such as rock strength estimation and rock mass characterization are the most attractive applications of geophysical logs as it is critically important to have a proper understanding and accurate estimation of the strength and characteristics of the various rock types present for coal mine design and production. Rock strength properties are often affected by, for example, porosity, mineral bonding type, quality of the solid particles, the internal structure of the rock skeleton and water content [16]. The complexity of rock strength influences and dependencies makes the estimation of rock strength difficult. Rock strength can be determined in various ways but most approaches require an understanding of the properties of the intact rock and of the defects within it. Geophysical logs can be used to estimate both of these properties, which will be illustrated in this section.
2.1. Sonic Log and Uniaxial Compressive Strength
2.1.1. UCS Estimation from Acoustic Logs–the McNally Method
Uniaxial Compressive Strength (UCS) is one of the very important parameters for ground control design in longwall mining. It has long been recognised that seismic velocity has a relationship with rock strength UCS [16]—a linear regression equation; a polynomial equation or a logarithmic relationship. For this rock strength estimation, sonic logs are more useful parameters than neutron, gamma ray and density logs [8]. McNally [8] proposed an exponential relationship between the UCS and the sonic log. The McNally method for UCS estimation from the sonic log is widely accepted as a conventional approach in the Australian coal industry. The general expression for UCS in the coal measures of the Sydney and Bowen basins, derived by McNally [8] is:
where Δt is the sonic transit time (P-wave) measured in microseconds per foot (μs/ft) and the UCS is in mega Pascals (MPa). This relationship was established on the basis of UCS test results on 1004 core samples from 40 boreholes.
The McNally method is an empirical first order estimate of rock UCS. It often has a broad data scatter and a high uncertainty in derived relationships due to the fundamental difference between static (UCS) and dynamic (sonic log or the seismic velocity) [12,16]. At many mines, it has been found that a local relationship is required to enable UCS to be estimated with sufficient accuracy or as an alternative approach, a UCS/sonic transit time correlation based on lithological variations should be used [17]. For example, the German Creek Mine in Queensland, Australia, derived their own local formula [18]
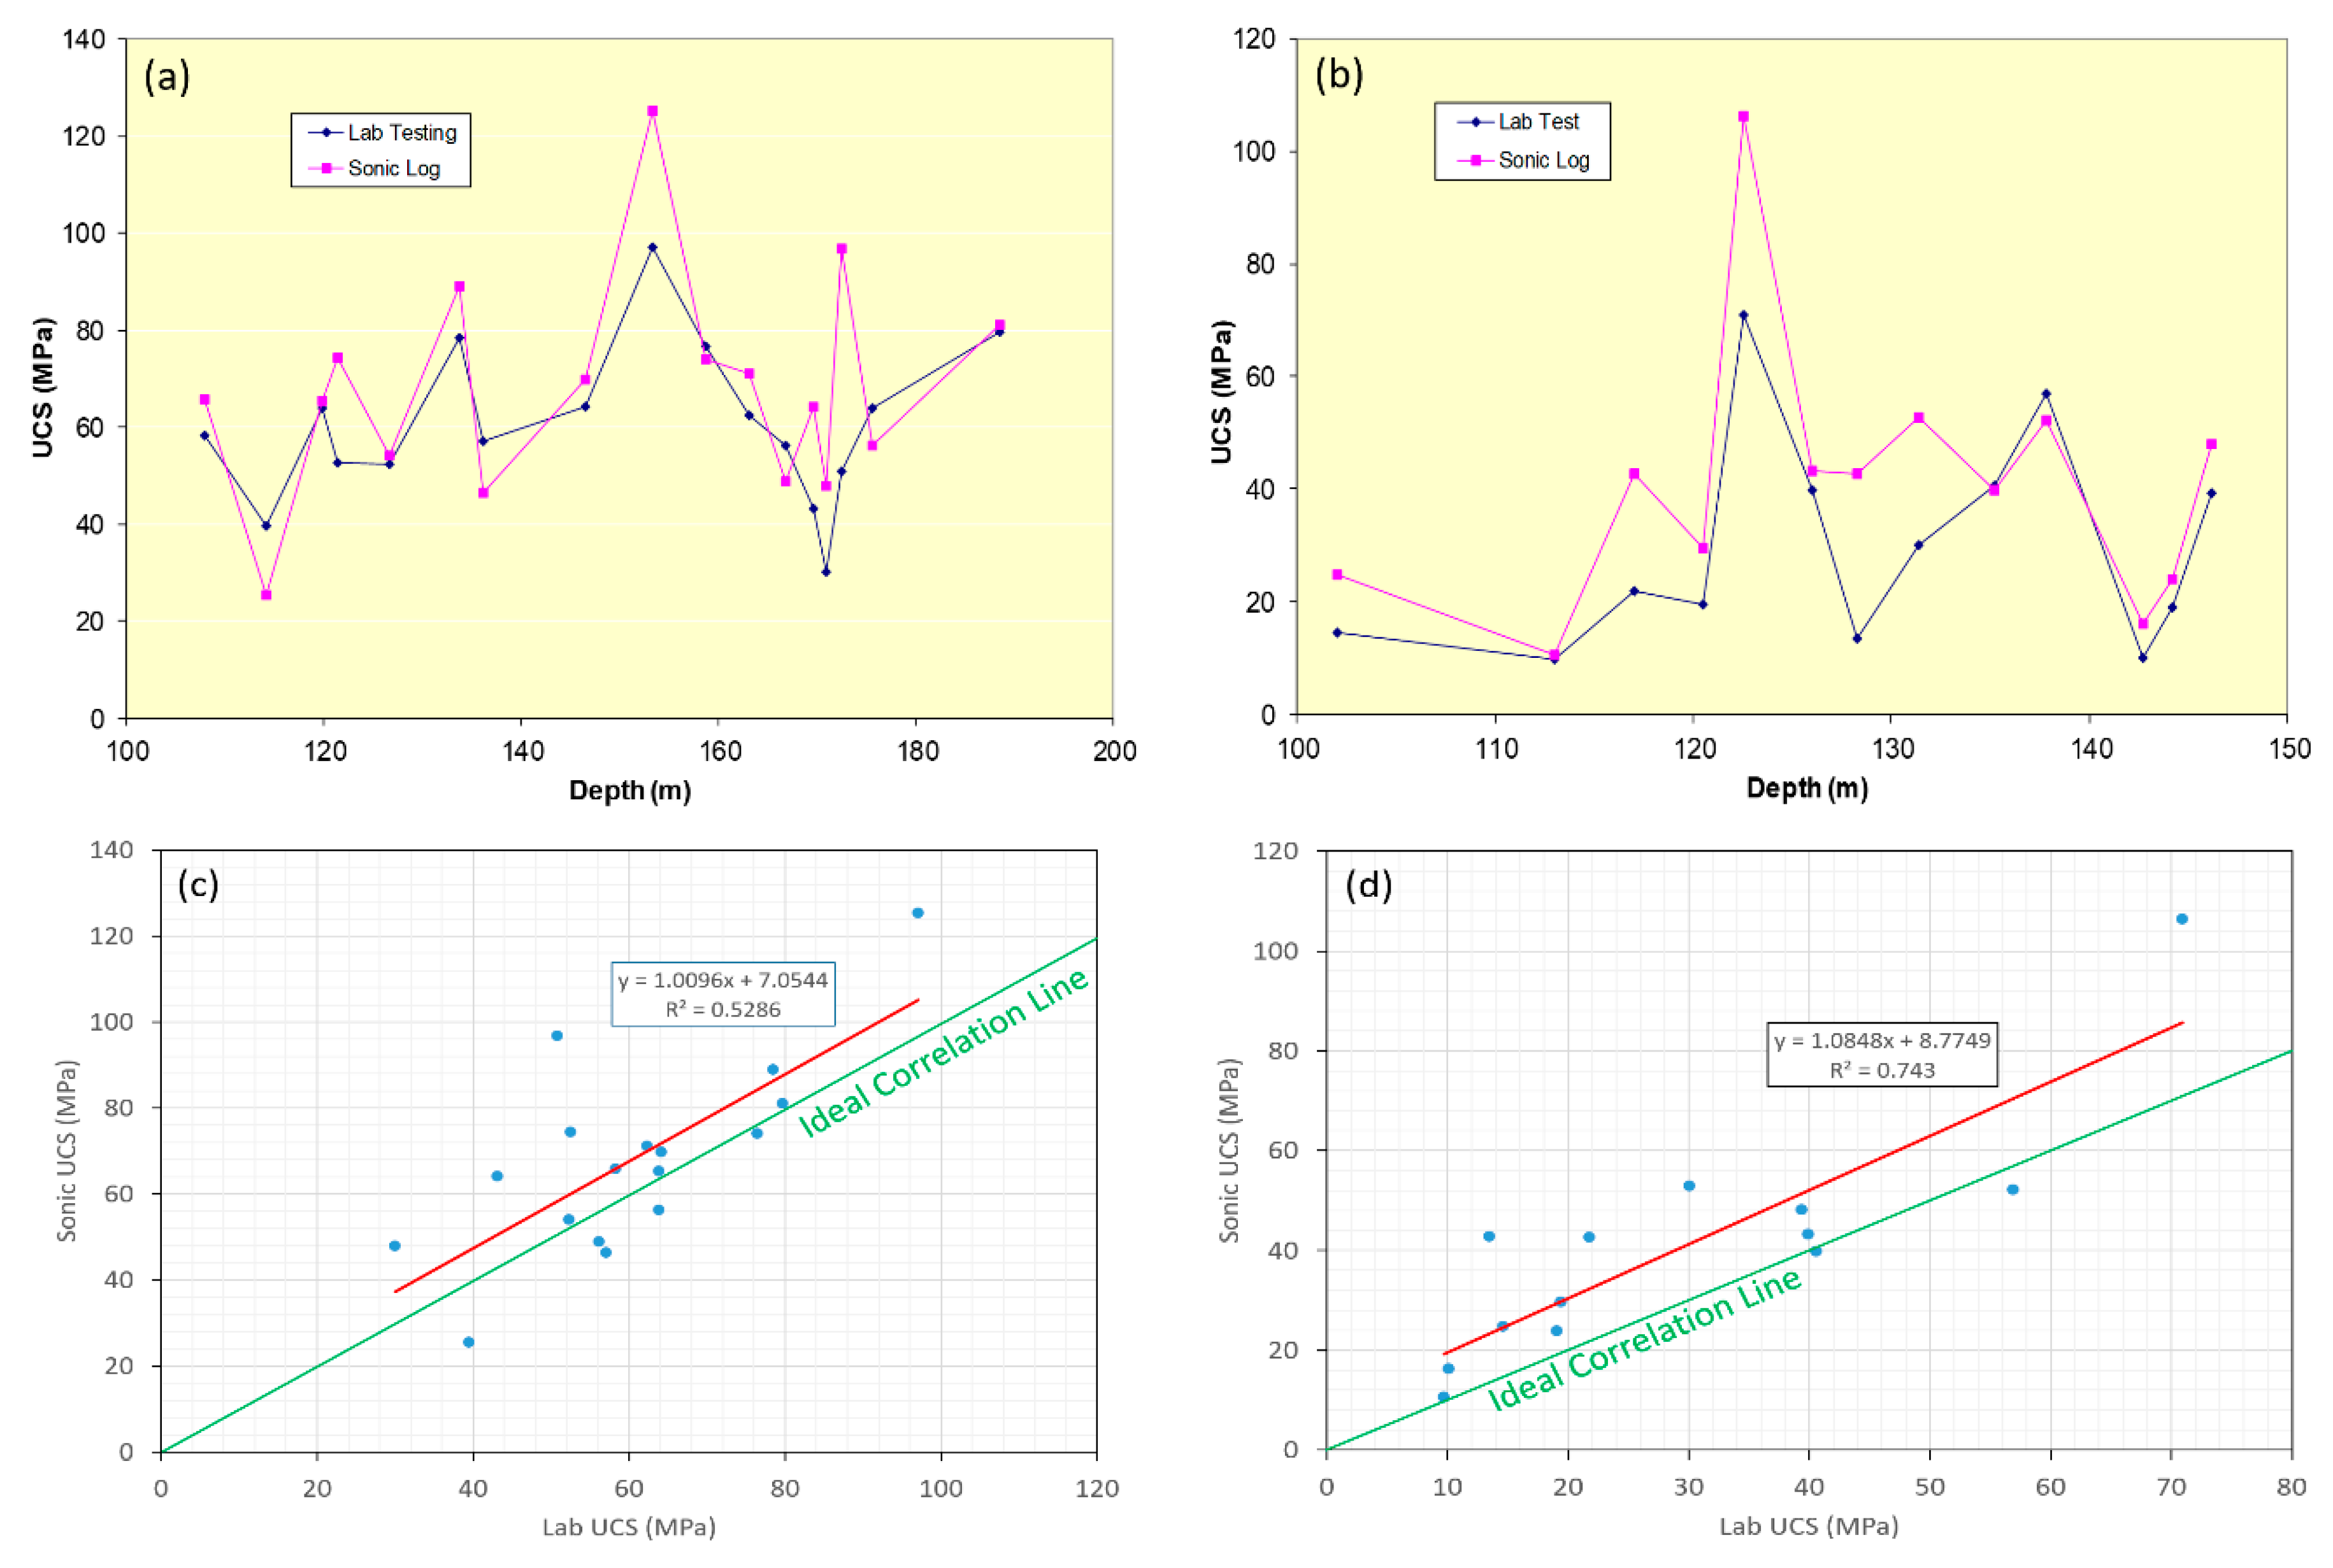
where the UCS is in MPa while the sonic log transit time Δt is measured in μs/ft. We computed the UCS from the sonic log using this formula and compared the results with those from laboratory UCS tests (Figure 1) for two boreholes DD412 and DD0403 at Southern Colliery, a mine next to the German Creek Mine. Borehole DD0412 is located in the strong roof area with UCS values generally > 50 MPa, while DD0403 is in the soft area where the UCS is generally < 40 MPa. It is evident that the UCSs derived from the sonic transit times generally match the laboratory tests although there is some scatter in the data and the estimated UCS values are slightly higher than the measured ones. We therefore have confidence in using the sonic-derived UCSs for mine design. The UCS estimated from sonic logs is one of the most widely utilized geotechnical parameters in the Australian coal mining industry, typically for evaluating the roadway roof support requirements and longwall caving behavior [19,20,21,22]. The experiences and benefits gained by the Australian coal mining industry have been adopted in other coal basins of the world to make mining safer and more productive [23,24].
2.1.2. Rock Strength Evaluation from Acoustic Scanner Logs
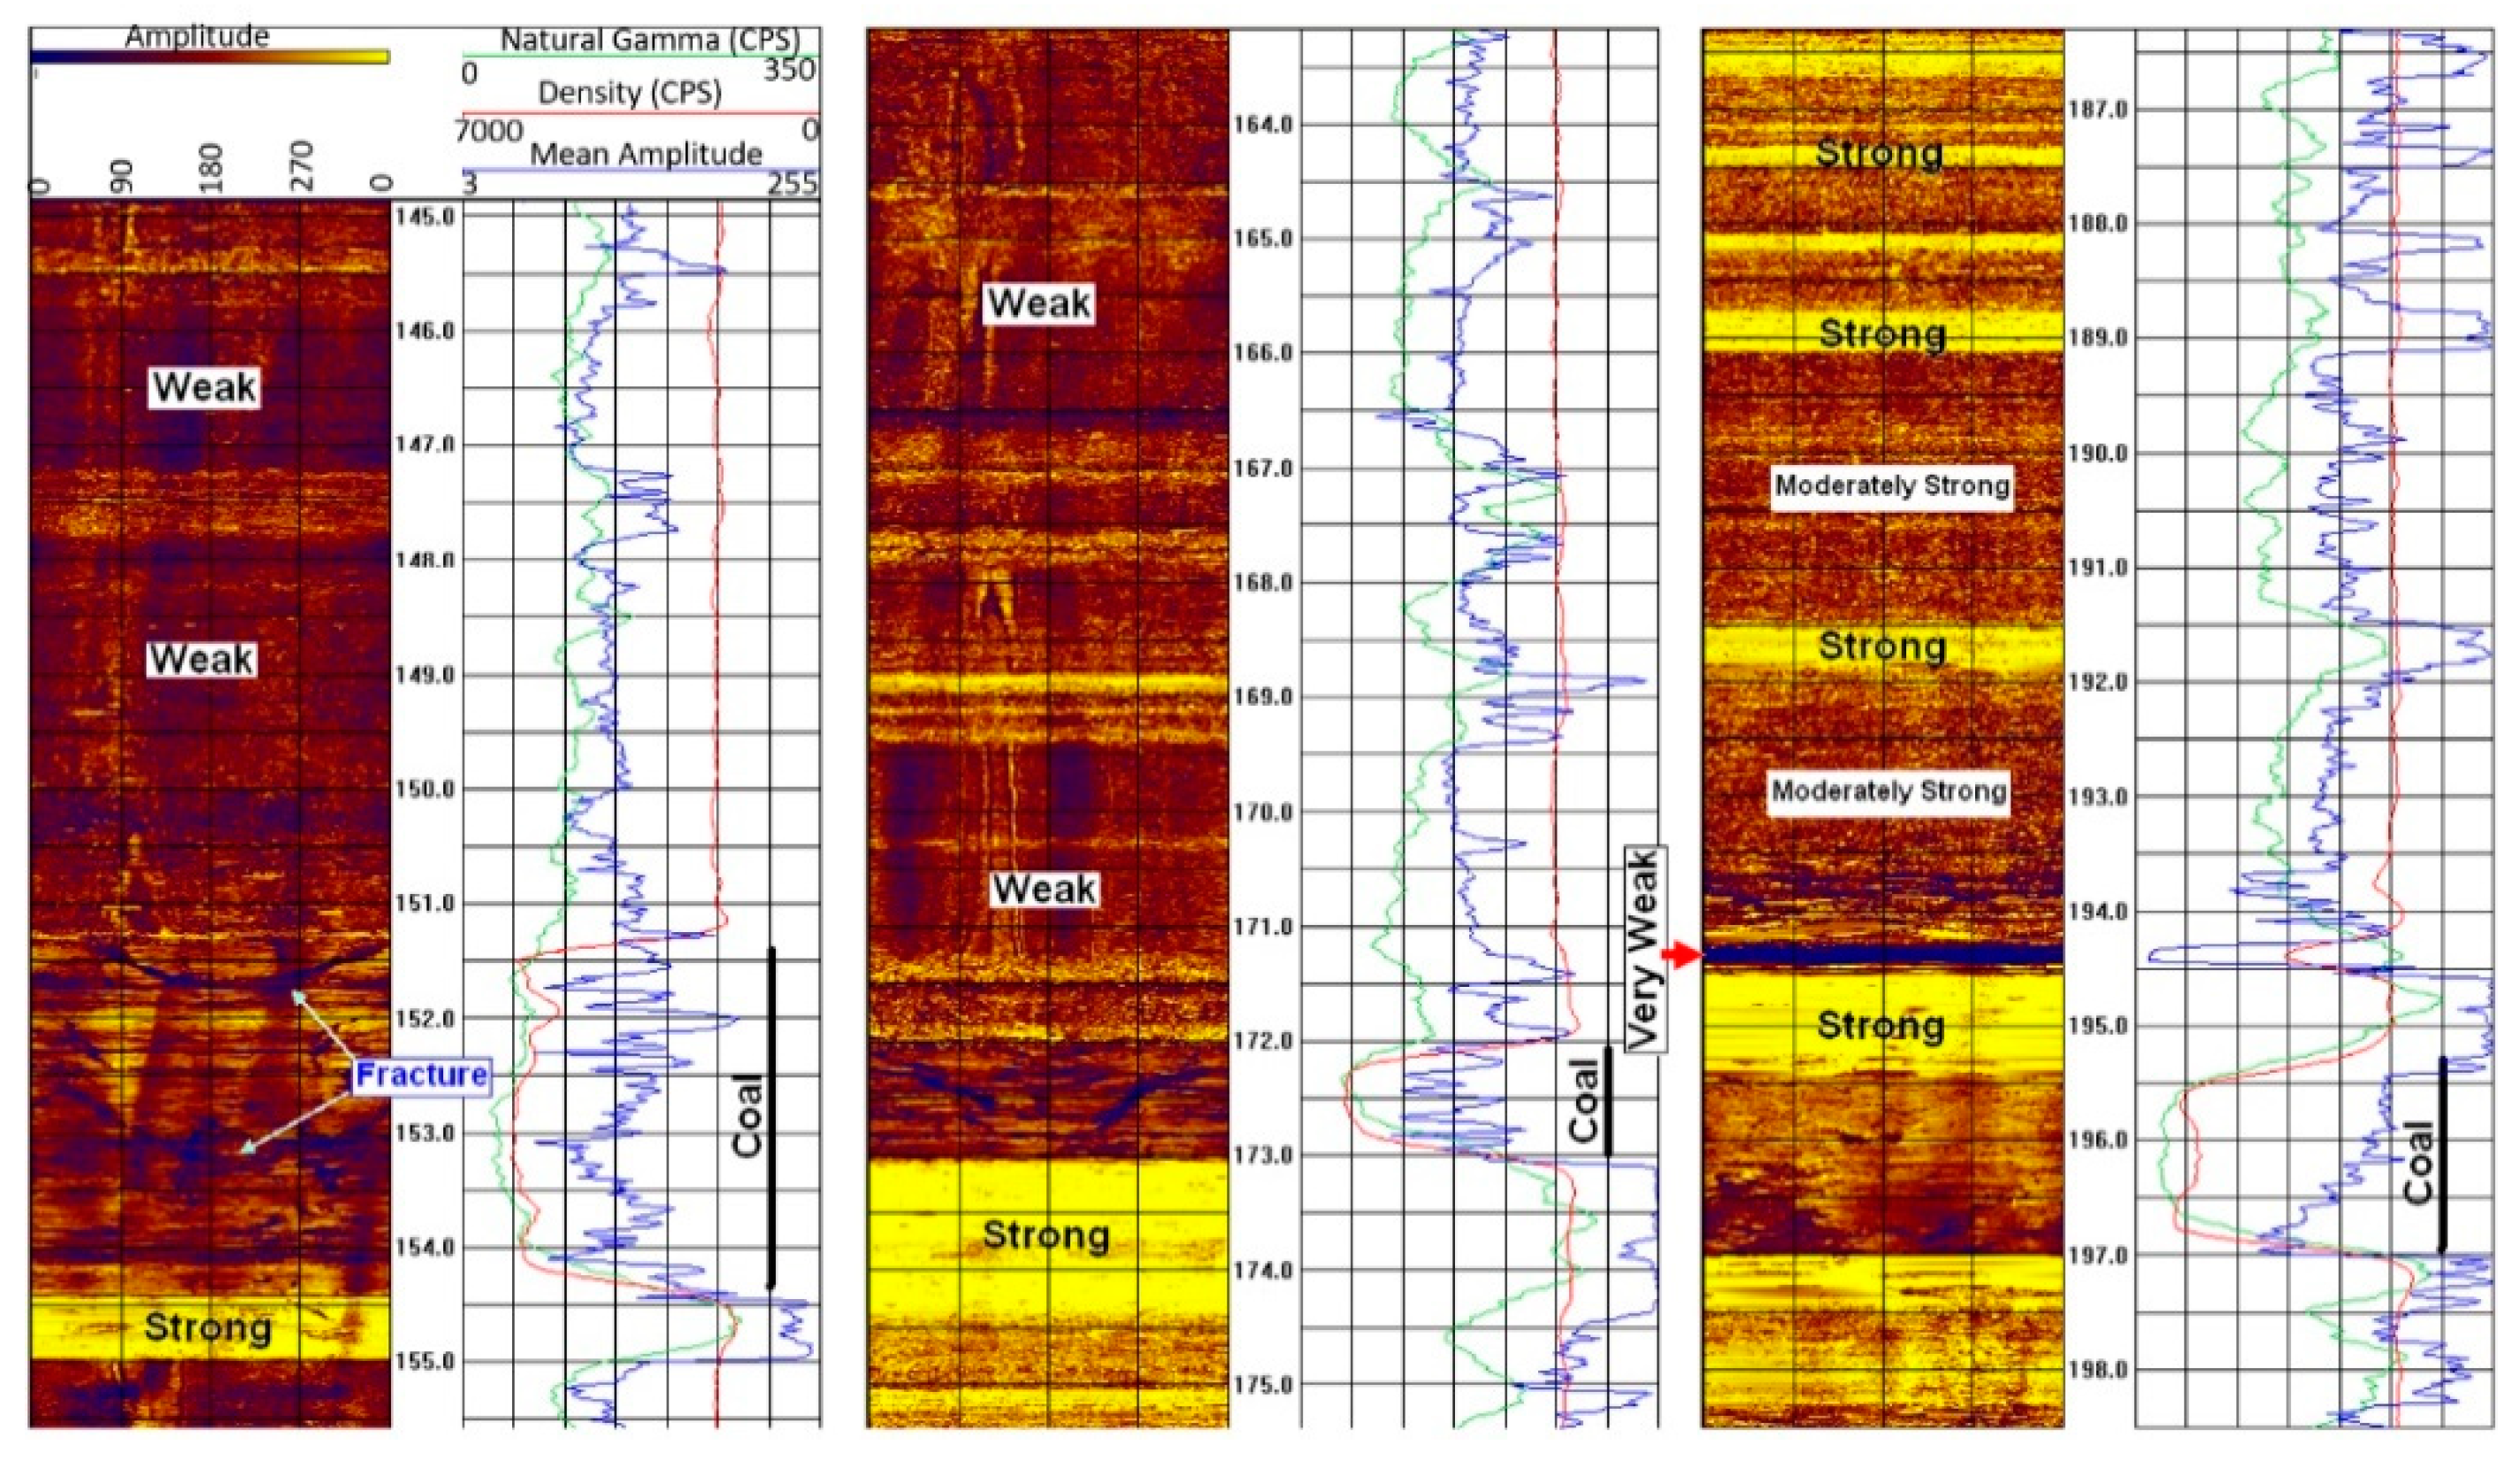
In addition to the conventional sonic logs, both full waveform sonic (FWS) and acoustic televiewer scanner images provide rich information regarding the rock strength. Acoustic teleview scanner data measure two parameters—the two-way interval transit time from the transducer to the borehole wall; and the reflected amplitude of the signal from the borehole wall. The recorded scanner amplitude measures the contrast of the acoustic impedance (the product of velocity and density) between the drilling mud and borehole wall and indicates the variation of the rock strength and rock unit boundaries. In addition, the low-amplitudes are normally associated with fractures. The usefulness of the acoustic scanner data can be easily demonstrated by the scanner amplitude image from Kakatiya Khani Coal Mine (India) borehole KTK736 in Figure 2. From this plot, we can qualitatively identify the strong (yellow), moderately strong (light brown), weak (dark-brown) and very weak (dark blue) rock units. From this, we can easily interpret the major bedding planes. We also recognize fractures and joints in the coal seams. Note that the coal has relatively high strength, similar to the weak rock units, which is consistent with the actual lab tests.
Another application of the acoustic scanner data is the determination of breakouts and in-situ stress (direction and magnitude). The principle of stress determination from borehole breakouts can be found in references [25,26]. The breakouts occur due to overstressing of the borehole wall. Borehole breakout, depending on the in-situ stress magnitude, rock strength, drilling mud weight and pore pressure, is a shear failure in the direction of the minimum horizontal (minor) stress and can be used as a high-quality indicator of stress direction. In addition, we can also estimate the stress magnitude using the Kirsch solution based on the rock strength, breakout angle and depth, pore pressure and drilling mud pressure.
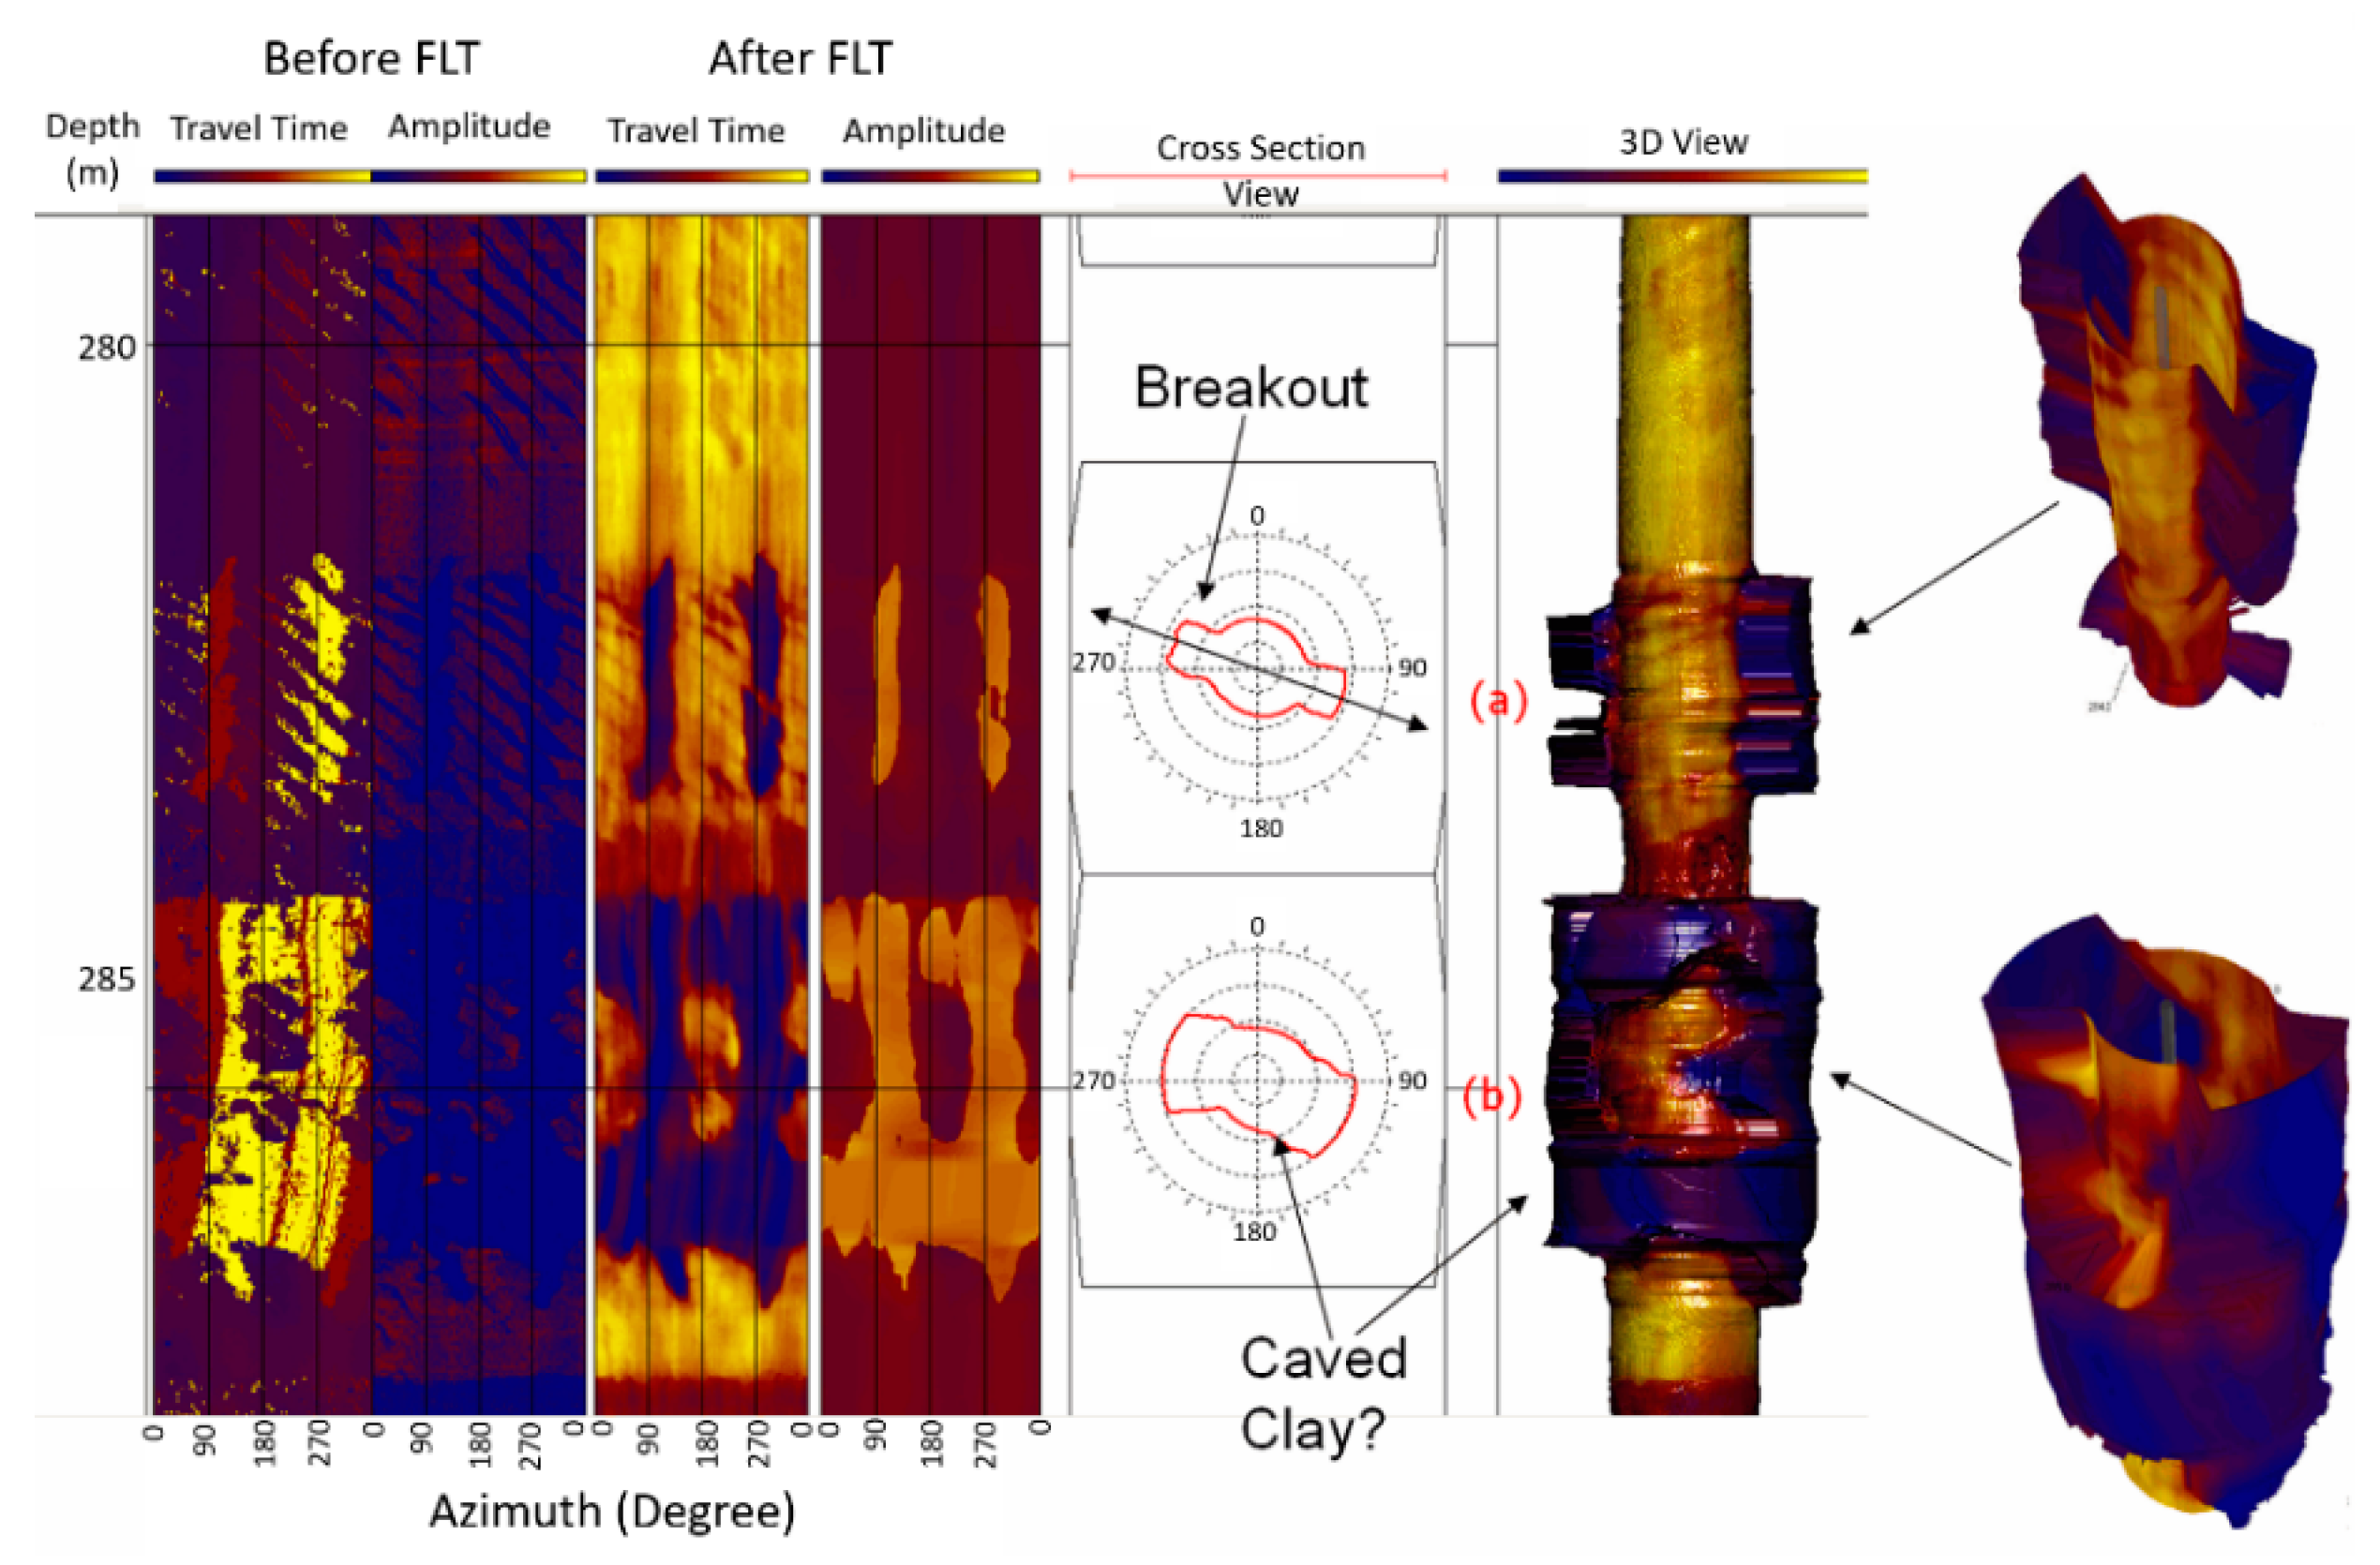
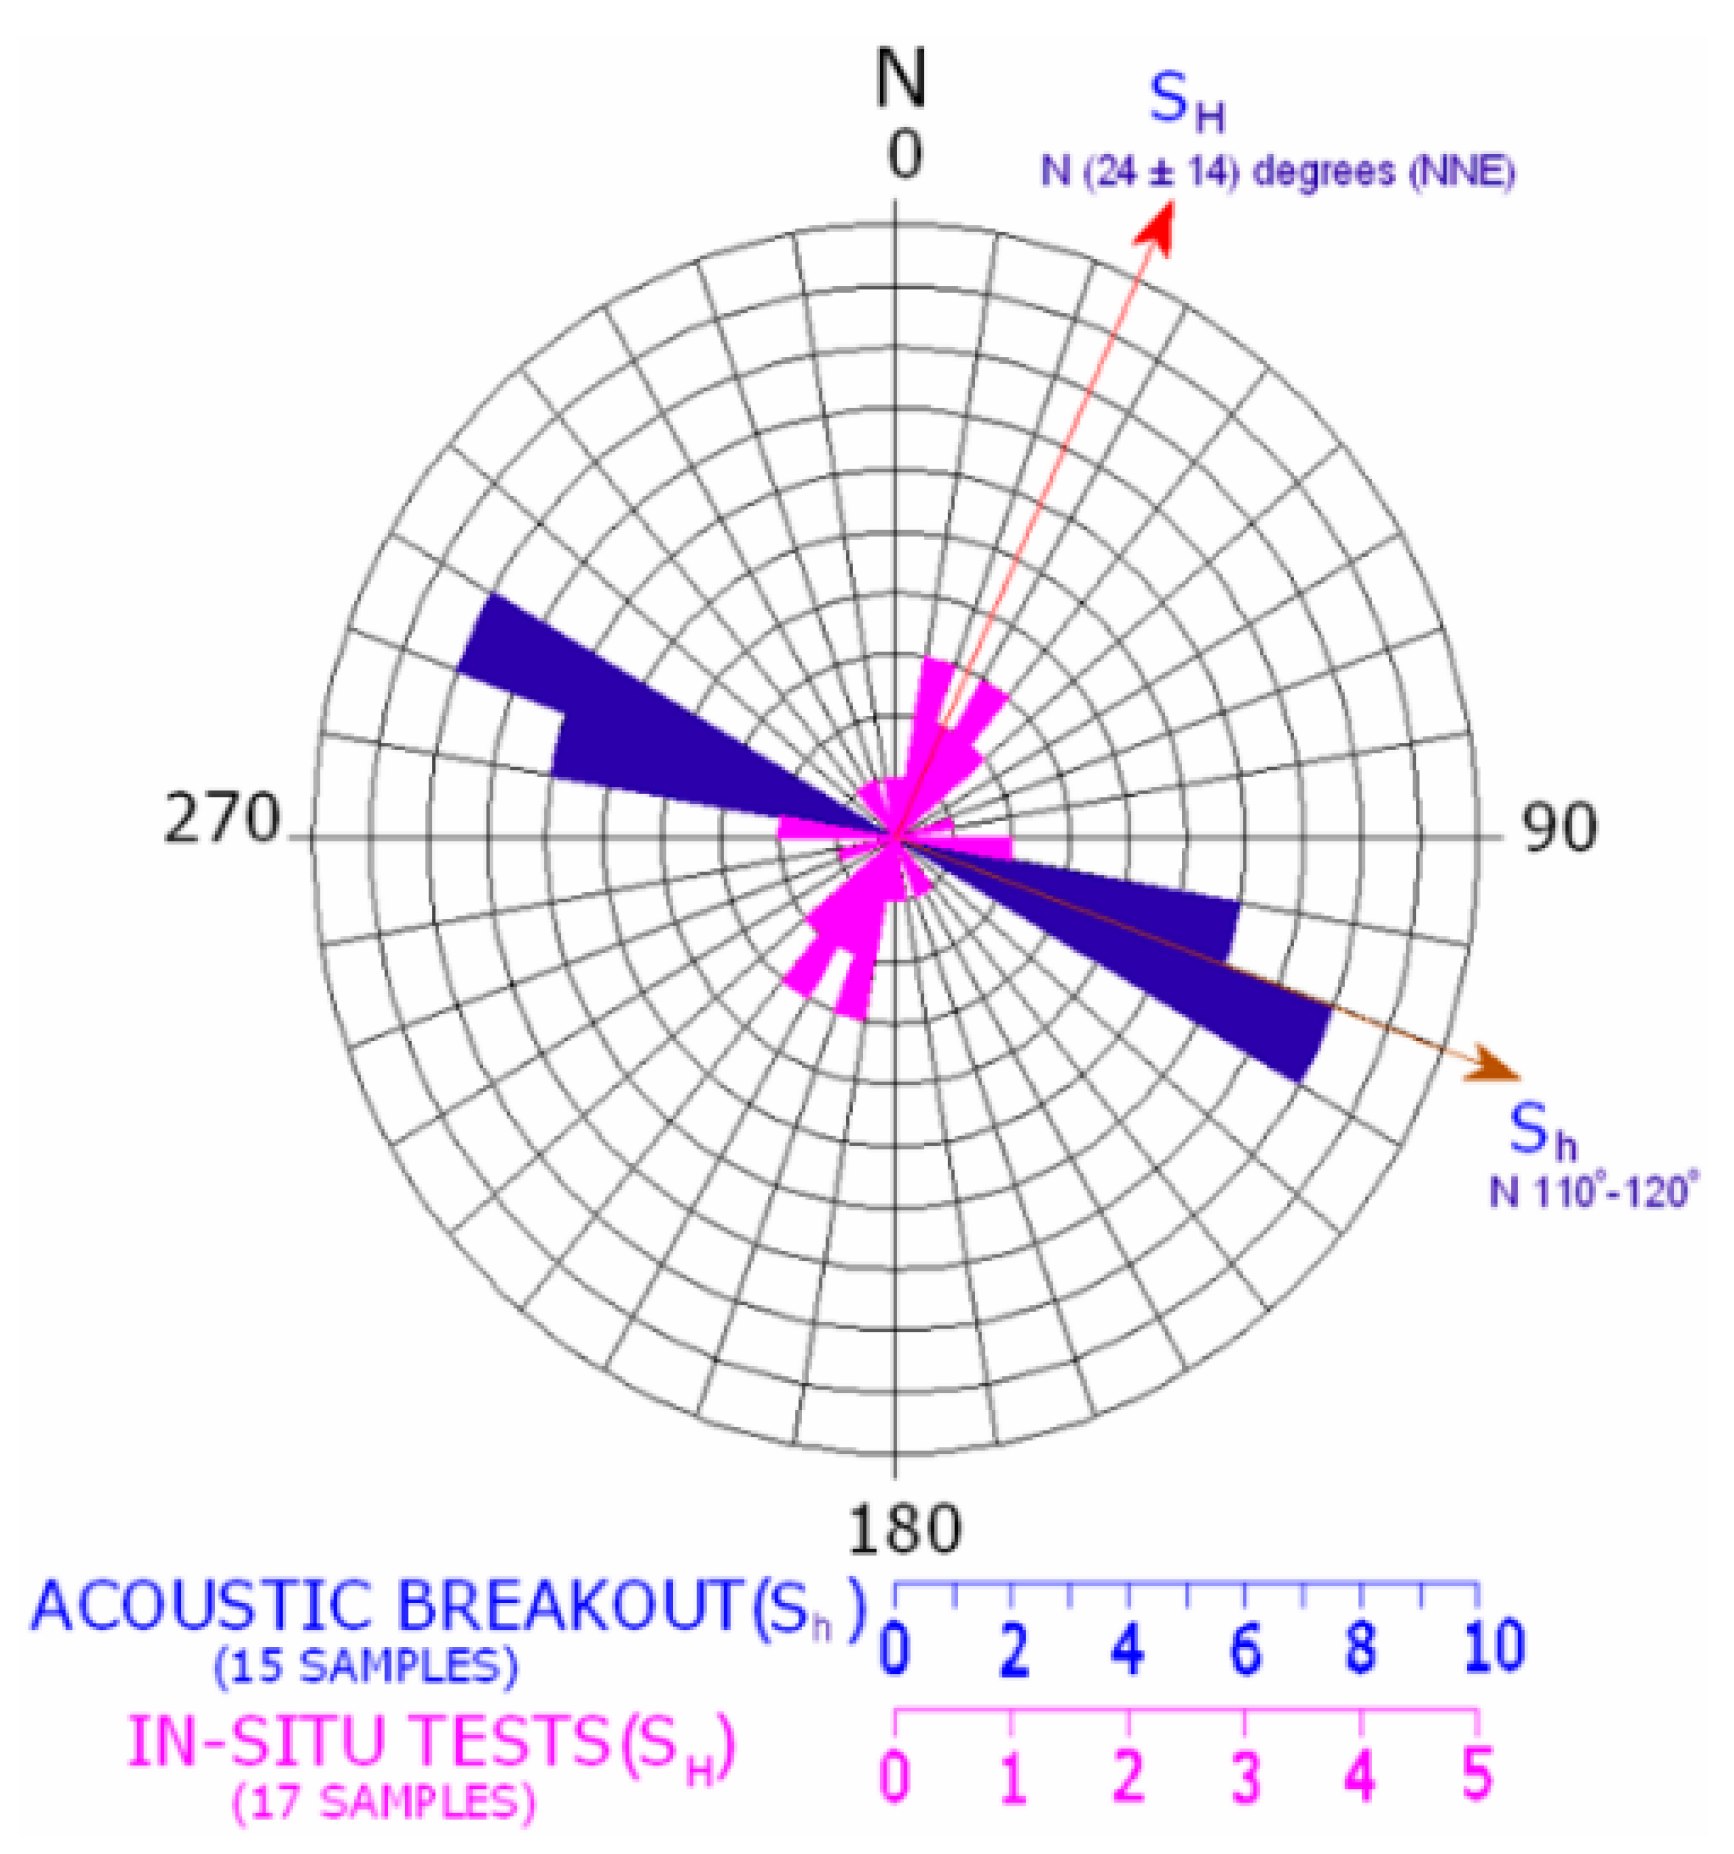
Figure 3 shows an example of breakout identification from the acoustic scanner data taken from a borehole at Adriyala Mine, India. The scanner data has suffered from cycle skip issues. This may compromise our confidence to use them for interpreting the breakouts as the shapes of the breakouts in Figure 3 are unnatural, even after the application of median filter (for removing spikes). Nevertheless, 15 consistent patterns of such breakouts, oriented in the direction of N110–120°, are identified. This is the minor horizontal stress direction and that is perpendicular to the orientation of major horizontal stress. The independent hydro-fracturing stress tests carried out at Adriyala confirmed this prediction, as shown in Figure 4.
2.1.3. Rock Integrity Assessment from Full-Waveform Sonic Data
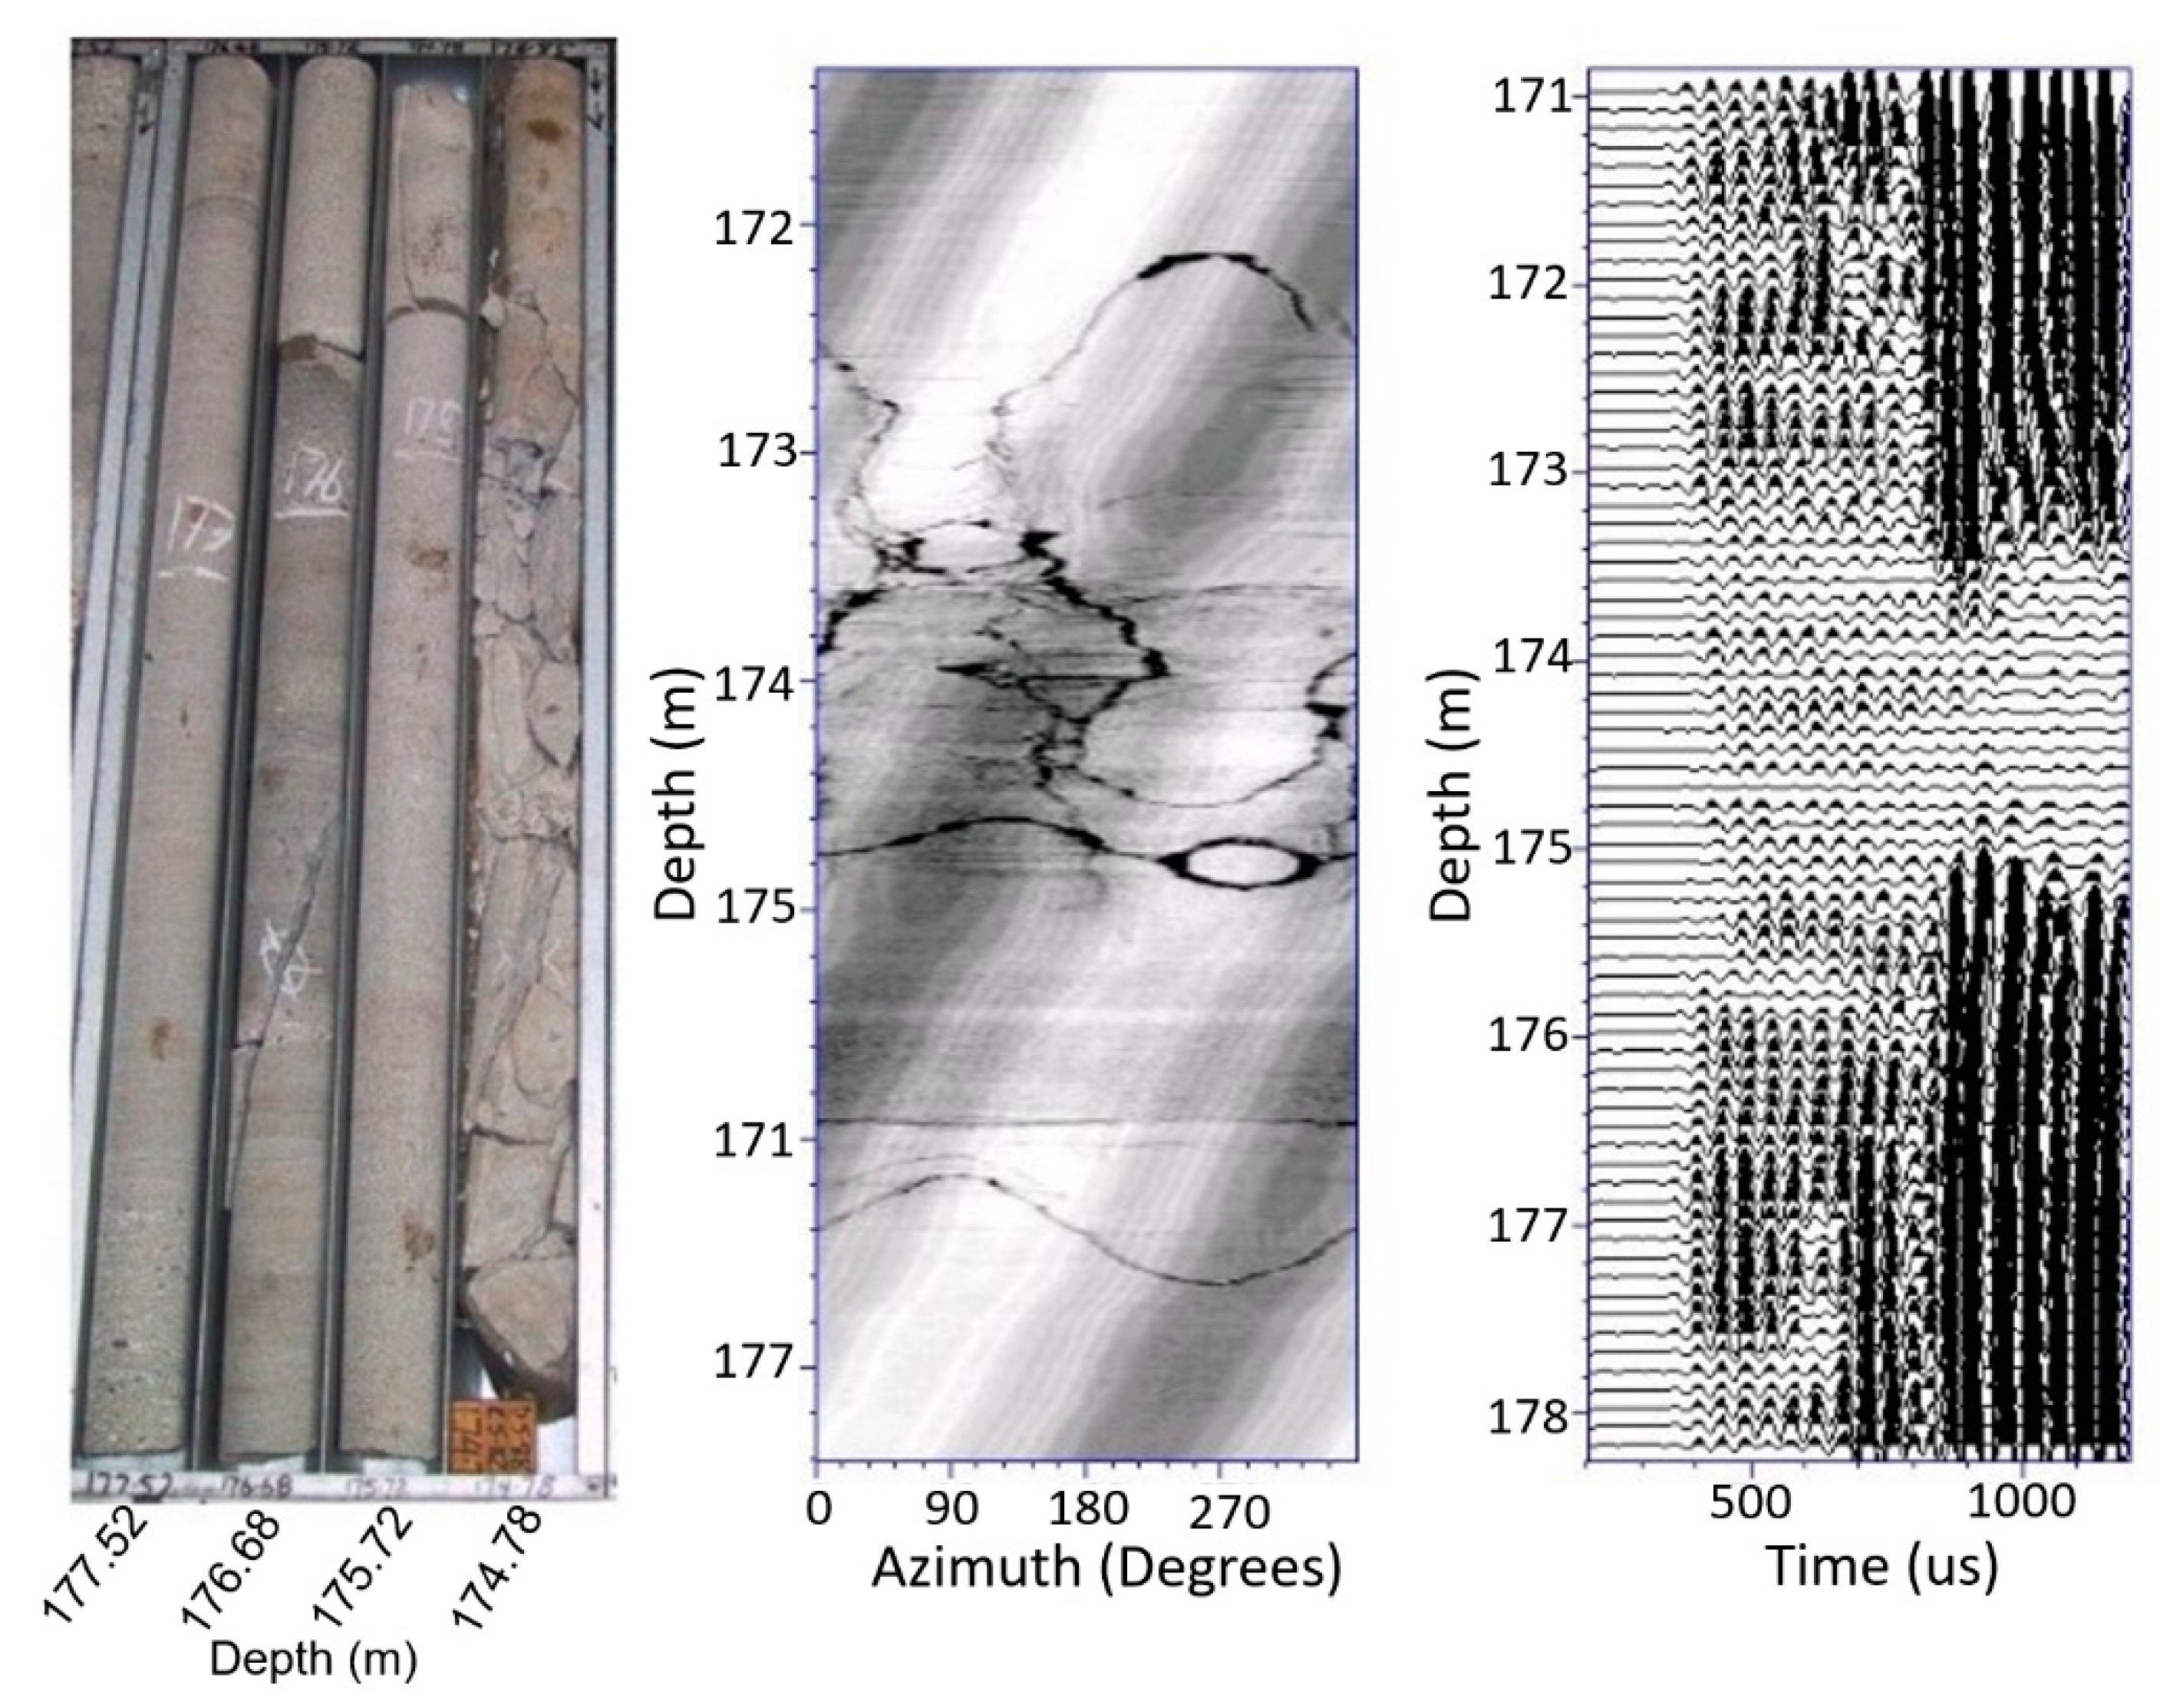
A fully cored hole from the Illawarra area, New South Wales, Australia, along with comprehensive geophysical logs, has provided a unique opportunity for the assessment of FWS data. A core photograph and corresponding acoustic scanner and FWS data are shown in Figure 5. The logs in this case were obtained by a single receiver at a separation of 4 feet (1.22 m) from the source.
The striking features of this part of the FWS log are the decline in P-wave energy between 173.2 m and 175.8 m and the loss of Stoneley wave energy between 173.5 m and 175.2 m. No S-wave is evident in this log but it is probable that interference from the tail of the P-wave event from 400 to 800 microseconds is masking the S-wave arrival.
The core photograph and the scanner image show that the zone of P-wave and Stoneley wave attenuation encompass a zone of fractured rock (sandstone) containing strong vertical fractures. Their vertical orientation presumably explains why there is no significant decline in P-wave velocity through the zone but the losses in the Stoneley-wave and S-wave are clear indicators of the presence of significant permeable fractures. Note also that neither the horizontal fracture at 175.9 m nor the dipping fracture between 176.1 m and 176.6 m, which are evident in the core and scanner image, produce attenuation anomalies on the FWS log. Similarly there is no FWS anomaly for the fracture seen on the scanner image between 172.1 m and 172.8 m.
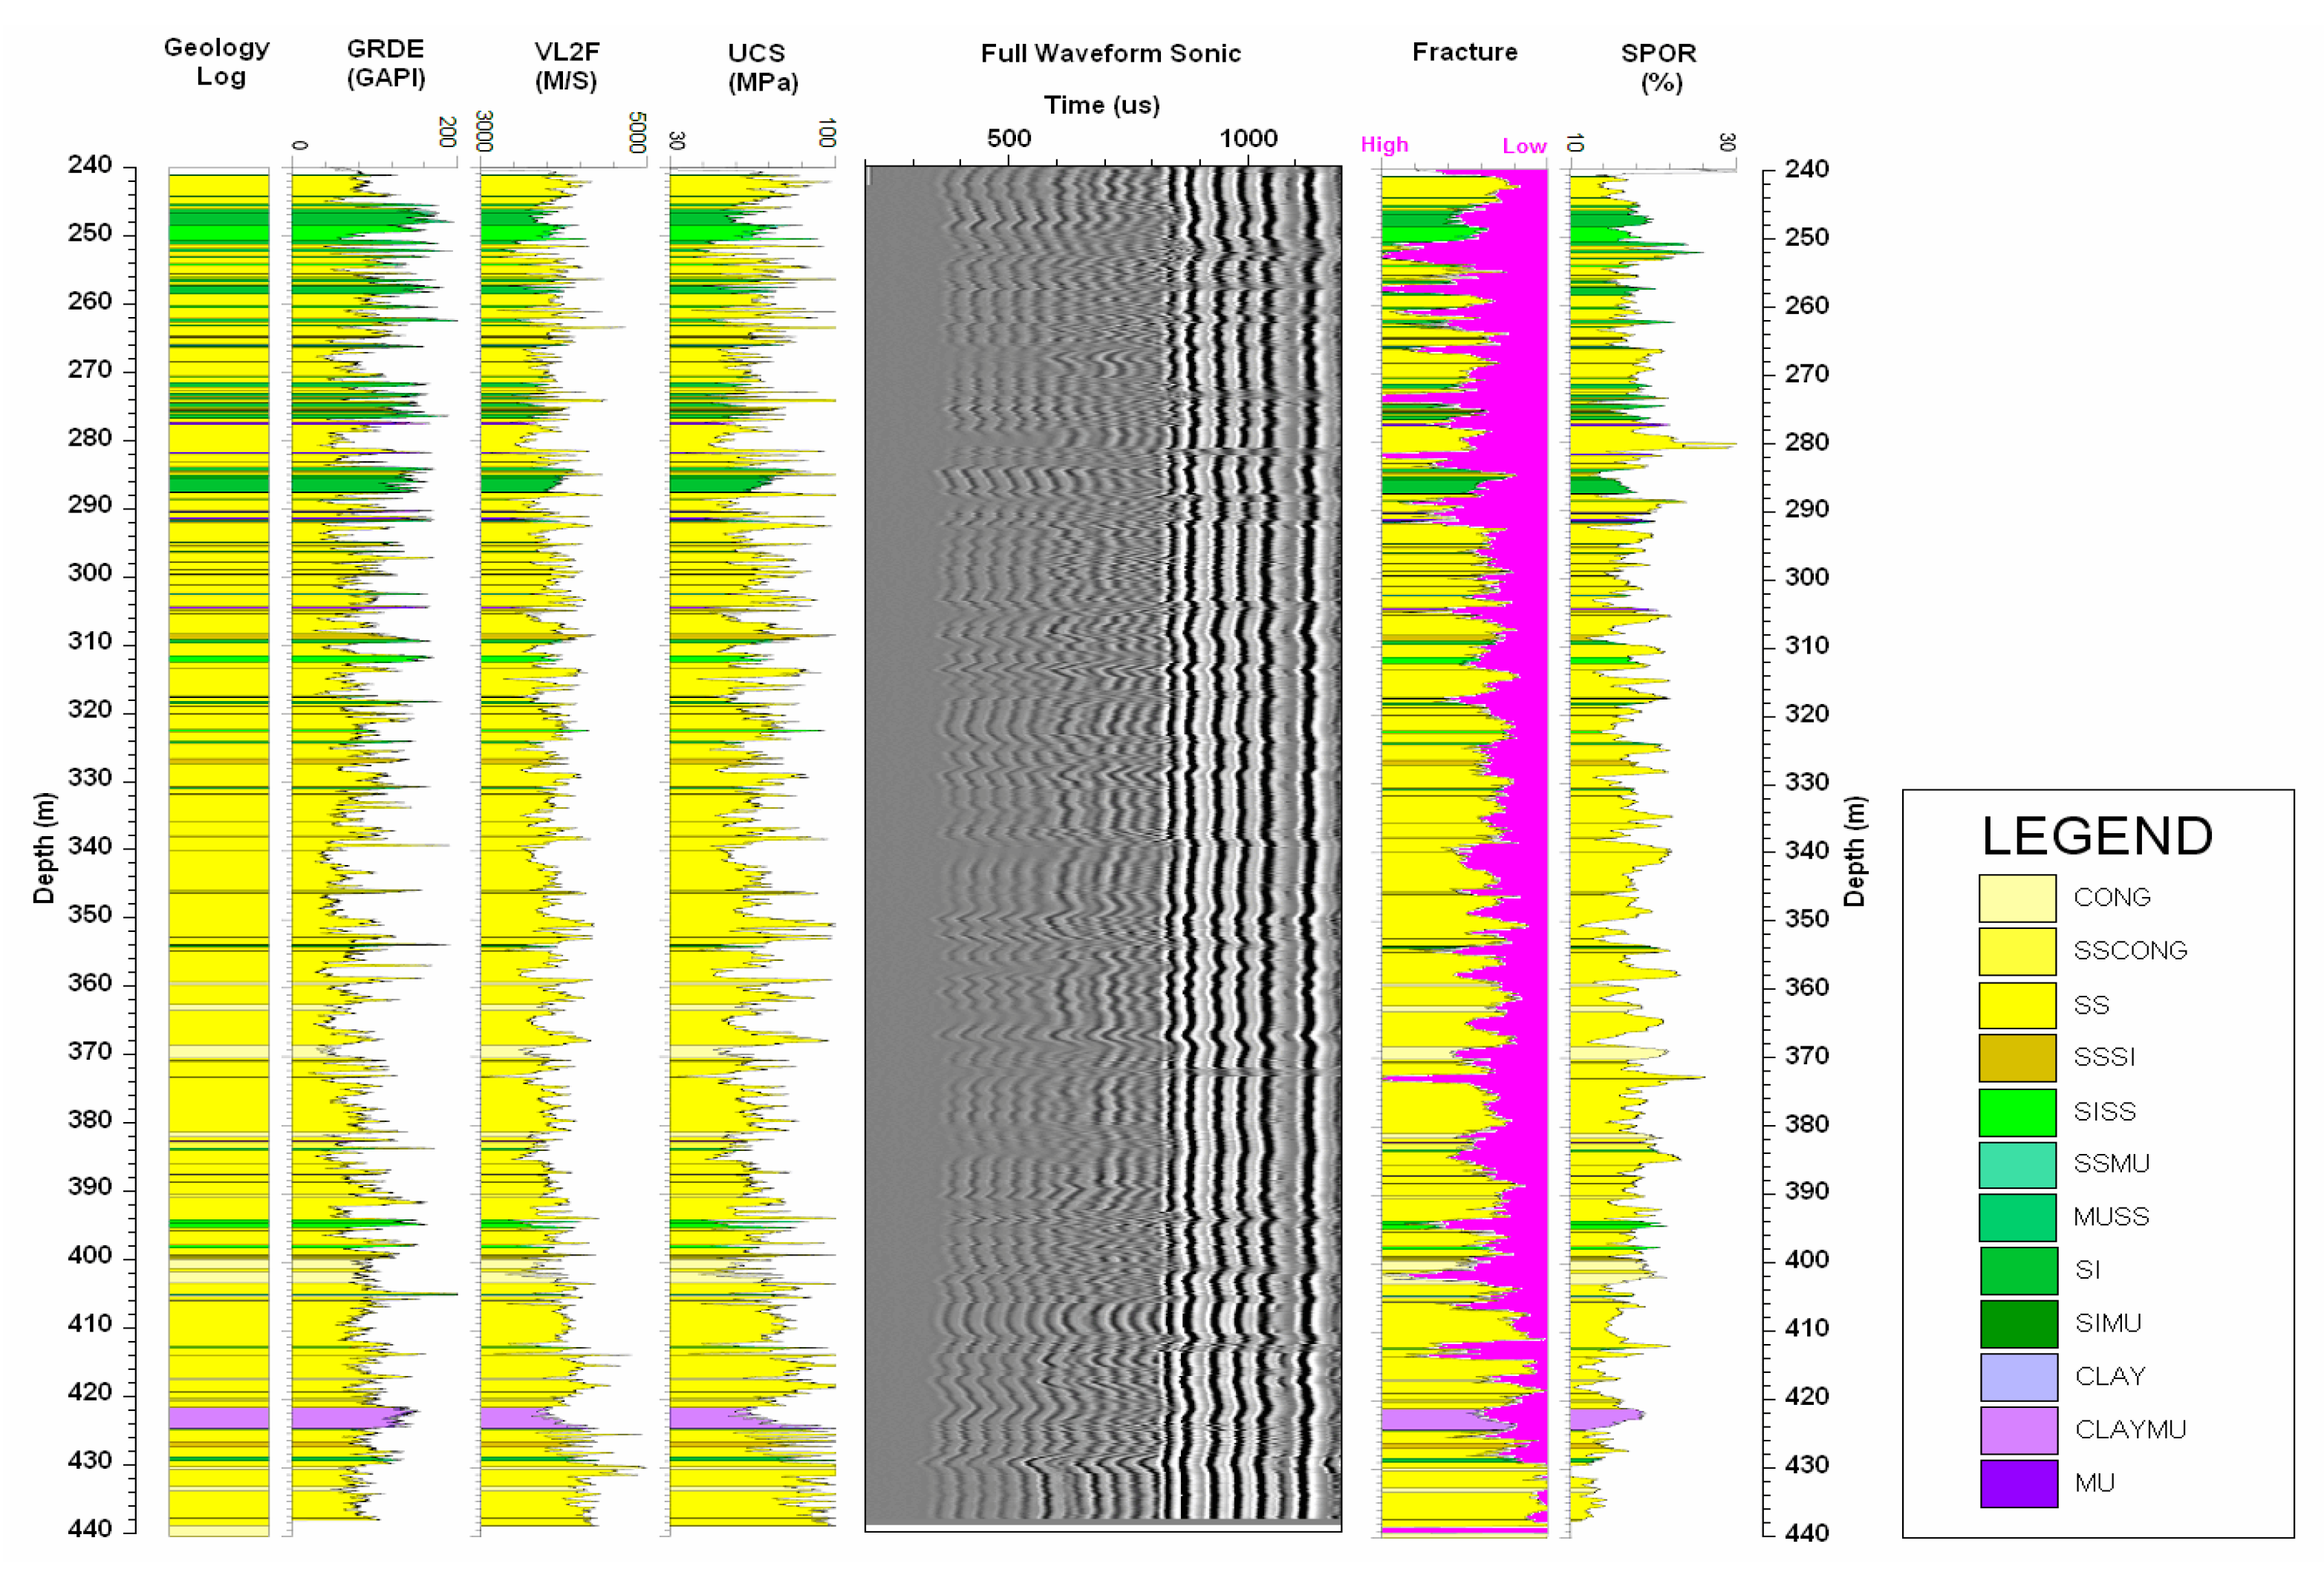
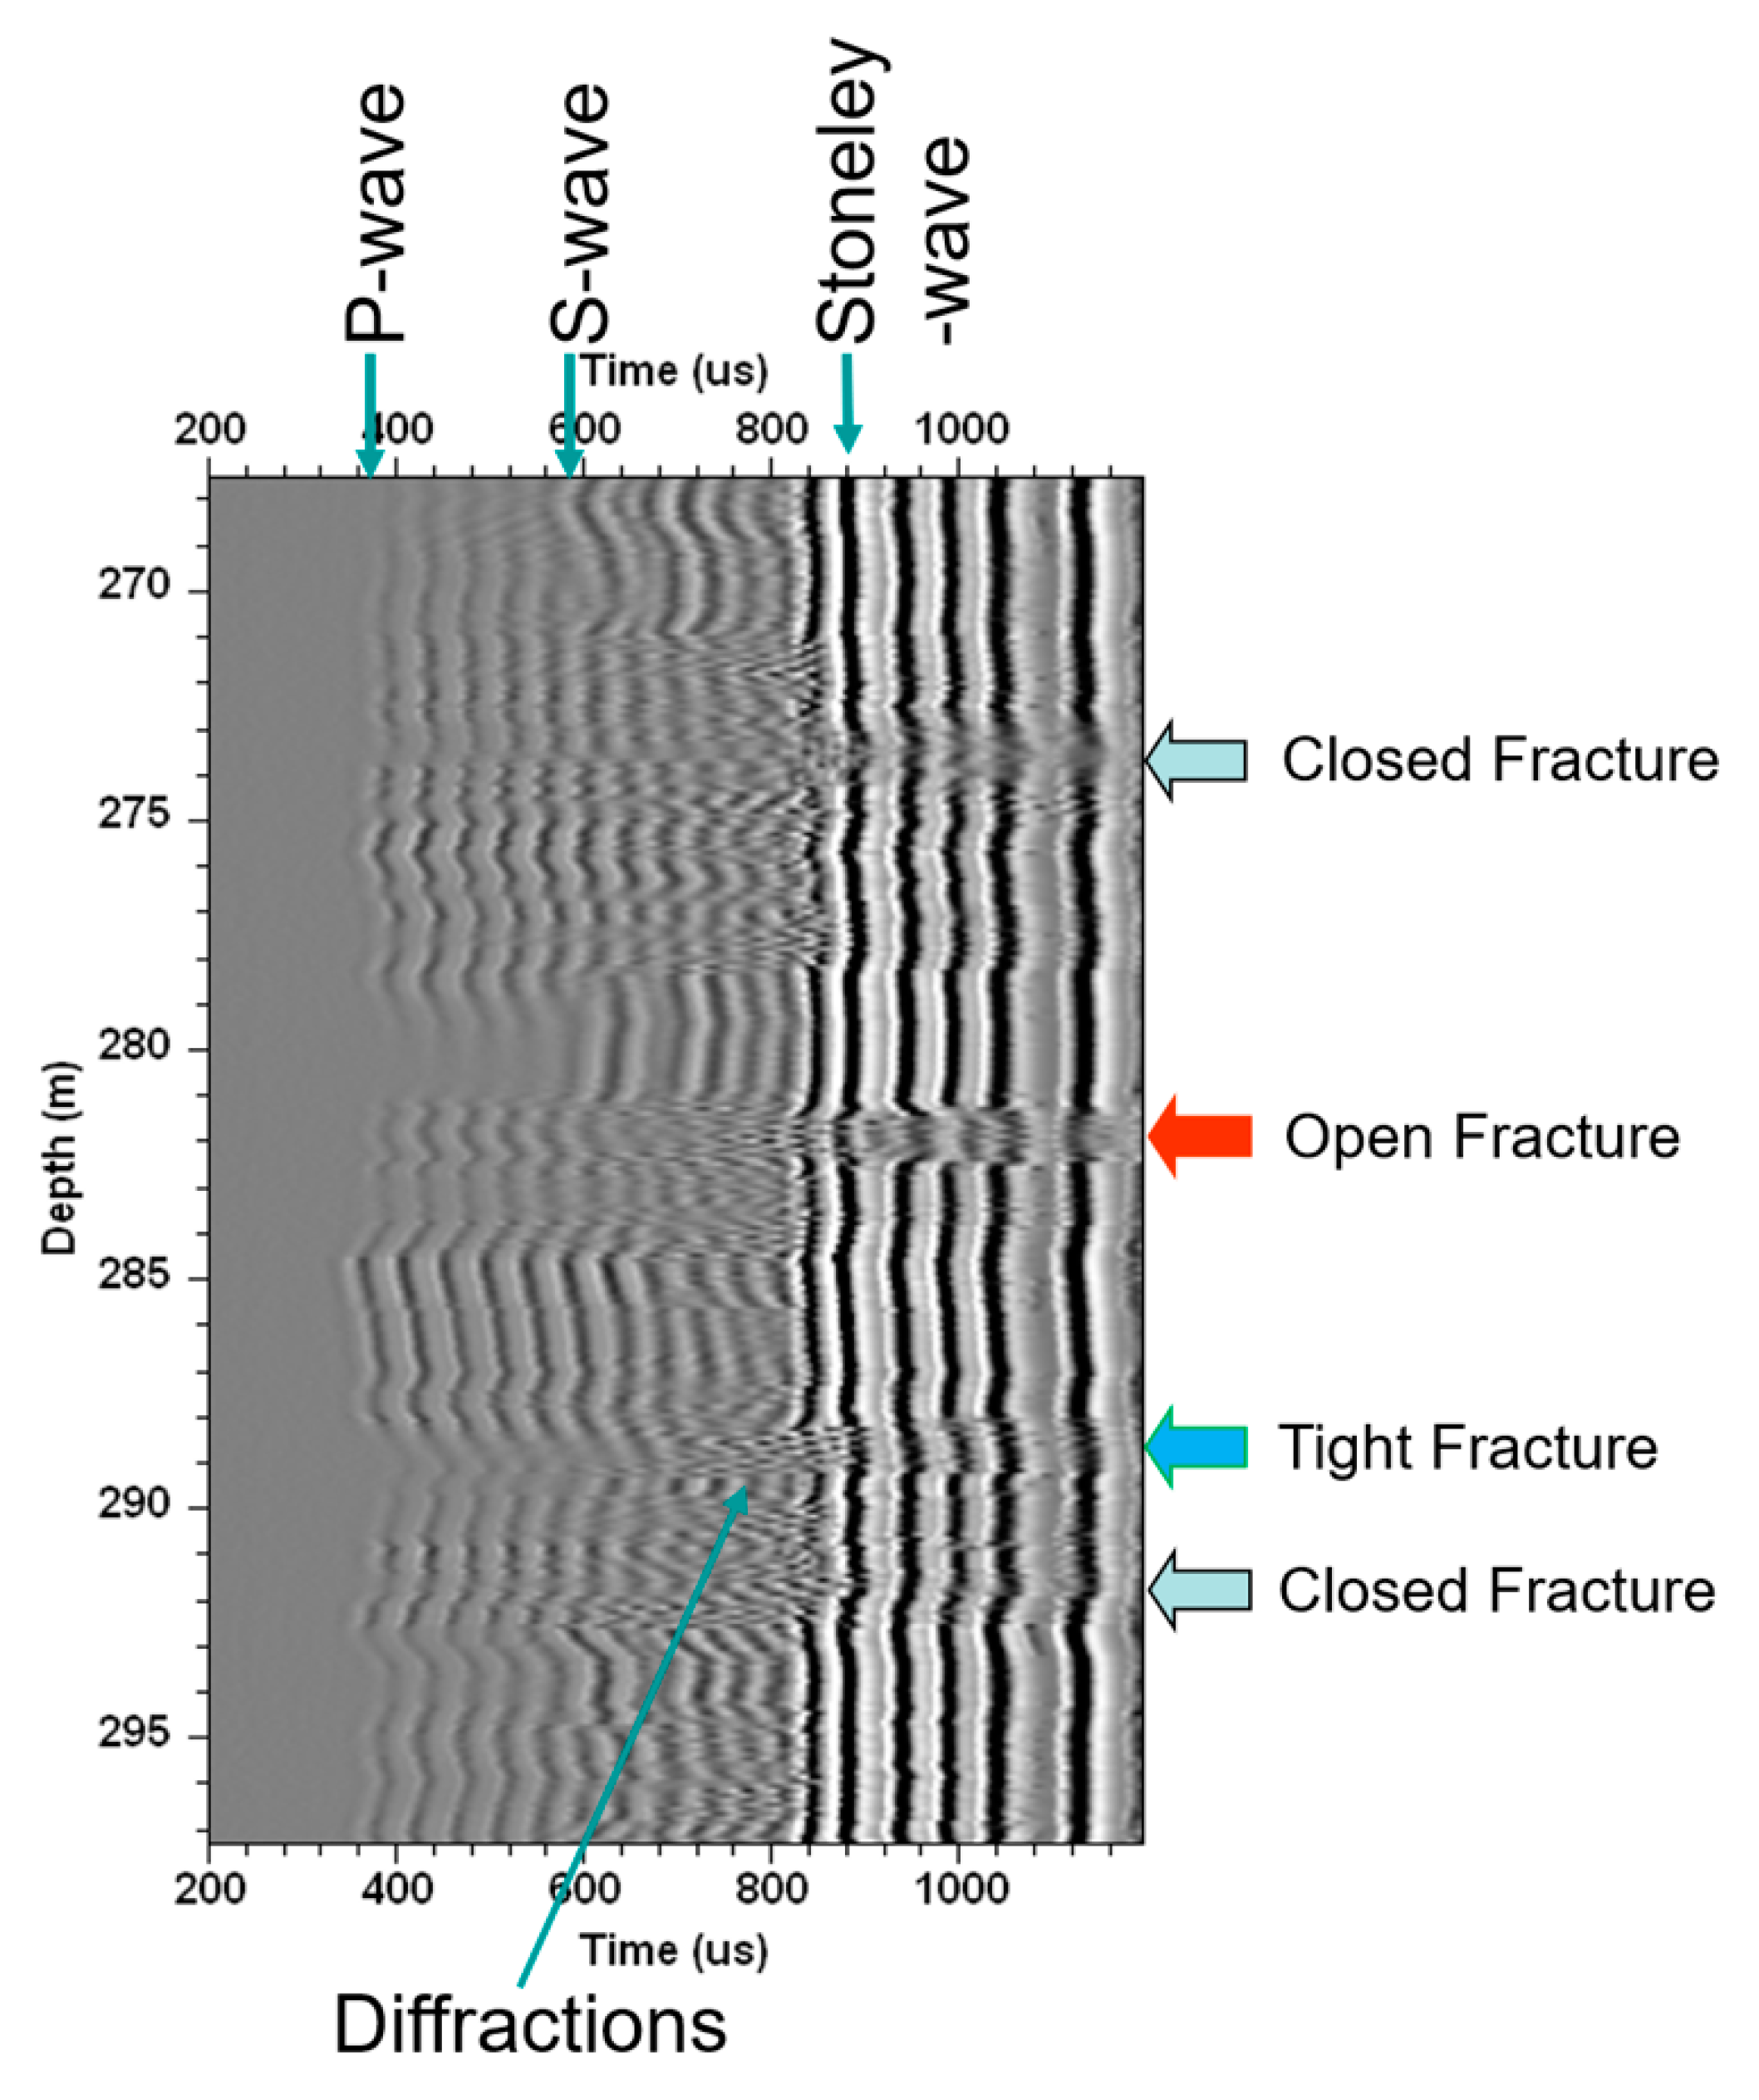
Based on the above observation, a fracture indicator can be derived from the total energy of the FWS as shown in Figure 6 (shaded in magenta). In general, fractures are associated with the Stoneley wave energy loss and diffraction patterns as shown in Figure 5 and Figure 7. Based on the amount of energy loss and the diffraction patterns, one may classify the possible fractures as open fractures (Loss most of the Stoneley wave energy); closed fractures (there no much Stoneley wave energy loss but the diffraction patterns can be observed); and the tight fractures (between the open and close fractures), as illustrated in Figure 7. However, energy loss can be caused by permeable strata such as coal seam and the diffractions can also be caused by strata interfaces. Without further information to support, the fracture interpretation from the FWS data can only considered as a fracture indicator or more accurately, it should be considered as a permeability indicator. Table 1 presents the fractures interpreted from the FWS data in Figure 6.
As demonstrated, if the rock is highly fractured, the wave energy will be dissipated and attenuated by the highly permeable fractures. If the fractures are tight, strong diffraction energies can be observed from these fractures, as shown in Figure 8. These diffraction patterns are very good indicators that there are fractures at the locations of the diffraction apexes and can be enhanced by filtering those direct arrivals.
2.2. Geophysical Strata Rating
Although UCS is an important geotechnical parameter, it only applies to the intact rocks that do not have defects. To overcome this limitation, Hatherly et al. [27,28] have developed a new scheme designed specifically for clastic rocks - the geophysical strata rating (GSR). This scheme combines separate ratings for the intact rock mass and defects. GSR values are similar to those obtained through the Coal Mine Roof Rating (CMRR) [29], a scheme that is similar to the Rock Mass Rating (RMR) [30]. It generally delivers values between 10 and 100 depending on the overall quality of the strata. To calculate the GSR, a quantitative analysis of geophysical logs is undertaken to determine the porosity (from density or neutron logs), the clay content or shaliness (from gamma ray, neutron or resistivity logs) and the effective stress. The P-wave velocity provides a strength score that underpins the GSR. Adjustments are then made to this according to the porosity, the shaliness, the amount of bed cohesion and inferred defects (fractures and bed boundaries). The details of the GSR computation can be found in Hatherly et al. [31].
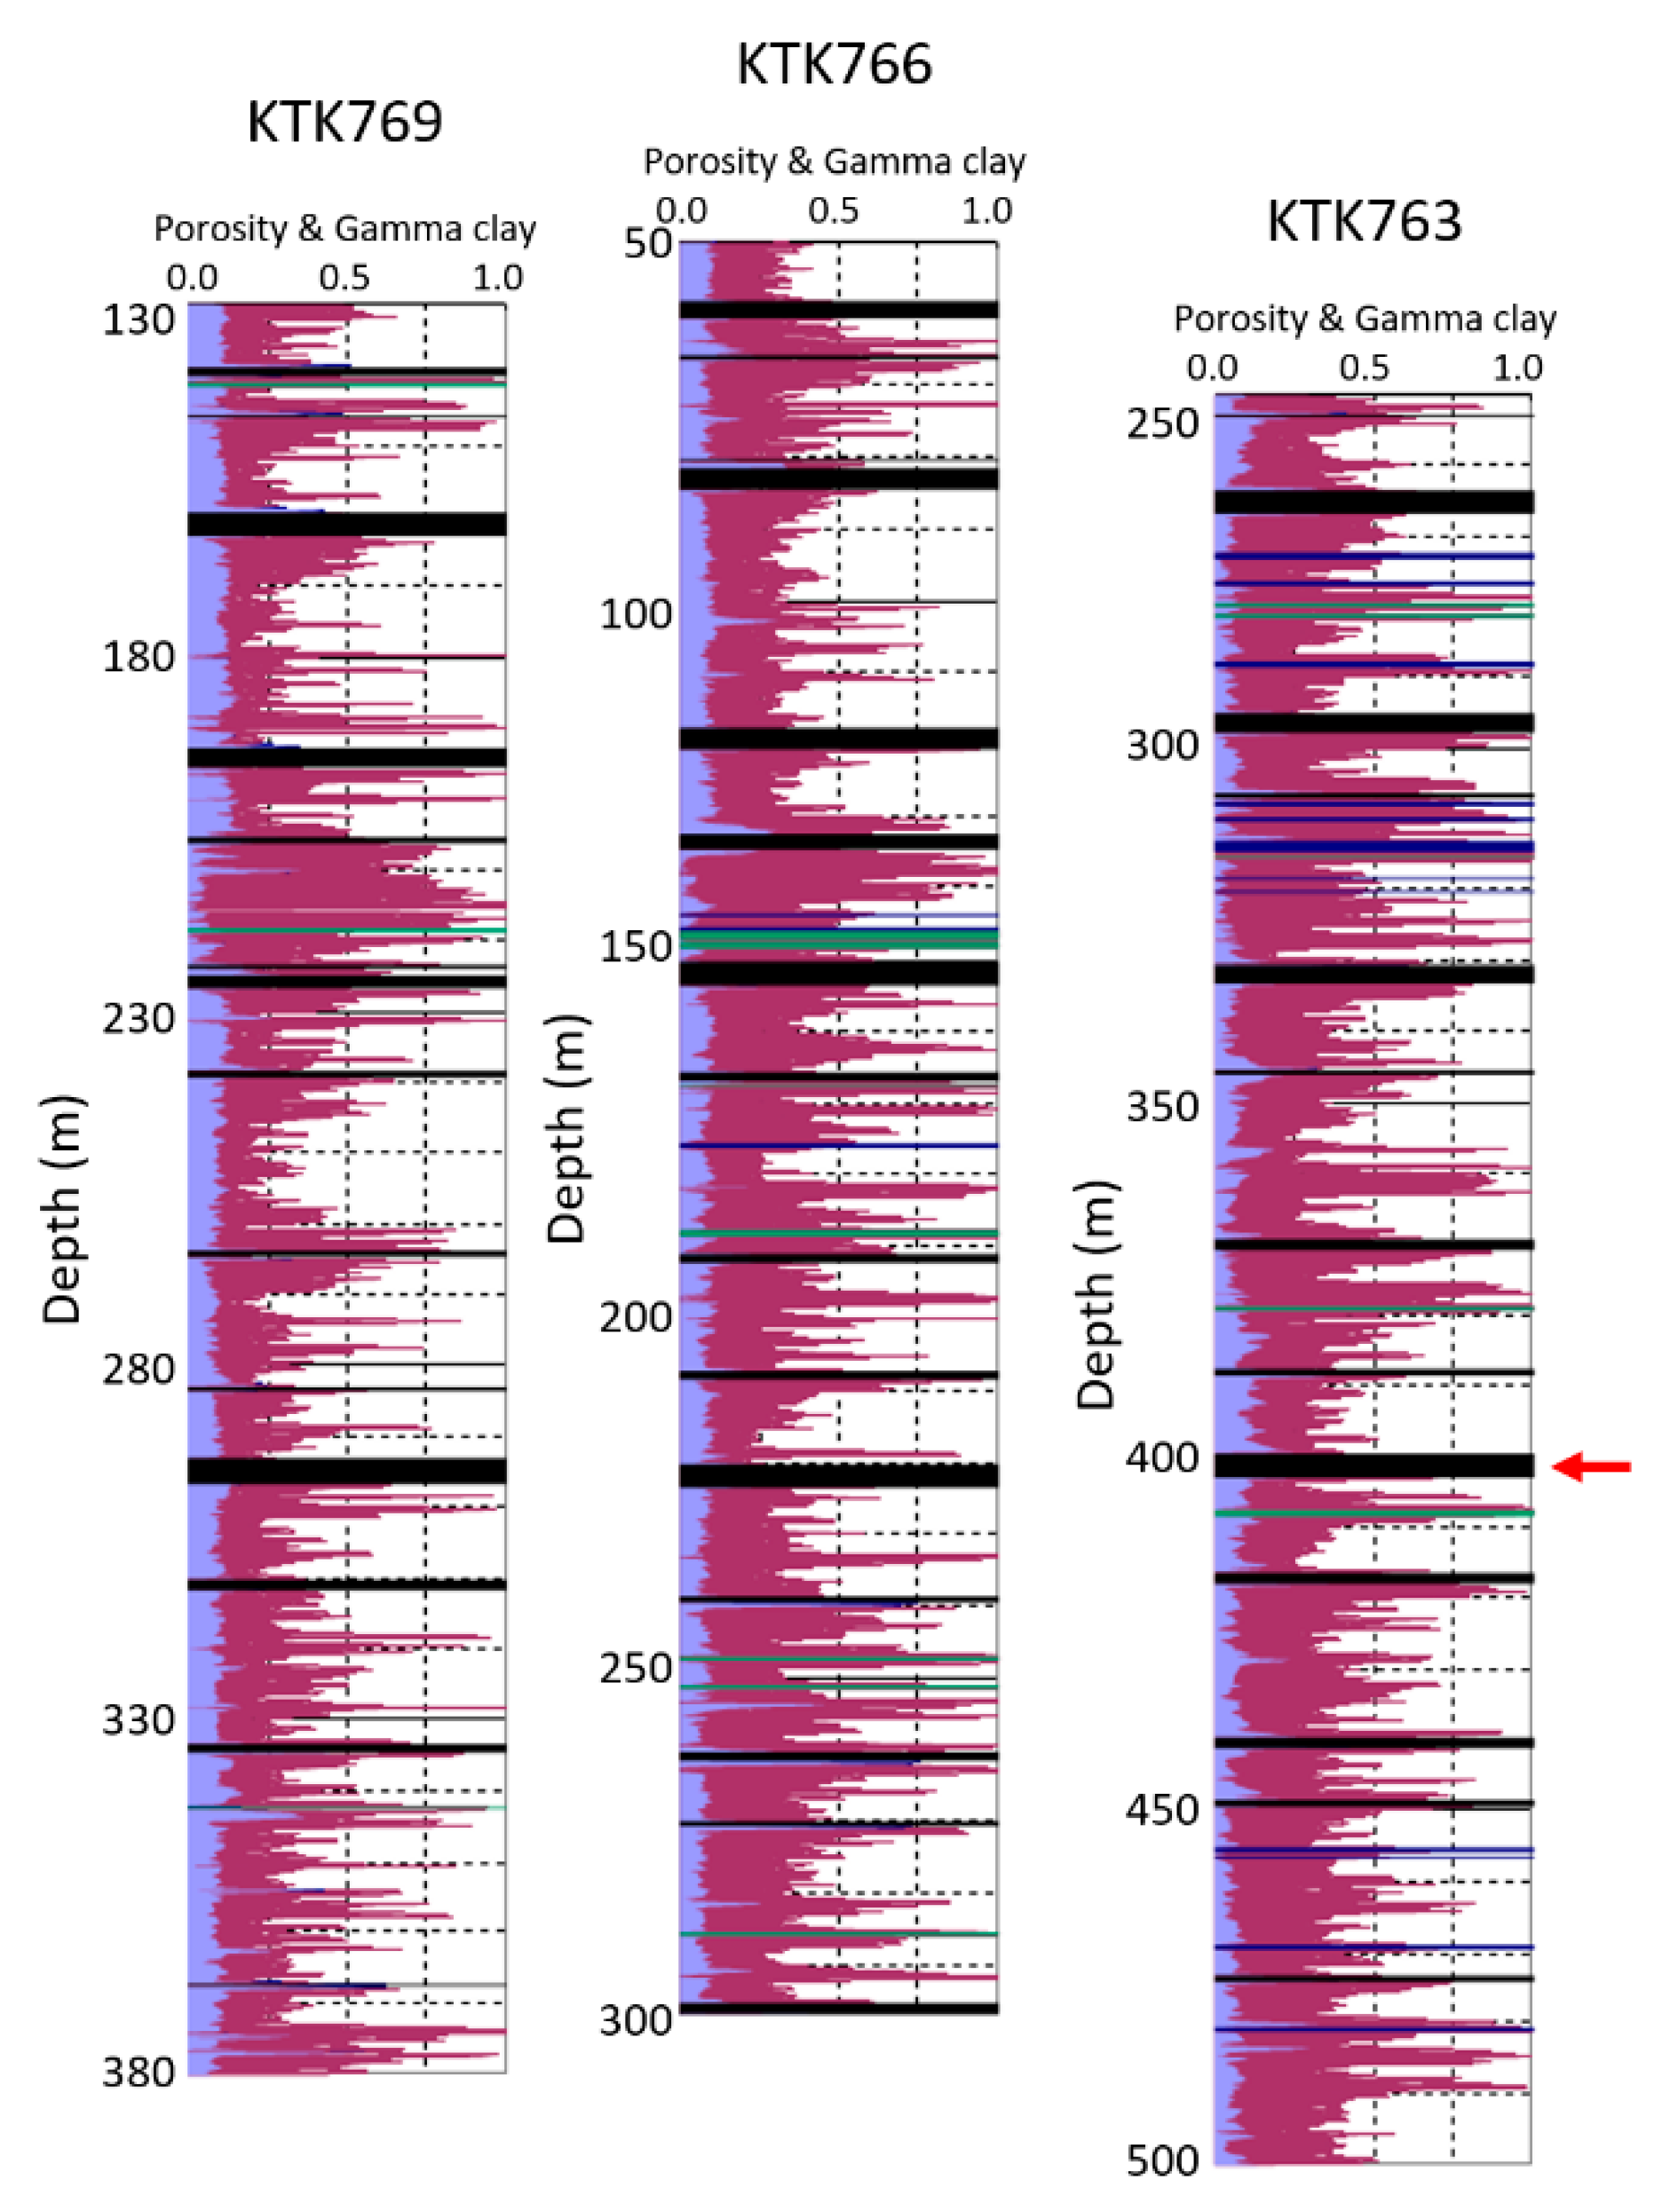
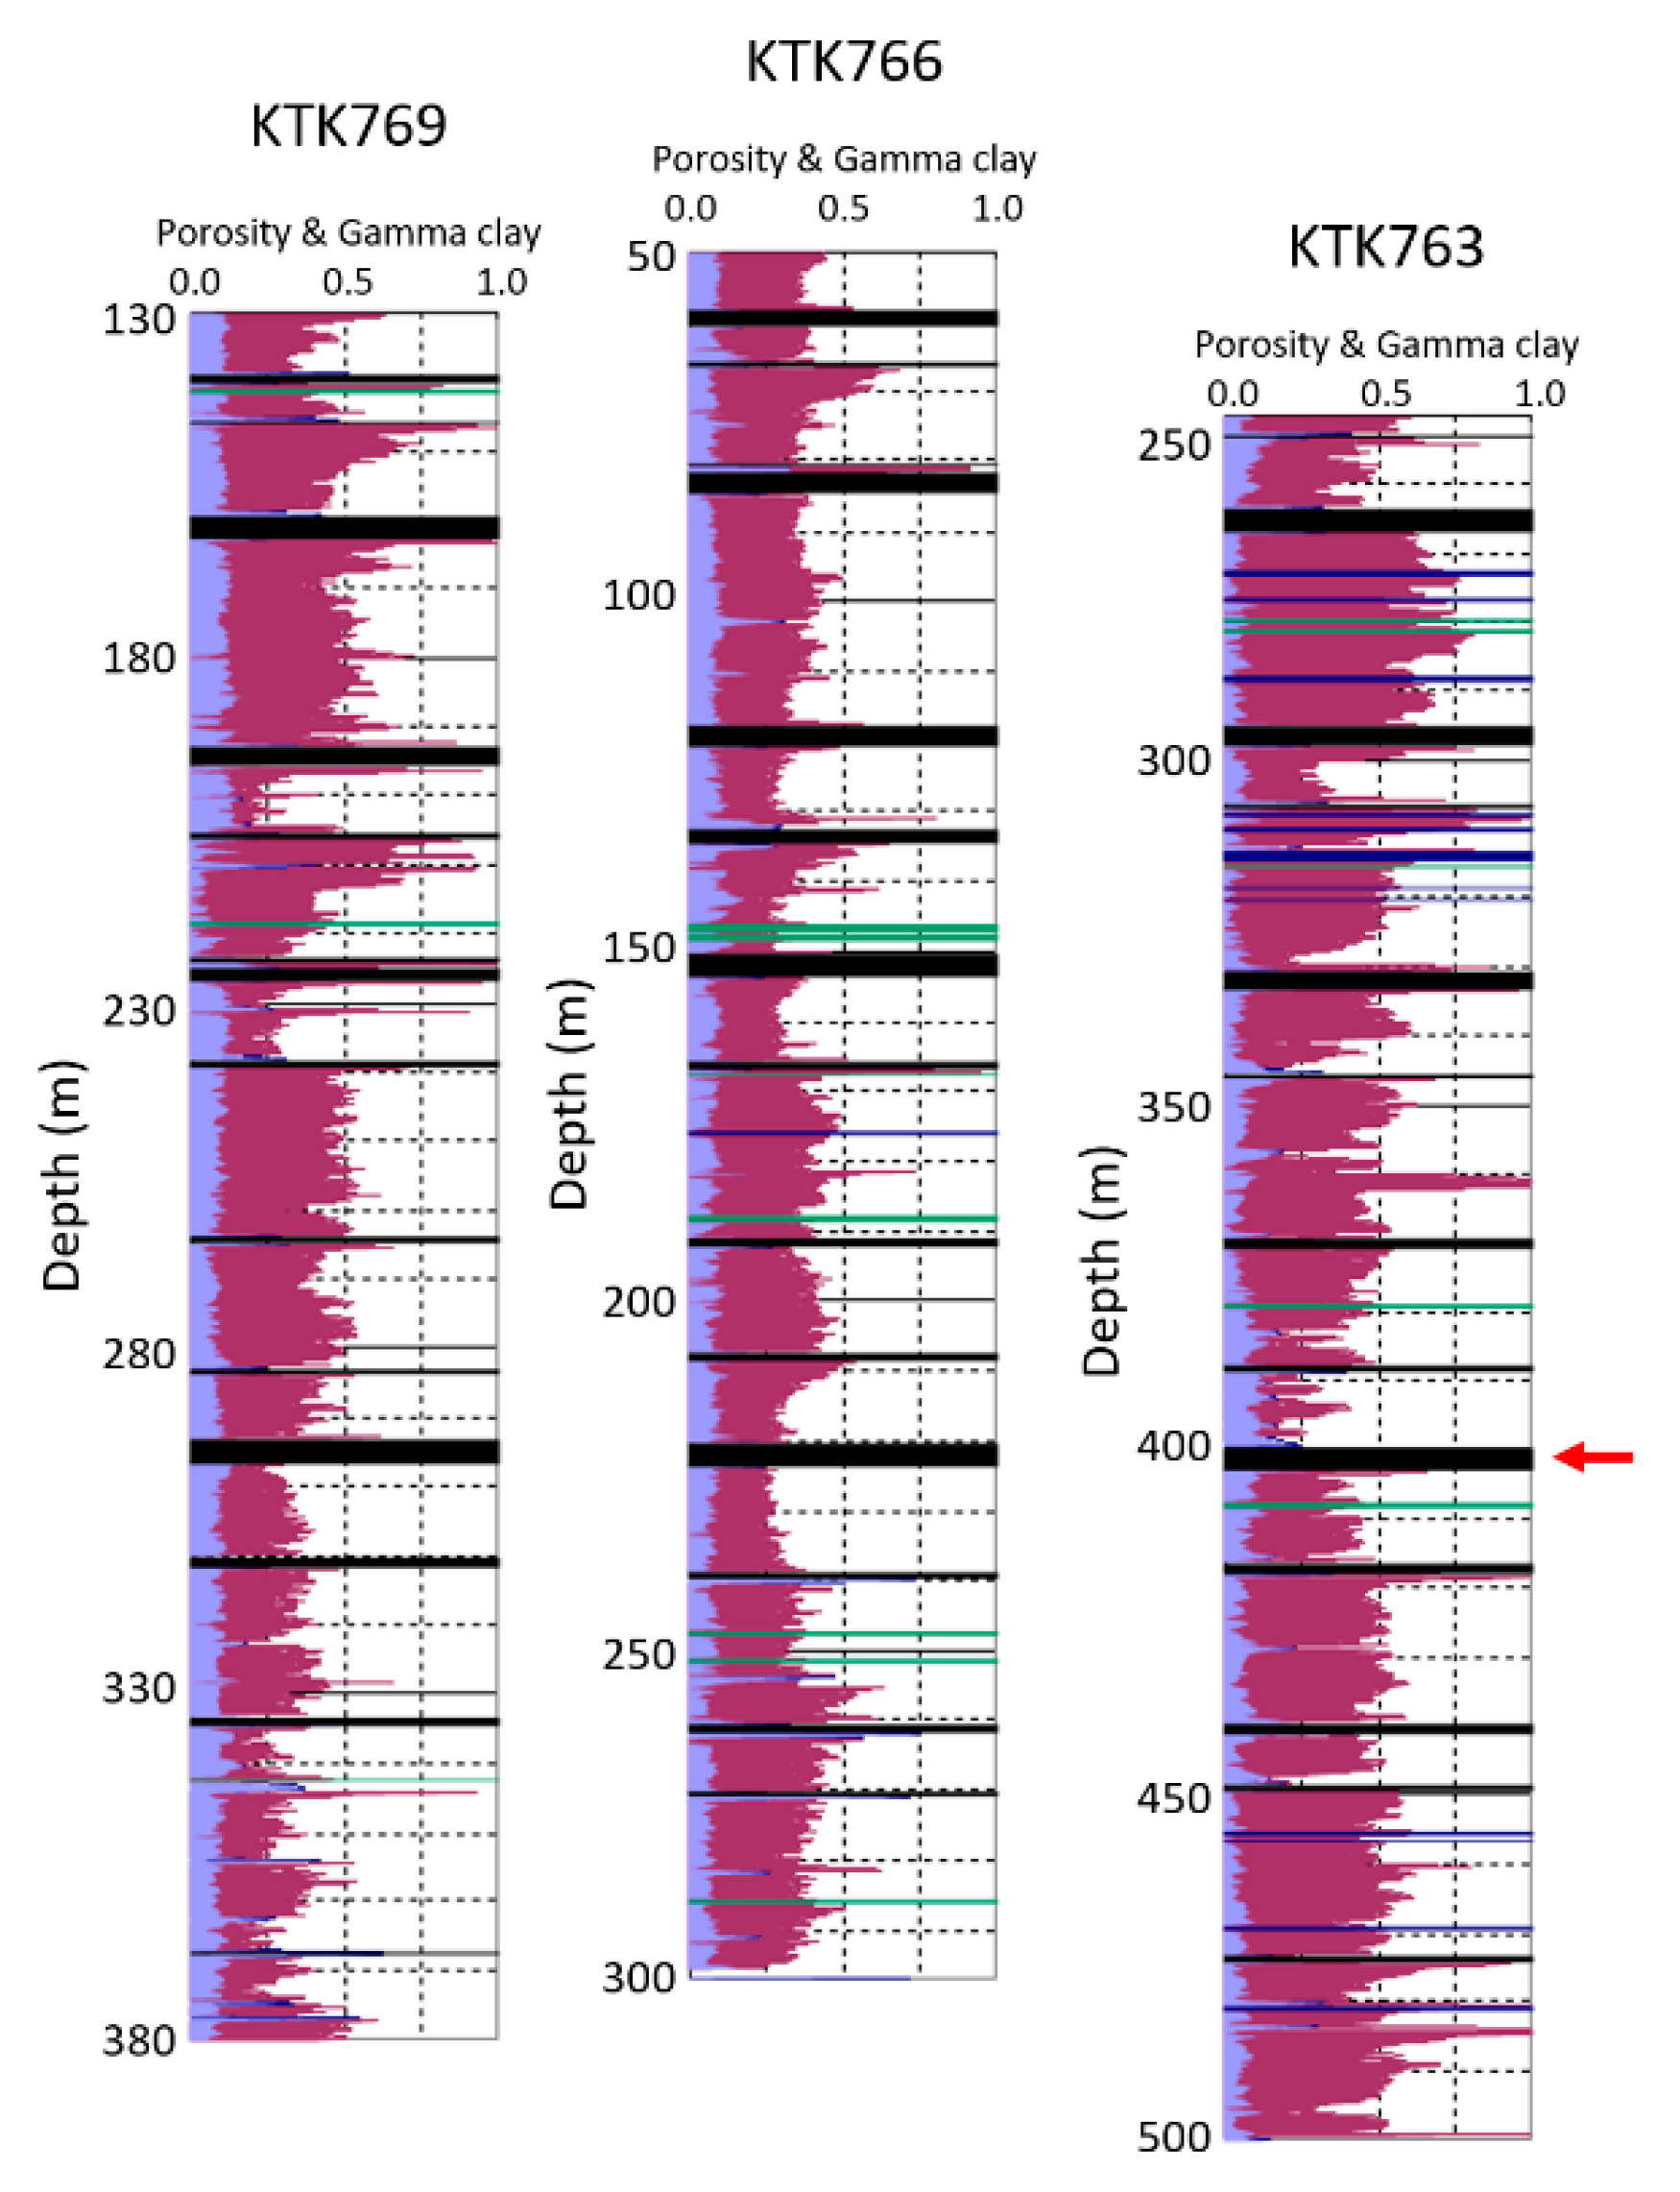
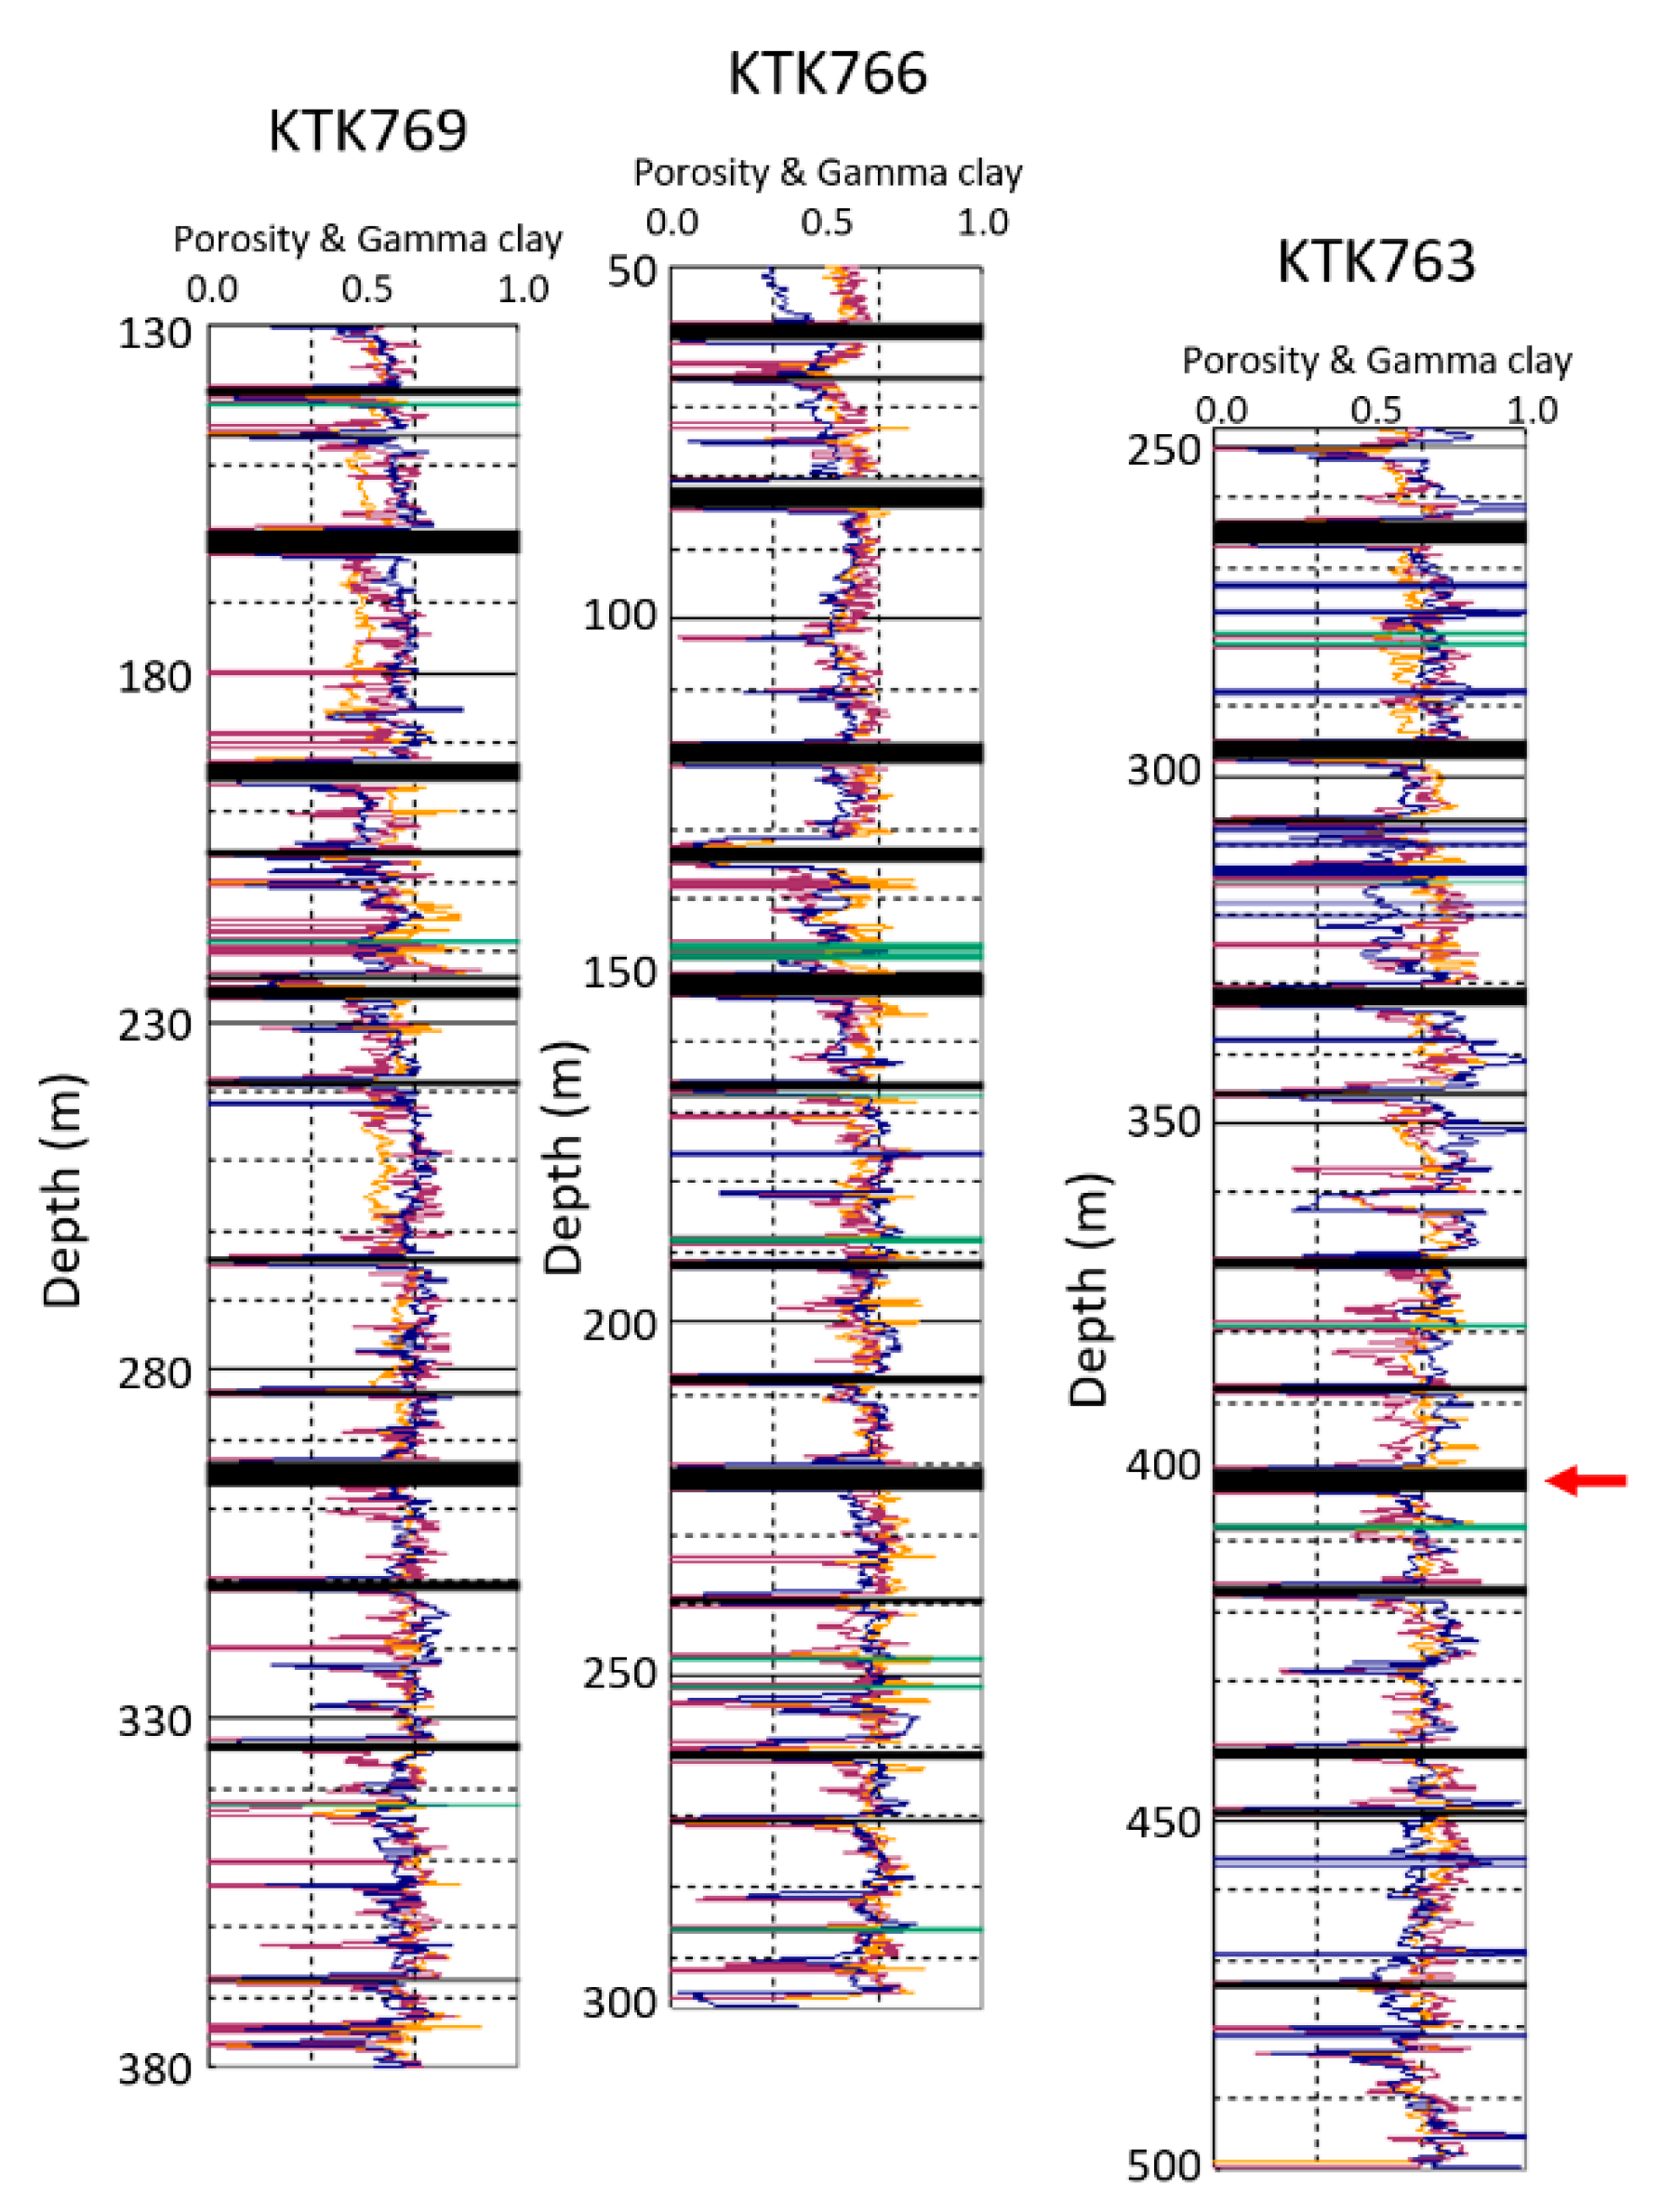
For illustrative purpose, we applied the GSR scheme to the three boreholes KTK769, KTK766 and KTK763 from Kakatiya Khani Coal Mine, India. Figure 9 shows an example of the porosity and clay determinations for the three boreholes. The porosities were calculated from the long spaced density (LSD) log with a matrix density of about 2.66 g/cc and the clay contents were computed from the natural gamma (NGAM) ray log with the sand gamma ray of 20–30 cps and the clay gamma ray of 300–320 cps. We also computed the clay contents from the short normal resistivity (SNR) log with the shale resistivity of 125 and the sand resistivity of 180 ohmm and water resistivity of 20–30 ohmm. The results are presented in Figure 10. For easy comparison and correlation, these logs are plotted relative to the seam marked by the red arrow in the lower part of the figures. The estimated sonic velocities based on the porosities and clay contents in Figure 9 and Figure 10, along with the measured sonic log, are shown in Figure 11. It is clear that the estimated velocities are well matched with measured sonic velocities. This demonstrates the validity of the estimation of the porosities and clay contents.
The estimated GSR based on the porosities and clay contents in Figure 10 and the measured sonic velocities for the three boreholes are given in Figure 12. It is clear that the GSR is quite uniform with an average value of about 60 for all three boreholes, although there are some thin bands with low GSR. Therefore, we can conclude that the rock at KTK longwall block is very strong and competent. The estimated GSR data allows geotechnical engineers to better assess roadway stability and longwall caving behaviour and improve design ground support for longwall mining.
2.3. 2D/3D Modelling of Geophysical Logs for Strata Geotechnical Characterization
Geophysical logs and their derived parameters can provide input to geological and geotechnical models as part of digital mine, which can be used for mine design, control and management. As demonstrated above, sonic logs have a strong correlation with UCS—the higher the velocity, the stronger the rock. Therefore, we can use the sonic velocity as an indicator for the relative rock strength when there is no reliable sonic-UCS correlation formula available. To appreciate the usefulness of the geophysical logs such as the sonic log or the derived GSR data, it is desirable to form interpolated 2D and 3D models from the logs between boreholes. From these models, sections and plans showing vertical and lateral variations can be constructed, which could provide a new way of representing geotechnical data for further geotechnical evaluation. Figure 13 shows a cross-section of sonic velocities along the tailgate, which is extracted from the 3D velocity model established using GeoInterp, a program developed through an ACARP (Australian Coal Association Research Program) project [32]. GeoInterp uses coal seams as interpolation constraints/control surfaces to compensate for the poor correlation of the logging data between holes when the borehole spacing is too large (i.e., where it has been under sampled compared with the geological variations). The control surfaces are established by performing a separate set of interpolations between boreholes while the final models can be created in either 2D or 3D with linear or inverse distance interpolation methods. From this plot, one can easily recognize the distribution of strong sandy units with high velocity (in yellow to red) in relation to the coal seams (blue units). There is a rider seam within the GM seam at the lower right edge of the plot and the associated seam split. There is also a split evident in the overlying P seam, which is associated with the development of the sandstone channel between the PL and PU splits. The presence of the rider seam, with overlying, thick, strong sandstones, above the GM seam, is responsible for a roof-fall that occurred at the southern end of longwall LW105.
2.4. Automated Lithology Interpretation: Identification of Sugar Sands
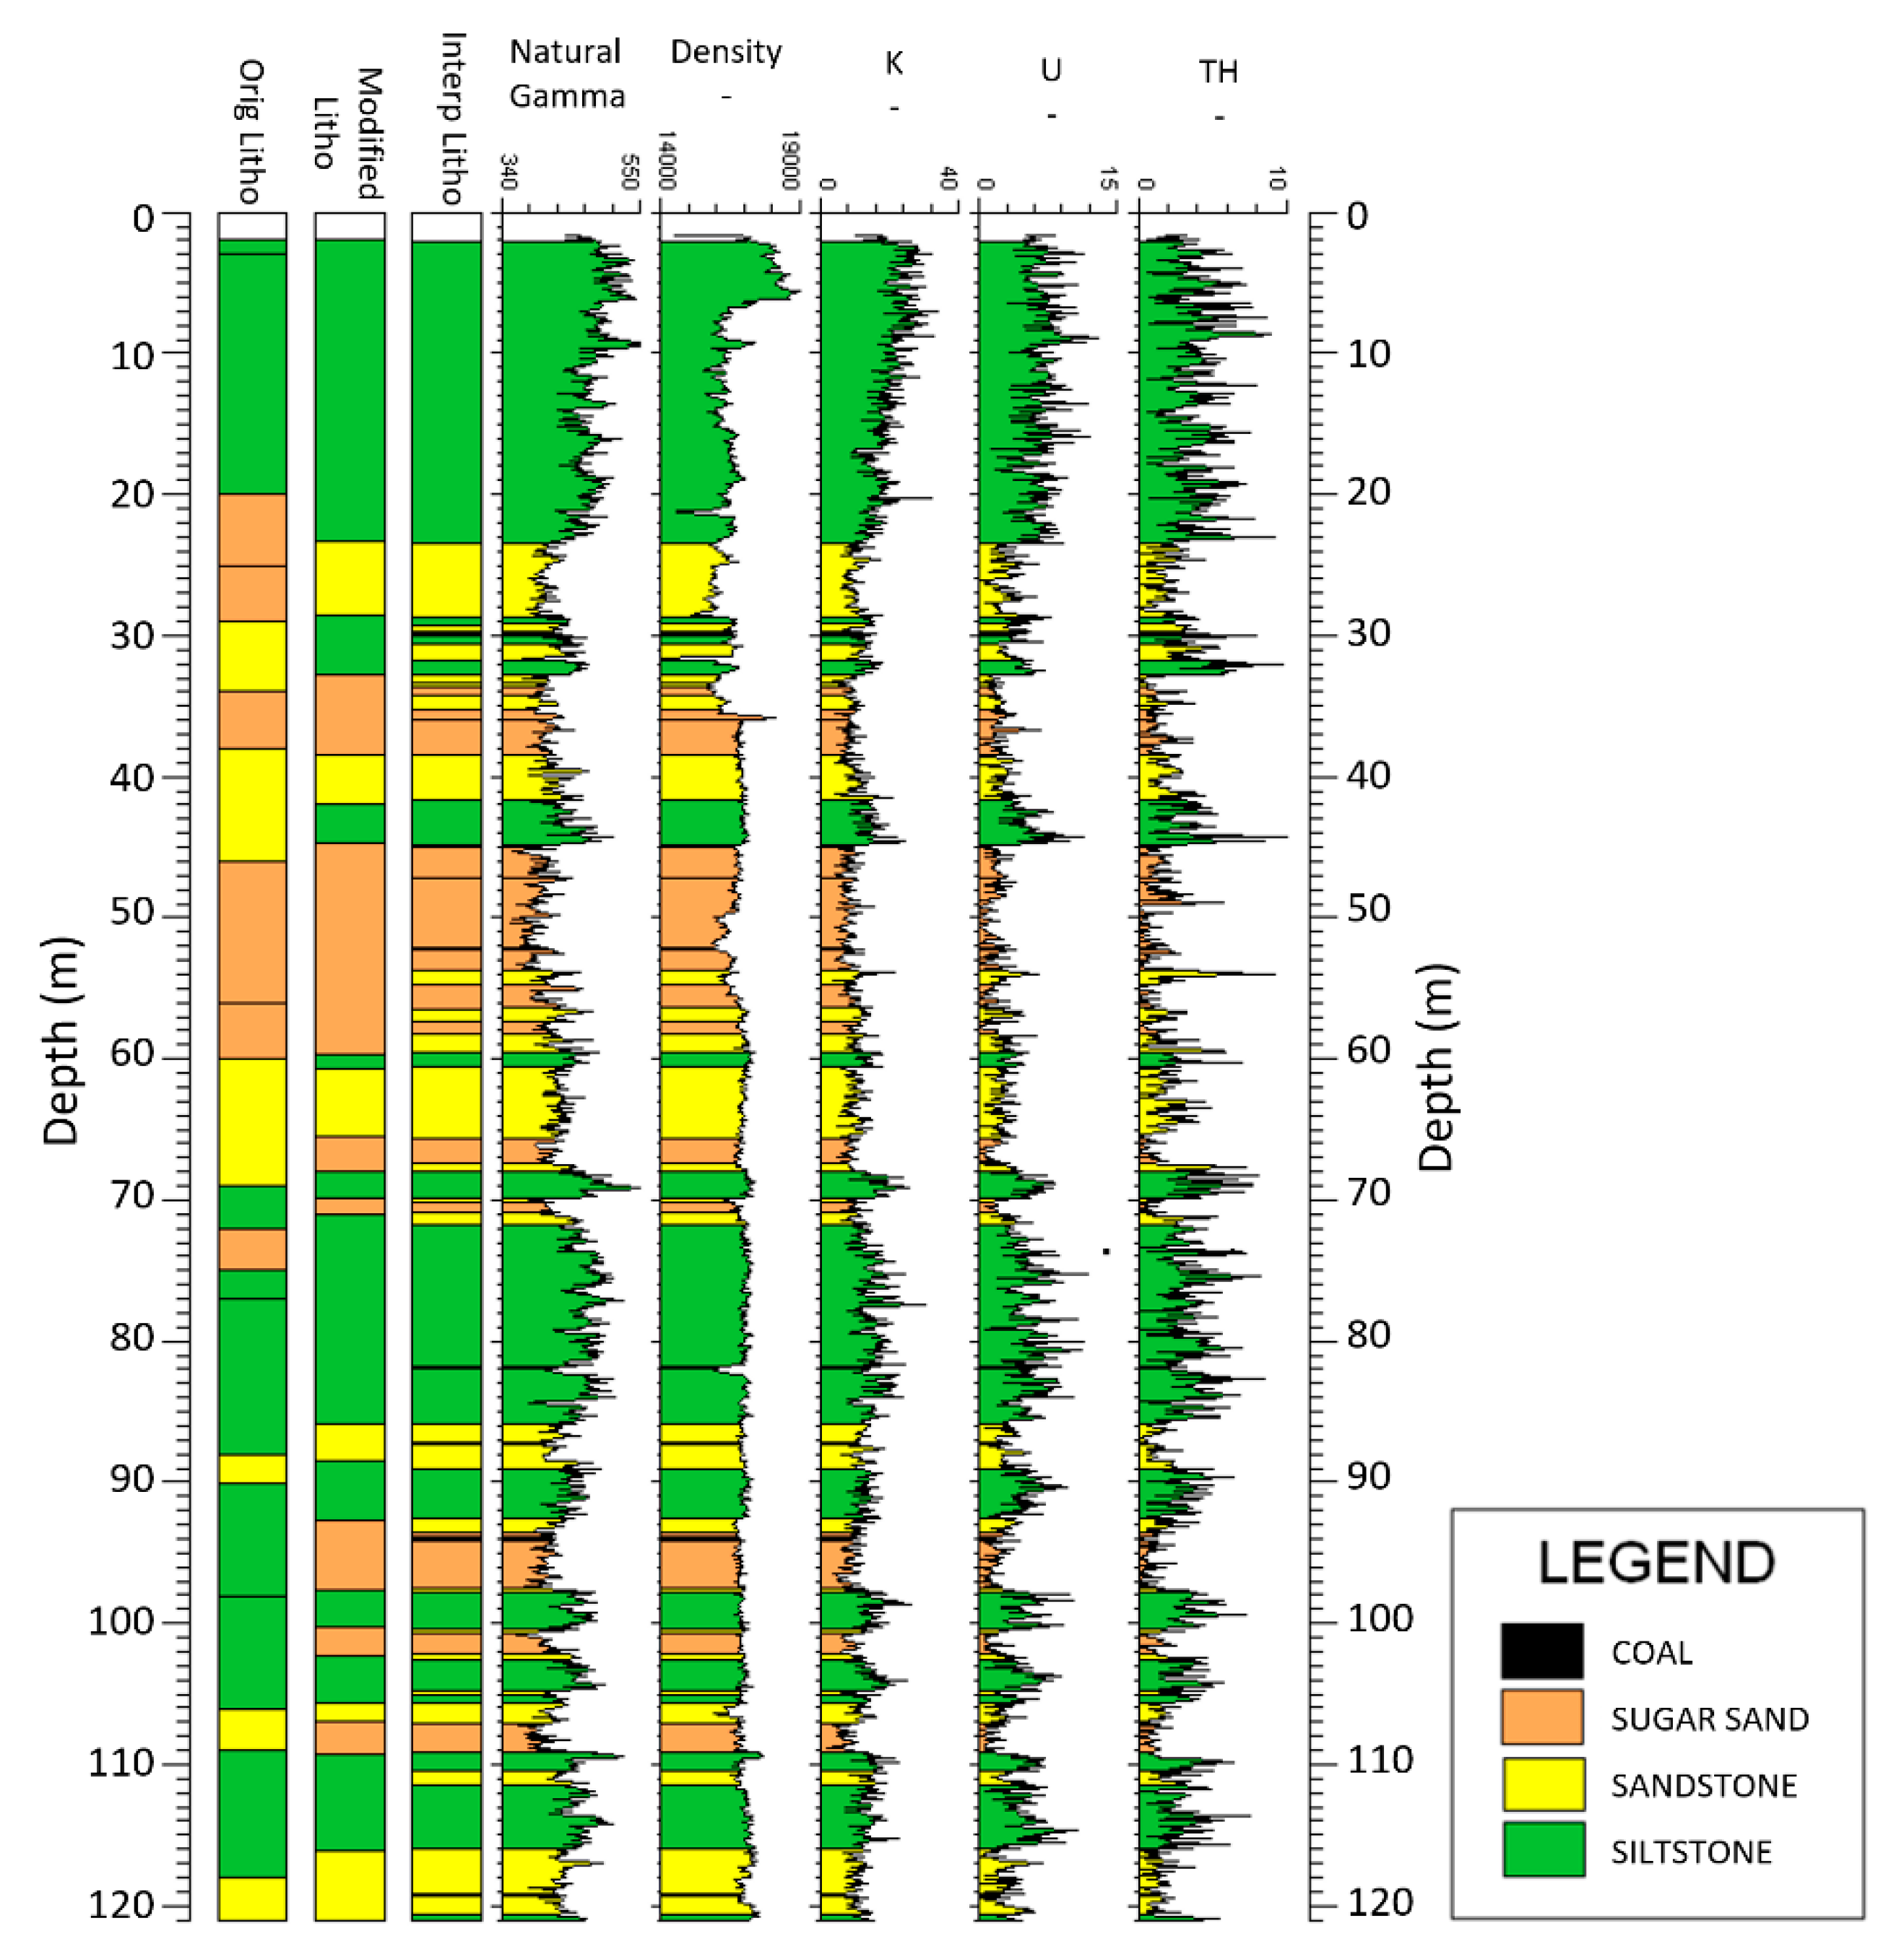
The strength of the rock is usually related to the rock type—well cemented sandstones are stronger than mudstones, claystone and siltstone. Therefore, lithological interpretation of geophysical logs and its spatial distribution of lithologies will greatly improve our understanding of the effects of overburden sediments in relation to the coal mining activities. The prediction of lithology from conventional geophysical logs is well established and automatic geophysical interpretation programs such as LogTrans have been developed [5]. This is an effective tool for lithological classification [33]. At Callide Mine, Queensland, Australia, rock type mapping is very important before blast planning, especially for that of the poorly cemented sandstone. This is a rock layer locally referred to as sugar sands, which are largely quartz sand that are very strong when dry but behave like sand if wet. To enable mapping these sugar sands, Callide has collected various geophysical logs including SIROLOG spectrometric natural gamma logging data. From this, the natural (total) gamma, the density, the components of total natural gamma and thorium (Th), potassium (K) and uranium (U) content can be derived. These parameters have strong correlations with the rock type and would be valuable for lithology prediction. To evaluate the potential of SIROLOG data for identification of sugar sand presence, we carried out a preliminary study with limited data from a borehole using LogTrans. The results were very encouraging and the SIROLOG interpreted rock classes including the sugar sands were well matched with the original geological logs as shown in Figure 14. It is clear that SIROLOG data can assist with recognition of sugar sands at Callide.
2.5. Automated Geological and Geotechnical Interpretation
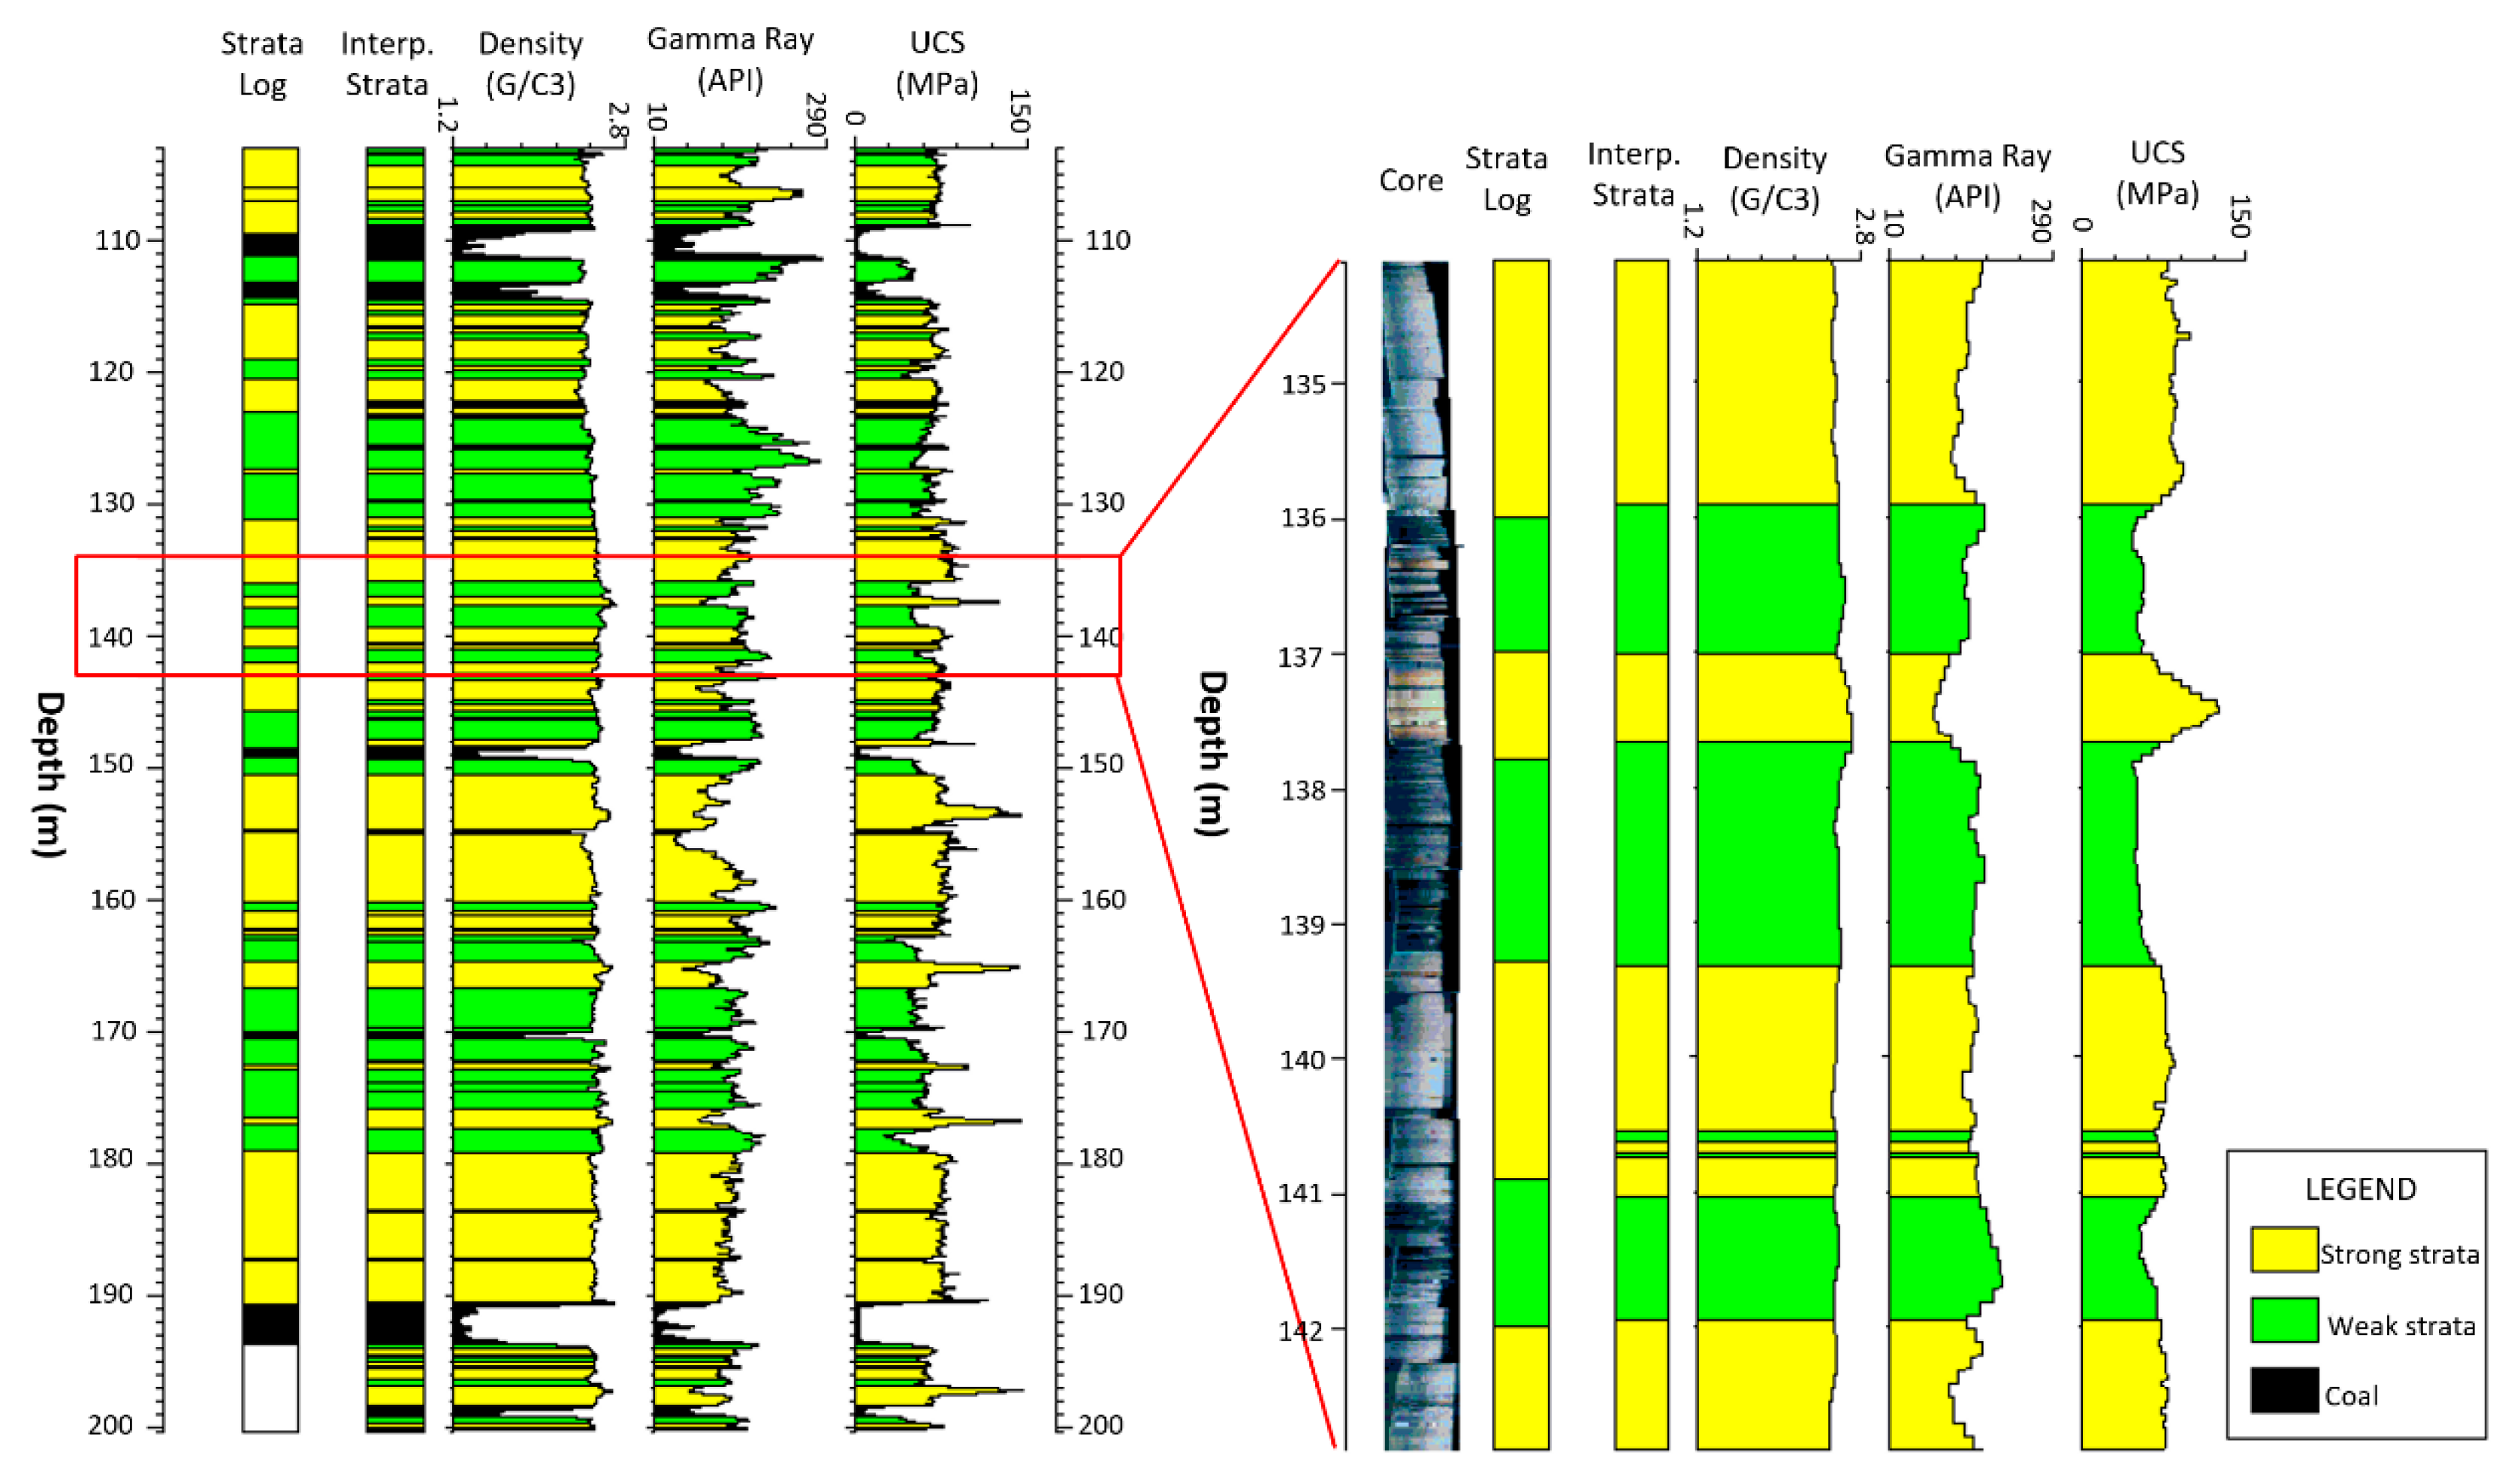
In addition to the lithological interpretation, we can predict geotechnical strata units directly from geophysical logs. This can be illustrated using an example from Southern Colliery, Queensland, Australia, where the main purpose of the study was to understand and predict the caving behaviour caused by longwall mining in the area. In this study, we classified the rocks as geotechnical strata units in terms of coal, strong (sandstones), moderately strong (sandstones and siltstones) and weak strata (siltstones and mudstones). The type of geotechnical strata was derived from density, gamma ray and UCS (from the sonic log) logs by using LogTrans software. Figure 15 presents the LogTrans result for the drill hole DD0412 from Southern Colliery. LogTrans successfully interpreted the geotechnical strata units with an overall success rate of 85%. The comparison of the interpretation with the core photographs on the right of Figure 15 is very favourable. These geophysically-derived geotechnical units can be used as input to digital mine to generate a 3D geotechnical block model for mine design purposes [9].
3. Coal Quality Estimation from Geophysical Logs
Knowledge of the accurate spatial distribution of coal quality parameters is fundamental to planning, design, extraction and beneficiation, through to utilisation. Traditionally, coal quality parameters such as relative density, ash content and volatile matter are obtained through laboratory measurements and analysis of cores to an accuracy and precision required by mining staff to plan and develop coal mines in the most economic manner. However, borehole coring and core tests are expensive and time-consuming. Therefore, such tests are usually carried out on a limited number of coal samples. Obtaining estimates of these coal quality parameters from non-cored holes would complement this information and thus improve the estimate of the resource, which can be fed into a digital mine to obtain better mine resource model.
As illustrated above, geophysical borehole logging measurements can be used for coal seam identification and correlation and geotechnical rock mass characterisation. They can also be used for specific coal-quality assessment [6,7,34,35,36,37,38,39]. Zhou and Esterle [37] also investigated ways to improve the coal density and quality estimation from geophysical logs.
There are many ways to derive coal quality parameters from geophysical logs. A common method is to establish the relationships between laboratory derived proximate analysis and multiple geophysical logging parameters so that future coal parameters can be directly estimated from the geophysical logging measurements through established relationships. However, the relationships between coal quality parameters and geophysical logs are not always best represented by simple equations (straight lines) and may instead form curved lines generated by complex equations. This suggests that instead of using a simple correlation approach, a multi-variable analysis (MVA) approach would better deal with the complexity of coal quality parameter estimation and thus will improve the estimation accuracy of these parameters.
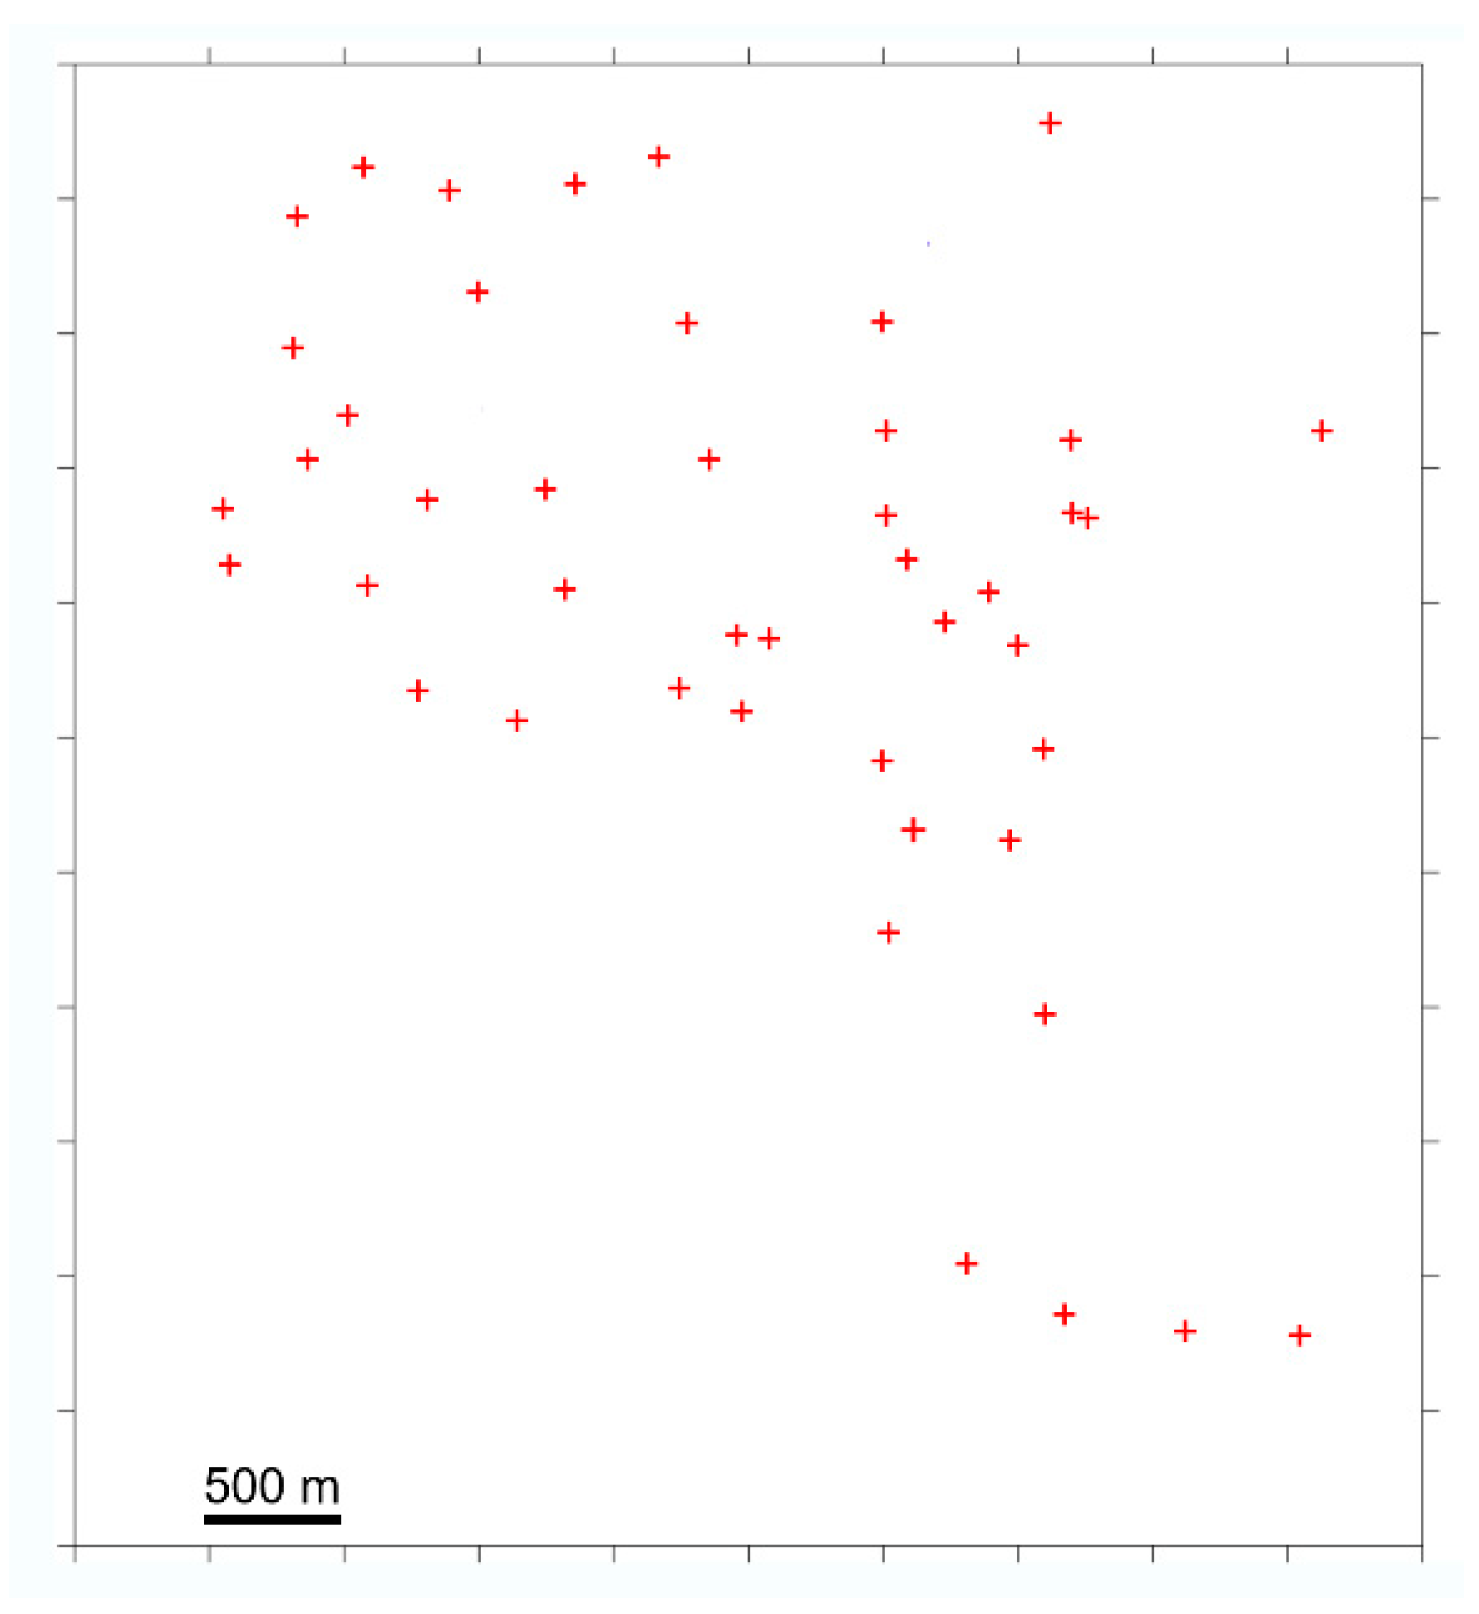
The merits of coal quality parameter estimations using multiple geophysical logs have been demonstrated by Zhou and Esterle [37] and Zhou and O’Brien [7]. Here we will use another example from a mine in New South Wales, Australia, to illustrate the method’s performance. Both geophysical logging and laboratory coal quality proximate analysis data were provided by the mine. There are 1316 coal samples from 39 boreholes. The coal samples are from different seams with variable thickness. The 39 boreholes are distributed from an area of about 5 km × 6.5 km (as shown in Figure 16). The key coal quality parameters provided are air-dry basis relative density RDad, ash content ASHad, fixed carbon FCad, inherent moisture Imad, crucible swelling number CSN, specific energy SEad and volatile matters VMad. The key geophysical logs are GRDE, DENB, DENL, DEPO, MC2F, MC4F, RPOR and GRNP. In these logs, GRDE and GRNP are gamma ray logs from density and neutron loggings, respectively, reflecting the lithology of the coal; DENB and DENL are short- and long-spaced density logs, which have strong correlation with coal ash content; DEPO and RPOR are sandstone-calibrated porosities derived from density and neutron logs; and MC2F and MC4F are 20 cm-spaced and 40 cm-spaced sonic logs, signifying the integrity and the strength of the coal samples.
Based on our analysis of the provided data, the laboratory coal quality measurements exhibit the expected trends and are in good quality. However, the geophysical logs have very poor correlations with the coal quality parameters. The estimated ash from geophysical logs GRDE, DENB and DENL are also poorly correlated the laboratory measurement ASHad. The poor correlations are caused by the reasons investigated by Esterle [37]—many thin samples (<20 cm) that do not match with the geophysical resolution (>15 cm); depth mis-matching between samples and geophysical logs; coal samples taken from thin seams; coal samples taken from boundaries; and borehole cavings. These issues were identified and rectified to ensure the input data to coal quality parameter estimation are of good quality.
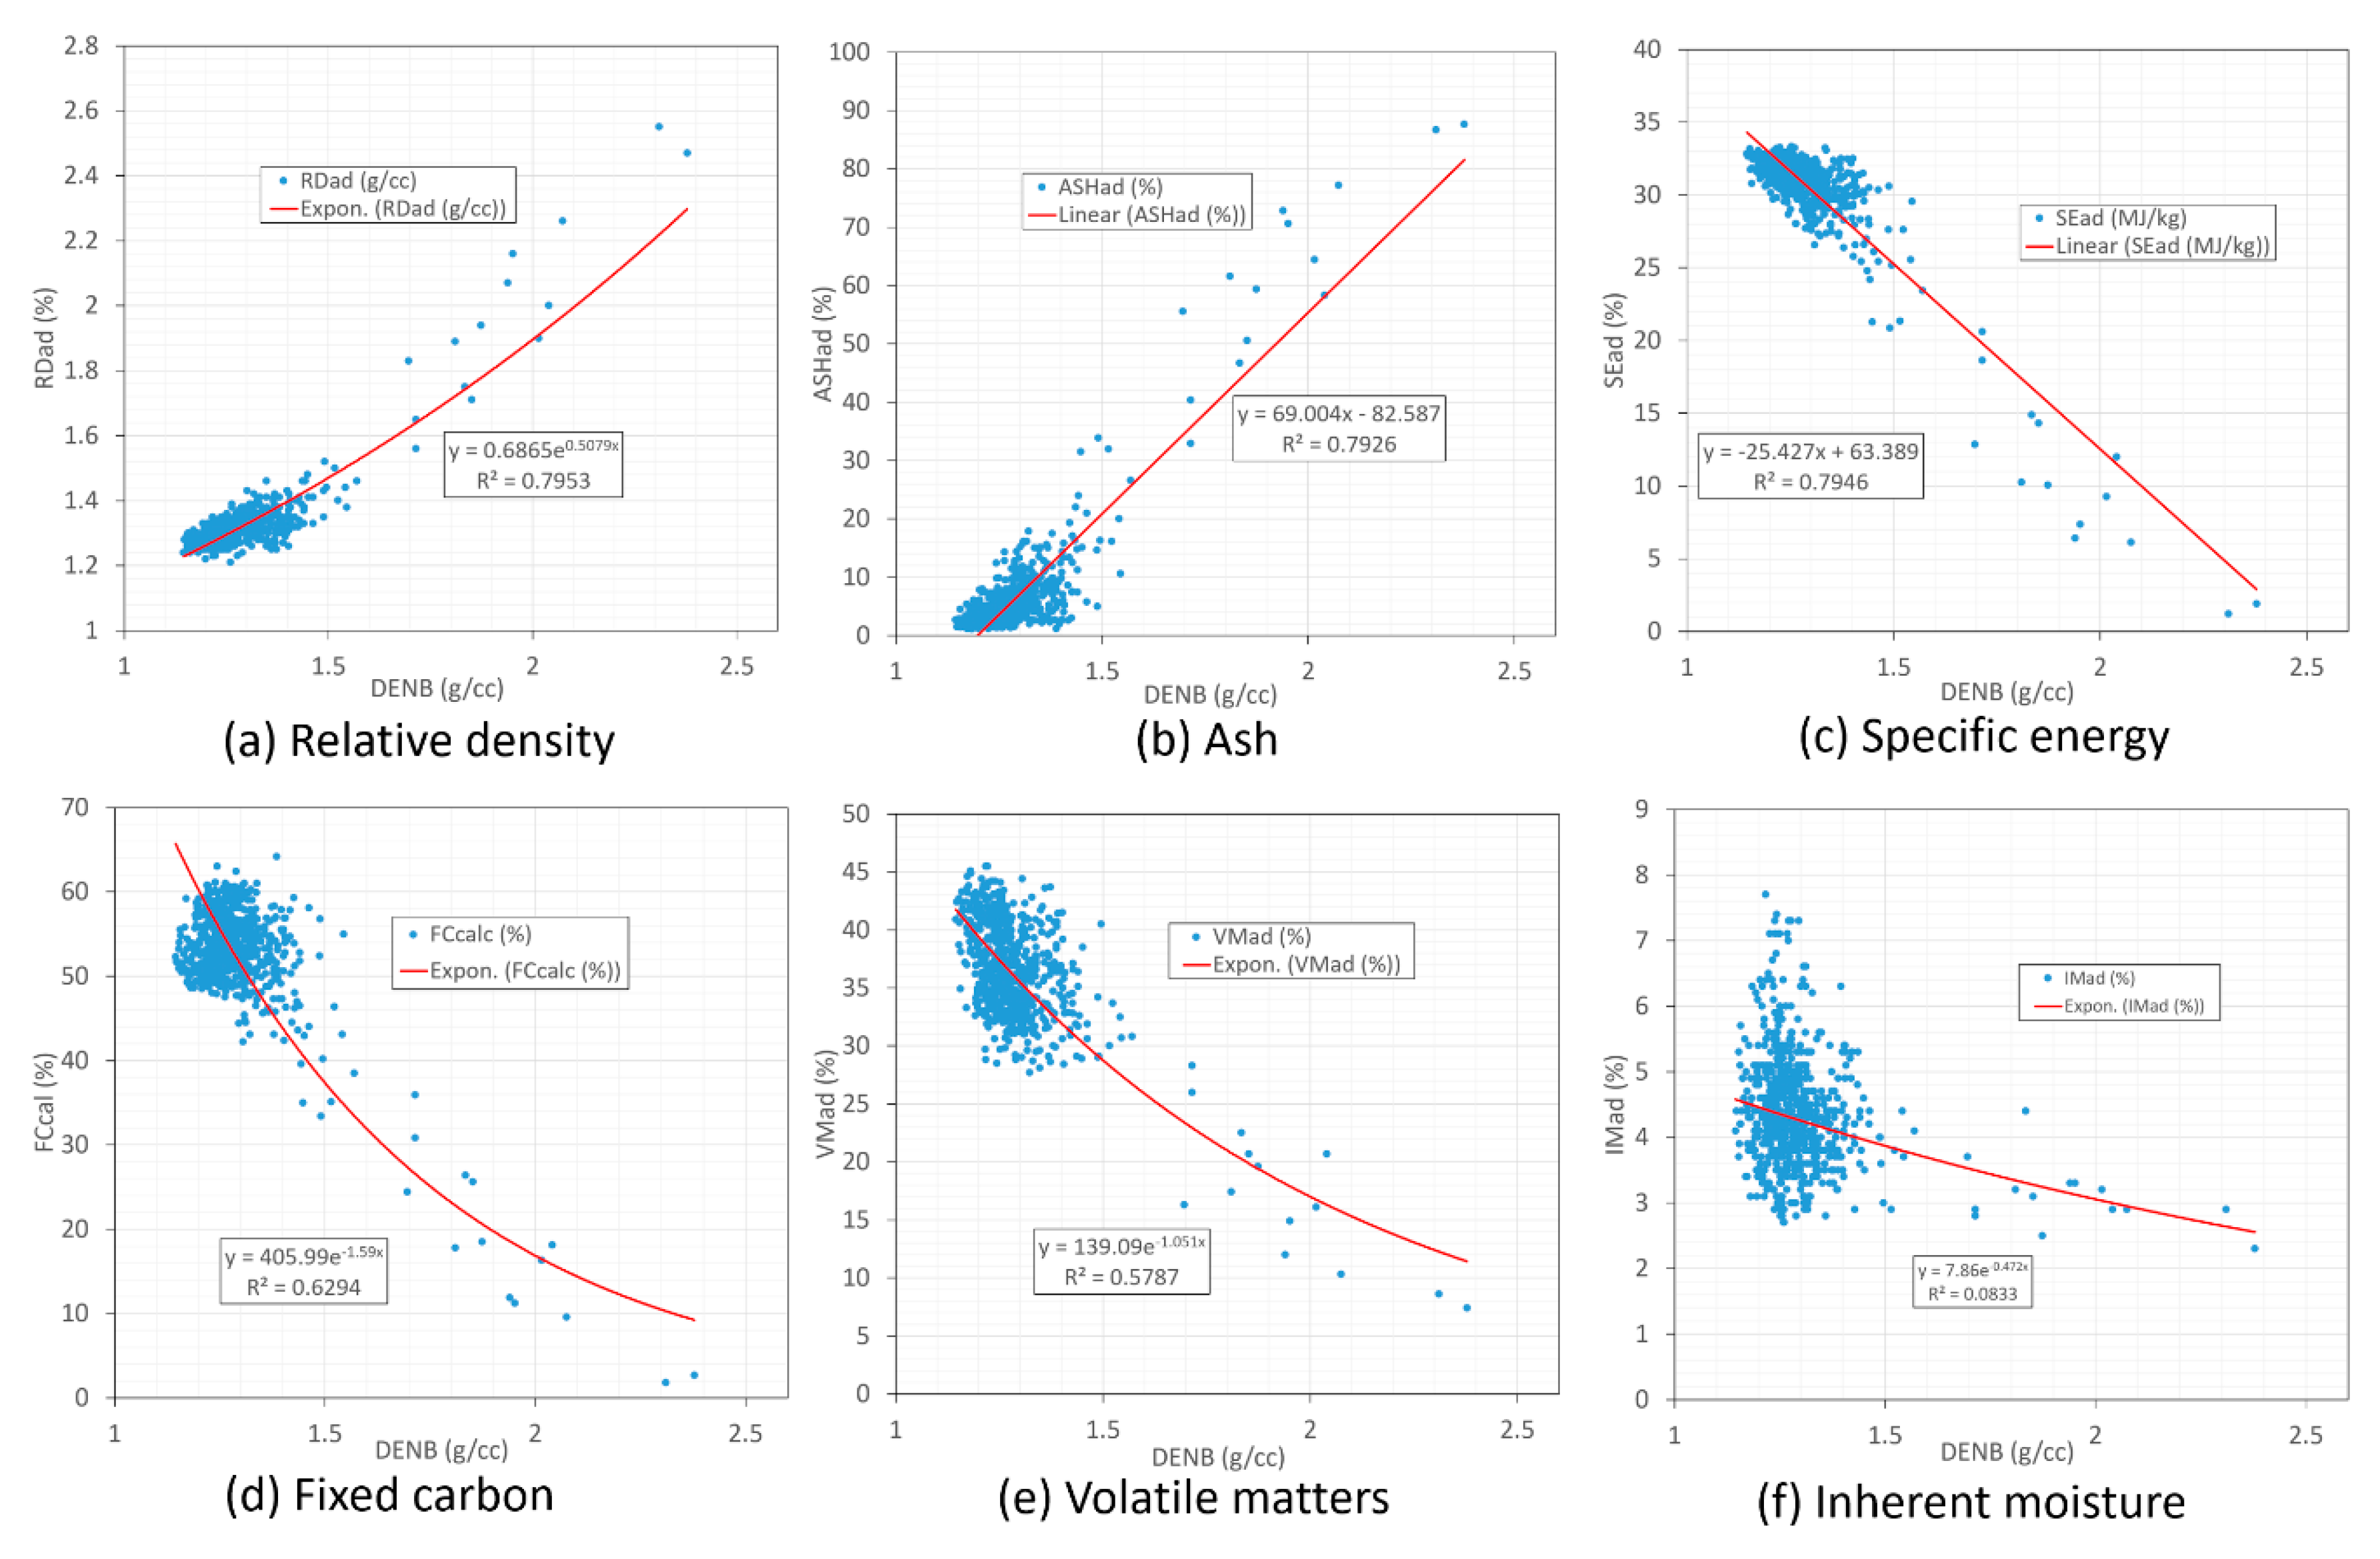
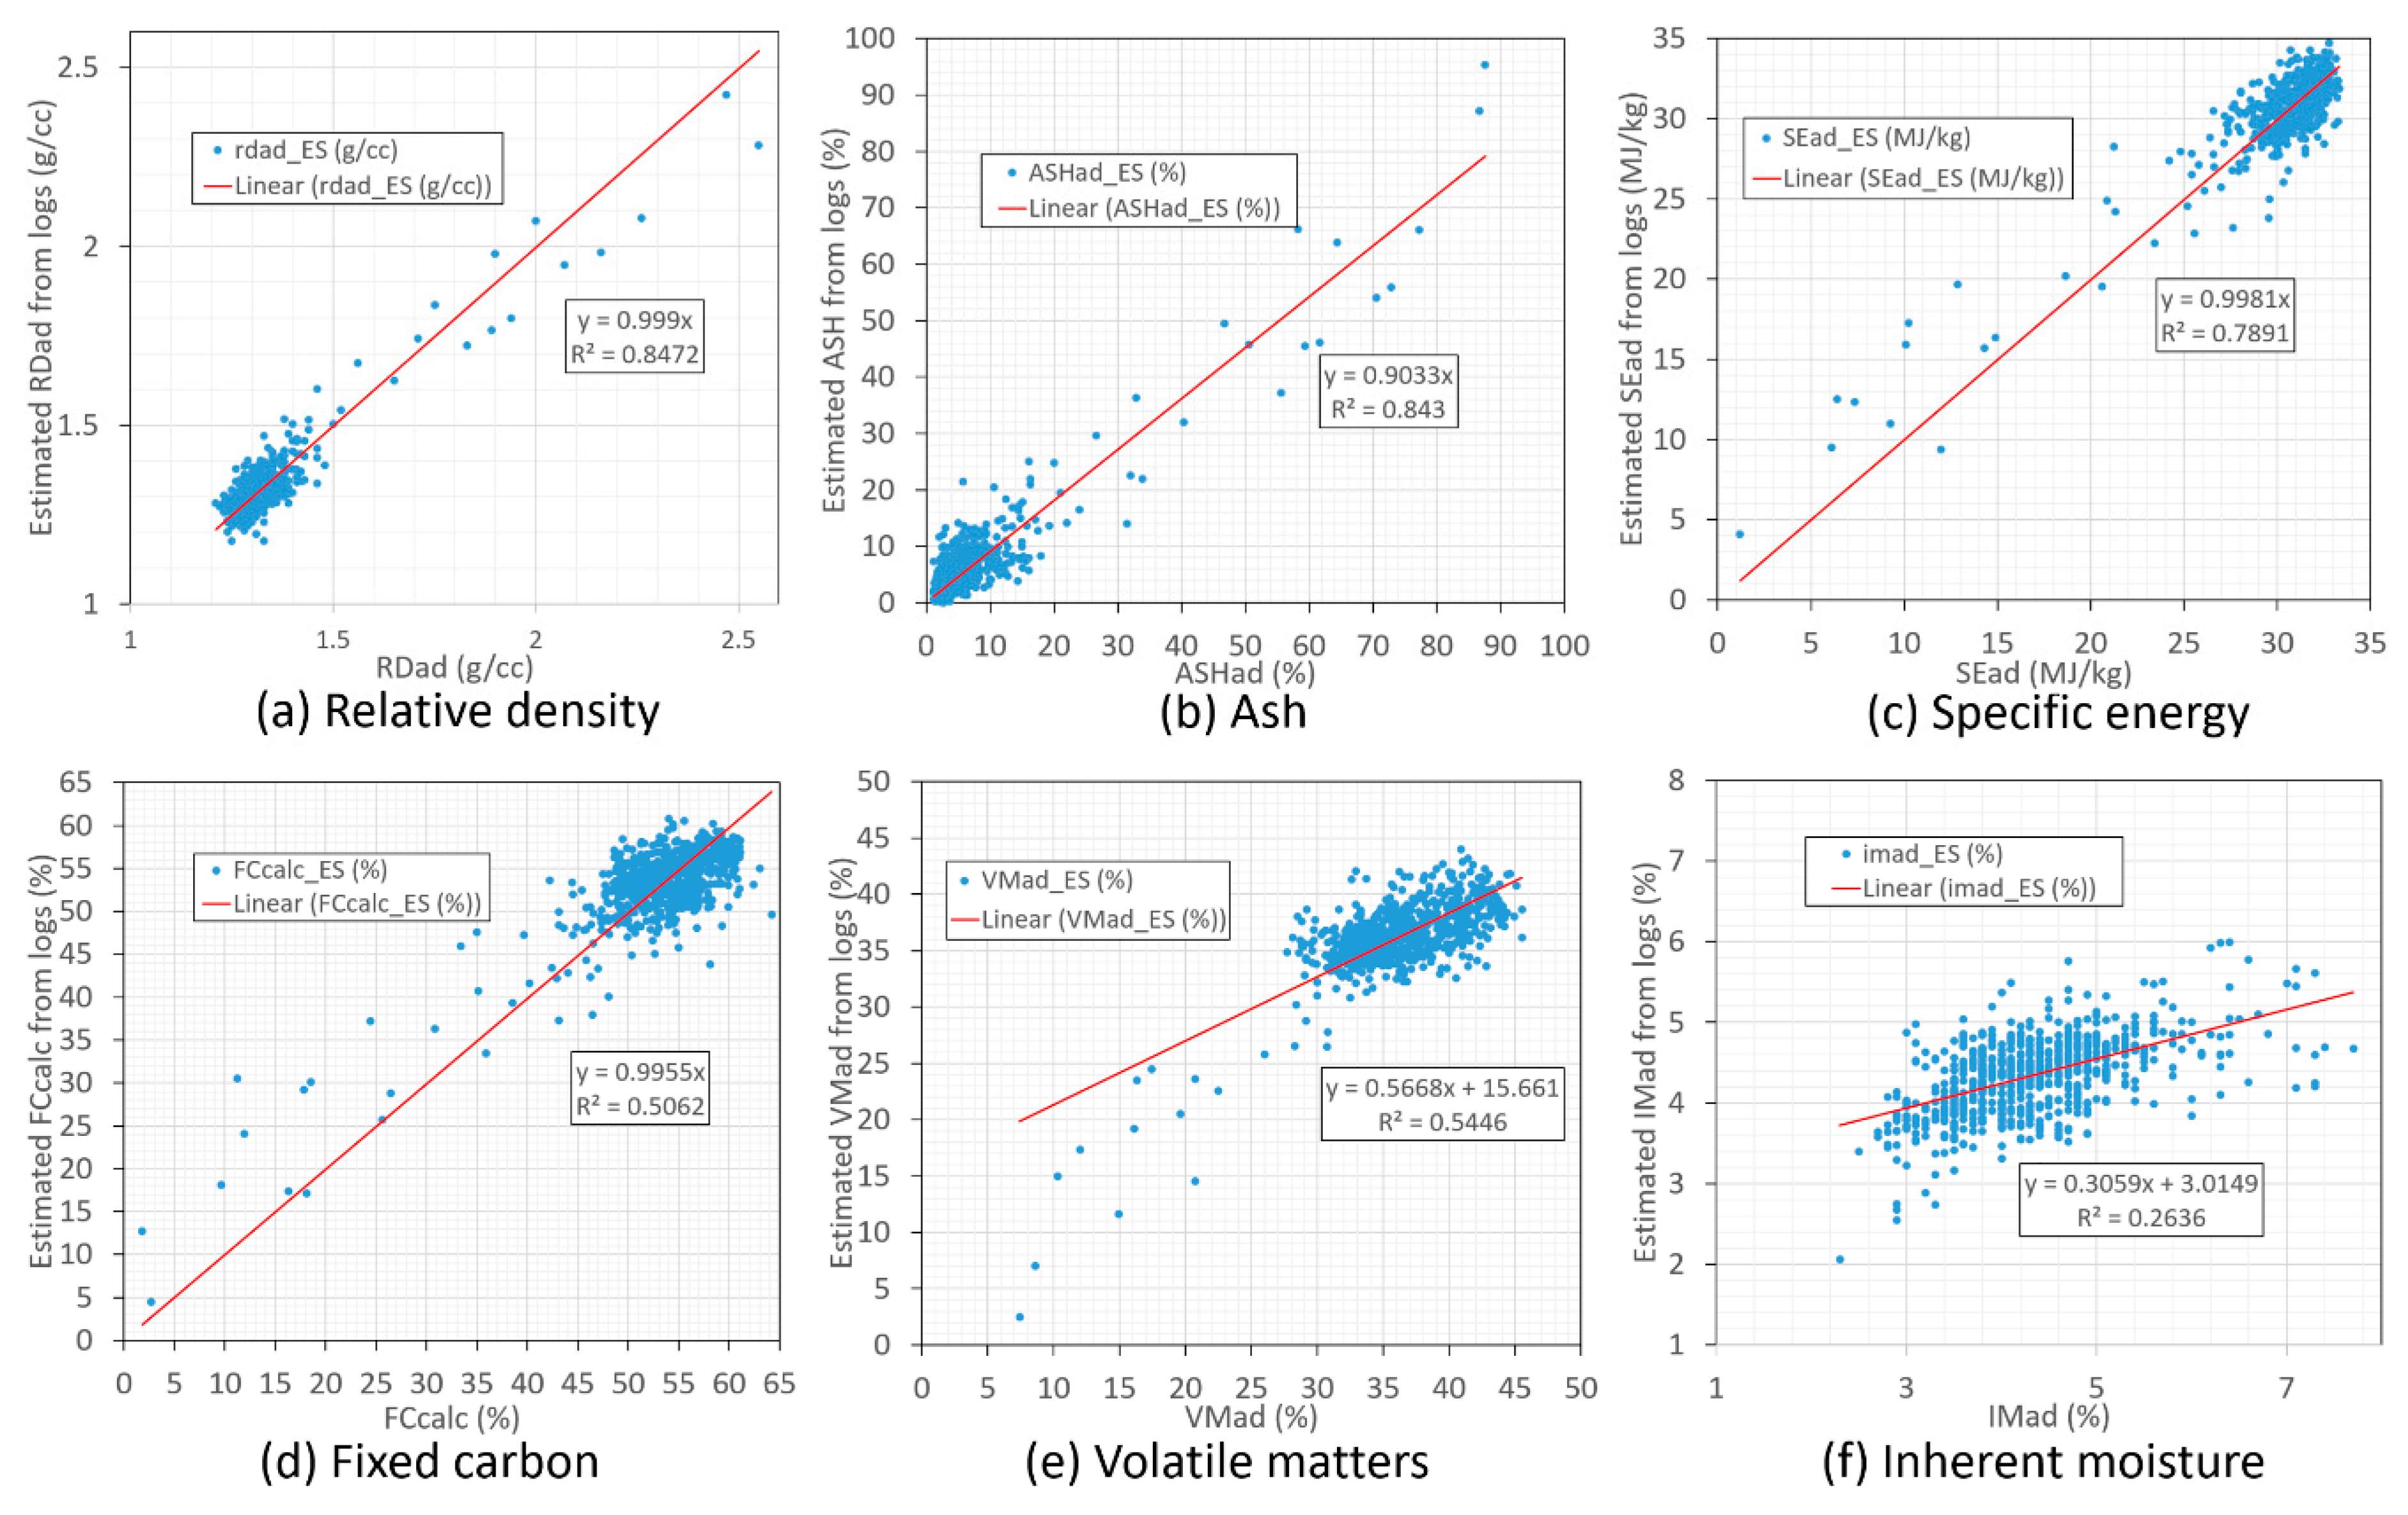
Figure 17 shows the cross-correlations of the coal quality parameters relative density (a), ash (b), specific energy (c), fixed carbon (d), volatile matters (e) and inherent moisture (f) with the geophysical density log DENB. Based on the correlation relationships shown in Figure 17, we used the density log ADEN to estimate the coal quality parameters in Figure 18 and Table 2. In addition to this, we also used multiple geophysical logs to estimate the coal quality parameters. Based on our tests, the optimum geophysical logs for coal quality parameter estimation for this data set are FROM, GRDE, DENB, DEPO and RPOR. In these logs, FROM is the coal sample start depth used as a parameter to differentiate the coal samples from each different seam. The estimated coal quality parameters from these geophysical logs using the leave-one-out cross-validation approach are shown in Figure 19 while the statistics of the estimations are listed in Table 3.
Compared to the estimation results (Table 2) from the single density log DENB, it is clear that the estimated parameters from multiple geophysical logs have smaller average errors (Table 3) in general with comparable correlation coefficients. Significant estimation improvement can be observed for the parameter fixed carbon—the average error is decreased from 10.41% to 7.09% while the correlation coefficient R is increased from 0.56 to 0.71. The correlation of the inherent moisture has also been improved from 0.25 to 0.51. It clearly demonstrates that the importance of multi geophysical logs in coal quality parameter estimation. This is consistent with our previous results shown in Zhou and O’Brien [7] in spite of the fact that incremental improvements here are relatively small.
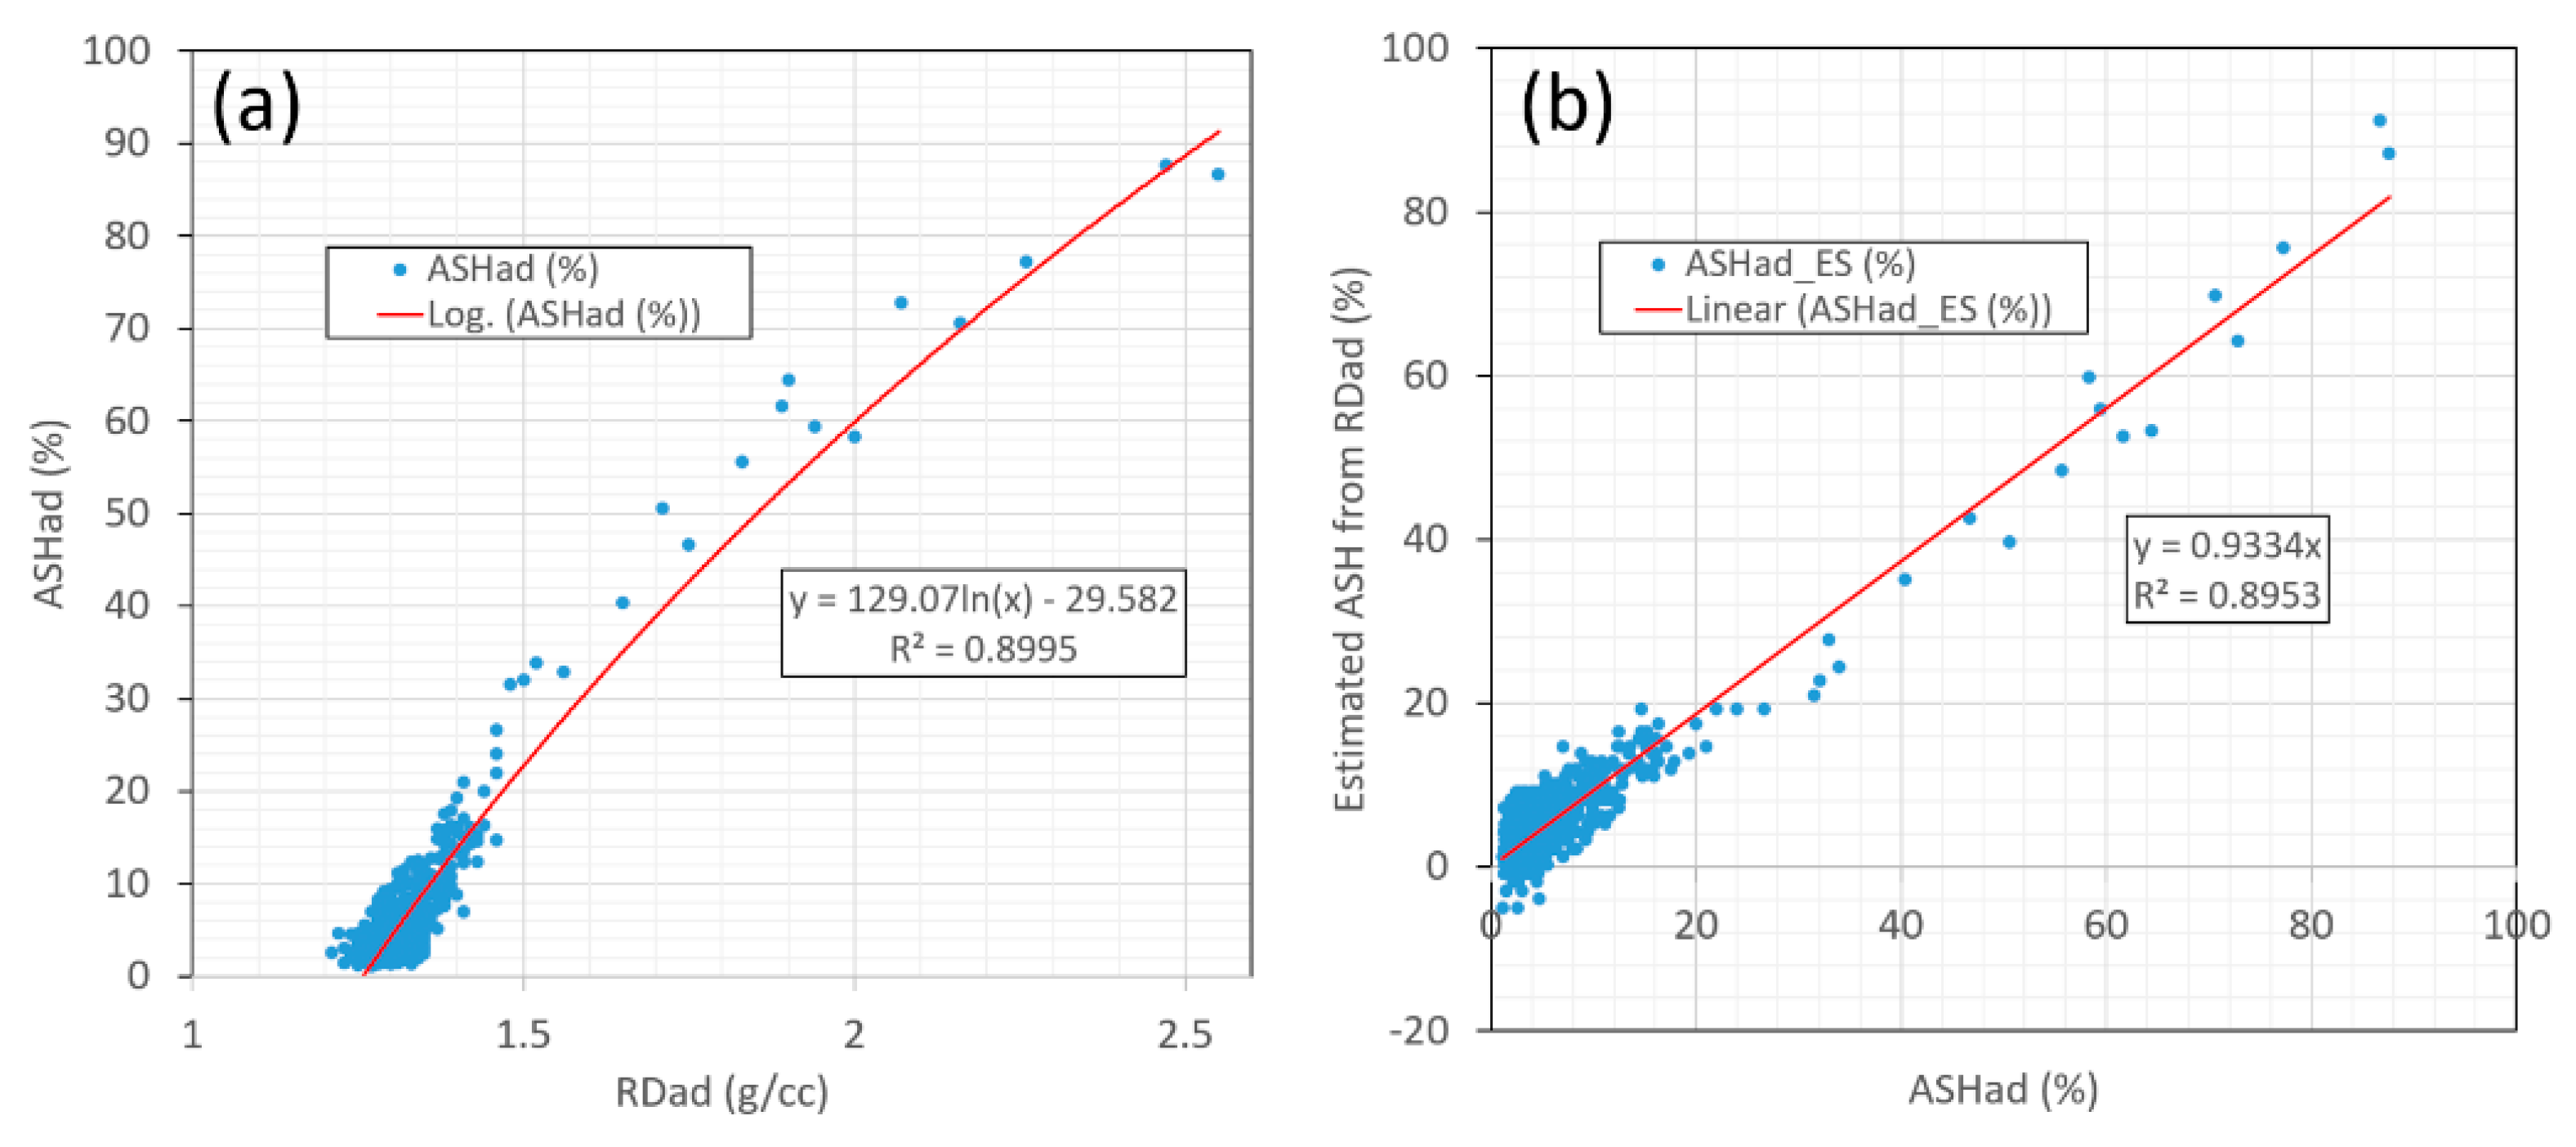
Please note that the relative error of the ash estimation from the multi geophysical logs is 52.2% despite the average absolute error being only 2.48%. The reason is that the majority of the coal samples are from 1–20% (low ash) and the average ash value is only 6.56%. This makes the relative error of the ash estimation high. To verify the above statements, we produced a cross-correlation of the laboratory ASHad and RDad data (Figure 20a) to estimate the ASHad, which is the best correlation for ASHad that can be derived. The estimated ash from RDad are presented in Figure 20b. The estimated relative average error is 59.97% even with a correlation coefficient of 0.95. This suggests that a high relative estimated error for ash is inherited from the low ash contents at this mine.
4. Conclusions
This paper presents various ways to use geophysical borehole logs and their derived parameters as input to digital mine to generate better geological and geotechnical models for safe, productive and beneficial mining operation. It demonstrates the benefits, from reliable geotechnical strata characterization and modelling in coal mines, through to greater utilization of existing and new drill hole geophysical data. The geotechnical strata units and rock strengths predicted from the geophysical logs match with the laboratory tests, drill core strata classification, core photos and the mining condition/behavior. This clearly illustrates the usefulness and effectiveness of geophysical logs for geotechnical characterization. In addition, we have also illustrated the feasibility for improving the accuracy of coal quality parameter estimation using multiple geophysical logs.
It should be noted that automated log interpretation, UCS estimation, rock mass characterization through GSR and coal quality estimation are quantitative analysis of geophysical borehole logging data. Such analyses and interpretations require the geophysical logging data to be of high quality. A pre-requisite for any form of quantitative analysis is the consistency of the borehole logs, from hole to hole, from year to year and from one service provider to another, while absolute accuracy of the log itself is, in general, less important. Logging data quality improvement and control can be achieved by establishing calibration boreholes for checking the logging equipment and developing log quality control procedures and criteria for newly-acquired data. This will ensure fewer misleading interpretations based on erroneous data, improve mine models incorporating quantitative information from borehole logging data and hence enhance productivity and reduce risks.
In addition, to ensure the demonstrated applications are used by the industry, geologists and geotechnical engineers in the coal mining industry need taking a proactive approach to study the methods described here and begin to put them into practice. The collective understanding and experiences of these applications can only help fuel the drive to take the benefits of geophysical logging to greater levels.
Author Contributions
B.Z. conceptualized and prepared the manuscript. H.G. analyzed and validated part of the data. All authors have read and agreed to the published version of the manuscript.
Funding
The work reported here is an outcome of many research projects supported mainly by the Australia Coal Association Research Program (ACARP) and its associated Australian coal mining companies. Besides many Australian supporting coal mining companies, through collaboration, the Singareni Collieries Company Limited has also provided geophysical logging, geological and geotechnical data used in this paper.
Acknowledgments
The authors would like to cordially acknowledge the professional contributions and support to the work reported here offered by the following colleagues Peter Hatherly, Peter Fullagar, Terry Medhurst, Joan Esterle, Graham O’Brien, Uday Bhaskar, Peter Chern, Greg Poole, Mark Biggs, Andy Willson, Doug Dunn, Ken Preston, Wes Nichols and Roland Turner.
Conflicts of Interest
The authors declare no conflict of interest.
References
- Kayal, J.R. Electrical and gamma-ray logging in Gondwana and Tertiary coalfields of India. Geol. Explor. 1979, 17, 243–258. [Google Scholar]
- Hofman, G.L.; Jordan, G.R.; Wallis, G.R. Geophysical Borehole Logging Handbook for Coal Exploration; The Coal Mining Research Centre: Edmonton, Alberta, 1982; ISBN 0969104804. [Google Scholar]
- Hatherly, P.J. Overview on the application of geophysics in coal mining. Int. J. Coal Geol. 2013, 114, 74–84. [Google Scholar] [CrossRef]
- Fullagar, P.K.; Fallon, G.N. Geophysics in metalliferous mines for orebody delineation and rock mass characterization. In Proceedings of the Exploration’97—Fourth Decennial International Conference on Mineral Exploration, Toronto, ON, Canada, 14–18 September 1997; Gubins, A.G., Ed.; pp. 573–584. [Google Scholar]
- Fullagar, P.K.; Zhou, B.; Fallon, G.N. Automated interpretation of geophysical borehole logs for orebody delineation and grade estimation. Miner. Resour. Eng. 1999, 8, 269–284. [Google Scholar] [CrossRef]
- Fallon, G.; Fullagar, P.K.; Zhou, B. Towards grade estimation via automated interpretation of geophysical borehole logs. Explor. Geophys. 2000, 31, 236–242. [Google Scholar] [CrossRef]
- Zhou, B.; O’Brien, G. Improving coal quality estimation through multiple geophysical log analysis. Int. J. Coal Geol. 2016, 167, 75–92. [Google Scholar] [CrossRef]
- McNally, G.H. The prediction of geotechnical rock properties from sonic and neutron logs. Explor. Geophys. 1990, 21, 65–71. [Google Scholar] [CrossRef]
- Guo, H.; Zhou, B.; Poulsen, B.; Biggs, M. 3D overburden geotechnical characterization for longwall mining at Southern Colliery. In Proceedings of the Bowen Basin Symposium, Rockhampton, Queensland, Australia, 22–24 October 2000; pp. 67–72. [Google Scholar]
- Zhou, B.; Guo, H.; Hatherly, P.; Poulsen, B. Automated geotechnical characterisation from geophysical logs: Examples from Southern Colliery, Central Queensland. Explor. Geophys. 2001, 32, 336–339. [Google Scholar] [CrossRef]
- Zhou, B.; Fraser, S.; Borsaru, M.; Aizawa, T.; Sliwa, R.; Hashimoto, T. New approaches for rock strength estimation from geophysical logs. In Proceedings of the Bowen Basin Symposium, Yeppoon, Queensland, Australia, 12–14 October 2005; pp. 151–164. [Google Scholar]
- Hatherly, P. Rock Strength Assessment from Geophysical Logging. In Proceedings of the 8th International Symposium on Borehole Geophysics for Minerals, Geotechnical and Groundwater Applications, Toronto, ON, Canada, 21–23 August 2002. [Google Scholar]
- Medhurst, T.; Hatherly, P.; Zhou, B. 3D geotechnical models for coal and clastic rocks based on the GSR. In Proceedings of the 2002 Coal Operators’ Conference, Wollongong, Australia, 11–12 February 2010. [Google Scholar]
- Guo, H.; Zhou, B. Geotechnical characterisation from geophysical logs for longwall coal mining. In Proceedings of the 73rd EAGE Conference & Exhibition incorporating SPE EUROPEC 2011, Vienna, Austria, 23–26 May 2011. [Google Scholar]
- Kitzig, M.C.; Kepic, A.; Kieu, D.T. Testing cluster analysis on combined petrophysical and geochemical data for rock mass classification. Explor. Geophys. 2017, 48, 344–352. [Google Scholar] [CrossRef] [Green Version]
- Schön, J.H. Physical Properties of Rocks: Fundamentals and Principles of Petrophysics, 2nd ed.; Elsevier Science Ltd.: Amsterdam, The Netherlands, 2015. [Google Scholar]
- Lawrence, W. Interpreting and understanding strata behaviour. In Proceedings of the 2nd Annual Longwall Mining Summit, Yeppoon, Australia, 25–26 February 1999. [Google Scholar]
- Ward, B. German Creek Mines Rock strength from velocity logs. 1988; Unpublished report for Capricorn Coal Management Pty Ltd. [Google Scholar]
- Turvey, C.; Hanna, P. Coal Geology—Where to from here? In Proceedings of the 1998 Coal Operators’ Conference, Wollongong, Australia, 18–20 February 1998; pp. 126–132. [Google Scholar]
- Payne, D.A. Crinum Mine, 15 Longwalls 40 Million Tonnes 45 Roof Falls-What did we learn? In Proceedings of the 2008 Coal Operators’ Conference, Wollongong, Australia, 14–15 February 2008; Aziz, N., Ed.; University of Wollongong: Wollongong, Australia, 2008; pp. 22–43. [Google Scholar]
- Stam, S.; Guy, G.; Gordon, N. Back analysis of roof classification and roof support systems at Kestrel North. In Proceedings of the 2012 Coal Operators’ Conference, Wollongong, Australia, 16–17 February 2012; pp. 42–51. [Google Scholar]
- Pell, S.; Seedsman, R.; Straub, K. Geotechnical data from geophysical logs: Stress, strength and joint patters in NSW and QLD coalfields. In Proceedings of the 2014 Coal Operators’ Conference, Wollongong, Australia, 12–14 February 2014; pp. 25–33. [Google Scholar]
- Oyler, D.C.; Mark, C.; Molinda, G.M. In situ estimation of rock strength using sonic logging. Int. J. Coal Geol. 2010, 83, 484–490. [Google Scholar] [CrossRef]
- Rao, M.S.; Bhaskar, G.U.; Karekal, S. Estimation of Uniaxial Compressive Strength of Coal Measures of Pranhita-Godavari Valley, India Using Sonic Logs. In Proceedings of the 2015 Coal Operators’ Conference, Wollongong, Australia, 11–13 February 2015; pp. 36–47. [Google Scholar]
- MacGregor, S. Maximising In-Situ Stress Measurement Data from Borehole Breakout using Acoustic Scanner and Wireline Tools; Final Report for ACARP Project C1009; ACARP: Brisbane, Australia, 2003. [Google Scholar]
- Chang, C. Empirical rock strength logging in boreholes penetrating sedimentary formations. Geol. Earth Environ. Sci. 2004, 7, 174–183. [Google Scholar]
- Hatherly, P.; Sliwa, R.; Turner, R.; Medhurst, T. Quantitative Geophysical Log Interpretation for Rock Mass Characterization; Final Report ACARP Project C11037; ACARP: Brisbane, Australia, 2003. [Google Scholar]
- Hatherly, P.; Medhurst, T. MacGregor. Geophysical Strata Rating; Final Report ACARP Project C15019; ACARP: Brisbane, Australia, 2008. [Google Scholar]
- Molinda, G.M.; Mark, C. Coal mine roof rating (CMRR). In A Practical Rock Mass Classification for Coal Mines 9387; United States Department of the Interior, Bureau of Mines, Information Circular: Pittsburgh, PA, USA, 1994; p. 34. [Google Scholar]
- Bieniawski, Z.T. Engineering Rock Classifications, a Complete Manual for Engineers and Geologists in Mining, Civil and Petroleum Engineering; Wiley: New York, NY, USA, 1989. [Google Scholar]
- Hatherly, P.; Medhurst, T.; Zhou, B. Geotechnical evaluation of coal deposits based on the Geophysical Strata Rating. Int. J. Coal Geol. 2016, 163, 72–86. [Google Scholar] [CrossRef]
- Medhurst, T.; Hatherly, P.; Zhou, B.; Ye, G. Application of the Geophysical Strata Rating in Production Settings; Final Report for ACARP Project C17009; ACARP: Brisbane, Australia, 2009. [Google Scholar]
- Borsaru, M.; Zhou, B.; Aizawa, T.; Karashima, T.; Hashimoto, H. Automated lithology prediction from PGNAA and other geophysical logs. Appl. Radiat. Isot. 2006, 64, 272–282. [Google Scholar] [CrossRef]
- Edwards, K.W.; Banks, K.M. A theoretical approach to the evaluation of in-situ coal. Can. Min. Metall. Bull. 1978, 71, 124–131. [Google Scholar]
- Borsaru, M.; Charbicinski, J.; Rojc, A.; Thanh, N.D.; Tuy, N.T. Probe for determination of ash in coal stockpiles. Nucl. Instrum. Methods Phys. Res. 2004, 213, 422–425. [Google Scholar] [CrossRef]
- Dong, H.; Hou, J.; Li, N.; Wang, H. The logging evaluation method for coal quality and methane. Geophys. Geochem. Explor. 2001, 25, 138–143. [Google Scholar]
- Zhou, B.; Esterle, J. Toward improved coal density estimation from geophysical logs. Explor. Geophys. 2008, 39, 124–132. [Google Scholar] [CrossRef]
- Borsaru, M.; Ceravolo, C. A low activity spectrometric gamma-gamma borehole logging tool for the coal industry. Nucl. Geophys. 1994, 8, 343–350. [Google Scholar]
- Charbucinski, J.; Nichols, W. Application of spectrometric nuclear borehole logging for reserves estimation and mine planning at Callide coalfields open-cut mine. Appl. Energy 2003, 74, 313–322. [Google Scholar] [CrossRef]
Figure 1.
Comparison of the sonic log derived unconfined compressive strength (UCS) and the laboratory measured UCS for borehole DD0412 (a) and DD403 (b) at Southern Colliery, Australia. Plots (c) and (d) are the cross correlations of the sonic and the laboratory UCSs for DD0412 and DD403, respectively.

Figure 2.
The acoustic scanner amplitude image from Kakatiya (India) borehole KTK736 plotted along with the raw density counts (red), gamma ray (green) and average amplitude (blue). The color of the image indicates the rock strength: dark color for weak strata and light color for strong strata.
Figure 2.
The acoustic scanner amplitude image from Kakatiya (India) borehole KTK736 plotted along with the raw density counts (red), gamma ray (green) and average amplitude (blue). The color of the image indicates the rock strength: dark color for weak strata and light color for strong strata.

Figure 3.
Acoustic scanner data indicate the breakout at the depth 283.2–283.9 m (a) along N110° and caving of clay at the depth 284.37–285.55 m of the Barren Measures from Adriyala borehole 1199. The middle part of clay shows a NW-SE trend at 284.9 m from Cross Section plot and the zoomed 3-D views of portions-a & b are shown on the right.

Figure 4.
A comparison of the minor and major stress directions determined from the acoustic scanner breakout analysis and the in-situ hydrofracturing stress tests, respectively. These two independently determined directions are orthogonal, which supports each other independently. The hydrofracturing tests were performed at Adriyala Mine, India.

Figure 5.
Core photograph (left), acoustic scanner log (middle) and full waveform sonic log (right) from the same section of a cored borehole from the Illawarra area, New South Wales, Australia.
Figure 5.
Core photograph (left), acoustic scanner log (middle) and full waveform sonic log (right) from the same section of a cored borehole from the Illawarra area, New South Wales, Australia.

Figure 6.
Geophysical logs from a Westcliff borehole in New South Wales. Shown in order from the left to the right: Geological log, gamma ray, sonic log, estimated UCS, full waveform sonic, total energy of FWS and porosity from sonic log.
Figure 6.
Geophysical logs from a Westcliff borehole in New South Wales. Shown in order from the left to the right: Geological log, gamma ray, sonic log, estimated UCS, full waveform sonic, total energy of FWS and porosity from sonic log.

Figure 7.
Possible fractures presented on full waveform sonic log.

Figure 8.
Full-waveform sonic data showing P-wave, S-wave, Stoneley wave and scattering. The left plot is the original data from receiver 1 from Kakatiya borehole KK736 while the right plot is the enhanced scattering waves after filtering out the P-, S- and Stoneley waves by a 7-point vertical averaging filter.

Figure 9.
The estimated porosity (light blue) from density and clay (maroon) from natural gamma logs for the KTK boreholes 769, 766 and 763. The black bands are coal seams. The arrow indicates the same seam lined up. The blue bands indicate dense material (density > matrix density) while the green bands are volcanic tuff bands.

Figure 10.
The estimated porosity (light blue) from density and clay (maroon) from resistivity for the KTK boreholes 769, 766 and 763. The arrow indicates the same seam lined up. The blue bands indicate dense materials such as siderite and basalts while the green bands are volcanic tuff bands.
Figure 10.
The estimated porosity (light blue) from density and clay (maroon) from resistivity for the KTK boreholes 769, 766 and 763. The arrow indicates the same seam lined up. The blue bands indicate dense materials such as siderite and basalts while the green bands are volcanic tuff bands.

Figure 11.
Comparison of the calculated sonic velocities (brown and maroon) from estimated porosity and clay content in Figure 9 and Figure 10 with the measured sonic velocities (blue) for the KTK boreholes 769, 766 and 763. The blue bands indicate dense materials such as siderite and basalts while the green bands are volcanic tuff bands.

Figure 12.
The estimated geophysical strata rating (GSR) for the KTK boreholes 769, 766 and 763. The blue bands indicate dense materials such as siderite and basalts while the green bands are volcanic tuff bands.
Figure 12.
The estimated geophysical strata rating (GSR) for the KTK boreholes 769, 766 and 763. The blue bands indicate dense materials such as siderite and basalts while the green bands are volcanic tuff bands.

Figure 13.
Sonic velocity distribution (right) along the tailgate (the red line on the left plot). The cross section was cut out from the 3D sonic velocity model; interpolated using coal seams (GM, PL, PU and GU) constrained interpolation of sonic logs from 12 boreholes along the maingate and tailgate at the Moranbah Mine. The strong sandy units correlate with high velocity.

Figure 14.
LogTrans interpretation of a control borehole. Shown in order from the left to the right: the original geological core log, reconciled geological log, LogTrans prediction of the rock classes and SIROLOG derived parameters used in the interpretation (natural gamma ray, density, K, U and TH). The key rock types including the sugar sands have been largely identified from the SIROLOG data.

Figure 15.
Strata interpretation for borehole DD0412. The first column is the geotechnical strata classification determined from core photos. The second column is the LogTrans interpretation from the geophysical logs presented in the other columns. The left plot shows the comparison of LogTrans interpretation with core photographs for part of the hole.

Figure 16.
The borehole (red crosses) spatial distribution of coal quality and geophysical logging data from a mine site in New South Wales.
Figure 16.
The borehole (red crosses) spatial distribution of coal quality and geophysical logging data from a mine site in New South Wales.

Figure 17.
Cross-correlations of coal quality parameters with the geophysical log DENB: (a) relative density, (b) ash, (c) specific energy, (d) fixed carbon, (e) volatile matters and (f) inherent moisture. The R2 in each plot represents the cross-correlation coefficient of the estimated parameters with respect to the corresponding laboratory measured parameter.

Figure 18.
The cross-plots of the laboratory coal quality parameters with the corresponding coal quality parameters estimated from geophysical density log DENB: (a) relative density, (b) ash, (c) specific energy, (d) fixed carbon, (e) volatile matters and (f) inherent moisture.
Figure 18.
The cross-plots of the laboratory coal quality parameters with the corresponding coal quality parameters estimated from geophysical density log DENB: (a) relative density, (b) ash, (c) specific energy, (d) fixed carbon, (e) volatile matters and (f) inherent moisture.
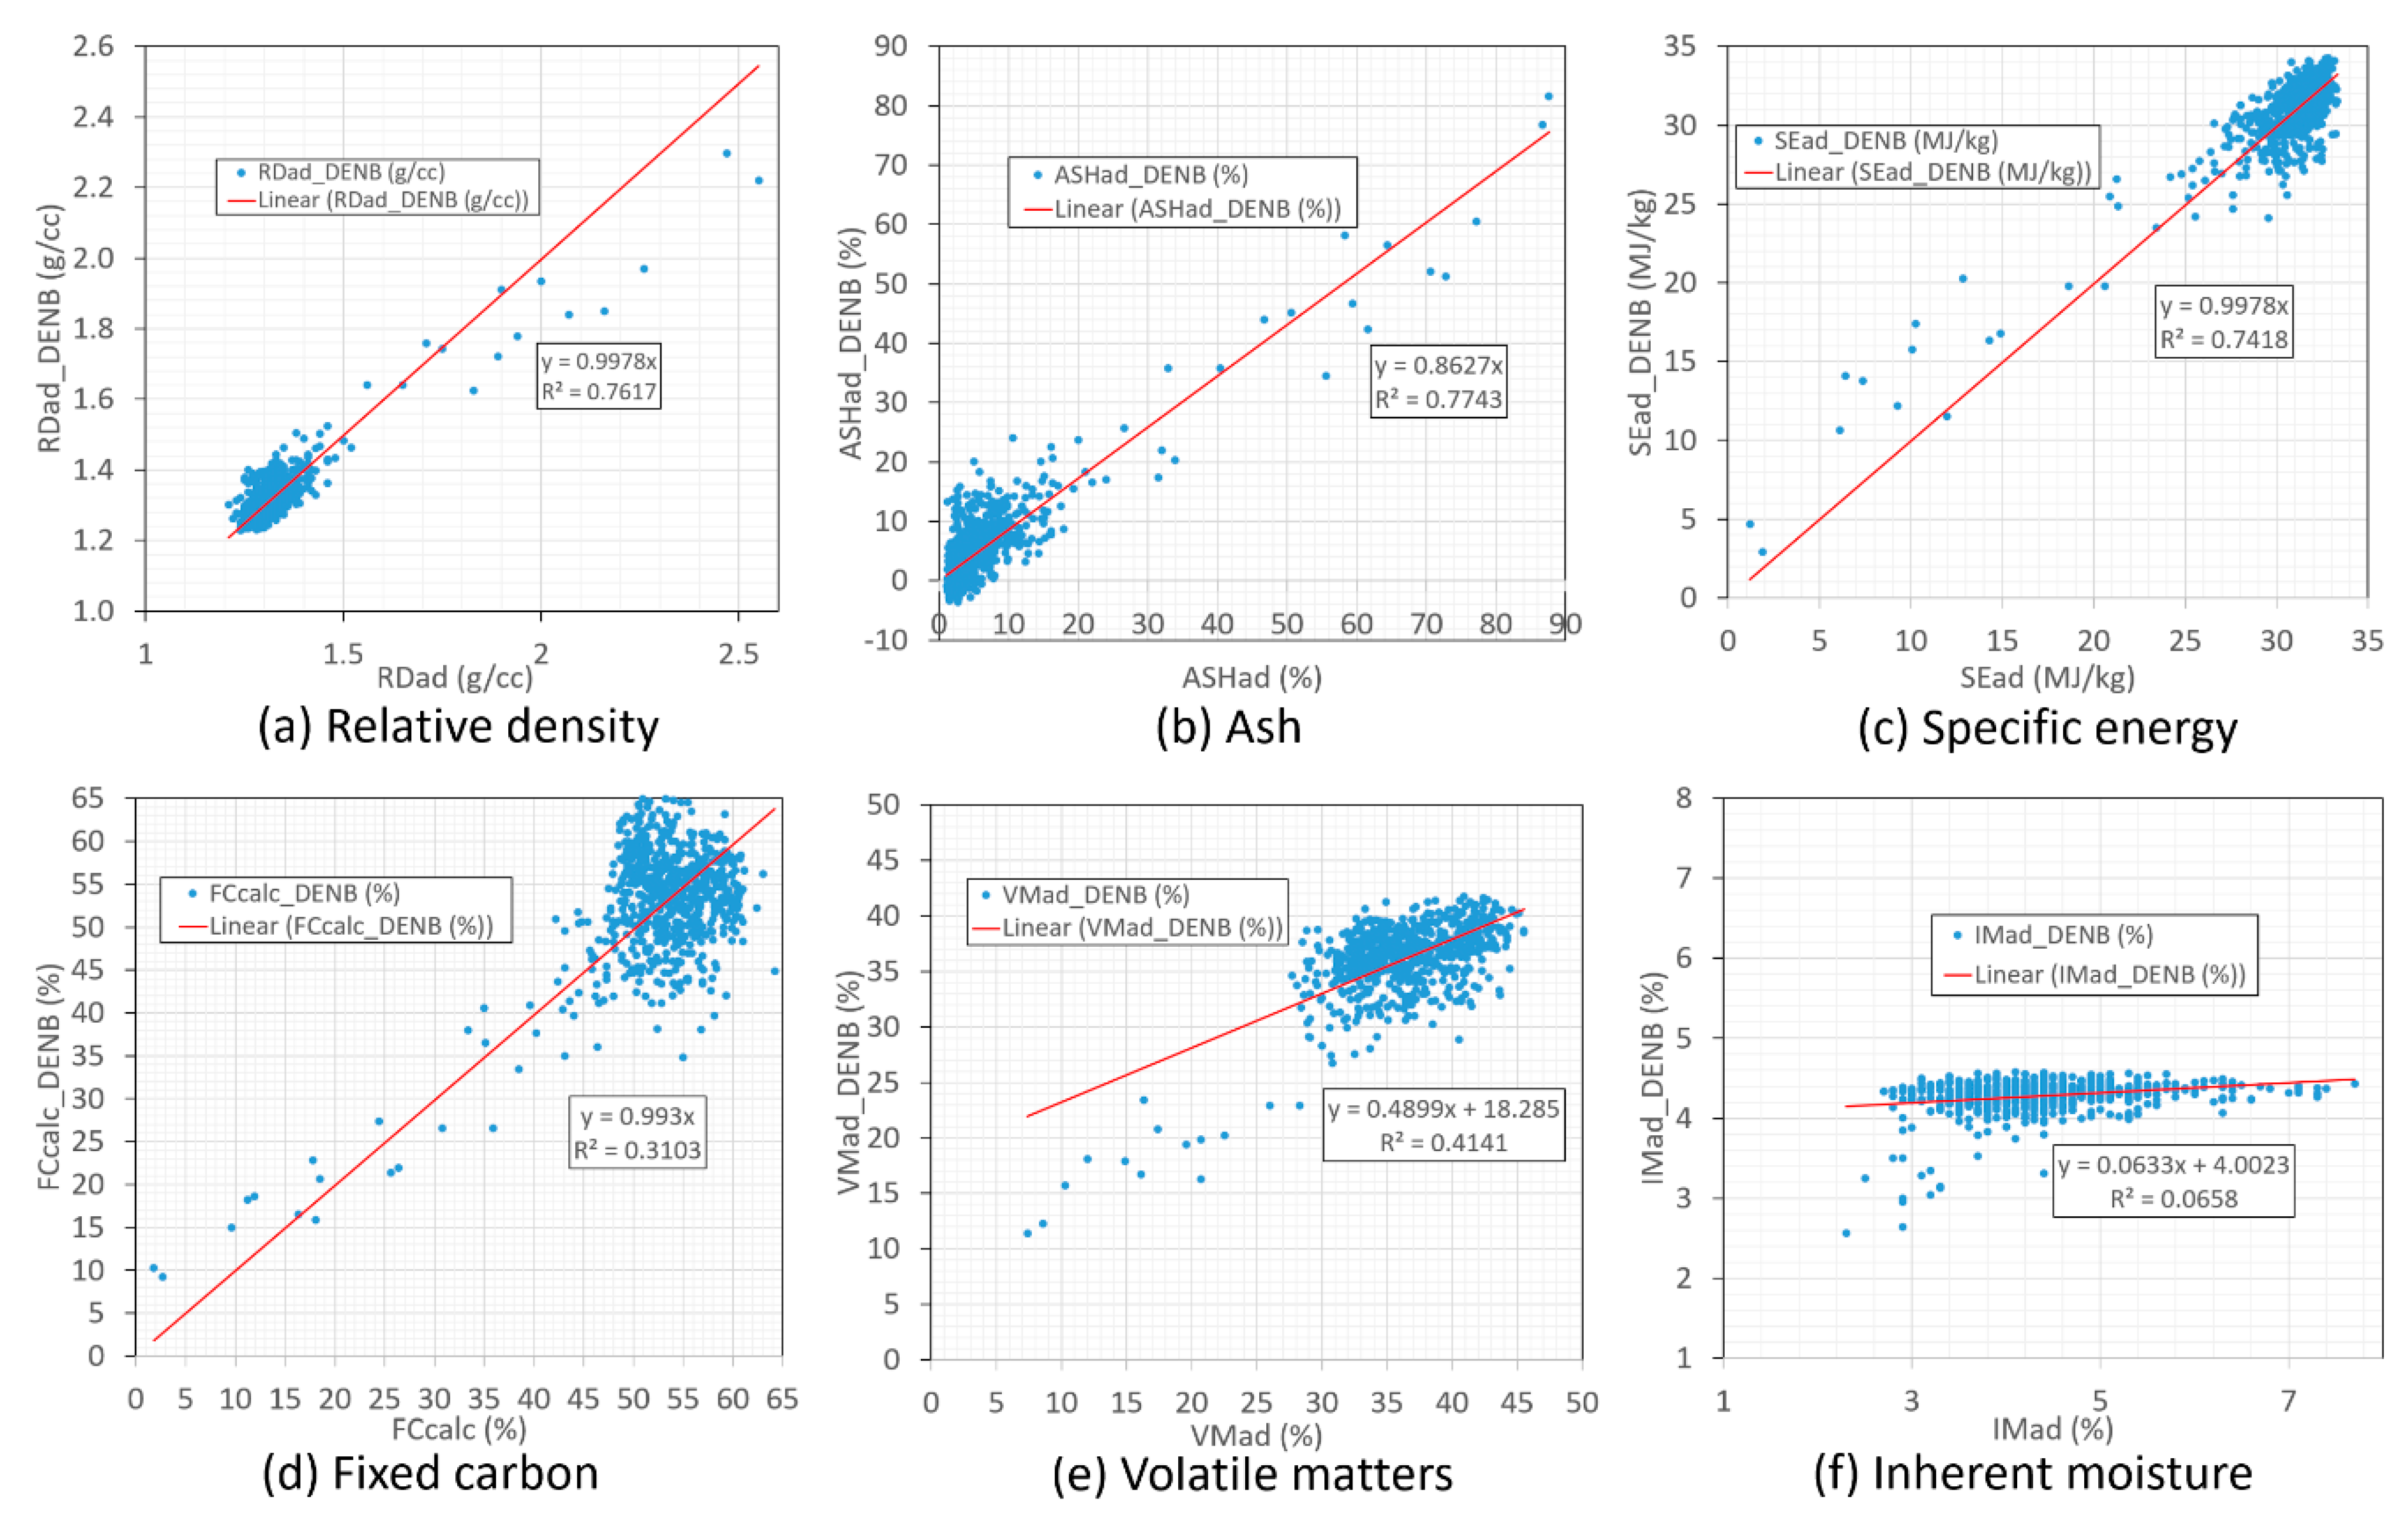
Figure 19.
The cross-plots of the laboratory coal quality parameters with the corresponding coal quality parameters estimated from multi geophysical logs: FROM, GRDE, DENB, DEPO & RPOR: (a) relative density, (b) ash, (c) specific energy, (d) fixed carbon, (e) volatile matters and (f) inherent moisture..

Figure 20.
Estimation of ash contents from RDad. (a) The cross-correlation of ASHad and RDad; (b) The cross-correlation of the estimated ASHad from RDad with the true ASHad.
Figure 20.
Estimation of ash contents from RDad. (a) The cross-correlation of ASHad and RDad; (b) The cross-correlation of the estimated ASHad from RDad with the true ASHad.


Table 1.
Interpreted fractures from full waveform sonic data.
| Depth from | Depth to | Fracture Description |
|---|---|---|
| 250.5 | 253.6 | Closed fractures |
| 257 | 258 | Open fractures |
| 273 | 274.5 | Open fractures |
| 288.16 | 289 | Tight fractures |
| 289.9 | 292.5 | Tight fractures in Siltstone |
| 304 | 305.6 | Closed fractures |
| 312 | 312.8 | Closed fractures |
| 316.9 | 317.9 | Closed fractures |
| 323.6 | 324.8 | Closed Fractures |
| 326.3 | 328.4 | Closed Fractures |
| 337.3 | 339.7 | Closed Fractures |
| 350.6 | 355 | Closed Fractures |
| 372.45 | 373.5 | Tight fractures |
| 393.45 | 395.75 | Closed fractures |
| 411.2 | 413.7 | Tight fractures |
| 416.3 | 417.3 | Closed fractures |
| 419.4 | 420.1 | Closed fractures |
| 421.9 | 423.2 | Closed fractures |
| 424.4 | 428.5 | Closed fractures |
Table 2.
Statistics of the estimated coal quality parameters from geophysical density log DENB.
| Average Value | Min. Error | Max. Error | Average Error | Average Error in % | Correlation R | |
|---|---|---|---|---|---|---|
| RD (g/cc) | 1.33 | 0.00 | 0.33 | 0.03 | 2.23 | 0.87 |
| Ash (%) | 6.56 | 0.00 | 21.54 | 3.03 | 71.21 | 0.88 |
| Specific Energy (MJ/kg) | 30.54 | 0.00 | 7.67 | 1.13 | 4.73 | 0.86 |
| Fixed carbon (%) | 52.90 | 0.00 | 20.18 | 4.85 | 10.41 | 0.56 |
| Volatile Matter (%) | 36.19 | 0.01 | 11.62 | 3.01 | 8.59 | 0.64 |
| Inherent Moisture (%) | 4.35 | 0.00 | 3.27 | 0.64 | 14.74 | 0.26 |
Table 3.
Statistics of the estimated coal quality parameters from multi geophysical logs: FROM, GRDE, DENB, DEPO & RPOR.
Table 3.
Statistics of the estimated coal quality parameters from multi geophysical logs: FROM, GRDE, DENB, DEPO & RPOR.
| Average Value | Min. Error | Max. Error | Average Error | Average Error (%) | Correlation R | |
|---|---|---|---|---|---|---|
| RD (g/cc) | 1.33 | 0.00 | 0.27 | 0.03 | 2.16 | 0.92 |
| Ash (%) | 6.56 | 0.00 | 18.48 | 2.48 | 52.20 | 0.95 |
| Specific Energy (MJ/kg) | 30.54 | 0.00 | 7.01 | 1.04 | 4.42 | 0.89 |
| Fixed carbon (%) | 52.90 | 0.01 | 19.33 | 2.29 | 7.09 | 0.71 |
| Volatile Matter (%) | 36.19 | 0.01 | 9.50 | 2.54 | 7.32 | 0.74 |
| Inherent Moisture (%) | 4.35 | 0.00 | 3.09 | 0.56 | 13.00 | 0.51 |
© 2020 by the authors. Licensee MDPI, Basel, Switzerland. This article is an open access article distributed under the terms and conditions of the Creative Commons Attribution (CC BY) license (http://creativecommons.org/licenses/by/4.0/).
Share and Cite
MDPI and ACS Style
Zhou, B.; Guo, H. Applications of Geophysical Logs to Coal Mining—Some Illustrative Examples. Resources 2020, 9, 11. https://doi.org/10.3390/resources9020011
AMA Style
Zhou B, Guo H. Applications of Geophysical Logs to Coal Mining—Some Illustrative Examples. Resources. 2020; 9(2):11. https://doi.org/10.3390/resources9020011
Chicago/Turabian StyleZhou, Binzhong, and Hua Guo. 2020. "Applications of Geophysical Logs to Coal Mining—Some Illustrative Examples" Resources 9, no. 2: 11. https://doi.org/10.3390/resources9020011
Note that from the first issue of 2016, this journal uses article numbers instead of page numbers. See further details here.