Development of Digital Subterranean Models for Real-Time Open Cut Horizon Control

CSIRO, 1 Technology Court, Pullenvale, QLD 4069, Australia
*
Author to whom correspondence should be addressed.
Resources 2020, 9(4), 50; https://doi.org/10.3390/resources9040050
Submission received: 18 February 2020
/
Revised: 20 April 2020
/
Accepted: 20 April 2020
/
Published: 24 April 2020
(This article belongs to the Special Issue Advances in Mining Technology: The Digital Mine)
Abstract
:A reliable coal seam sensing system is required to improve the productivity of selective mining in open-cut mining operations. A prototype system based upon commercial ground penetrating radar equipment, which measures coal thickness from the top of an exposed surface down to an underlying coal-interburden interface and generates digital subterranean models of the subsurface seam boundaries, was developed for this purpose. The models can be deployed to commercially available in-cab assistive guidance systems for bulldozers and other mining machinery in existing production processes, and can further contribute to the databases required for remote operation and control in a complete digital mine scenario. The system was evaluated at a production open cut coal mine in Queensland, Australia, with promising results. The benefits reported by operational personnel who evaluated the digital surface model in the mining environment provide strong motivation for ongoing technology development.
1. Introduction
Coal mining operations typically adopt either the bulk mining or selective mining method to minimize production costs [1]. Bulk mining involves the recovery of the entire coal seam and sending the mined resource to a coal handling and preparation plant (CHPP) for grade sorting and washing. Conversely, in selective mining, the resource is mined in a way where each different grade of product existing in the coal seam is mined separately, thus bypassing the need for the CHPP. Selective mining can be reliably applied only if the coal properties and vertical extent of the coal seam are well known, and the mining process can be controlled to remain within the limits of the selected mining roof and floor horizons.
It is feasible to achieve this result in the open cut coal industry through a system that generates digital subterranean models of coal blocks prior to mining. Modern assistive guidance machine control systems can enable cutting horizons to closely follow paths specified in the models, so that the resource can be selectively mined, rather than penetrating through the seam floor boundary and diluting the product. However, the extraction surfaces on which the models are based are generated from existing geophysical logs, which provide only sparse detail about the geology and are inadequate for accurate horizon control. For this process to become reality, a reliable automatic coal seam thickness sensing system is required, to ensure that digital models used for production guidance reflect actual underground seam structures.
A candidate sensor that can be deployed to scan the coal layer surface to measure seam thickness and acquire data required to generate digital subterranean models is ground penetrating radar (GPR). GPR is a non-invasive sensing technique used to obtain information about media below the earth’s surface. This technique operates by transmitting a pulse of electromagnetic energy into the ground. The energy is reflected towards the surface at interfaces of media with different electromagnetic properties. The reflected signals received by the system can be processed to determine information about the subsurface [2,3,4].
GPR has been used for a wide range of applications that benefit from information about the sub-surface. It has gained wide acceptance in the field of archaeology as a means to identify the most suitable location at a site prior to commencing excavation works [4,5]; to detect and map buried cables and pipes to prevent accidental damage during civil excavation works [6,7]; in military applications to detect buried landmines [8,9,10]; in environmental applications, such as snow and ice thickness estimation [11,12]; and in pavement evaluation to identify sections of roads that require repair [13,14].
In the field of mining, GPR was initially proposed as a sensor to detect coal seam boundaries in the 1970s. The initial areas of development focused on the application to underground coal mining machinery automation [15,16,17,18,19,20,21,22,23]. Subsequent investigations focused on highwall and open cut coal mining [24,25,26,27]. GPR has also been utilized to predict the subsurface horizon of an open cut bauxite mine in Weipa, Australia, to minimize ore dilution in the mining process [28,29,30].
The current state-of-the-art for generating quality subsurface information using GPR is a non-real-time manual procedure, which involves two key steps. The first step is data acquisition, which ranges from an operator pushing a cart-mounted system along a path on the surface, to an operator either driving a light vehicle or riding a quad bike whilst towing a GPR system on a sled.
The second step is data processing and interpretation. There are typically two types of targets in GPR surveys. The first type is the point reflector, with common examples including buried pipes, cables, land mines, and unexploded ordinance. The typical GPR response from a point target is a hyperbolic feature. There are many published works devoted to data processing to enhance imaging, detection and location estimation of these targets [10,31,32,33].
The second target type for GPR scans is the plane reflector. The plane reflector shows up as a horizontal banded feature in GPR data. Examples of plane reflectors typically include interfaces between subsurface layers, either naturally occurring or man-made, such as road pavements, ice sheets, geological strata between minerals and resources, and is the target type of the application described in this paper.
Unfortunately, the advanced data processing methods developed for point targets are not commonly transferable to plane reflector targets, due to the differences in the underlying features. Furthermore, advanced algorithms are often computationally complex, which significantly increases computation time or require high performance computer clusters. Methods such as these are unsuitable for mining applications, as additional delays impact mining production rates and decrease both productivity and profitability of the mining operation.
The literature describes the use of methods such as matched filtering and layer stripping to automatically detect subsurface interfaces in GPR data collected on layered media [14]. These approaches can work well for applications where the layers are well constrained, such as for road pavement assessment. Unfortunately, the performance of these approaches is unsuitable for the mining application described in this paper, because naturally occurring reflective surfaces can be highly variable and diffuse. As a result of this, the standard fall back approach is for an expert operator to apply signal processing routines to the GPR data to enhance specific features that will enable manual analysis and interpretation.
Data from multiple parallel scans can be combined to generate an isosurface that is indicative of the floor of a coal seam. This information is typically prepared for inclusion in a geological survey report. This processing and analysis procedure is routinely conducted offsite by an expert operator, and is usually only available several days after the survey has been completed. Figure 1 below shows (a) a GPR radargram scan collected along a single line that has been processed and interpreted and (b) shown in 3D with two detected isosurfaces. The isosurfaces indicate the location of horizontal boundaries between different subsurface layers.
Developments with similar elements to the system described in this paper have been proposed in the literature. Lever et al. [34] developed an autonomous robot with a GPR scanning system to detect crevasses in polar environments. The system utilized a GSSI SIR3000 GPR controller with 400 MHz antenna and GPS. The robot was able to drive autonomously, however, the data collection process was manual and the data could not be viewed remotely, nor was it accessible to the operator until after the surveying process was completed.
Furgale et al. [35] developed a system intended for planetary exploration. In the absence of GPS for navigation, the system utilized a stereo camera to estimate system position using visual odometry and a commercial GPR system to acquire subsurface data. The data acquired was used to generate a surface model of the path followed by the system and display the acquired GPR sensor data, corrected for topographical variation beneath the surface model. This system did not connect neighboring sensor paths, hence was unable to generate 3D subsurface maps suitable for machine guidance.
Erten et al. [28] utilized an UltraGPR system with 80 MHz antenna and integrated RTK-GPS to acquire GPR data in a lateritic bauxite mine in Weipa, Australia. The purpose of that activity was to accurately estimate bauxite ore volume for the mine plan from sparsely spaced bore holes and improve grade control during the mining process. Other specific details of the system were not provided; however, an 80 MHz system is intended for targeting deeper layers, rather than those required for this activity, being less than 1.5 to 2 m.
The novel contributions presented in this paper consist of the development of a GPR-based sensing system to scan the surface of an exposed coal seam block; and generate a measurement-based digital subterranean model to enable selective mining for horizon control of open cut coal operations. Specific details of these contributions are described as follows:
- Sensing System: A sensor package and data acquisition system has been designed whereby a robotic mobility platform under remote control deploys the sensing system in a specified pattern over the area of interest.
- The system hardware and software architecture incorporate a wireless link to an operator display for control and real-time observation of sensor data. Importantly, interruptions to the wireless link do not affect the data acquisition process.
- Information System: The generated digital subterranean model is exported in a format compatible with commercial bulldozer guidance systems thus advancing the work in [28,35] towards practical applications. This eliminates the need for the generation of a full geophysical report from the survey, which decreases the time required to convert the acquired data into a format suitable for use by the end user.
This paper describes the development of this system, how it can be integrated into the mining production cycle and presents results from a preliminary evaluation of performance. The remainder of the paper is organized as follows: Section 2 provides an overview of the scanning system. Section 3 details the results of a field survey where the performance of the scanning system was evaluated. Section 4 presents an analysis and discussion of the field survey results and Section 5 draws conclusions from this project and indicates directions for future research.
2. Materials and Methods
2.1. System Hardware Development
2.1.1. Radar and Position Sensing Components
The sensing components required to generate digital subterranean models of the coal seam employ commercially available modules: a GPR system, a real-time kinematic (RTK) GPS and an inertial measurement unit (IMU). The GPR system consists of an antenna module, a controller unit, a computer and a battery. The GPR antenna module must be in close contact with the ground, whilst the additional system components must be located close by. An RTK-GPS system consists of a rover receiver unit, which receives satellite signals and a base station, which provides position correction messages to the rover receiver. Together, these are used to geo-reference the data collected by the GPR system to centimetre accuracy. The RTK-GPS base station can be mounted on a separate tripod or permanent RTK-GPS infrastructure of the mine surveying system can be utilized. The RTK-GPS rover receiver antenna unit is mounted directly above the GPR antenna module so that the antenna position can be measured accurately during the survey. The IMU provides orientation information of the GPR antenna (heading, pitch and roll), which can be used to correct target location when scanning an inclined surface. All these sensors are located in a sled attached to a robotic vehicle (either autonomous or remotely controlled), which tows the sensors around a block of a surface mine.
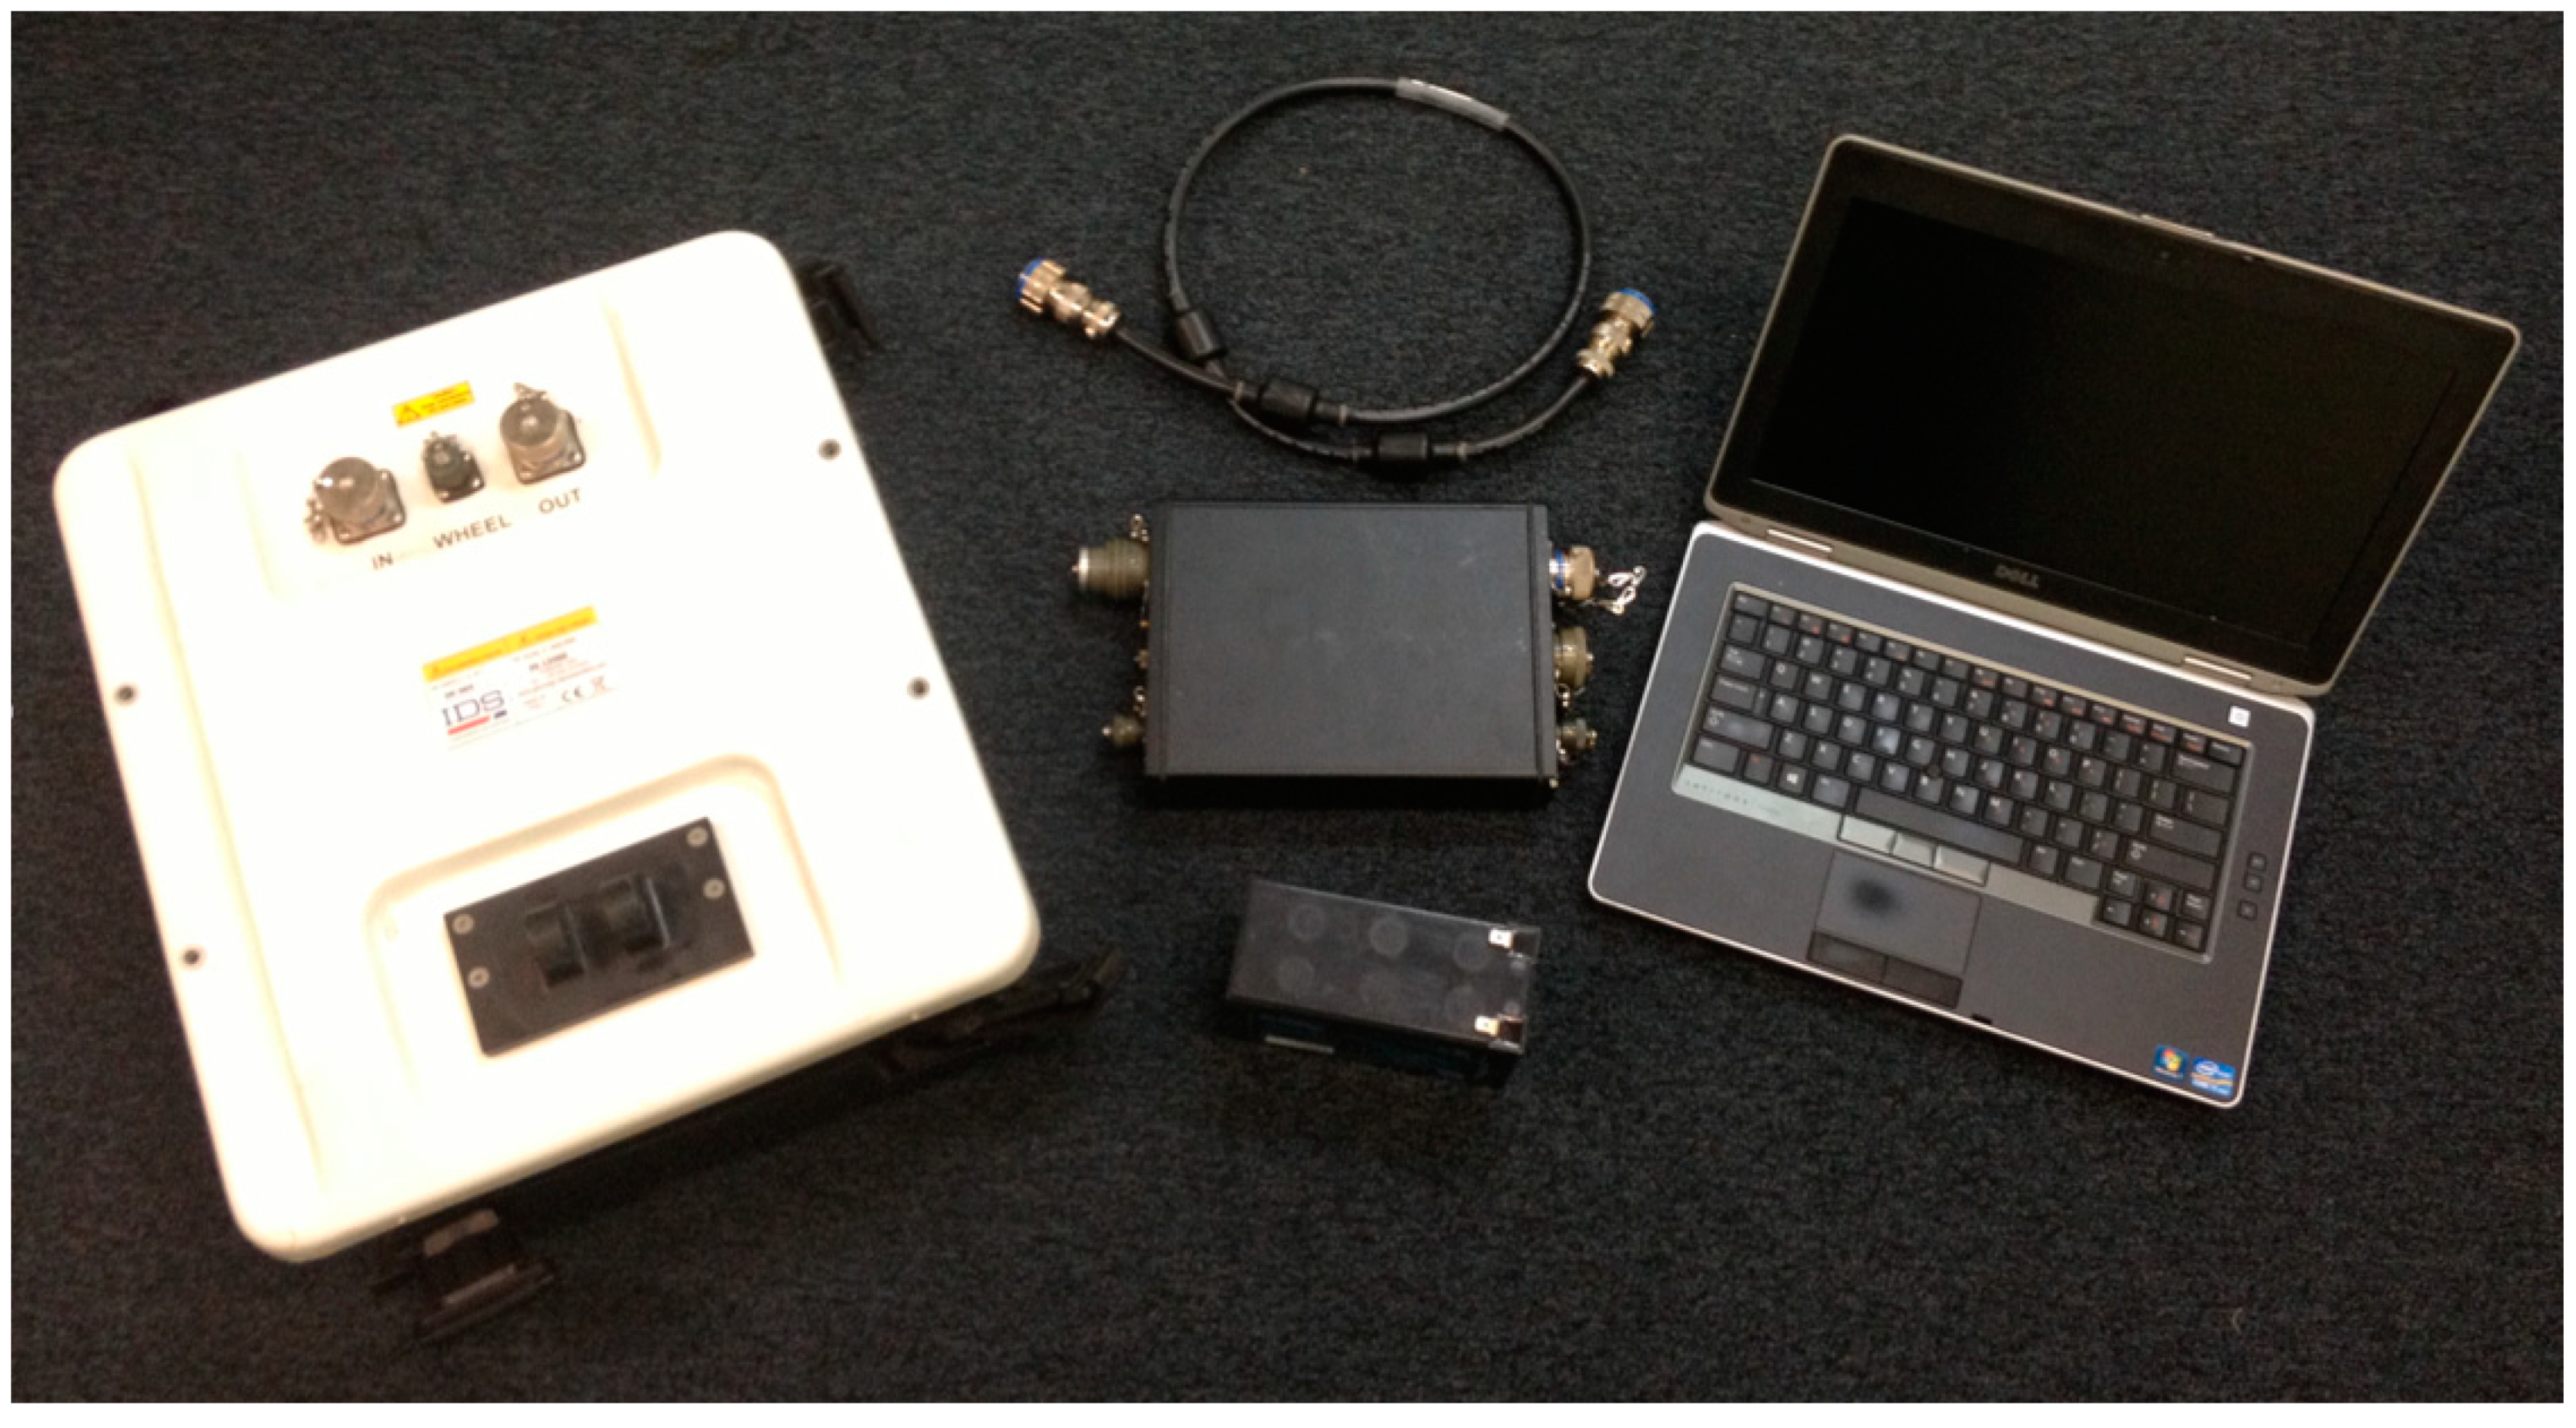
The specific core system hardware components consisted of an IDS Georadar Hi-Mod GPR system with 900/400 and/or 600/200 MHz antenna modules, NovAtel RTK-GPS rover receiver and base station, Microstrain GX5 IMU, Robotnik Summit XL robotic platform as the towing vehicle and a custom sled. The GPR components are shown in Figure 2.
2.1.2. Computing Hardware
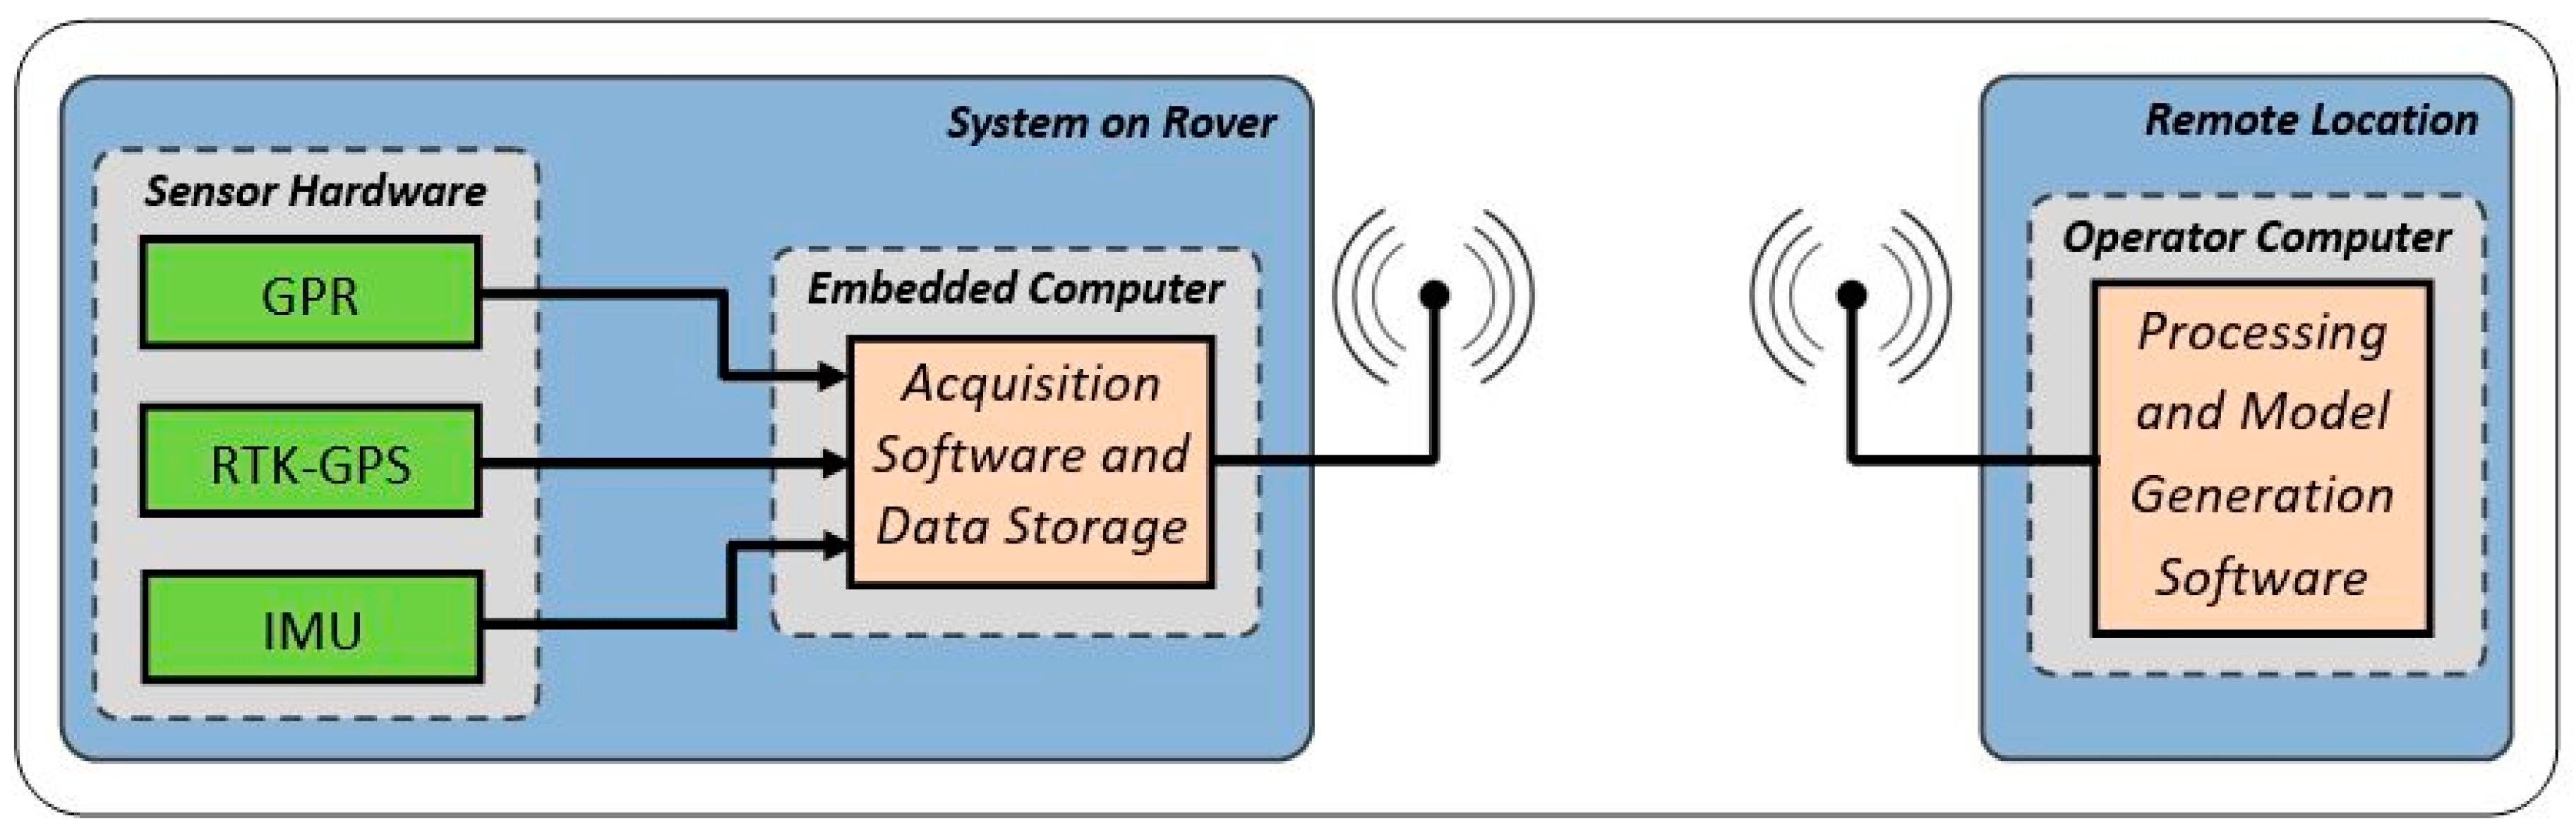
In addition to the sensing hardware described above, the system also contains two computer modules, an embedded server computer and a remote operator’s computer. The embedded server computer replaces the laptop shown in Figure 2 during GPR operation. Figure 3 shows the architecture, data flow and software modules of the sensing system. Each sensor module (on the left) is connected to the embedded computer which executes the acquisition software. The operator computer (on the right) connects to the embedded computer via a Wi-Fi link and is used to configure, start and stop the system. Further detail on the software is described in Section 2.2.1.
2.1.3. Sensor Sled
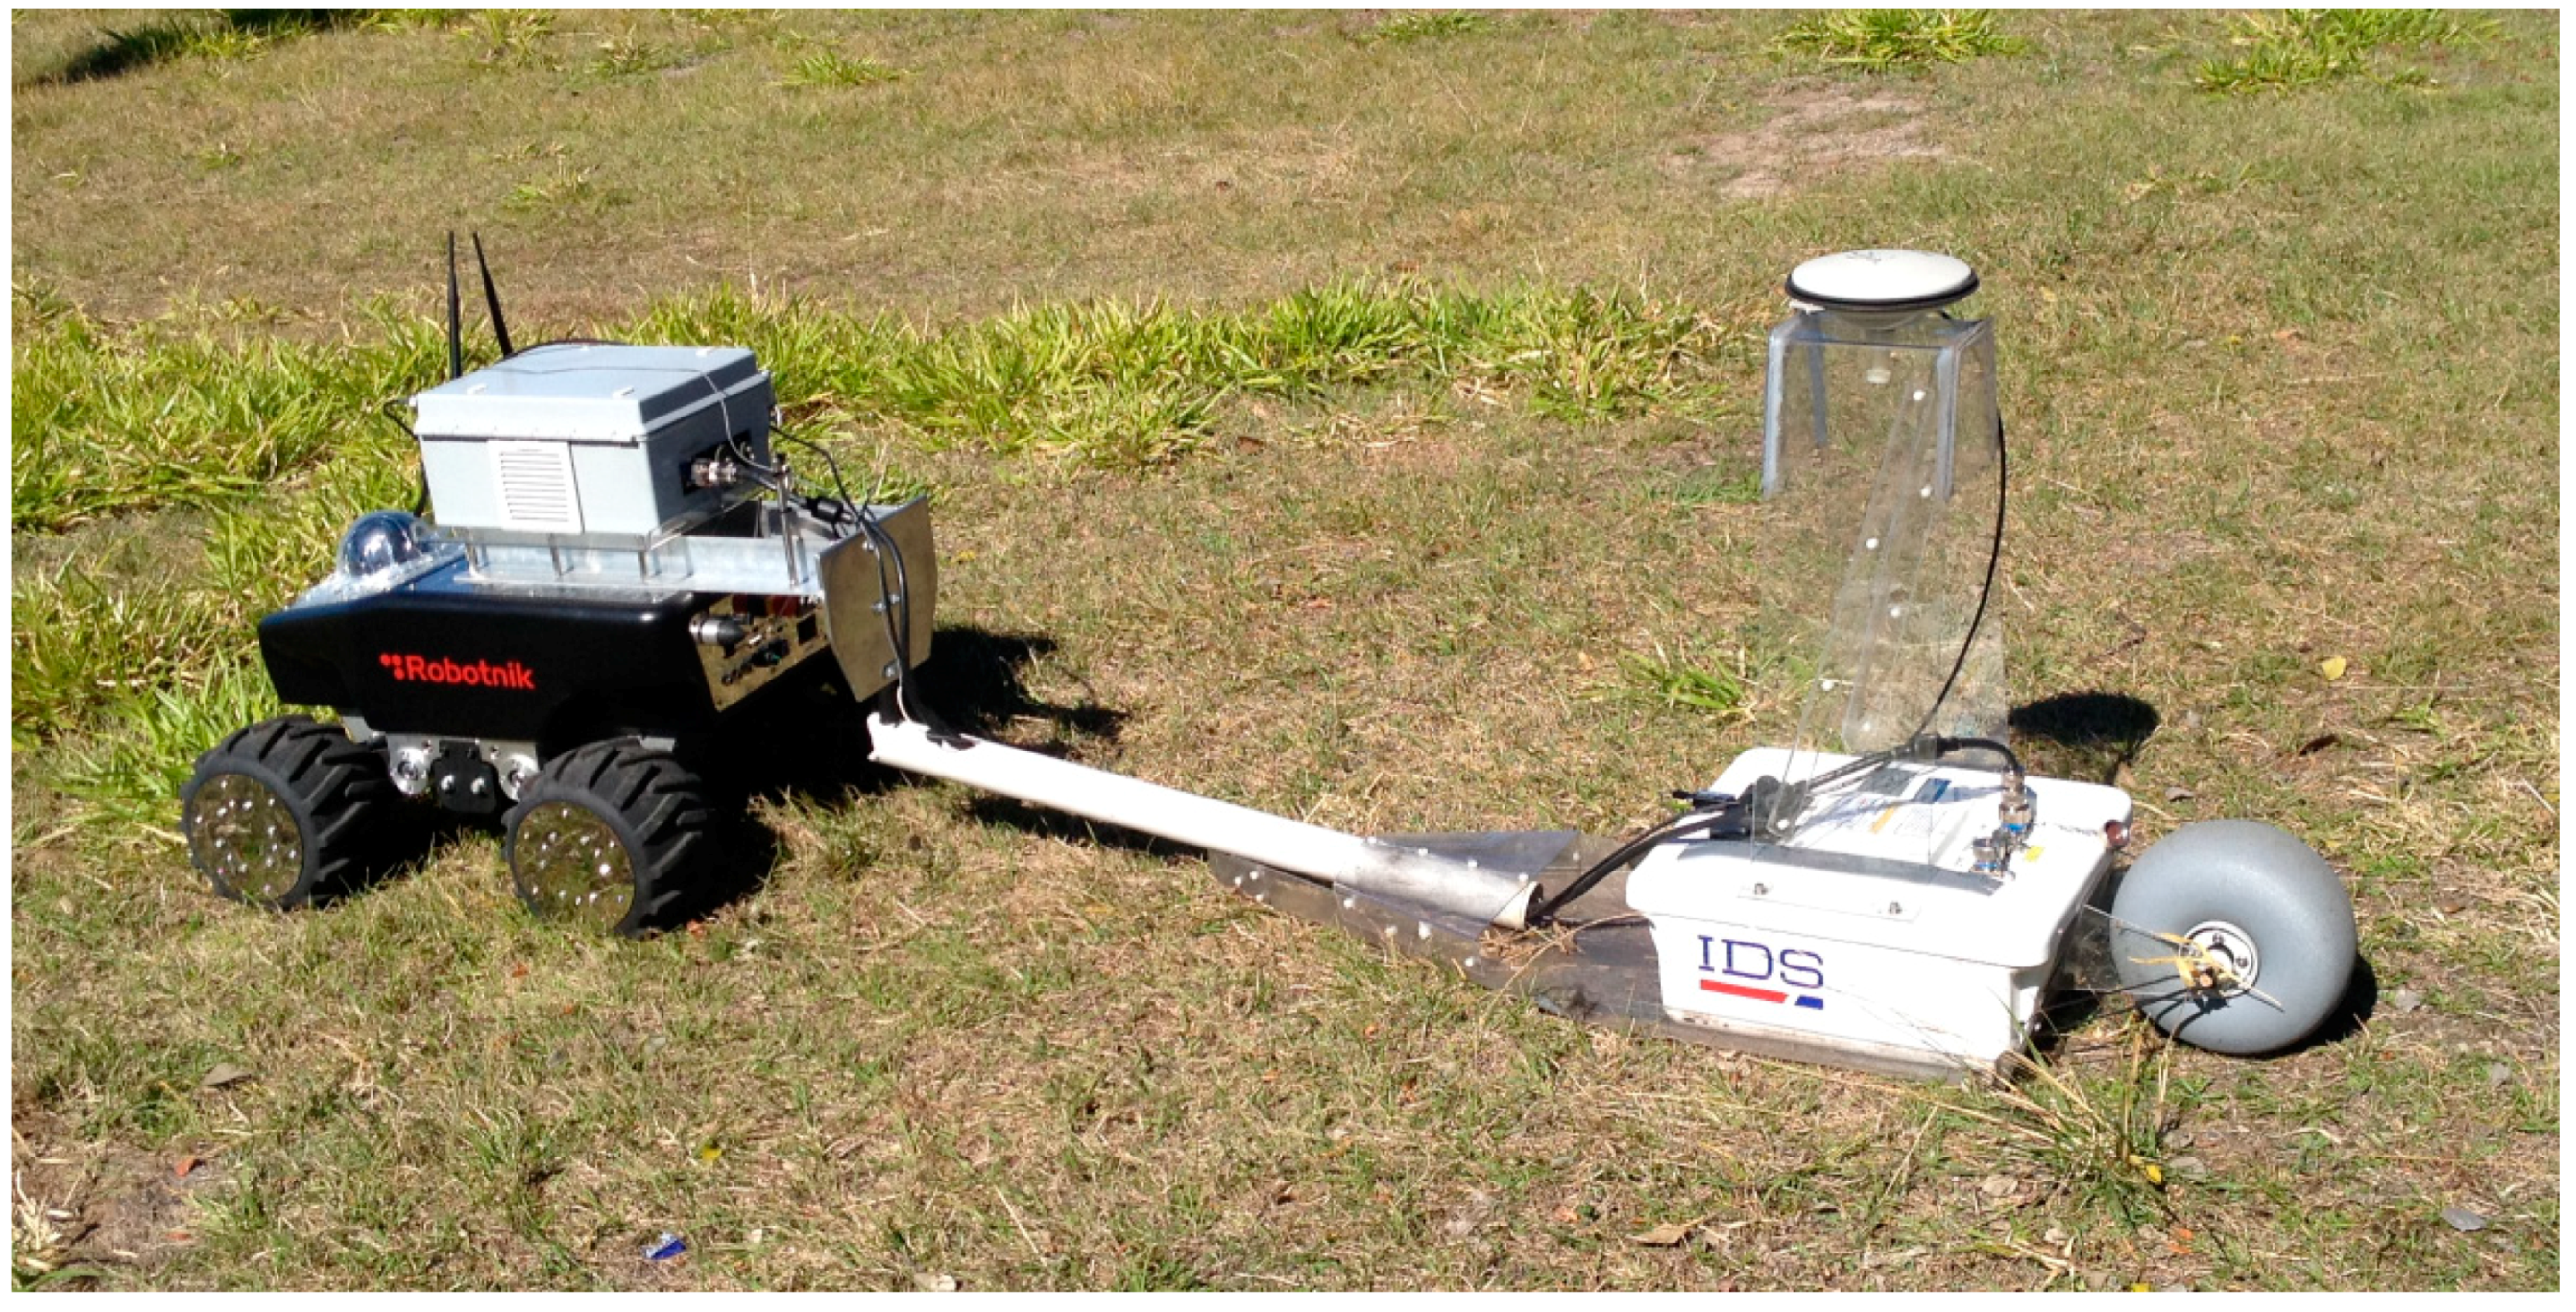
In this application the GPR antenna and GPS rover receiver antenna are mounted in a sled towed by a remotely controlled vehicle. Experiments were conducted to determine how to configure the sensor sled and other aspects of the towing mechanism so they don’t introduce clutter and interference into the GPR signal. The final configuration of the sled and remote tow vehicle with GPR, RTK-GPS and IMU sensors is shown in Figure 4.
2.2. System Software Development
2.2.1. Data Acquisition Software
Software was developed as part of this project to acquire the data from the GPR, RTK-GPS and IMU sensors and process the data for this specific mining application. The data acquisition software module runs on a small industrial embedded computer, located in an enclosure that houses other ancillary electronics, such as the GPR controller, RTK-GPS rover receiver, RF modem, Wi-Fi access point and batteries. The data acquisition software receives data directly from each sensor. During standard operation, the embedded computer operates in headless mode. The data acquired by the data acquisition software is accessible to the user via custom data visualization software running on a standard laptop computer. This visualization software has been developed so that the sensor data can be visualized in real-time as a means to monitor system operation during the data acquisition phase. This software runs on a Windows laptop and connects to the embedded computer via a Wi-Fi connection. The laptop can be in a suitable location close by within Wi-Fi range, whilst the embedded computer and enclosure are on the robot towing the sensor sled. This allows the supervisor/operator to monitor the system either nearby, or from a remote location if a computer network connection can be made between the devices. In the event that the wireless communications link is lost during the scanning phase, the embedded computer will continue to acquire the data from the sensors and save that to a local database. After the survey is completed, the sensor data can be accessed via the Operator Computer represented in Figure 3.
2.2.2. Data Visualization Software
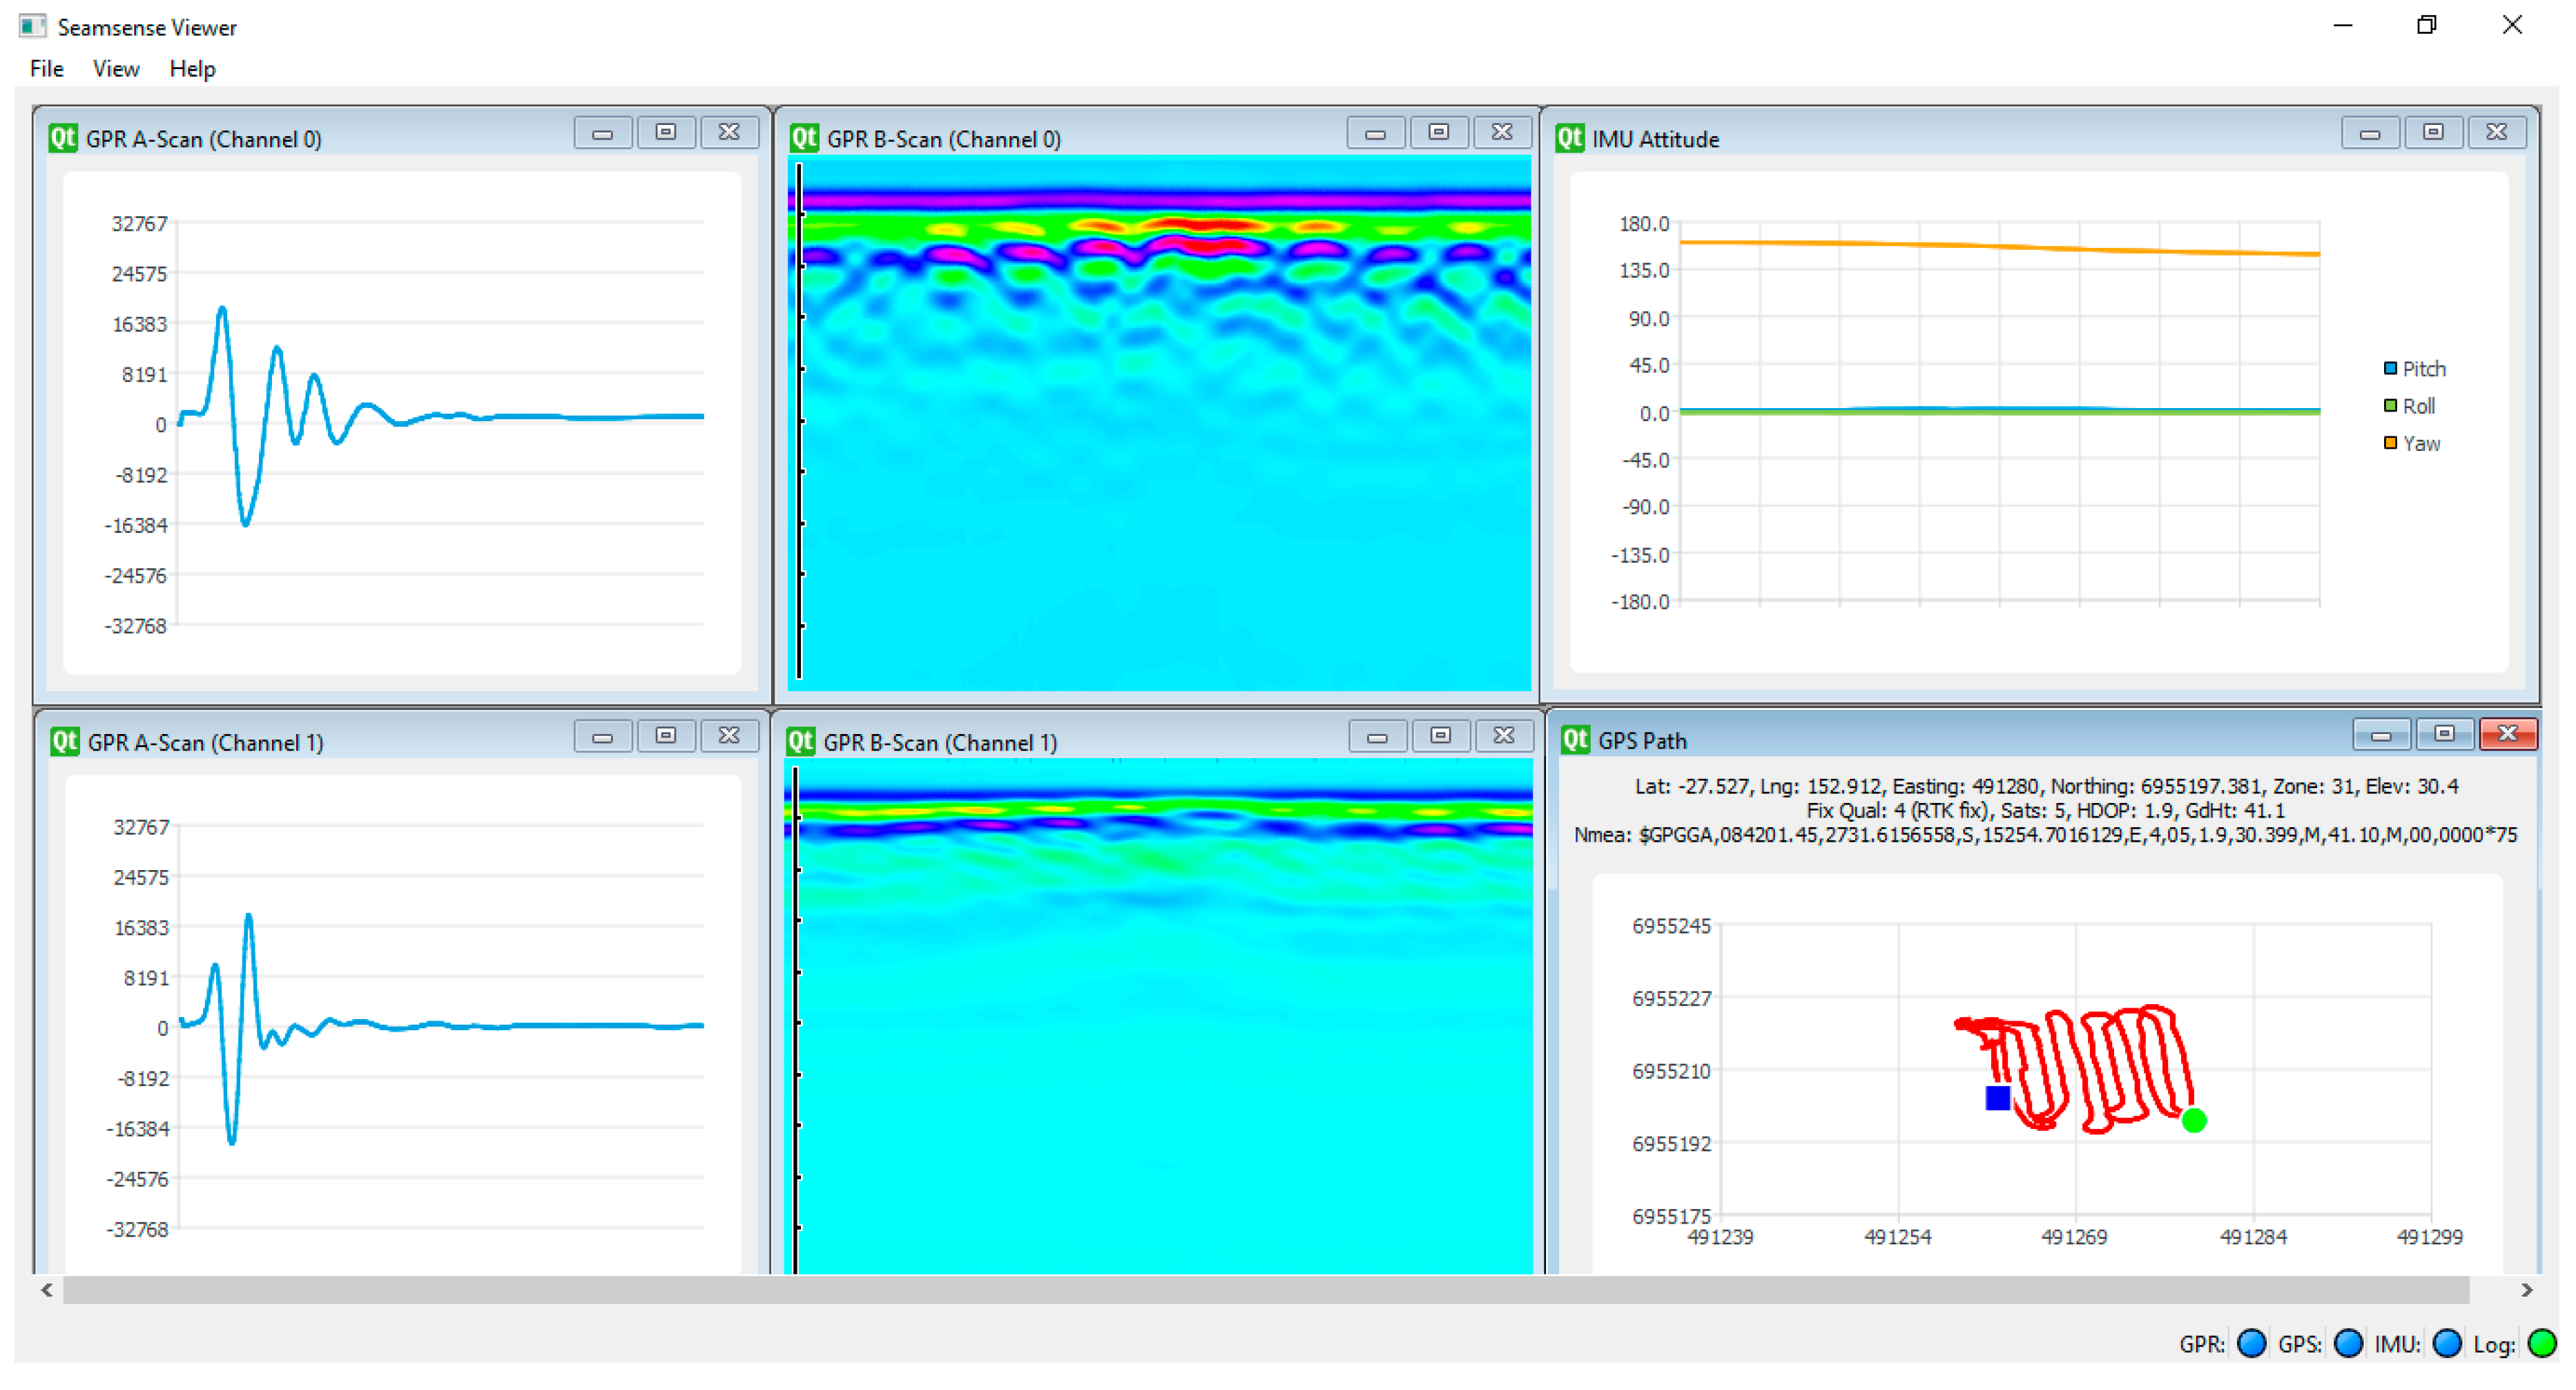
The visualization software shows a reflection trace waveform and radargram of each GPR channel, the RTK-GPS position of the current scan path in plan view, data from the IMU (pitch, roll and yaw), along with other status information. The software is also used for system control functions such as start/stop scanning and start/stop logging. The visualization software output is shown in Figure 5. The top-left and bottom-left screens show the reflection trace waveforms for Channel 0 and Channel 1. The top-center and bottom-center screens show the radargrams for Channel 0 and Channel 1. The top-right screen shows the IMU data (pitch/roll/yaw) and the bottom-right screen shows the scanned path in plan view from the RTK-GPS.
2.2.3. Data Processing Software
Once the raw GPR data has been acquired and downloaded to the operator computer, it must be processed before a digital surface can be generated. Custom software, utilizing GPR data signal processing algorithms previously implemented by the authors, was developed to process the data acquired from the subsurface sensing system. The signal processing routines utilized in this software are de-wow, background subtraction, time varying gain and both temporal and spatial smoothing. De-wow is a running median filter that operates along each individual trace to remove low frequency signal components. Background subtraction is a common method to highlight the response from point targets by filtering out horizontal banding in the scans, such as the direct coupling signal that propagates from the transmitter to receiver antenna. It is implemented in this paper by calculating the average of all traces in the scan, and then subtracting the average from the entire scan. Given that background subtraction removes horizontal banding from the data, it is widely recognized that the method is not recommended for layered applications. However, in this specific mining case, the individual layer thicknesses are sufficiently variable, such that a background subtraction step enhances the features from each interface. Time varying gain compensates for the natural attenuation of the radar signal, due to conductivity in the ground and spherical divergence related to antenna beam width, by boosting signal amplitude as trace time increases. Temporal and spatial smoothing are low pass filters applied along the horizontal and vertical dimensions of the scans. Temporal smoothing is applied along each trace to minimize noise caused by hardware timing jitter due to sequential sampling [3]. Spatial smoothing is applied as a sliding window along the entire scan to filter out any discontinuities in the horizontal features, and to enhance the performance of the subsequent interface tracking step.
Upon completion of the data processing steps described above, a time to depth conversion is applied, then the operator selects the most appropriate target wavelet, based on amplitude and depth information. The remainder of the interface is tracked using a wavelet peak detector. This software can be executed by the supervisor/operator either directly after the scanning process has completed, or later, at a more suitable time. The data processing steps are shown Figure 6.
Whilst there is a range of commercial processing software packages available, they are intended for varied scanning scenarios across a wide customer base, and therefore intended to be used by experts in the field. The custom software developed as part of this project simplifies the procedure, and the sensing domain is optimized for scanning areas with subsurface layers.
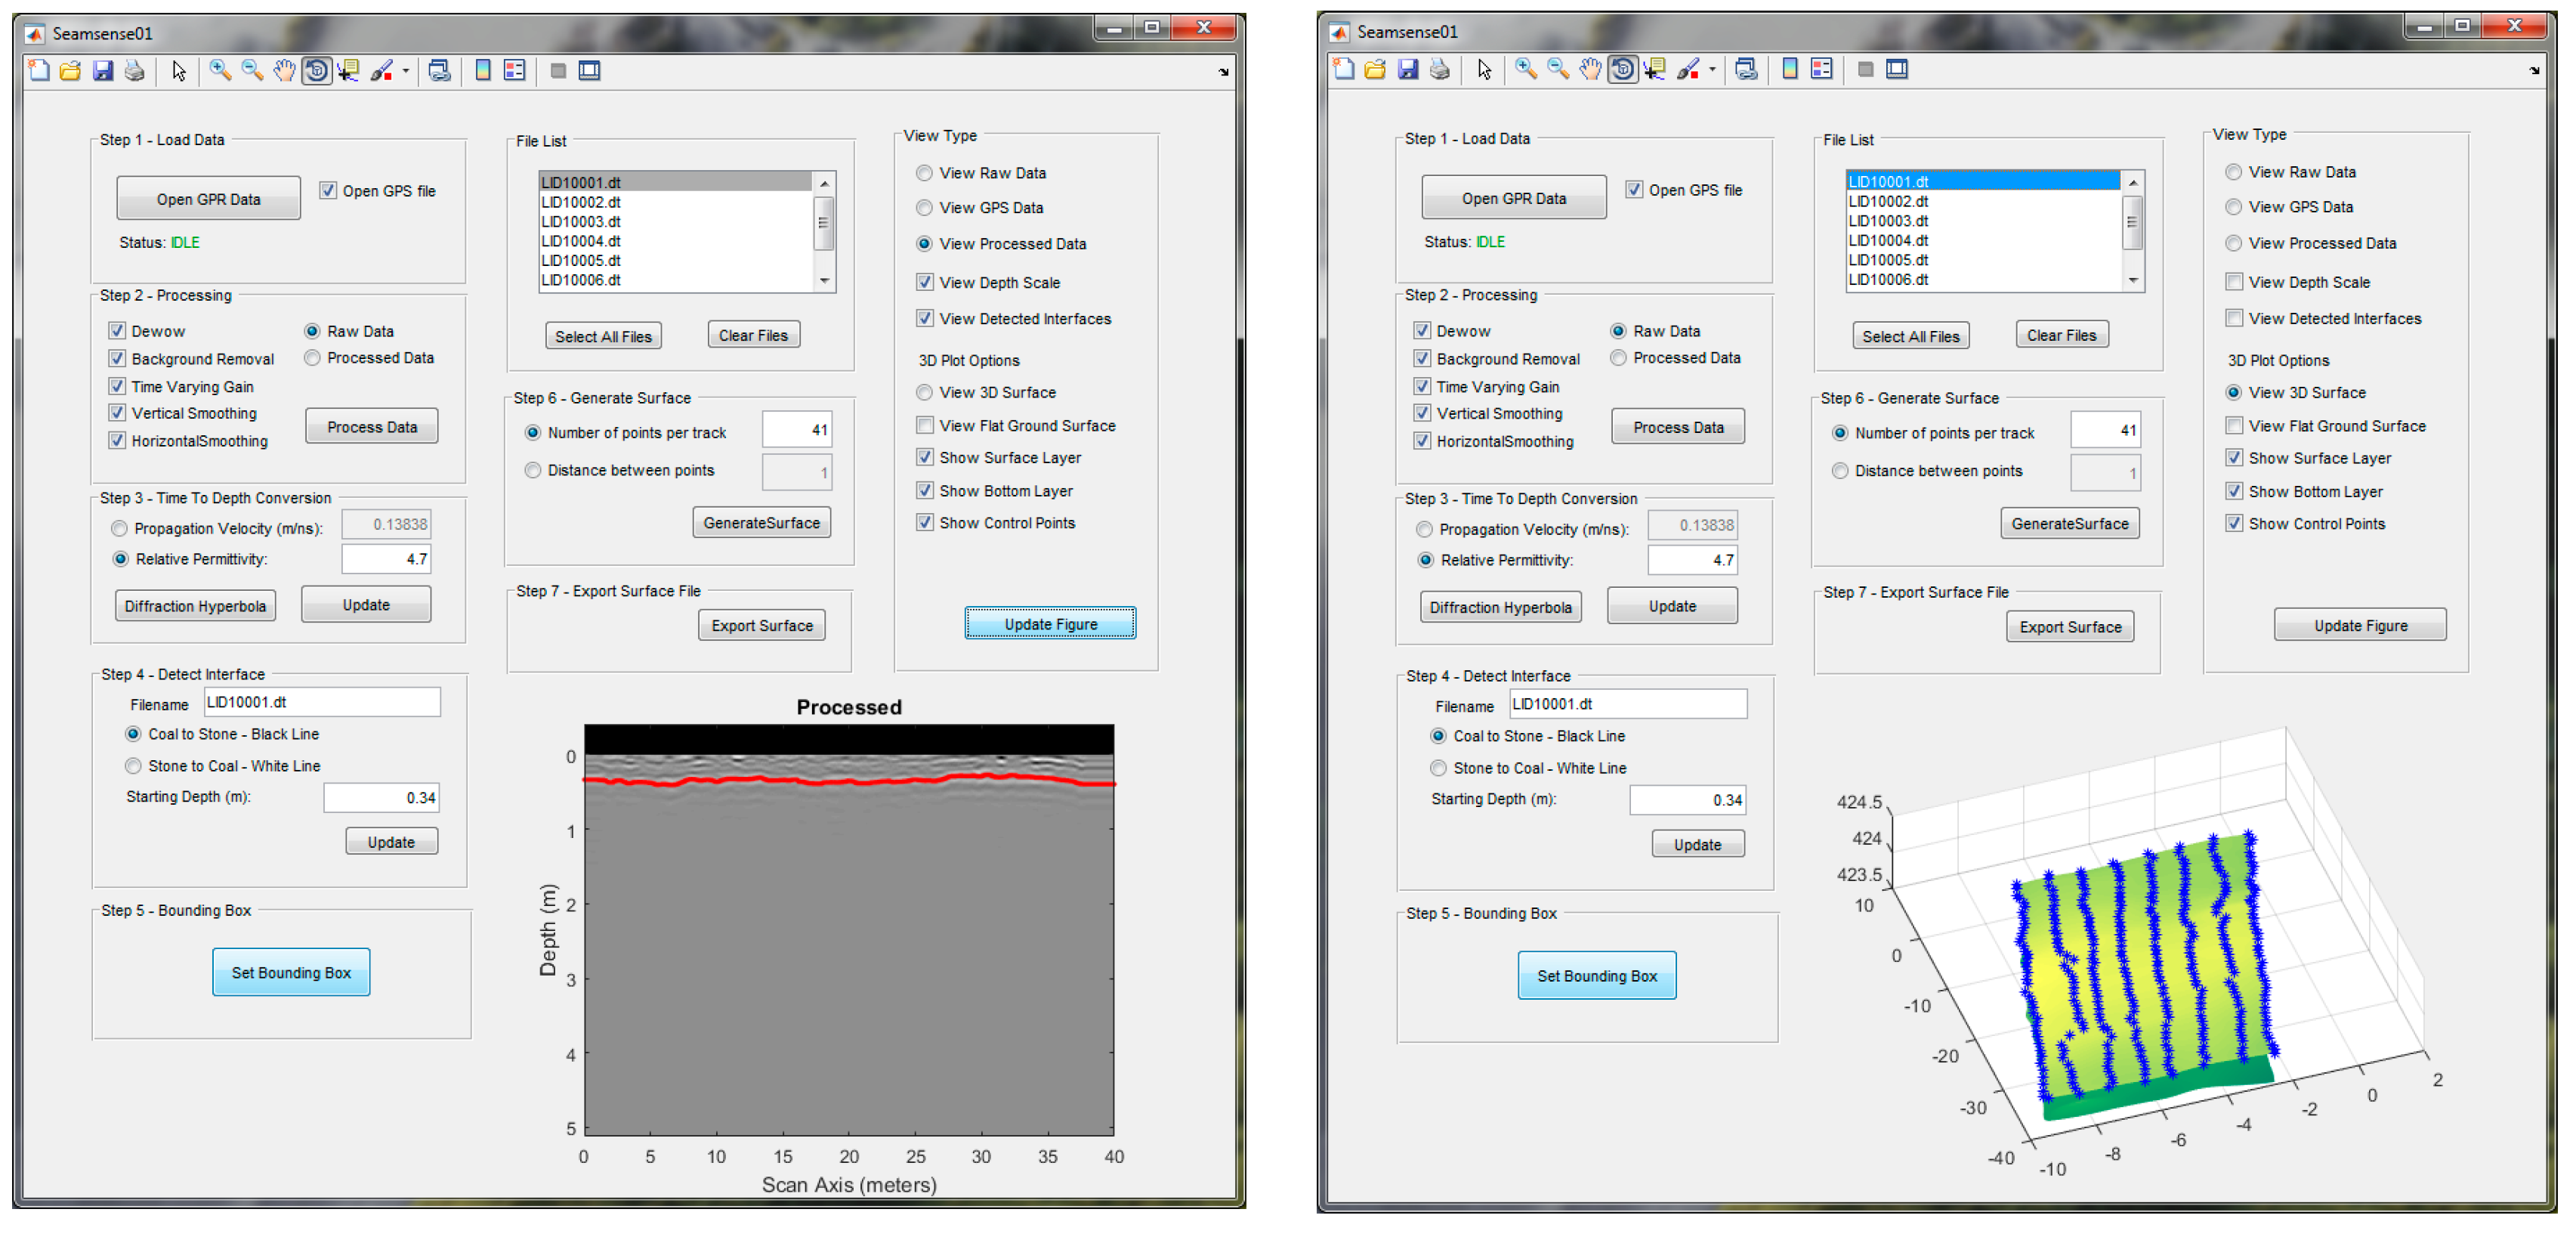
The processing software also generates a digital subterranean model from the processed sensor data. This is completed by extracting the 3D position of points in the scanned data at a spacing nominated by the user. The user can select either a specific number of points per GPR track line, or a distance between each point in the along-track direction. The 3D points are tessellated to form the digital subterranean model. The model can be exported into a DXF file as either points, a surface or both. Screen shots of the software that processes the GPR data and generates the digital subterranean model are shown in Figure 7.
The DXF files representing a digital subterranean model generated by this system have been tested in MineScape [36] and Bentley View [37] software, the former of which is a commercial mine planning software package. The screen shot of a digital subterranean model generated from data collected during a preliminary evaluation of this system is shown in Figure 8. The tessellated surfaces shown in the figure represent the scanned coal surface (green) and the bottom of the coal layer (yellow).
3. Results
3.1. Overview
A field trial was conducted at a production coal mine located in Queensland, Australia. In this survey, the GPR system consisted of 600/200 MHz and 900/400 MHz antenna modules, and the site’s RTK-GPS base station was used to provide RTK corrections. A block approximately 60 m wide × 120 m long (7200 m2) was prepared for mining in preparation for the survey. The survey consisted of 11 scan lines and took 30 min to complete. The crossline spacing for this survey was 6 m. A photo of the survey area with survey scan lines (red) is shown in Figure 9.
3.2. Geology
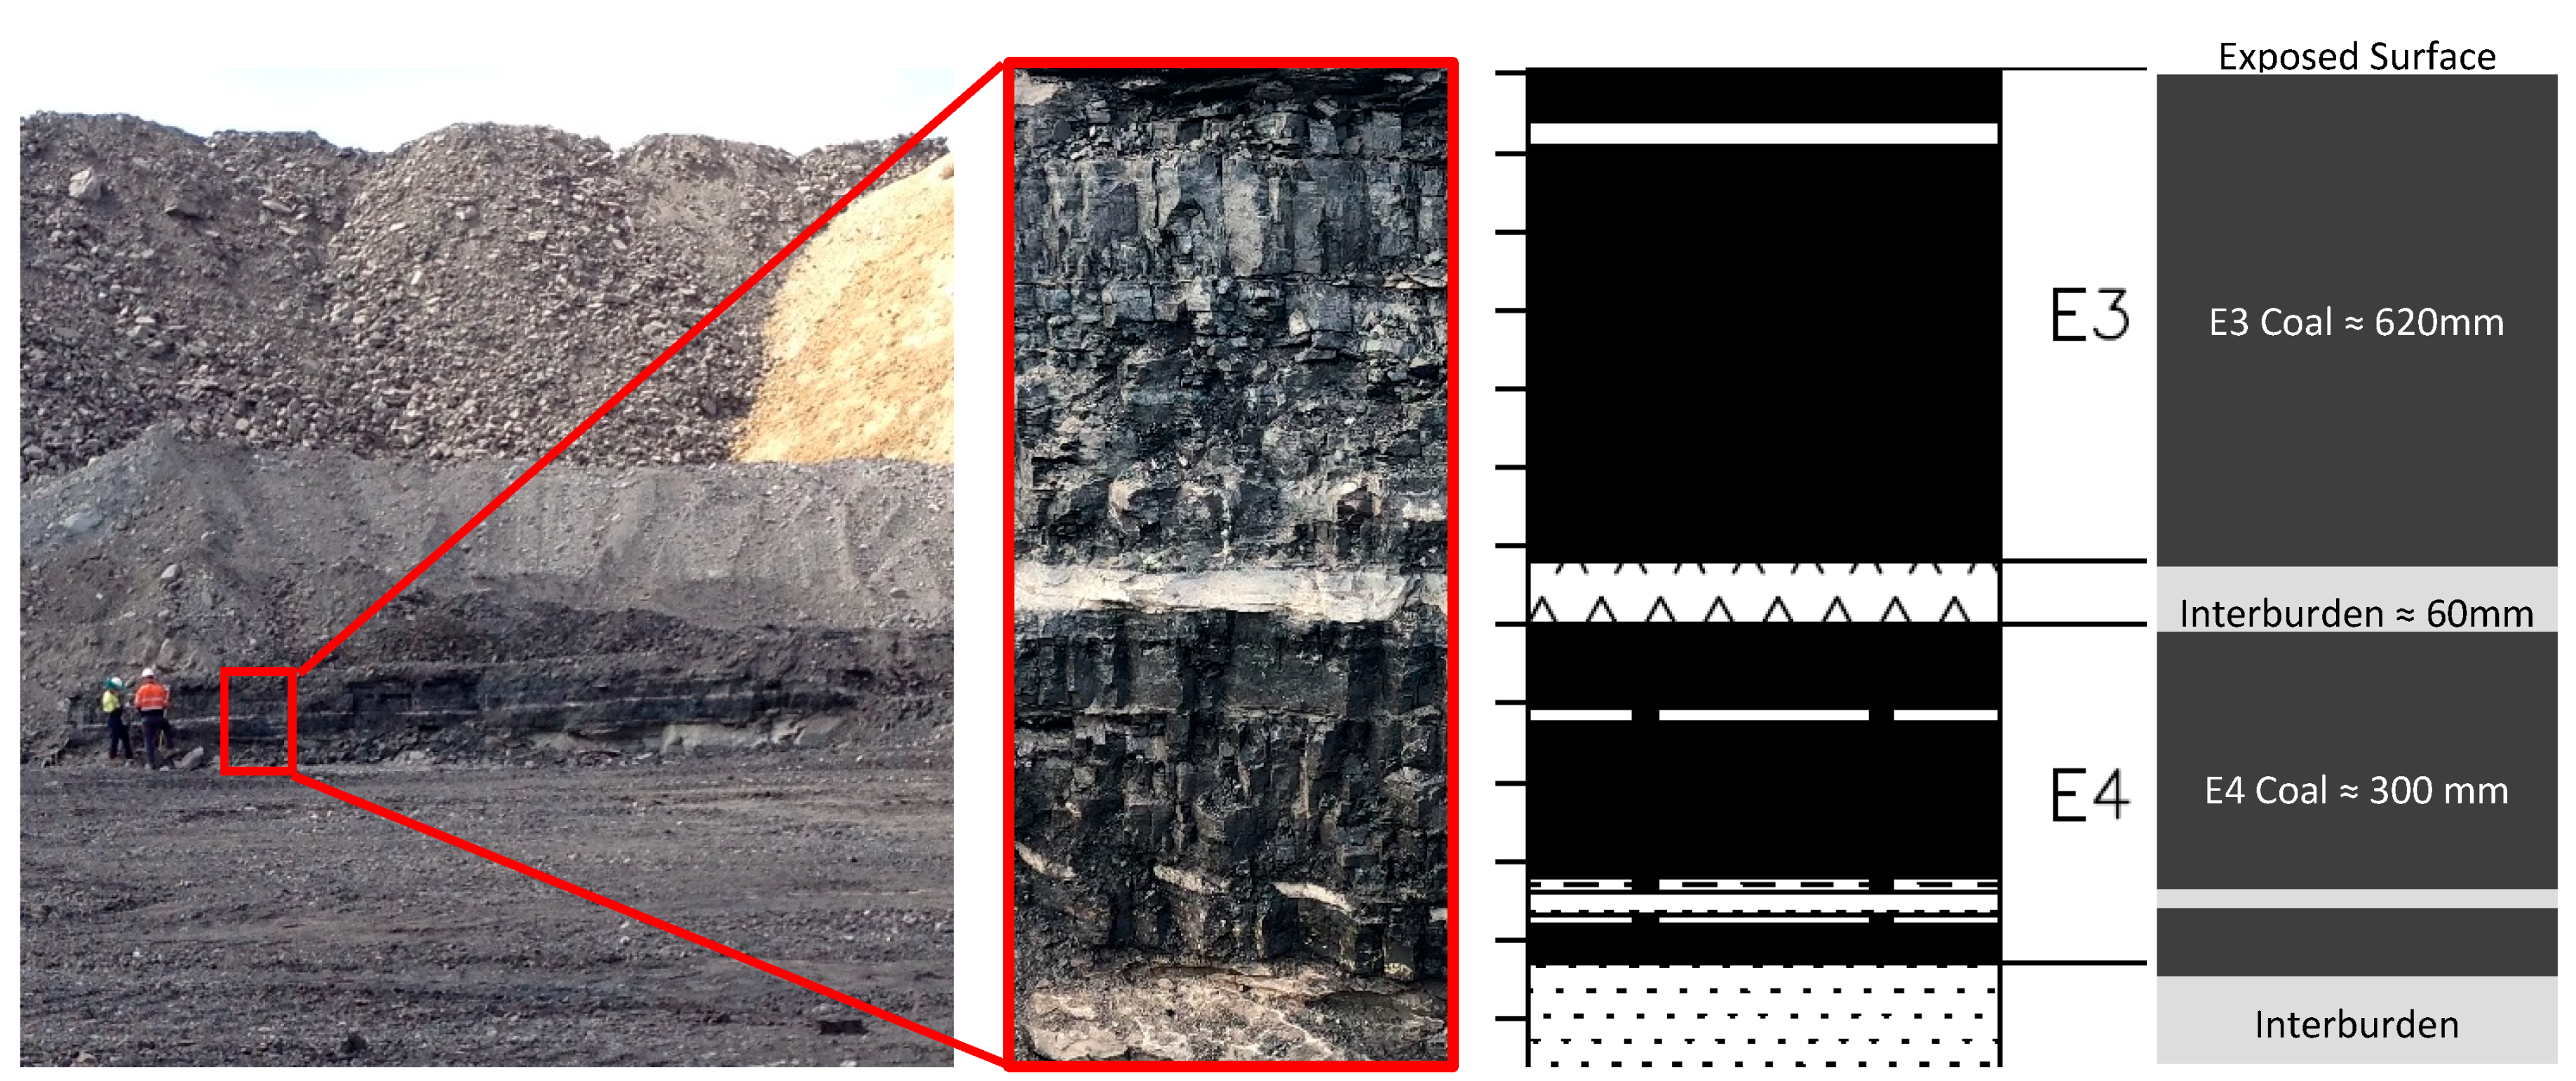
A section at one end of the block was exposed due to faulting, which enabled visual inspection of the underlying geology. The geology from top down at the exposed section consisted of a coal layer 620 mm thick, a bentonite interburden layer 60 mm thick, a coal layer 300 mm thick, a thin bentonite band 20 mm thick, a coal layer 80 mm then a thick bentonite interburden layer approximately 2 m thick. The depth of the bottom coal band to interburden interface (bottom of E4 ply) was 1.1 m on the exposed fault wall with respect to the assumed surface scanning level location. A photo of the exposed fault, a core log extract and a graphic of the geology are shown in Figure 10. With this geology configuration, the desired interface to be mined was between the lowest E4 coal band and bottom interburden layer.
3.3. Sensing Position
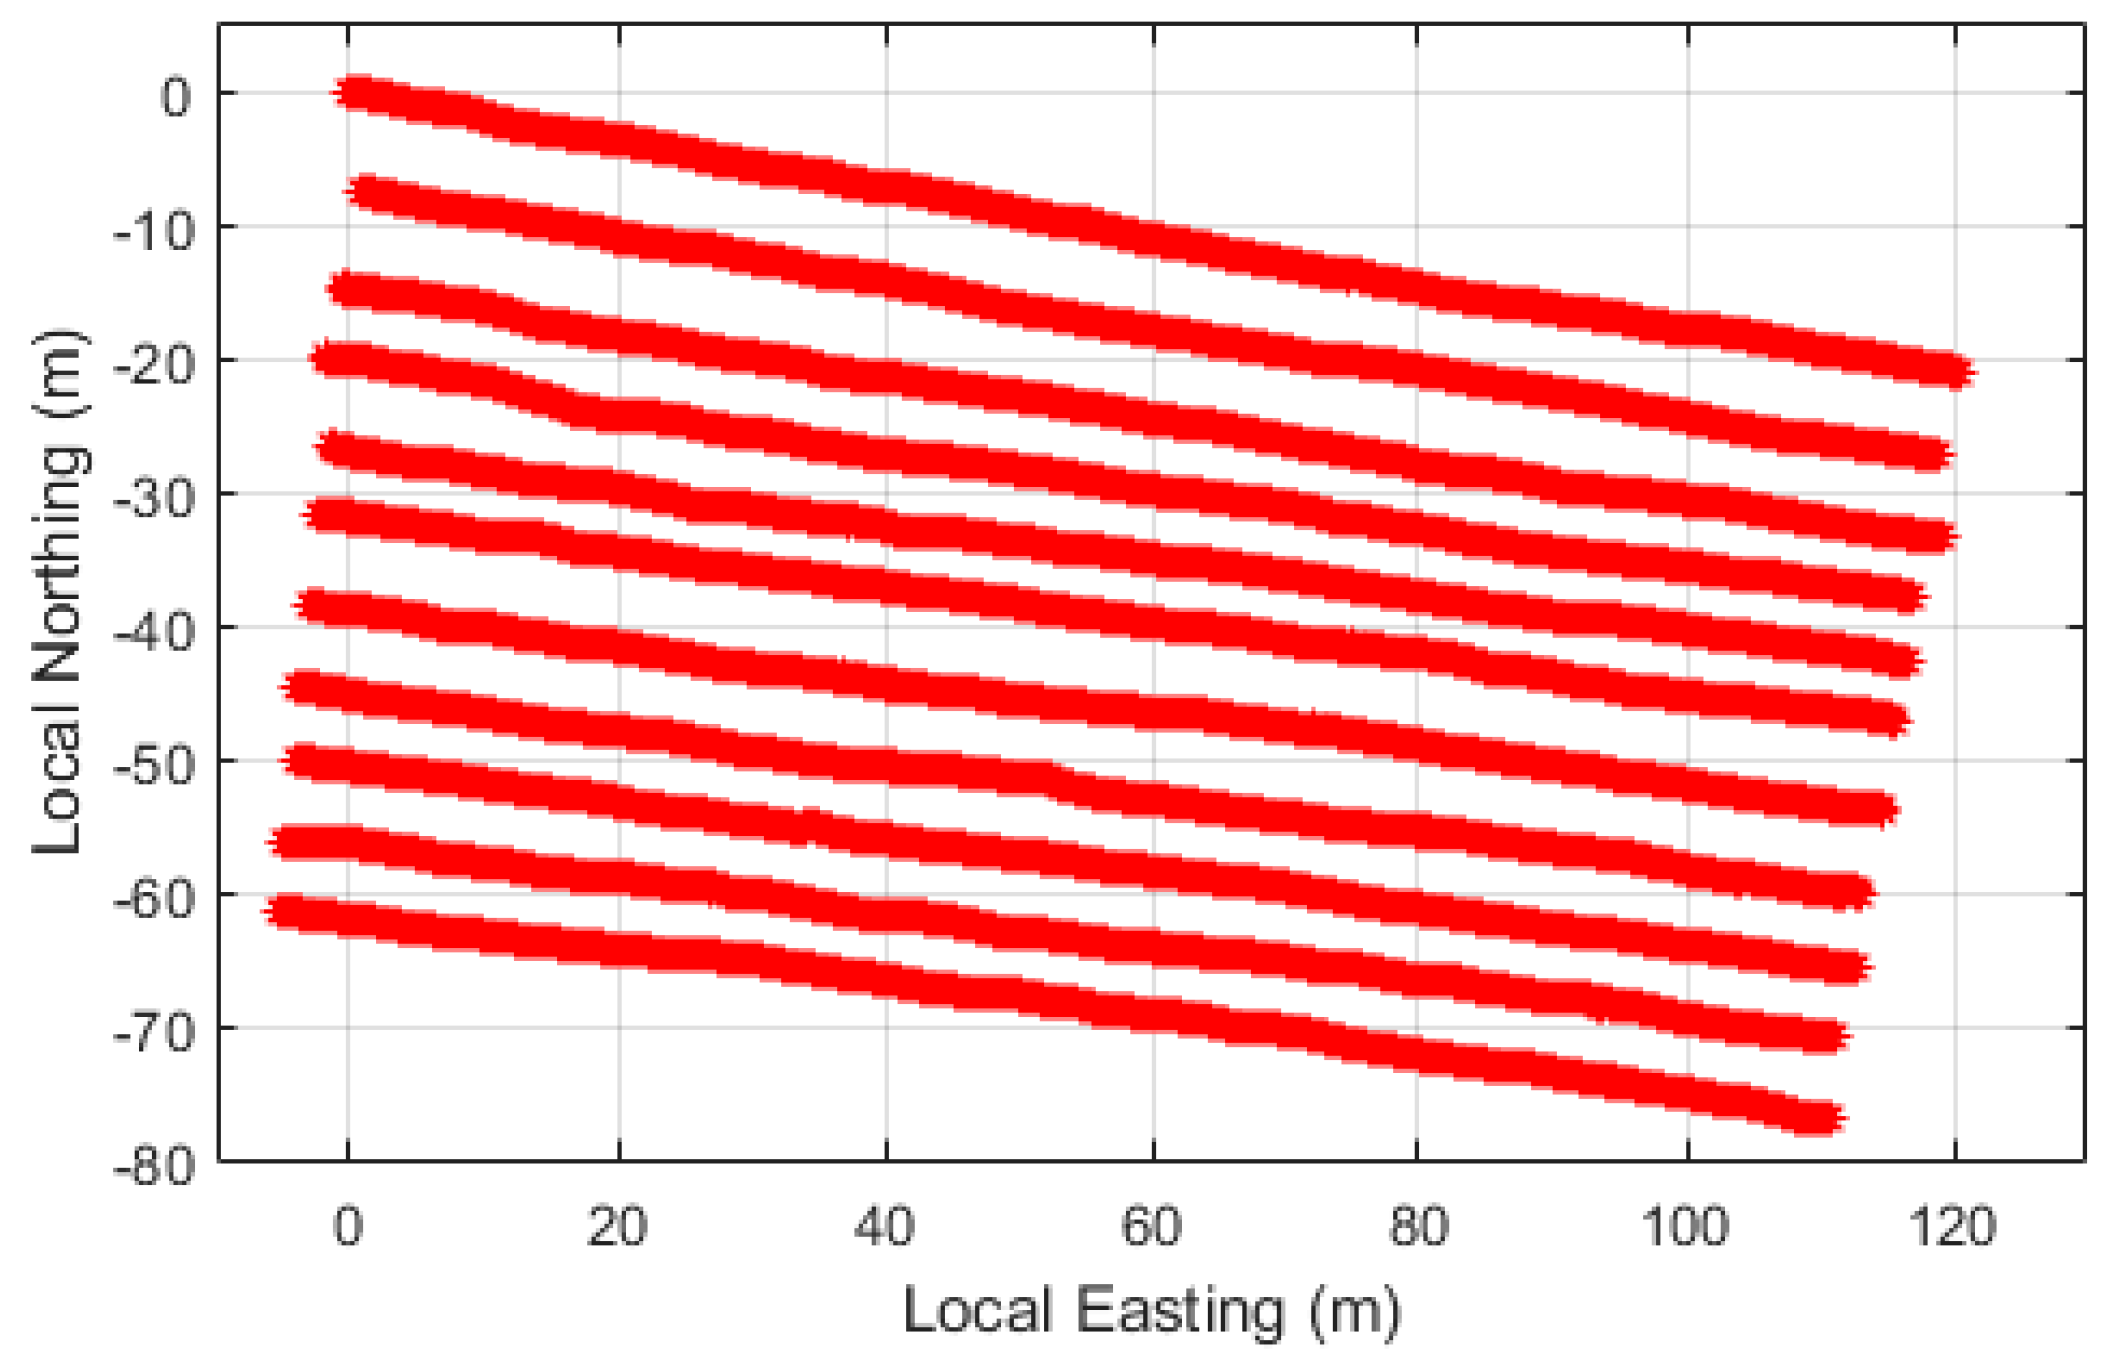
Prior to commencing the survey, the scanning system was placed on one of the site’s surveyed marker points to establish the accuracy between the sensing system’s RTK-GPS and the site in-house RTK-GPS. This is critical because the GPS data recorded by the scanning system must match the positions reported by the high-precision GPS in the bulldozers that perform the extraction. A horizontal error of approximately 200 m was initially observed. After reconfiguring the datum and grid transformation [38] of the system’s RTK-GPS receiver to match those of the site’s RTK-GPS base station, the position reported by the scanning system was within 50 mm horizontal (easting and northing) and 15 mm elevation of the site’s surveyed point. The RTK fix obtained from the local base station also resulted in a position accuracy of 10 mm, which is the typical accuracy for RTK-GPS surveys. The survey paths for the scan lines with respect to the first point are shown in Figure 11.
3.4. Data Processing
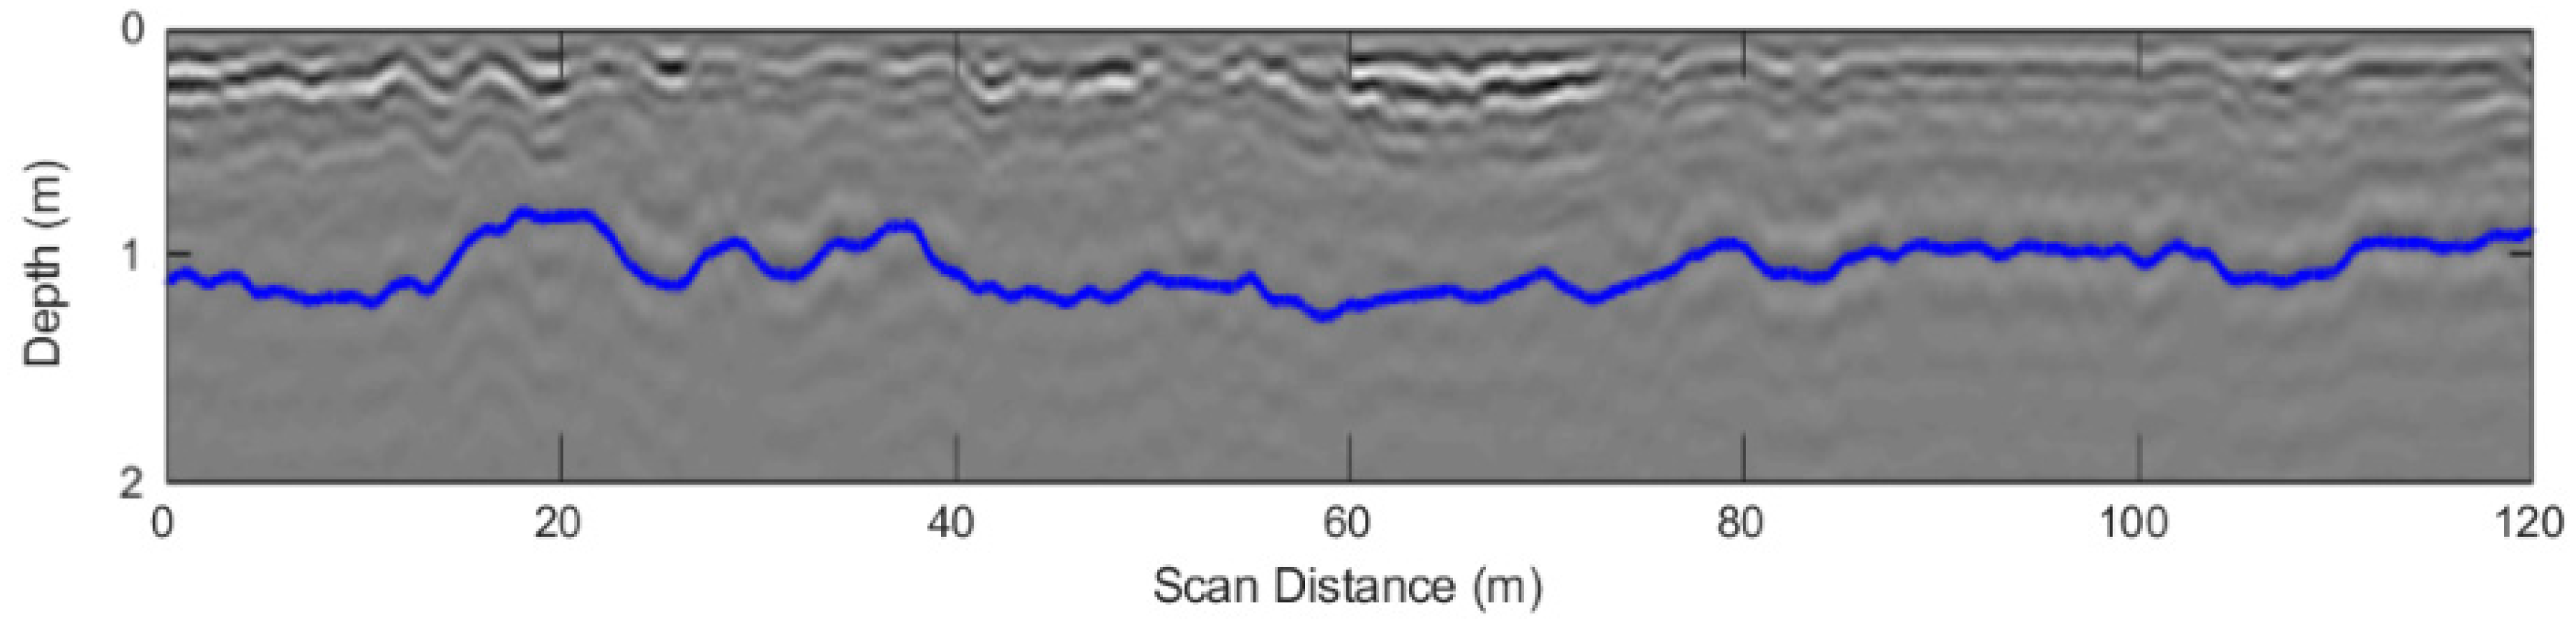
The processing routines applied to the GPR data include de-wow, background subtraction, time varying gain, temporal and spatial domain smoothing, time to depth conversion and automatic echo tracking [4]. The relative dielectric permittivity coefficient used for time to depth conversion was 4.8. This was estimated by assuming a bottom target depth of 1.1 m close to the observed exposed faulted section shown in Figure 10. Even though data was acquired from four GPR antenna frequencies (900, 600, 400, 200 MHz), the specific data used to generate the digital subterranean model was from the 400 MHz antenna module. One of the processed 400 MHz radargrams is shown in Figure 12. The blue line represents the detected interface feature corresponding to the bottom of the E4 band.
3.5. Digital Subterranean Model
A DXF file containing the digital subterranean model of the scanned surface and target interface to be tracked was generated. These models were prepared and provided to the site the same day as the survey. The digital subterranean models in the DXF file are shown in Figure 13, where the green layer represents the elevation of the scanned surface, and the yellow layer represents the detected target interface corresponding to the seam boundary to be mined.
3.6. In-cab Fleet Management Guidance System
The digital subterranean model generated by the scanning system and shown in Figure 13 was uploaded to the high-precision fleet management system in the bulldozer cab. A photo of the system in operation is shown in Figure 14. The right side of the display shows a side view of the bulldozer, along with the planned elevation generated by the sensing system (white line above red block) and the actual mined elevation (green line).
The experiment was required not to affect mine production. Accordingly, the bulldozer operator mined the block as per the normal operating procedure, where the floor mining horizon is derived solely from operator experience and visual cues. This protocol allowed post-experiment comparison of the actual mined floor with the floor predicted by the GPR based model to be undertaken.
3.7. Comparison Between Digital Subterranean Model and Mined Surface
In order to provide a comparison between the digital subterranean coal floor model generated by the scanning system and the floor of the E4 coal seam as excavated by the operator, a laser scan of the surveyed area was undertaken by the mine site after the block had been mined. The points that represent the target digital surface model and the mined floor are shown in Figure 15 in isometric view. The GPR scanned points are shown in red and the laser surveyed points are shown in blue.
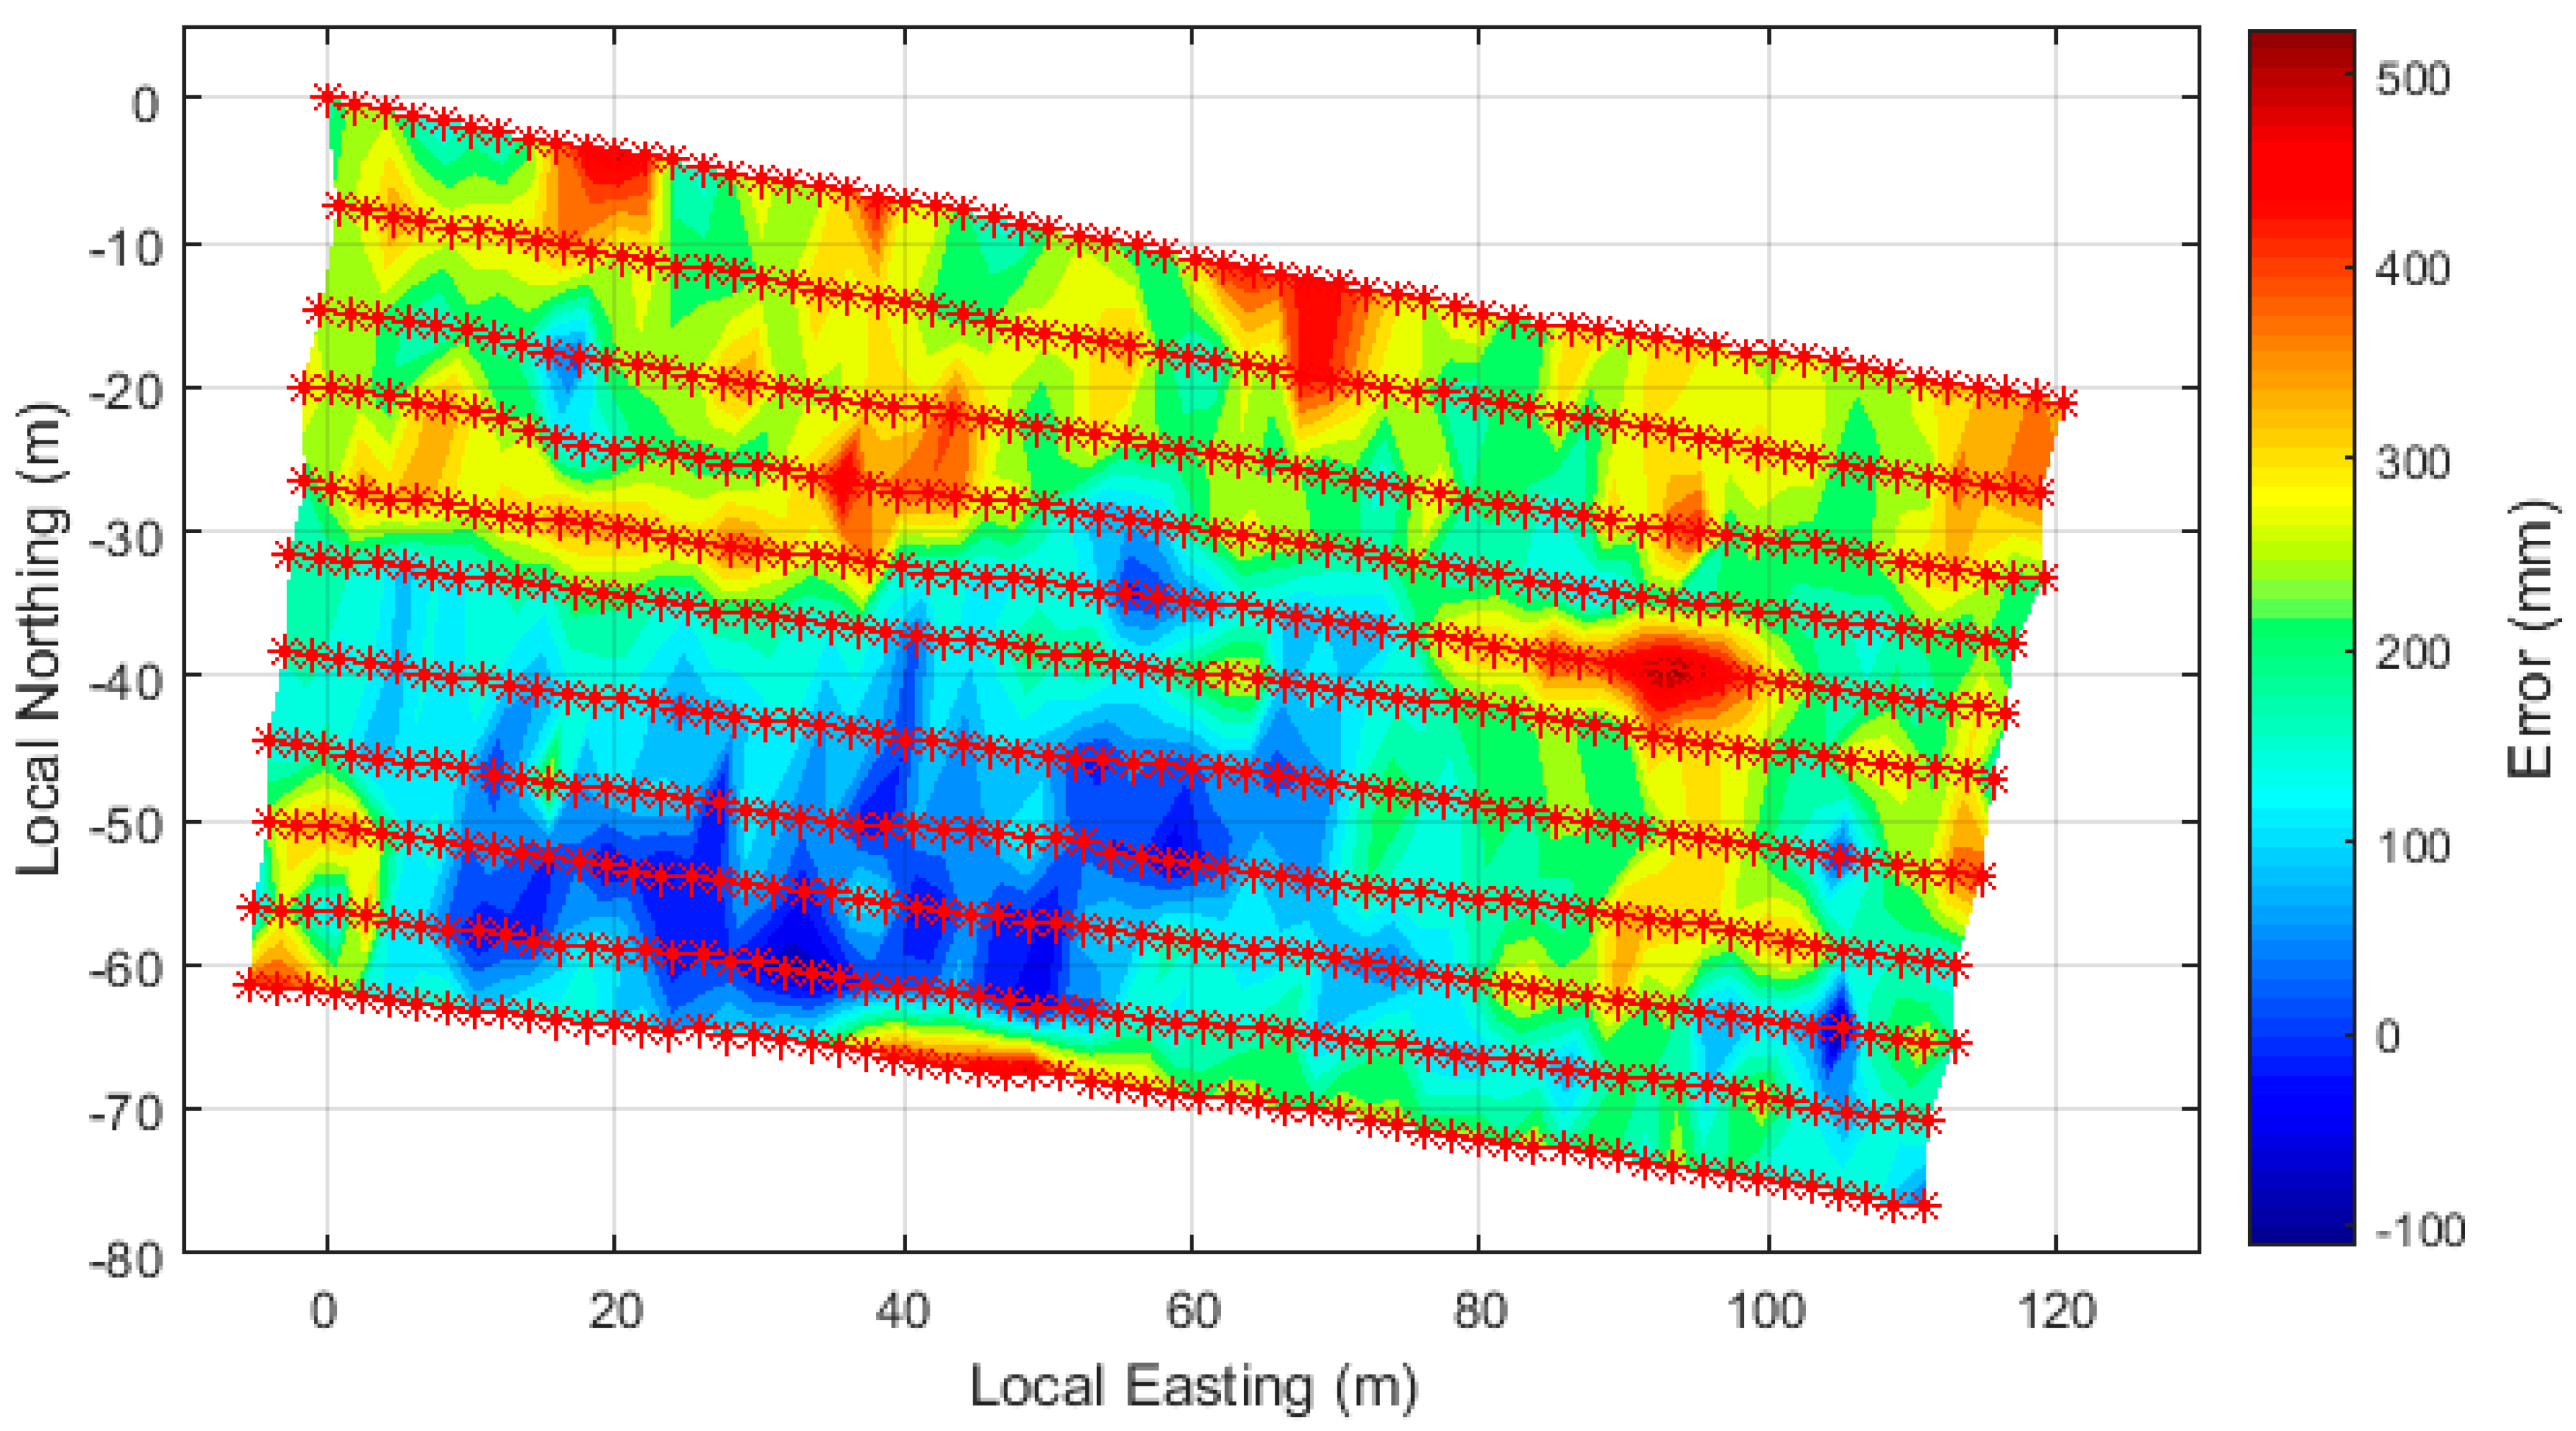
The laser data points generated by the site were interpolated to the points obtained from the GPR surface, and the error between these surfaces was computed. A contour map of the error between the two surfaces is shown in Figure 16.
The mean value of the standard depth error between the detected interface using the GPR system and the mined surface from the laser data is 207 mm, and the standard deviation is 113 mm. The histogram and normal model of this data shown in Figure 17 shows the error fits a normal distribution.
4. Discussion
The statistics presented in Section 3.7 and shown in Figure 17 reveal key information for assessing the performance of the sensing system for this survey. The non-zero mean value indicates that the error of the surface detected by the GPR system is biased. This depth error was confirmed by the operator’s observation—during the extraction process—that the model of the target E4 floor appeared to be predicting an interface above the actual mined boundary. The likeliest cause of this error was that the dielectric permittivity value chosen was incorrect, leading to a systematic error in the time to depth conversion process. For this survey, the average mined layer thickness was approximately 1.3 m. The mean error is approximately 18% of this thickness. Apart from noting that the digital surface model was higher in elevation than the floor of the coal seam, the operator saw the benefits of mining to the model. Prior to mining, normal practice involves the operator cutting a section in the block to expose the subsurface geology, so they can manually identify the correct seam boundary. One key benefit noted by the operator is that using the method described in this paper will eliminate the need for the preliminary excavation step, thereby enabling them to commence mining sooner.
Because the permittivity of the ground propagation media varies with material and moisture content, selection of the appropriate value to use in system calibration is important. Calibration of the GPR system is achieved by assuming a reasonable initial value of dielectric coefficient of the strata, and then measuring the depth of a test section of strata using the system. The estimated depth is then compared with an actual depth measurement obtained by excavation, observation and physical measurement of the separation of layers in the test section.
In this case, the GPR data used for this calibration was acquired at a location where post-survey assessment revealed that the surface consisted of an unexpected carbonaceous mud layer, rather than coal. This was the start of the first scan and corresponds to the local easting and northing location of 0,0 (top left corner in Figure 11 and Figure 16). The resultant dielectric coefficient chosen at this point using this approach was 4.8, and this value was used for depth estimation over the entire extracted block.
If, however, a dielectric coefficient value closer to 4 had been chosen, which has been observed by the authors to give accurate results in other coal surveys, it is expected that the overall depth represented in the digital surface model would have been significantly closer to the intended boundary to be mined.
Therefore, the observations identified during the post-survey assessment confirm the previous assumption that the error in the digital subterranean model as shown in Figure 16 and Figure 17 is due to an incorrect wave propagation velocity estimation, based on the assumption that the depth of the key interface feature was 1.1 m below the surface. This finding highlights the fact that the sensitivity of depth measurements in a layered medium subject to variations in composition is highly dependent on the value used for the dielectric coefficient of the medium.
5. Conclusions
This paper has presented the results of the development of a subsurface mapping system that generates digital subterranean models of underlying coal seam boundaries. The key research outcomes include the following:
- A system has been developed that can scan the surface of an open cut coal mine block using commercially available GPR equipment and a robotic tow vehicle;
- Custom software has been developed to acquire, visualize and process the data and generate digital subterranean models suitable to guide bulldozer mining machines;
- The full system was demonstrated at a production mine site, when a bulldozer operator mined with a digital surface model uploaded to the in-cab machine guidance display;
- The digital models generated will be suitable for remotely controlled extraction processes in a digital mine environment.
Whilst the generated model was observed to be in error compared with the mined floor, the result nevertheless highlights the need for technology such as this. Firstly, there are efficiencies gained by eliminating the need for the operator to manually identify the target seam boundary prior to mining. Secondly, the method assists the operator when mining at night when visual inspection and tracking of the desired seam boundary is more challenging.
There are two key areas where future research and development of this system should be pursued. Firstly, the approach used to determine the dielectric coefficient for time to depth conversion should be re-evaluated and improved. This will result in a decrease in error of the layer thickness estimates, which will lead to more accurate digital subterranean models. Secondly, effort should be put into develop path planning software and autonomous navigation of the robotic platform. Whilst the existing remote-control robotic towing platform is beneficial compared with a standard pushcart, a robotic system with full autonomous navigation capability will simplify the data collection task, in what is typically a hot outdoor environment. Furthermore, this will enable the capability to conduct repeated scans over the same path if required for comparative evaluations.
Author Contributions
Conceptualization, A.D.S.; Methodology, A.D.S. and Z.J.; Software, A.D.S.; Validation, A.D.S. and Z.J.; Formal Analysis, A.D.S.; Investigation, A.D.S. and Z.J.; Resources, A.D.S. and Z.J.; Data Curation, A.D.S.; Writing—Original Draft Preparation, A.D.S.; Writing—Review & Editing, A.D.S. and Z.J.; Visualization, A.D.S.; Supervision, A.D.S.; Project Administration, A.D.S.; Funding Acquisition, A.D.S. All authors have read and agreed to the published version of the manuscript.
Funding
Part of this research was funded by the Australia Coal Association Research Program (ACARP) grant number C25035.
Acknowledgments
The authors wish to thank the Australian coal industry, in particular ACARP, for supporting this research. They also acknowledge the support of the participating mine-site where the field trial was conducted.
Conflicts of Interest
The authors declare no conflict of interest. The funding sponsors had no role in the design of the study; in the collection, analyses, or interpretation of data; in the writing of the manuscript, and in the decision to publish the results.
References
- Abzalov, M. Applied Mining Geology; Springer: Berlin/Heidelberg, Germany, 2016; p. 448. ISBN 978-3-319-39263-9. [Google Scholar]
- Annan, A.P. Electromagnetic Principles of Ground Penetrating Radar. In Ground Penetrating Radar: Theory and Applications, 1st ed.; Jol, H.M., Ed.; Elsevier: Amsterdam, The Netherlands, 2009; pp. 3–40. ISBN 978-0-444-53348-7. [Google Scholar]
- Daniels, D.J. Ground Penetrating Radar; The Institution of Electrical Engineers: Stevenage, UK, 2004; p. 726. ISBN 0-86341-360-9. [Google Scholar]
- Conyers, L.B. Ground-Penetrating Radar for Archaeology; AltaMira Press: Lanham, MD, USA, 2004; p. 224. ISBN 978-0759107731. [Google Scholar]
- Conyers, L.B.; Goodman, D. Ground-Penetrating Radar: An Introduction for Archaeologists; AltaMira Press: Walnut Creek, CA, USA, 1997; p. 232. ISBN 0-7619-8927-7. [Google Scholar]
- Solla, M.; Puente, I.; Lorenzo, H.; Prego, F.J. GPR detection of underground pipes. In Proceedings of the 9th International Workshop on Advanced Ground Penetrating Radar (IWAGPR 2017), Edinburgh, Scotland, 28–30 June 2017; pp. 1–6. [Google Scholar]
- Ciampoli, L.B.; Benedetto, A.; Pajewski, L.; Alani, A.M.; Tosti, F. A comparison between different central frequencies of investigation in buried utility detection through GPR: A study case. In Proceedings of the 16th International Conference on Ground Penetrating Radar (GPR 2016), Hong Kong, China, 13–16 June 2016; pp. 1–4. [Google Scholar]
- Montoya, T.P.; Smith, G.S. Land mine detection using a ground-penetrating radar based on resistively loaded Vee dipoles. IEEE Trans Antennas Propag. 1999, 47, 1795–1806. [Google Scholar] [CrossRef]
- Missaoui, O.; Frigui, H.; Gader, P. Land-mine detection with ground-penetrating radar using multistream discrete hidden markov models. IEEE Trans Geosci. Remote Sens. 2011, 49, 2080–2099. [Google Scholar] [CrossRef]
- Shrestha, S.M.; Arai, I. High resolution image reconstruction by GPR using MUSIC and SAR processing method for landmine detection. In Proceedings of the 2003 International Geoscience and Remote Sensing Symposium (IGARSS 2003), Toulouse, France, 21–25 July 2003; pp. 2921–2923. [Google Scholar]
- Léger, E.; Dafflon, B.; Soom, F.; Peterson, J.; Ulrich, C.; Hubbard, S. Quantification of arctic soil and permafrost properties using ground-penetrating radar and electrical resistivity tomography datasets. IEEE J. Sel. Top. Appl. Earth Obs. Remote Sens. 2017, 10, 4348–4359. [Google Scholar] [CrossRef] [Green Version]
- Annan, P.; Diamanti, N.; Redman, J.; Jackson, S. Ground-penetrating radar for assessing winter roads. Geophysics 2016, 81, WA101–WA109. [Google Scholar] [CrossRef]
- Roberts, R.L.; Petroy, D. Semi-automatic processing of GPR data collected over pavement. In Proceedings of the 6th International Conference on Ground Penetrating Radar (GPR ’96), Sendai, Japan, 30 September–3 October 1996; pp. 347–352. [Google Scholar]
- Spagnolini, U.; Rampa, V. Multitarget detection/tracking for monostatic ground penetrating radar: Application to pavement profiling. IEEE Trans. Geosci. Remote Sens. 1999, 37, 383–394. [Google Scholar] [CrossRef]
- Ellerbruch, D.A.; Adams, J.W. Microwave Measurement of Coal Layer Thickness; Tech. Rep. NBSIR 74-387; National Bureau of Standards: Boulder, CO, USA, 1974.
- Ellerbruch, D.A.; Belsher, D.R. Electromagnetic technique of measuring coal layer thickness. IEEE Trans. Geosci. Electron. 1978, GE-16, 126–133. [Google Scholar] [CrossRef]
- Roe, K.C.; Wittmann, R.C. Improved Coal Interface Detector; Tech. Rep. NBSIR 82-1663; National Bureau of Standards: Boulder, CO, USA, 1982.
- Daniels, D.J. Short pulse radar for stratified lossy dielectric layer measurement. IEE Proc. F 1980, 127, 384–388. [Google Scholar] [CrossRef]
- Chufo, R.L.; Johnson, W.J. A radar coal thickness sensor. IEEE Trans Ind. Appl. 1993, 29, 834–840. [Google Scholar] [CrossRef]
- Ralston, J.C.; Hainsworth, D.W. Application of ground penetrating radar for coal depth measurement. In Proceedings of the IEEE International Conference on Acoustics, Speech and Signal Processing (ICASSP’99), Speech, Phoenix, AZ, USA, 15–19 March 1999; volume 4, pp. 2275–2278. [Google Scholar]
- Ralston, J.C.; Hainsworth, D.W. Use of ground penetrating radar in underground coal mining. In Proceedings of the 8th International Conference on Ground Penetrating Radar (GPR 2000), Gold Coast, Australia, 23–26 May 2000; pp. 731–736. [Google Scholar]
- Ralston, J.C.; Hainsworth, D.W.; McPhee, R.J. Application of ground penetrating radar for coal thickness measurement. In Proceedings of the IEEE TENCON ’97, Brisbane, Australia, 4 December 1997; pp. 835–838. [Google Scholar]
- Ralston, J.C.; Hainsworth, D.W.; Reid, D.C.; Anderson, D.L.; McPhee, R.J. Recent advances in remote coal mining machine sensing, guidance, and teleoperation. Robotica 2001, 19, 513–526. [Google Scholar] [CrossRef]
- Mowrey, G.L.; Ganoe, C.W.; Monaghan, W.D. A radar-based high-wall rib-thickness monitoring system. Soc. Min. Metall. Explor. Inc. 1995, 298, 1865–1869. [Google Scholar]
- Turner, G.; Yelf, R.J.; Hatherly, P.J. Coal mining applications of ground radar. Explor. Geophys. 1989, 20, 165–168. [Google Scholar] [CrossRef]
- Yelf, R.J. Ground penetrating radar in open pit coal mines for mapping of overburden, seam thickness and guidance of continuous mining machines. In Proceedings of the 6th International Conference on Ground Penetrating Radar (GPR ’96), Sendai, Japan, 30 September–3 October 1996; pp. 113–116. [Google Scholar]
- Mathiak, T.; Kesting, M.; Overmeyer, L.; Gau, V. Methodology for automatic boundary layer detection using ground penetrating radar. In Proceedings of the 6th International Workshop on Advanced Ground Penetrating Radar (IWAGPR 2011), Aachen, Germany, 22–24 June 2011; pp. 250–254. [Google Scholar]
- Erten, O.; Kizil, M.S.; Topal, E.; McAndrew, L. Spatial prediction of lateral variability of a laterite-type bauxite horizon using ancillary ground-penetrating radar data. Nat. Resour. Res. 2013, 22, 207–227. [Google Scholar] [CrossRef]
- Erten, O. Profiling and Mining Control to Mitigate Dilution Effect from SIO2 at the Base of a Bauxite Deposit. Ph.D. Thesis, School of Mechanical and Mining Engineering, The University of Queensland, Queensland, Australia, 2012. [Google Scholar]
- Dagasan, Y. Development of a Grade Control Technique Optimizing Dilution and Ore Loss Trade-Off in Lateritic Bauxite Deposits. Ph.D. Thesis, WA School of Mines, Curtin University, Western Australia, Australia, 2018. [Google Scholar]
- Santos, V.R.N.; Teixeira, F.L. Application of time-reversal-based processing techniques to enhance detection of GPR targets. J. Appl. Geophys. 2017, 146, 80–94. [Google Scholar] [CrossRef] [Green Version]
- Ciuonzo, D.; Romano, G.; Solimene, R. Performance Analysis of Time-Reversal MUSIC. IEEE Trans. Signal Process. 2015, 63, 2650–2662. [Google Scholar] [CrossRef]
- Ciuonzo, D.; Rossi, P.S. Noncolocated Time-Reversal MUSIC: High-SNR Distribution of Null Spectrum. IEEE Signal Process. Lett. 2017, 24, 397–401. [Google Scholar] [CrossRef] [Green Version]
- Lever, J.H.; Delaney, A.J.; Ray, L.E.; Trautmann, E.; Barna, L.A.; Burzynski, A.M. Autonomous GPR surveys using the polar rover. Yeti. J. Field Robot. 2013, 30, 194–215. [Google Scholar] [CrossRef]
- Furgale, P.; Barfoot, T.D.; Ghafoor, N.; Williams, K.; Osinski, G. Field testing of an integrated surface/subsurface modeling technique for planetary exploration. Int. J. Robot. Res. 2010, 29, 1529–1549. [Google Scholar] [CrossRef]
- MineScape. Available online: https://new.abb.com/enterprise-software/intelligent-mining-solutions/minescape (accessed on 13 March 2017).
- Bentley View. Available online: https://www.bentley.com/en/products/product-line/modeling-and-visualization-software/bentley-view (accessed on 27 September 2017).
- Intergovernmental Committee on Surveying and Mapping. Geocentric Datum of Australia 2020 Technical Manual. Available online: https://www.icsm.gov.au/sites/default/files/GDA2020TechnicalManualV1.1.1.pdf (accessed on 16 March 2018).
Figure 1.
Processed ground penetrating radar (GPR) data in the form of (a) radargram and (b) isosurface.
Figure 1.
Processed ground penetrating radar (GPR) data in the form of (a) radargram and (b) isosurface.

Figure 2.
Commercial GPR system utilized for the coal seam sensing system. The items consist of an antenna (left), controller and cable (centre), computer (right) and 12V battery (centre bottom).
Figure 2.
Commercial GPR system utilized for the coal seam sensing system. The items consist of an antenna (left), controller and cable (centre), computer (right) and 12V battery (centre bottom).

Figure 3.
Architecture of system hardware and software.

Figure 4.
Remote control tow vehicle and sensor sled.

Figure 5.
Visualization software developed to monitor sensor data in real-time during acquisition.

Figure 6.
Data processing steps.

Figure 7.
Software developed to process the GPR data (left) and generate the digital subterranean model (right).
Figure 7.
Software developed to process the GPR data (left) and generate the digital subterranean model (right).

Figure 8.
Screenshot of digital subterranean model generated by the sensing system software. The green layer represents the scanned coal surface, and the yellow layer represents the bottom of the scanned coal seam.
Figure 8.
Screenshot of digital subterranean model generated by the sensing system software. The green layer represents the scanned coal surface, and the yellow layer represents the bottom of the scanned coal seam.

Figure 9.
Area of an open cut coal mine surveyed to evaluate the sensing system. The red lines represent the path taken by the scanning system.
Figure 9.
Area of an open cut coal mine surveyed to evaluate the sensing system. The red lines represent the path taken by the scanning system.

Figure 10.
Exposed faulted section at end of block showing subsurface geology, along with core log extract and graphic of the geology structure.
Figure 10.
Exposed faulted section at end of block showing subsurface geology, along with core log extract and graphic of the geology structure.

Figure 11.
Path of survey lines shown in local co-ordinates.

Figure 12.
Radargram of one of the 400 MHz processed survey lines. The blue line represents the feature corresponding to the coal to interburden interface at the bottom of the E4 band.
Figure 12.
Radargram of one of the 400 MHz processed survey lines. The blue line represents the feature corresponding to the coal to interburden interface at the bottom of the E4 band.

Figure 13.
Digital subterranean model generated by the scanning system provided to the mine site. The green layer represents the scanned surface, and the yellow layer represents the detected subsurface interface at the bottom of the E4 coal band.
Figure 13.
Digital subterranean model generated by the scanning system provided to the mine site. The green layer represents the scanned surface, and the yellow layer represents the detected subsurface interface at the bottom of the E4 coal band.

Figure 14.
In-cab display of high-precision fleet management system. Plan view of the bulldozer mining the block is shown on the left and side view of bulldozer and target elevation line on the right.
Figure 14.
In-cab display of high-precision fleet management system. Plan view of the bulldozer mining the block is shown on the left and side view of bulldozer and target elevation line on the right.

Figure 15.
Digital subterranean model points representing (red) detected coal to interburden interface and (blue) laser surveyed points obtained after mining.
Figure 15.
Digital subterranean model points representing (red) detected coal to interburden interface and (blue) laser surveyed points obtained after mining.

Figure 16.
Plan view contour map of error between the targeted E4 coal floor digital surface model and actual mined E4 coal floor.
Figure 16.
Plan view contour map of error between the targeted E4 coal floor digital surface model and actual mined E4 coal floor.

Figure 17.
Histogram of depth error in mm between the digital subterranean model provided to the mine and the actual mined E4 coal floor.
Figure 17.
Histogram of depth error in mm between the digital subterranean model provided to the mine and the actual mined E4 coal floor.

© 2020 by the authors. Licensee MDPI, Basel, Switzerland. This article is an open access article distributed under the terms and conditions of the Creative Commons Attribution (CC BY) license (http://creativecommons.org/licenses/by/4.0/).
Share and Cite
MDPI and ACS Style
Strange, A.D.; Jecny, Z. Development of Digital Subterranean Models for Real-Time Open Cut Horizon Control. Resources 2020, 9, 50. https://doi.org/10.3390/resources9040050
AMA Style
Strange AD, Jecny Z. Development of Digital Subterranean Models for Real-Time Open Cut Horizon Control. Resources. 2020; 9(4):50. https://doi.org/10.3390/resources9040050
Chicago/Turabian StyleStrange, Andrew D., and Zak Jecny. 2020. "Development of Digital Subterranean Models for Real-Time Open Cut Horizon Control" Resources 9, no. 4: 50. https://doi.org/10.3390/resources9040050
Note that from the first issue of 2016, this journal uses article numbers instead of page numbers. See further details here.