1. Introduction
Ageing induces many changes in our skin: the skin loses tonicity, wrinkles increase in number and depth; large variations occur in the level of hydration too. We believe that interesting information can be obtained if we study the impact of these changes on the main skin parameters (skin hydration, elasticity and roughness) which are usually considered when testing the efficacy of anti-age cosmetics. Moreover, the study of the behavior of clusters of subjects belonging to specific age groups may help to properly select the volunteers to be included in an efficacy study and increase the probability to obtain good results. The first aim of the study was to analyze the correlation between the age of the volunteers and three biophysical properties of their skin: hydration, elasticity and surface roughness. We studied the trend showed by these skin parameters as a function of the age. Secondly, we considered the variations (significant or non-significant) obtained at the end of the period of application of cosmetic products designed for the face, in order to investigate the susceptibility to improvement of the subjects belonging to the different age groups.
2. Experimental Section
We considered skin hydration, overall elasticity (R2 parameter) and skin roughness (Ra parameter: average roughness; and Rz parameter: maximum average roughness) values collected during clinical studies aimed at testing the efficacy of several anti-age cosmetic products for the face [
1,
2] and performed in our laboratory over a six-year period of time (from 2007 to 2013). The volunteers applied the anti-age products on the face twice a day, both in the morning and in the evening, for time periods ranging from 4 to 8 weeks. All the clinical studies were approved by ISPE Ethical Committee for cosmetic tests, appointed on 12 January 1998.
In this way, we were able to collect about 800–1000 data on average for each considered biophysical skin parameter. We took into account only data related to measurements performed on the face of a female population aged between 18 and 70 years of age. The instrumental measurements were carried out in a temperature and humidity-controlled room (24 ± 2 °C; 50% ± 10% relative humidity). Measurements of skin hydration [
3] (Corneometer, Courage and Khazaka, Köln, Germany) and of elasticity [
4,
5] (Cutometer, Courage and Khazaka) were performed on the cheeks while skin roughness measurements [
6,
7], taken by means of silicone replicas (SILFLO, J&S Davis, Stevenage, UK) and image analysis (Quantilines, Monaderm, Monaco), were instead performed on the crow’s feet wrinkles of the eye contour. In the analysis we included the basal data taken before the cosmetic treatment, and the variations (
i.e., improvement or worsening in the considered parameters) obtained at the end of the period of application. The basal data and the related variations were divided in clusters corresponding to the different age groups. As regards skin hydration and elasticity, we considered five age groups. The data related to skin roughness were instead divided into four age groups in order to exclude women under 30 years old, who were usually not included in the anti-wrinkle efficacy studies. The instrumental values and their variations were statistically compared by means of One-Way ANOVA (analysis of variance) for parametric and independent groups of data. The groups of data were considered statistically significant for a probability value
p ≤ 0.05.
3. Results and Discussion
3.1. Skin Hydration
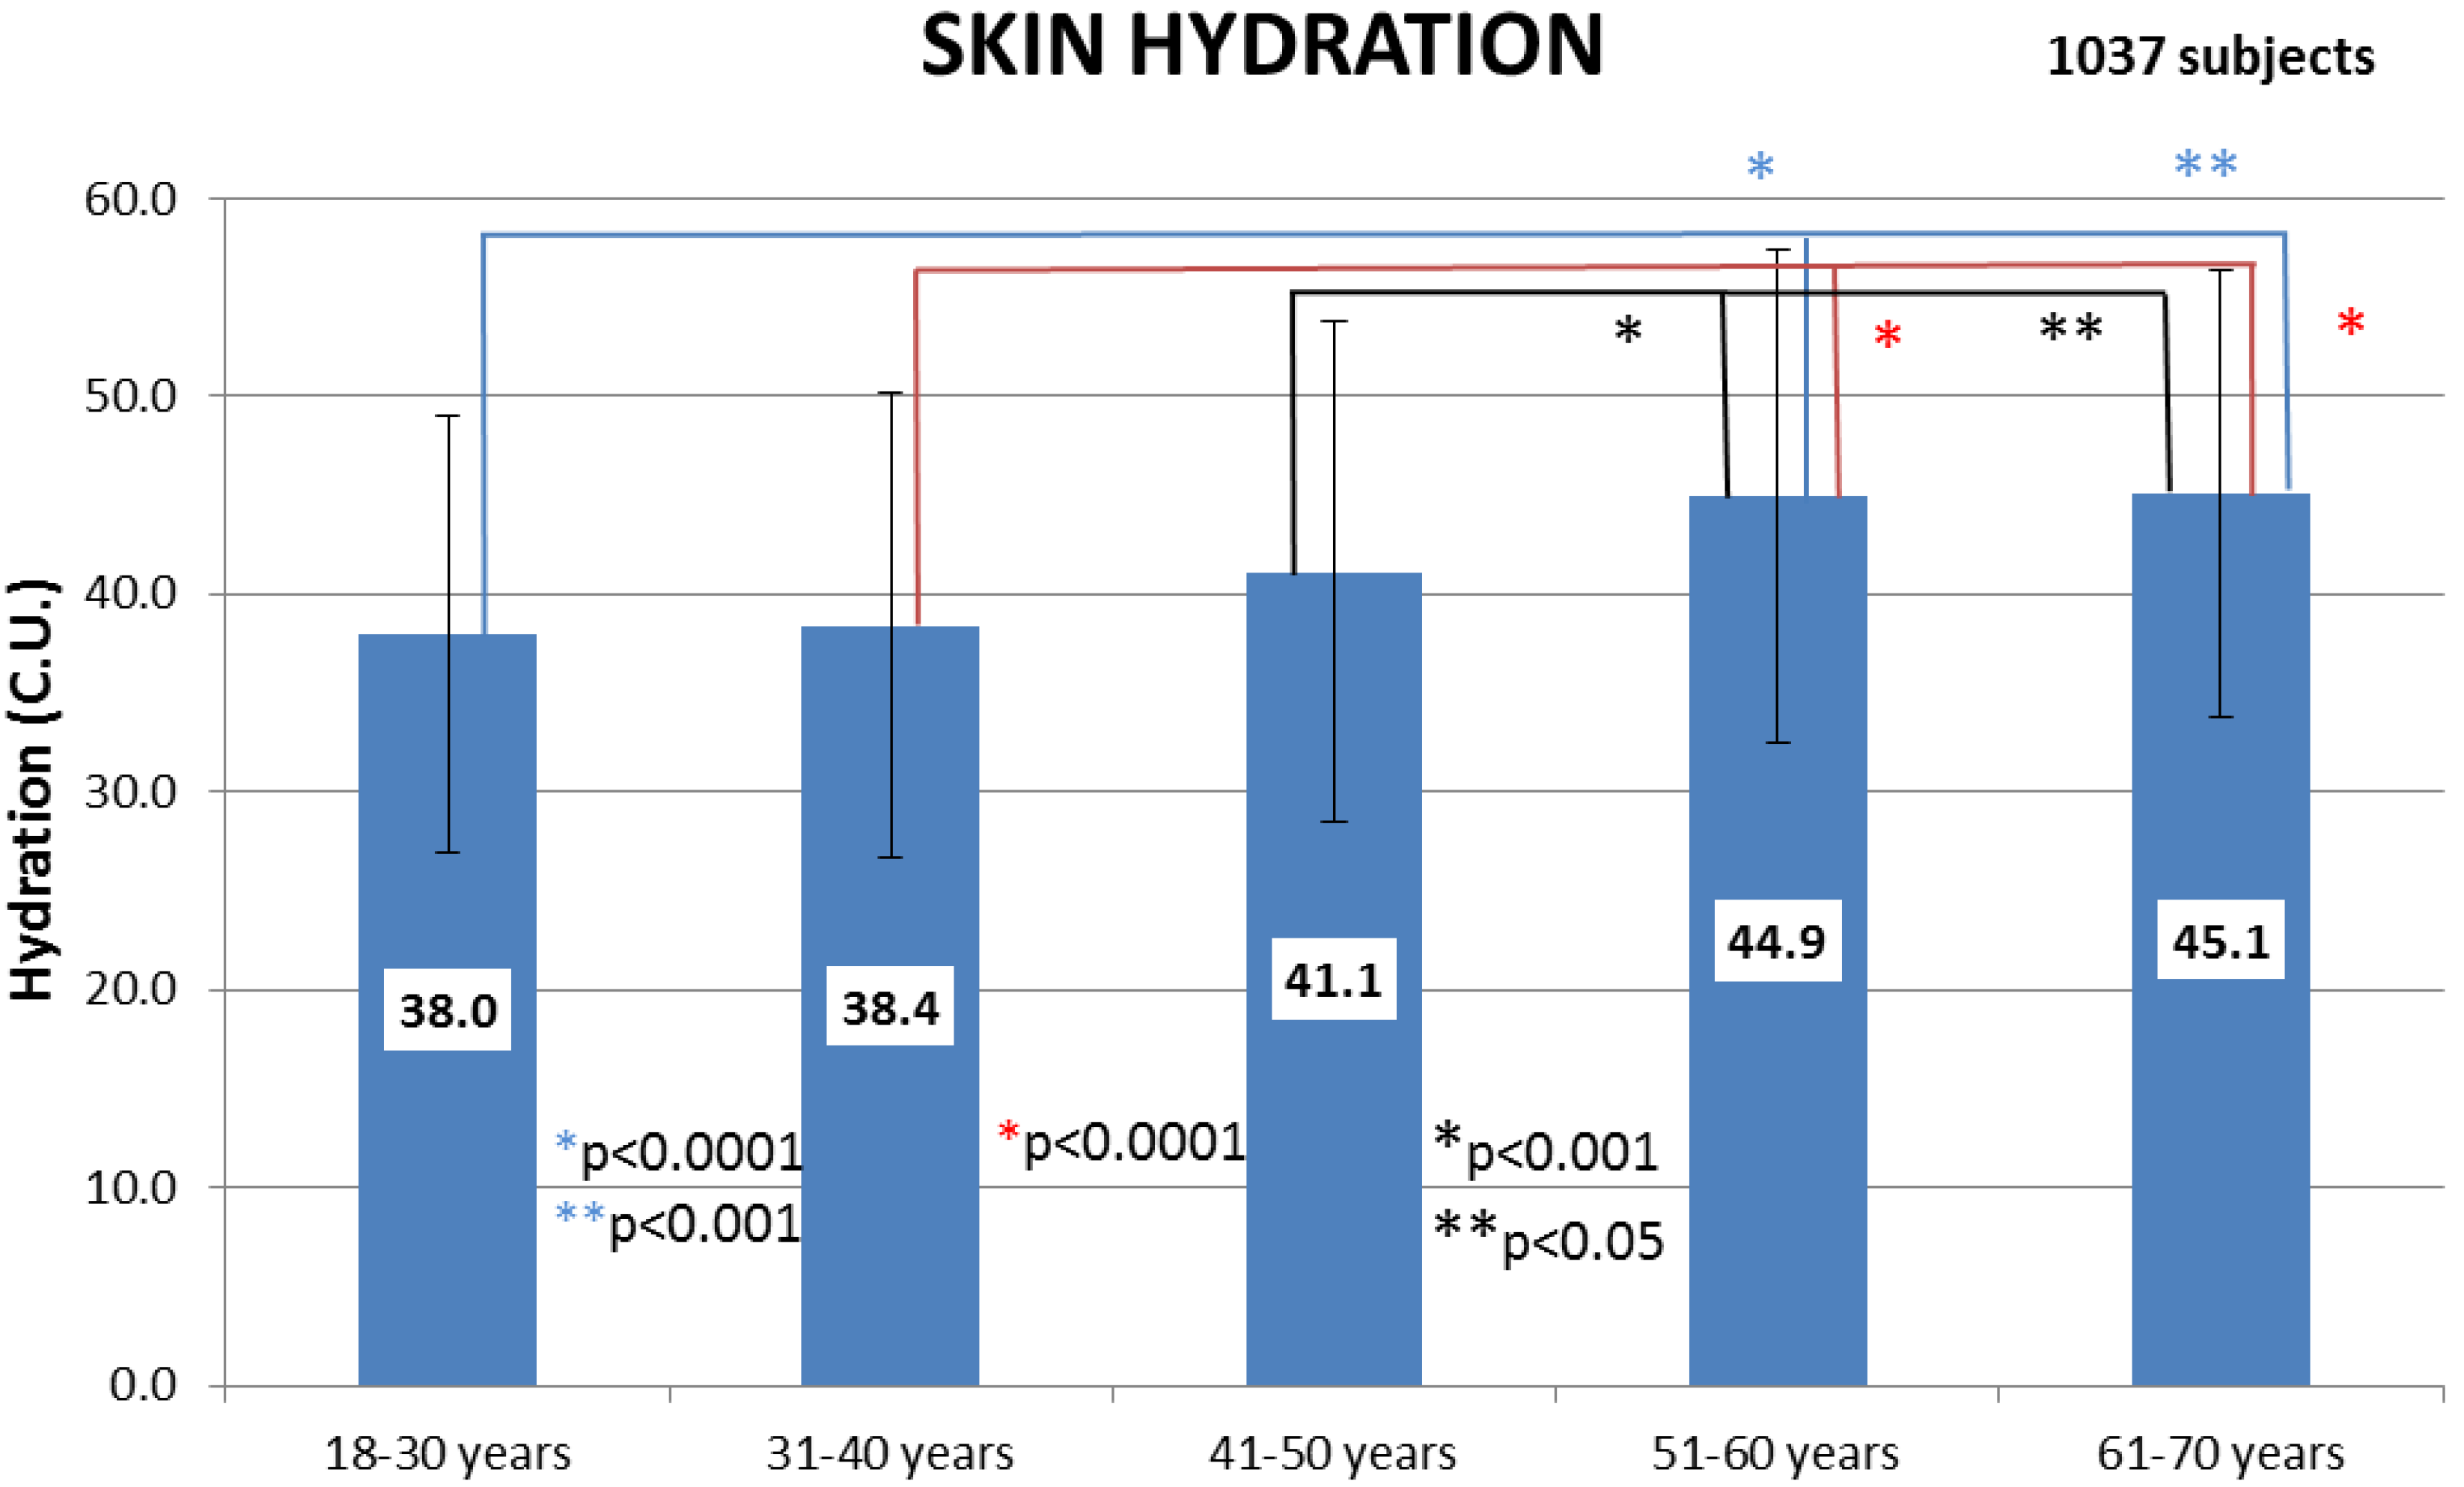
The analysis of the collected basal data (
Table 1) showed that skin hydration values increased with the age of the subjects. In particular, a statistically significant difference between the age groups 51–60 and 61–70 years of age and the younger ones was evidenced (
Figure 1).
Table 1.
Skin hydration mean basal values and standard deviations.
Table 1.
Skin hydration mean basal values and standard deviations.
| Age Group | Mean Value | Standard Deviation |
|---|
| 18–30 years | 38.0 | 11.1 |
| 31–40 years | 38.4 | 11.8 |
| 41–50 years | 41.1 | 12.7 |
| 51–60 years | 44.9 | 12.5 |
| 61–70 years | 45.1 | 11.3 |
Figure 1.
Skin hydration basal values as a function of the age group. Statistical comparison among the age groups:
![Cosmetics 01 00117 i001]() p
p < 0.0001 (18–30
vs. 51–60 years);
![Cosmetics 01 00117 i002]() p
p < 0.001 (18–30
vs. 61–70 years);
![Cosmetics 01 00117 i003]() p
p < 0.0001 (31–40
vs. 51–60 years; 31–40
vs. 61–70 years); *
p < 0.001 (41–50
vs. 51–60 years); **
p < 0.05 (41–50
vs. 61–70 years).
This result is apparently inexplicable, considering that in literature the water content of the face skin is reported to decrease with ageing [
8,
9]. A possible explanation could be correlated to the group of volunteers we considered. The high skin hydration values recorded in women over 50 years old may depend on the life style of this age group: mature women living in a big city that take care of their skin and probably apply moisturizing face cream every day, thus improving effectively their basal skin hydration level.
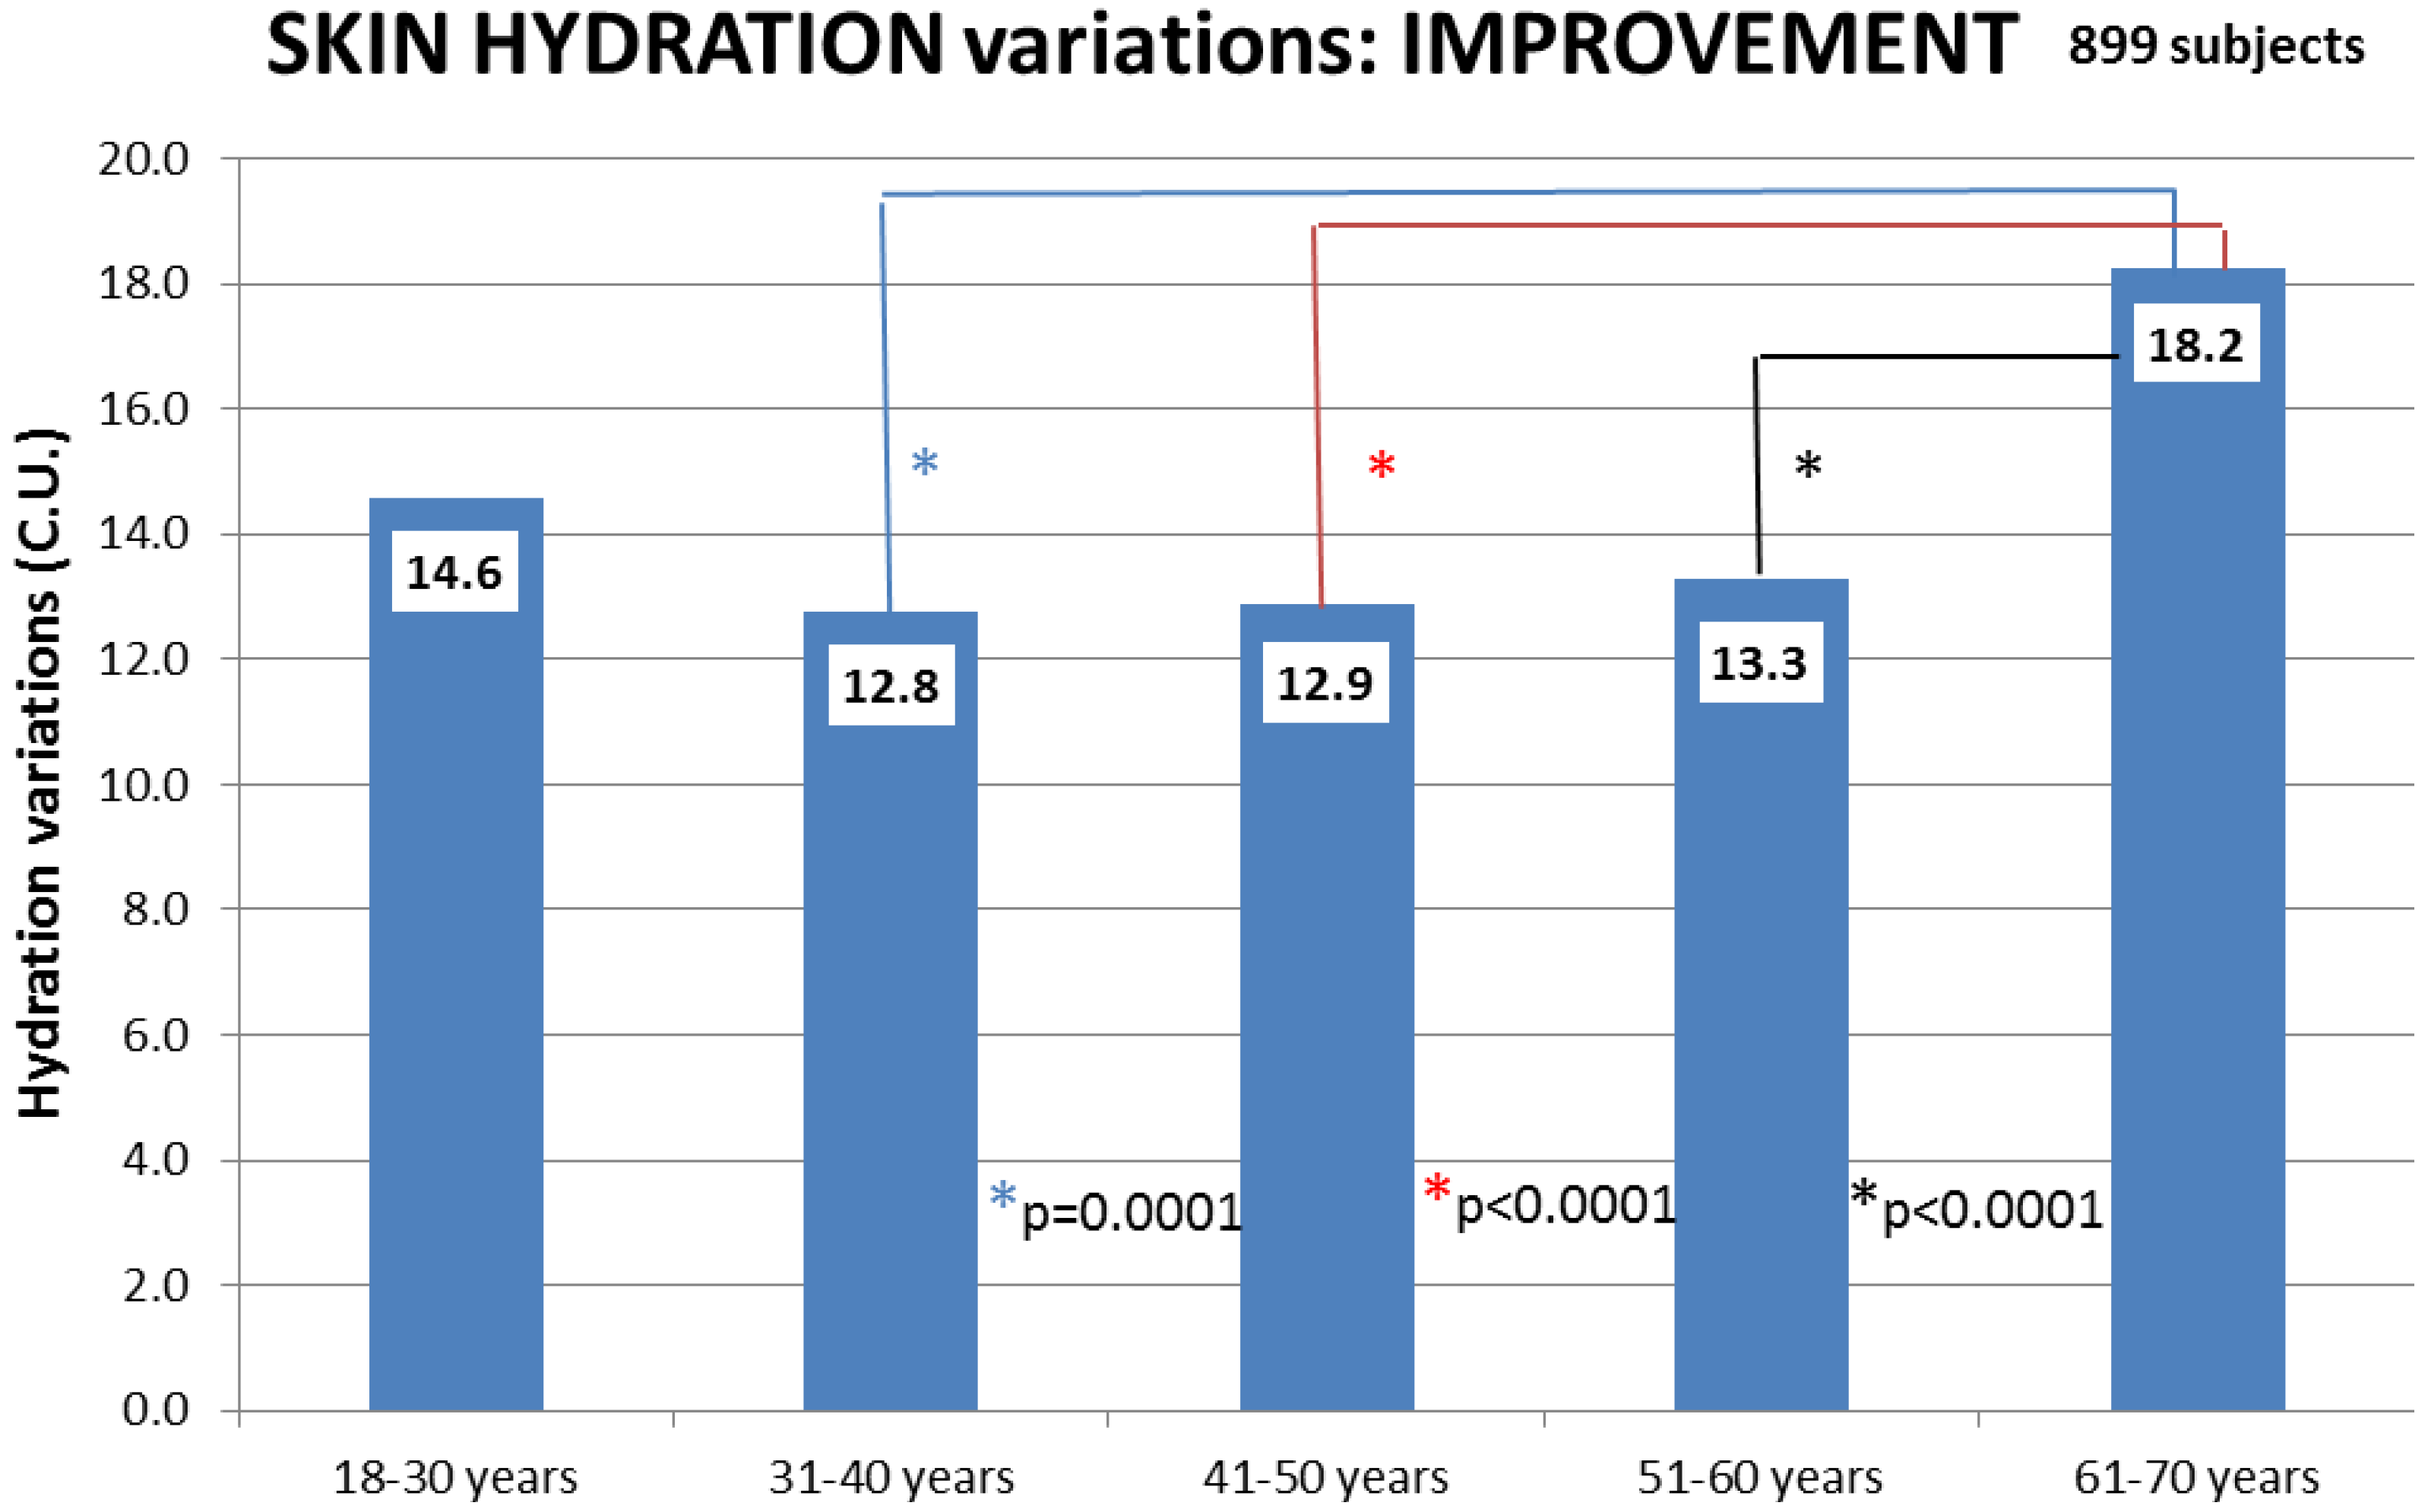
A second interesting result is that 61–70 years old women, apart from showing high basal skin hydration values, resulted also to be the most susceptible to improvement after a cosmetic treatment (
Figure 2). In fact, by comparing the improvements in skin hydration values recorded in the five age groups a statistically significant difference was evidenced between women aged 61–70 and the groups of younger women, especially the groups ranging from 31 to 60 years old.
Figure 2.
Improvements in skin hydration values at the end of a cosmetic treatment as a function of the age group. Statistical comparison among the age groups:
![Cosmetics 01 00117 i001]() p
p = 0.0001 (31–40
vs. 61–70 years);
![Cosmetics 01 00117 i003]() p
p < 0.0001 (41–50
vs. 61–70 years); *
p < 0.0001 (51–60
vs. 61–70 years).
3.2. Skin Elasticity (R2)
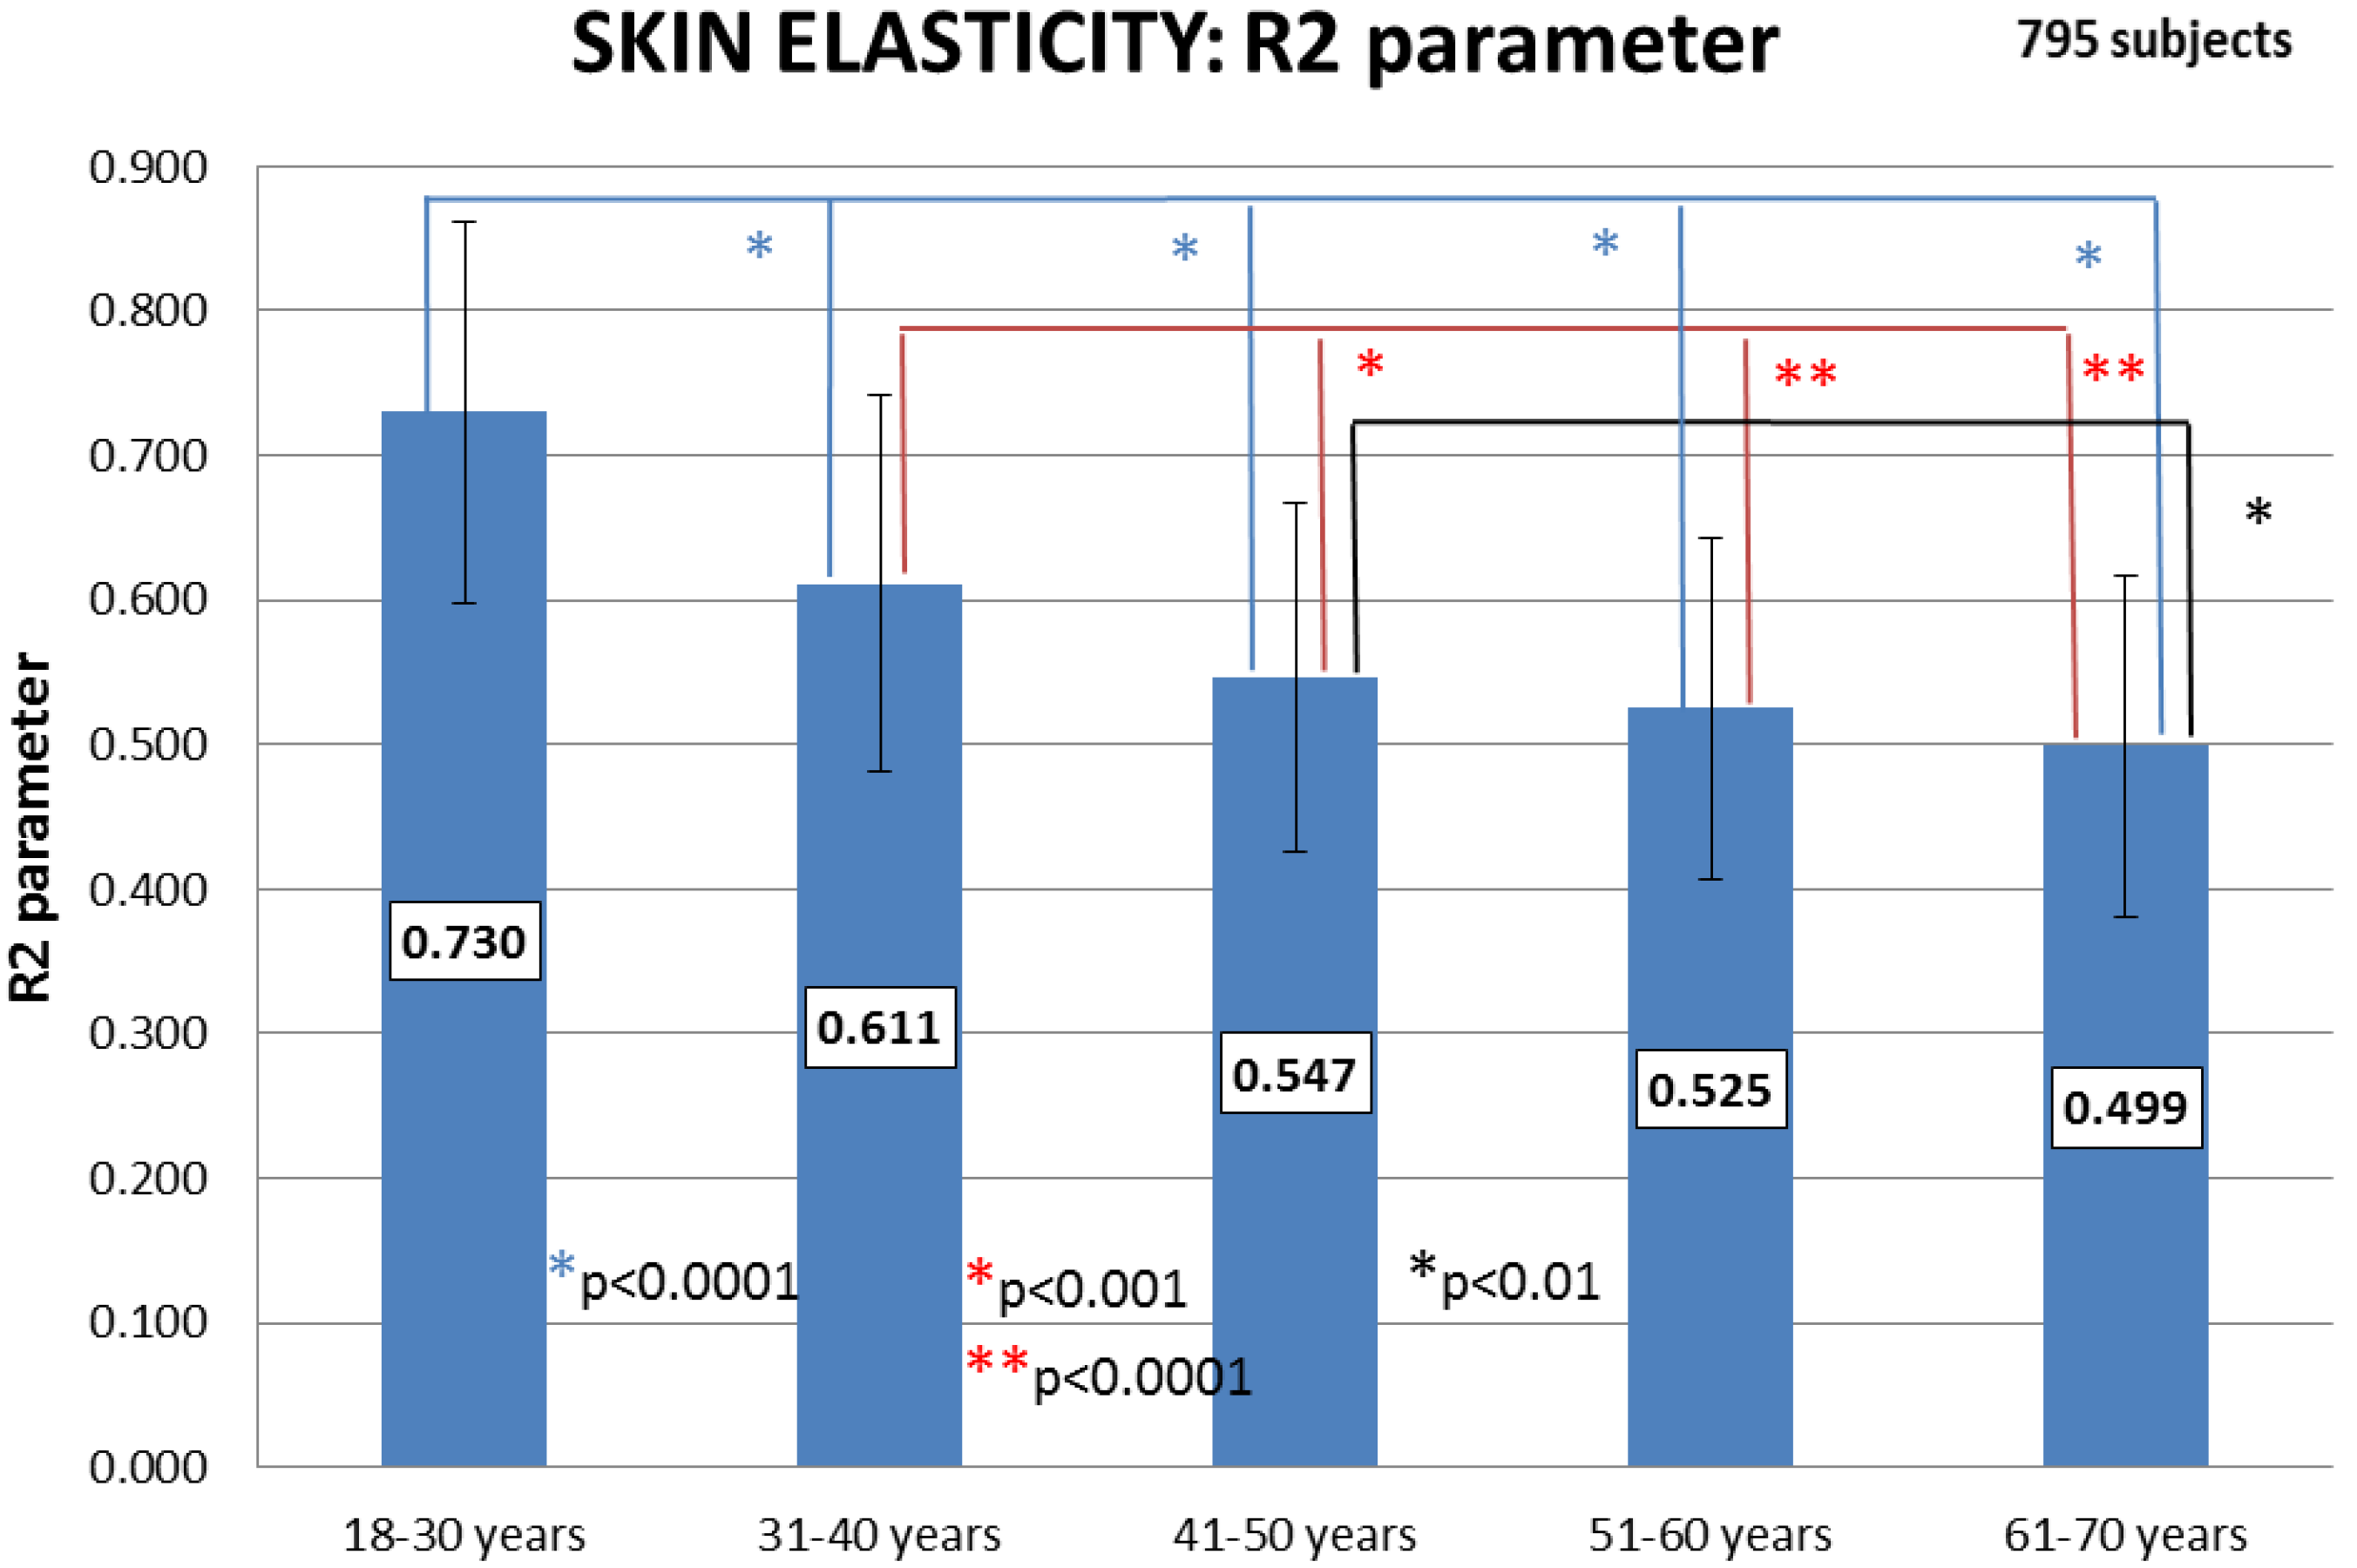
The skin tends to lose elasticity and to acquire laxity over ageing [
10]. The analysis of the basal values of R2 parameter (
Table 2) showed that overall elasticity decreases significantly with the age (
Figure 3).
Table 2.
Skin elasticity (R2 parameter) mean basal values and standard deviations.
Table 2.
Skin elasticity (R2 parameter) mean basal values and standard deviations.
| Age Group | Mean Value | Standard Deviation |
|---|
| 18–30 years | 0.730 | 0.132 |
| 31–40 years | 0.611 | 0.130 |
| 41–50 years | 0.547 | 0.121 |
| 51–60 years | 0.525 | 0.118 |
| 61–70 years | 0.499 | 0.118 |
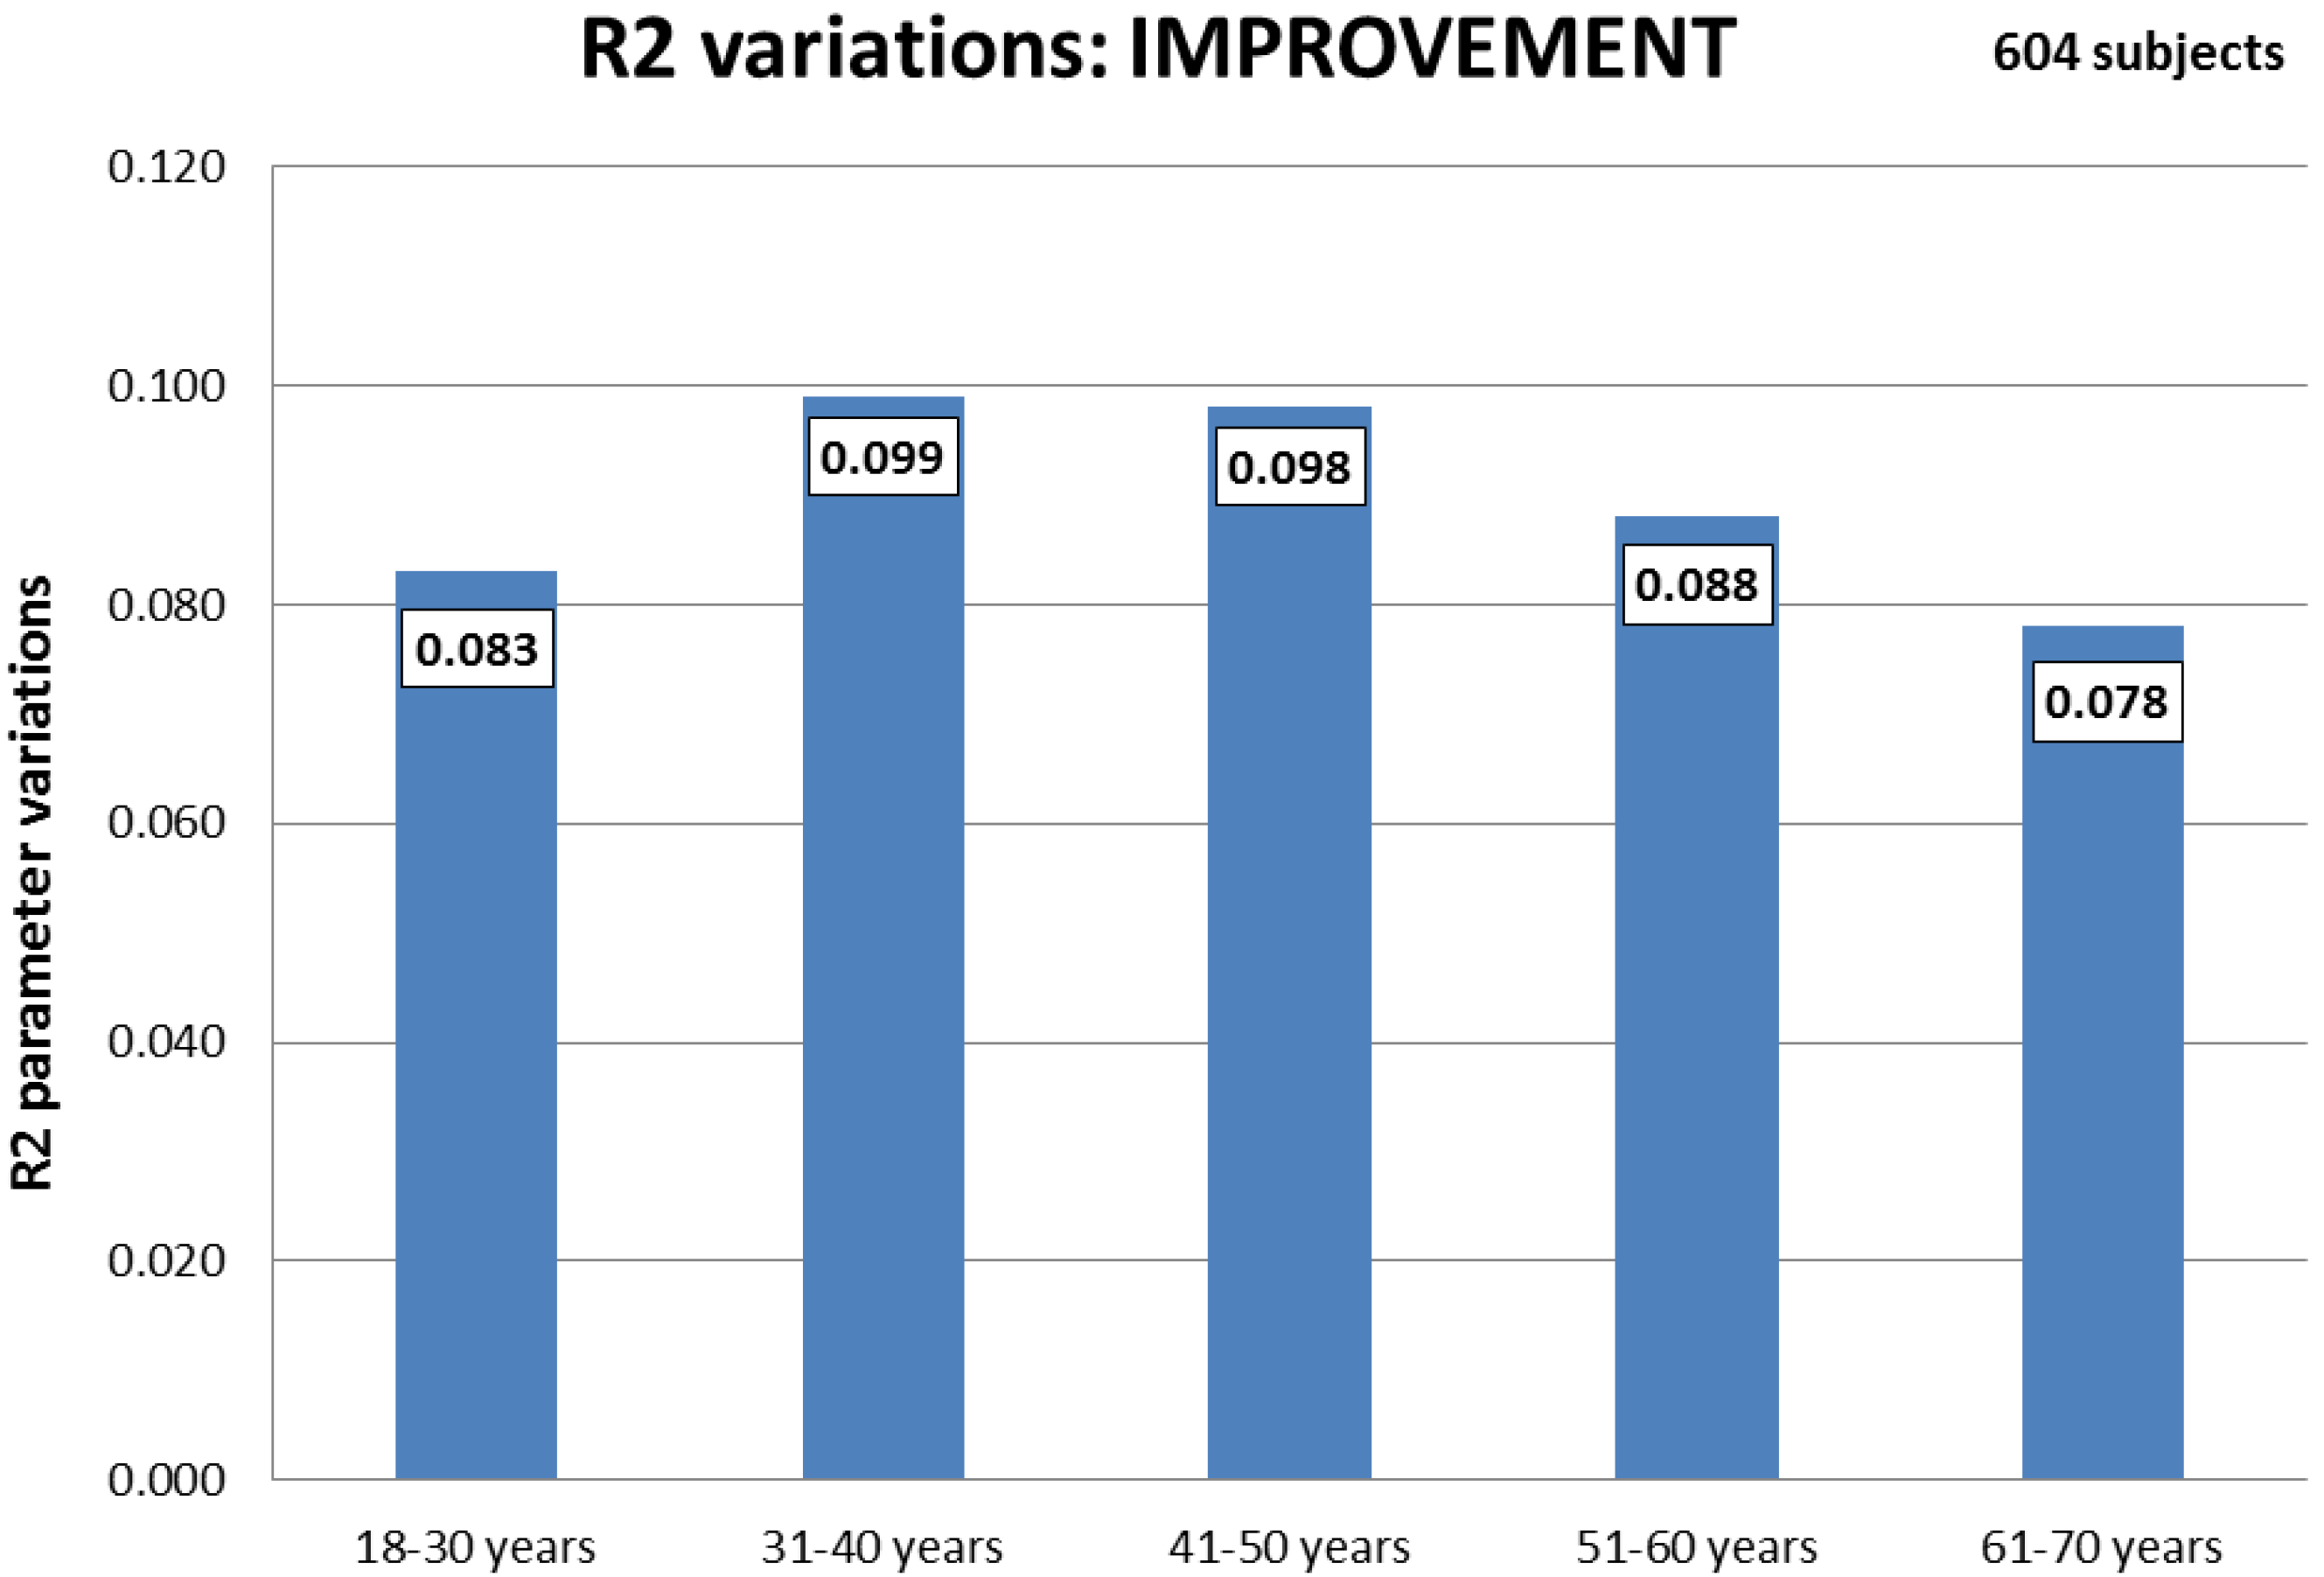
The comparison among the improvements in skin elasticity recorded in the 5 age groups did not show any statistically significant difference (
Figure 4). The susceptibility to cosmetic treatment was therefore similar for all the age groups, although the highest improvements values were found in women between 31 and 50 years old.
Figure 3.
Skin elasticity basal values (R2 parameter) as a function of the age group. Statistical comparison among the age groups:
![Cosmetics 01 00117 i001]() p
p < 0.0001 (18–30
vs. 31–40 years; 18–30
vs. 41–50 years; 18–30
vs. 51–60 years; 18–30
vs. 61–70 years);
![Cosmetics 01 00117 i003]() p
p < 0.001 (31–40
vs. 41–50 years);
![Cosmetics 01 00117 i004]() p
p < 0.0001 (31–40
vs. 51–60 years; 31–40
vs. 61–70 years); *
p < 0.01 (41–50
vs. 61–70 years).
Figure 4.
Improvements in skin elasticity values at the end of a cosmetic treatment as a function of the age group. Statistical comparison among the age groups: p > 0.05 (non-significant).
Figure 4.
Improvements in skin elasticity values at the end of a cosmetic treatment as a function of the age group. Statistical comparison among the age groups: p > 0.05 (non-significant).
3.3. Skin Roughness (Ra and Rz Parameters)
As expected [
10], the analysis of the skin roughness basal values (
Table 3 and
Table 4) showed a statistically significant increase of both parameters as a function of the age (
Figure 5 and
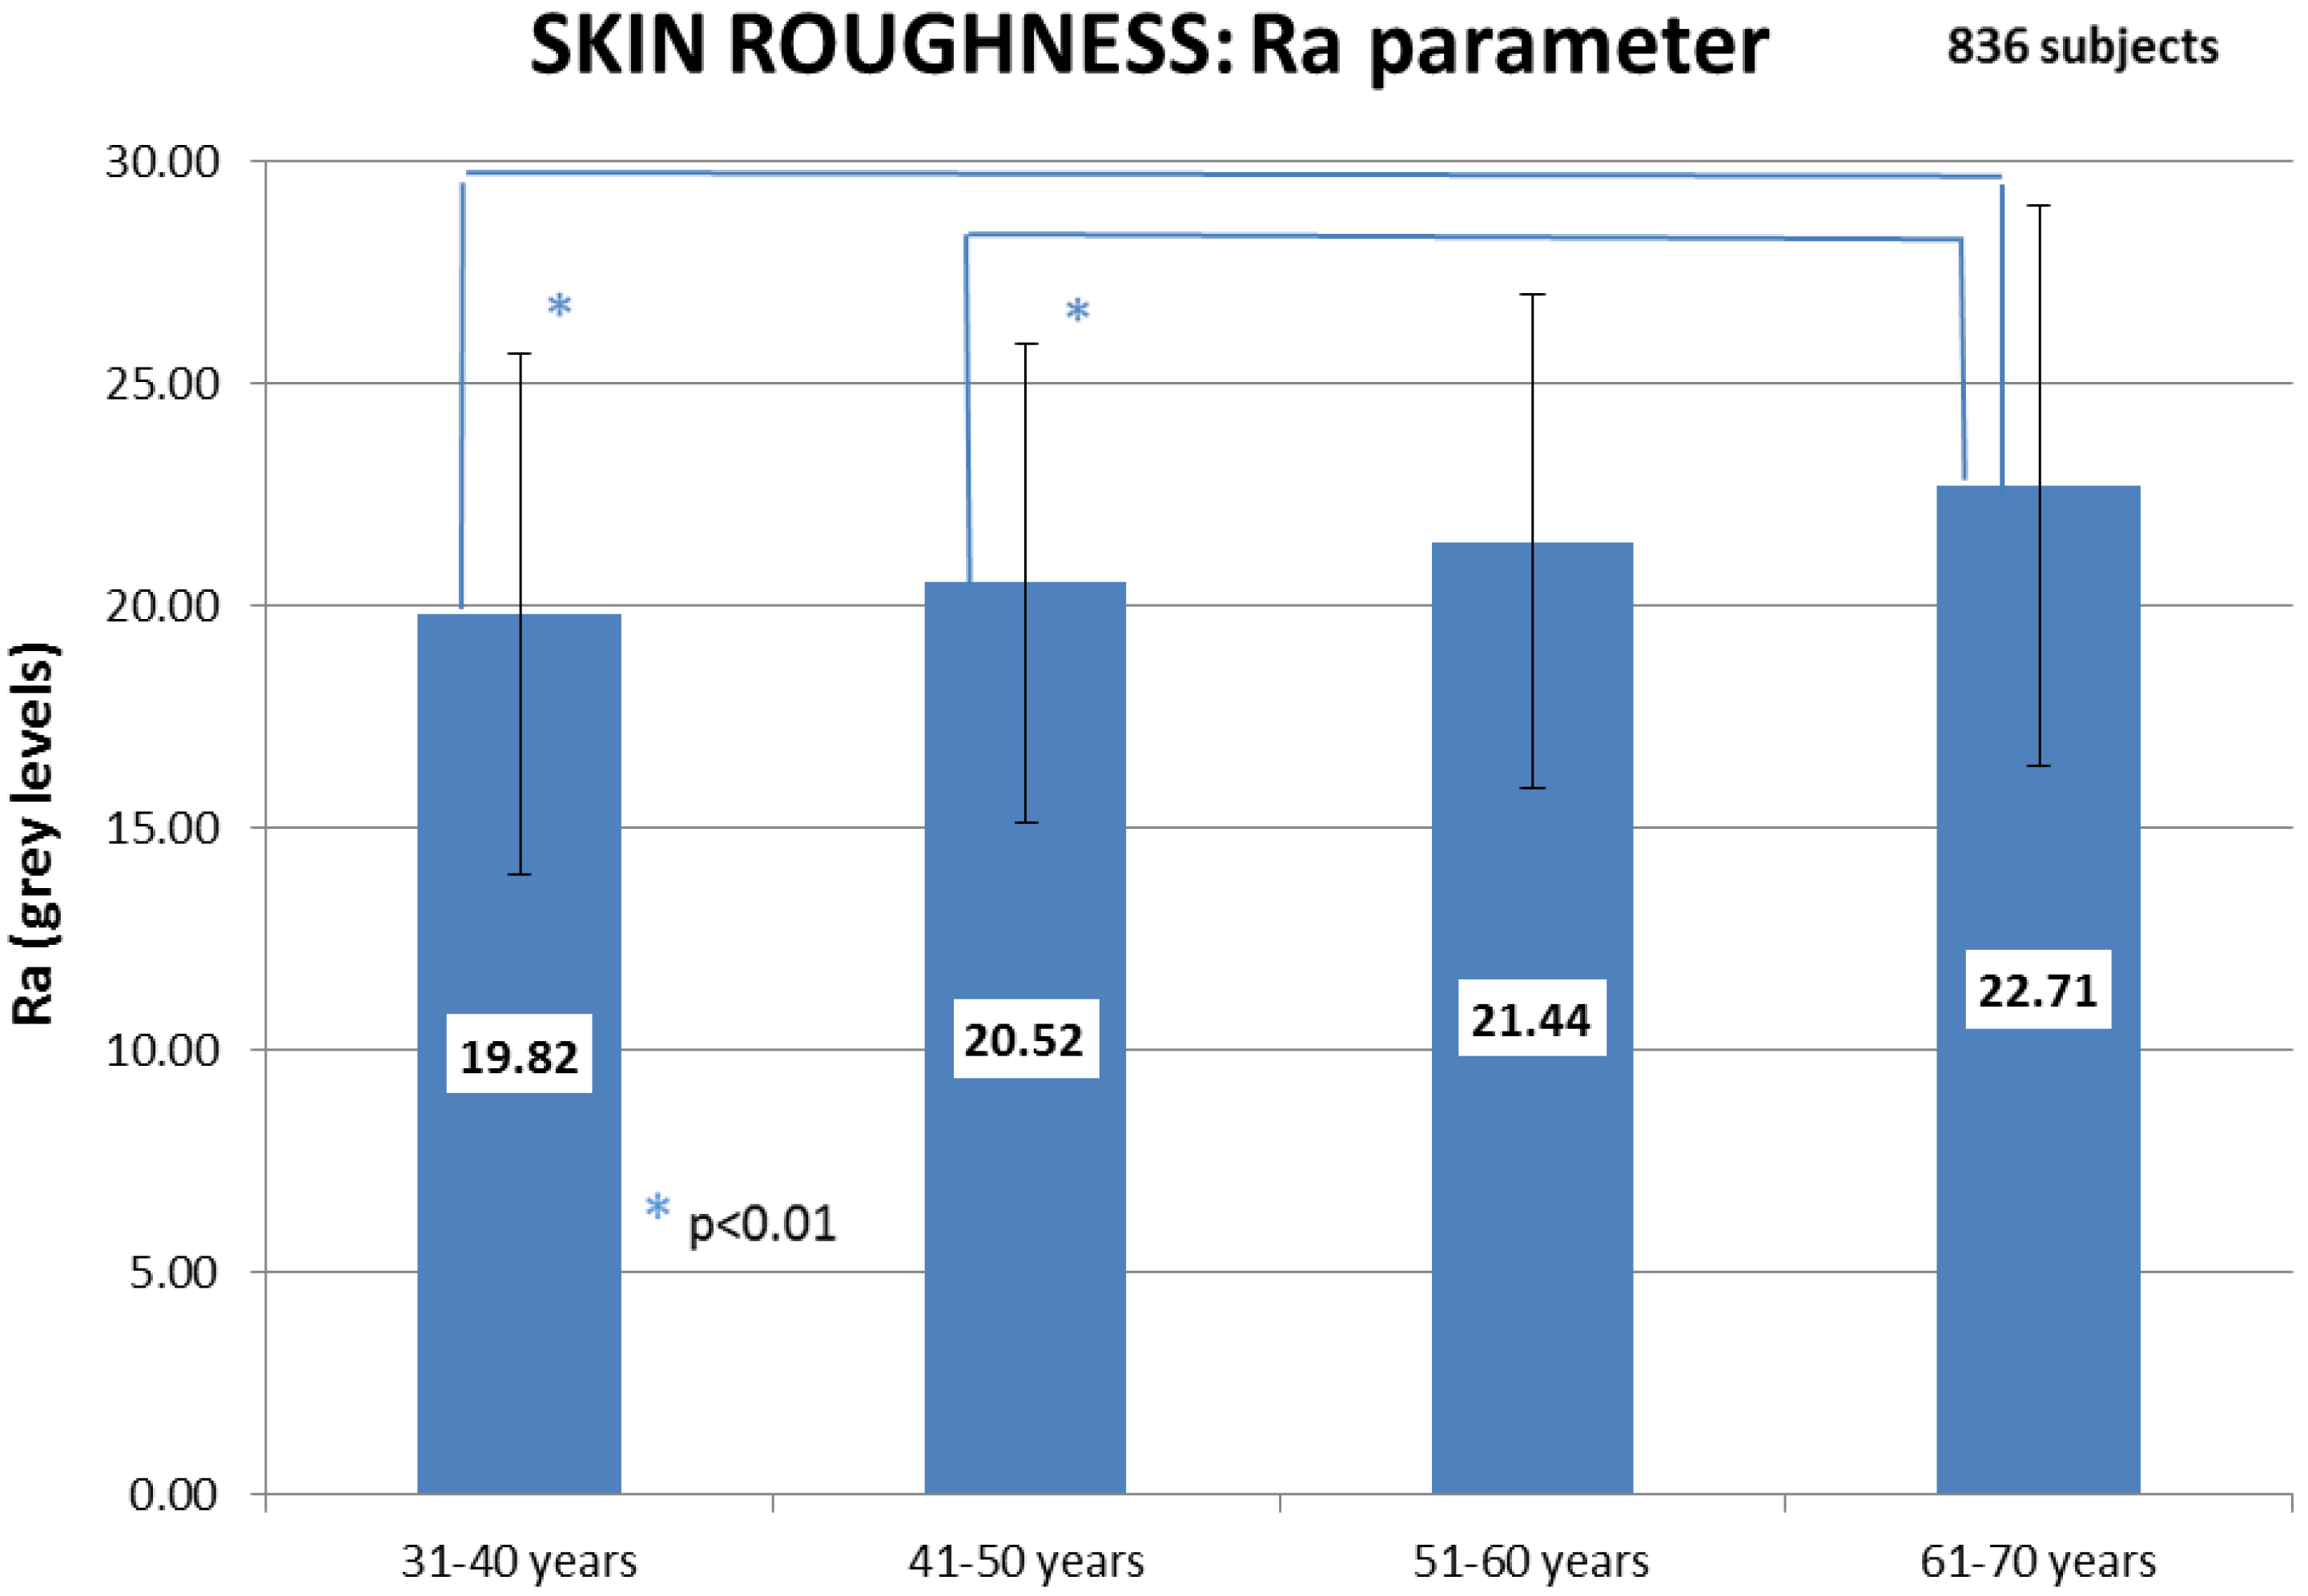
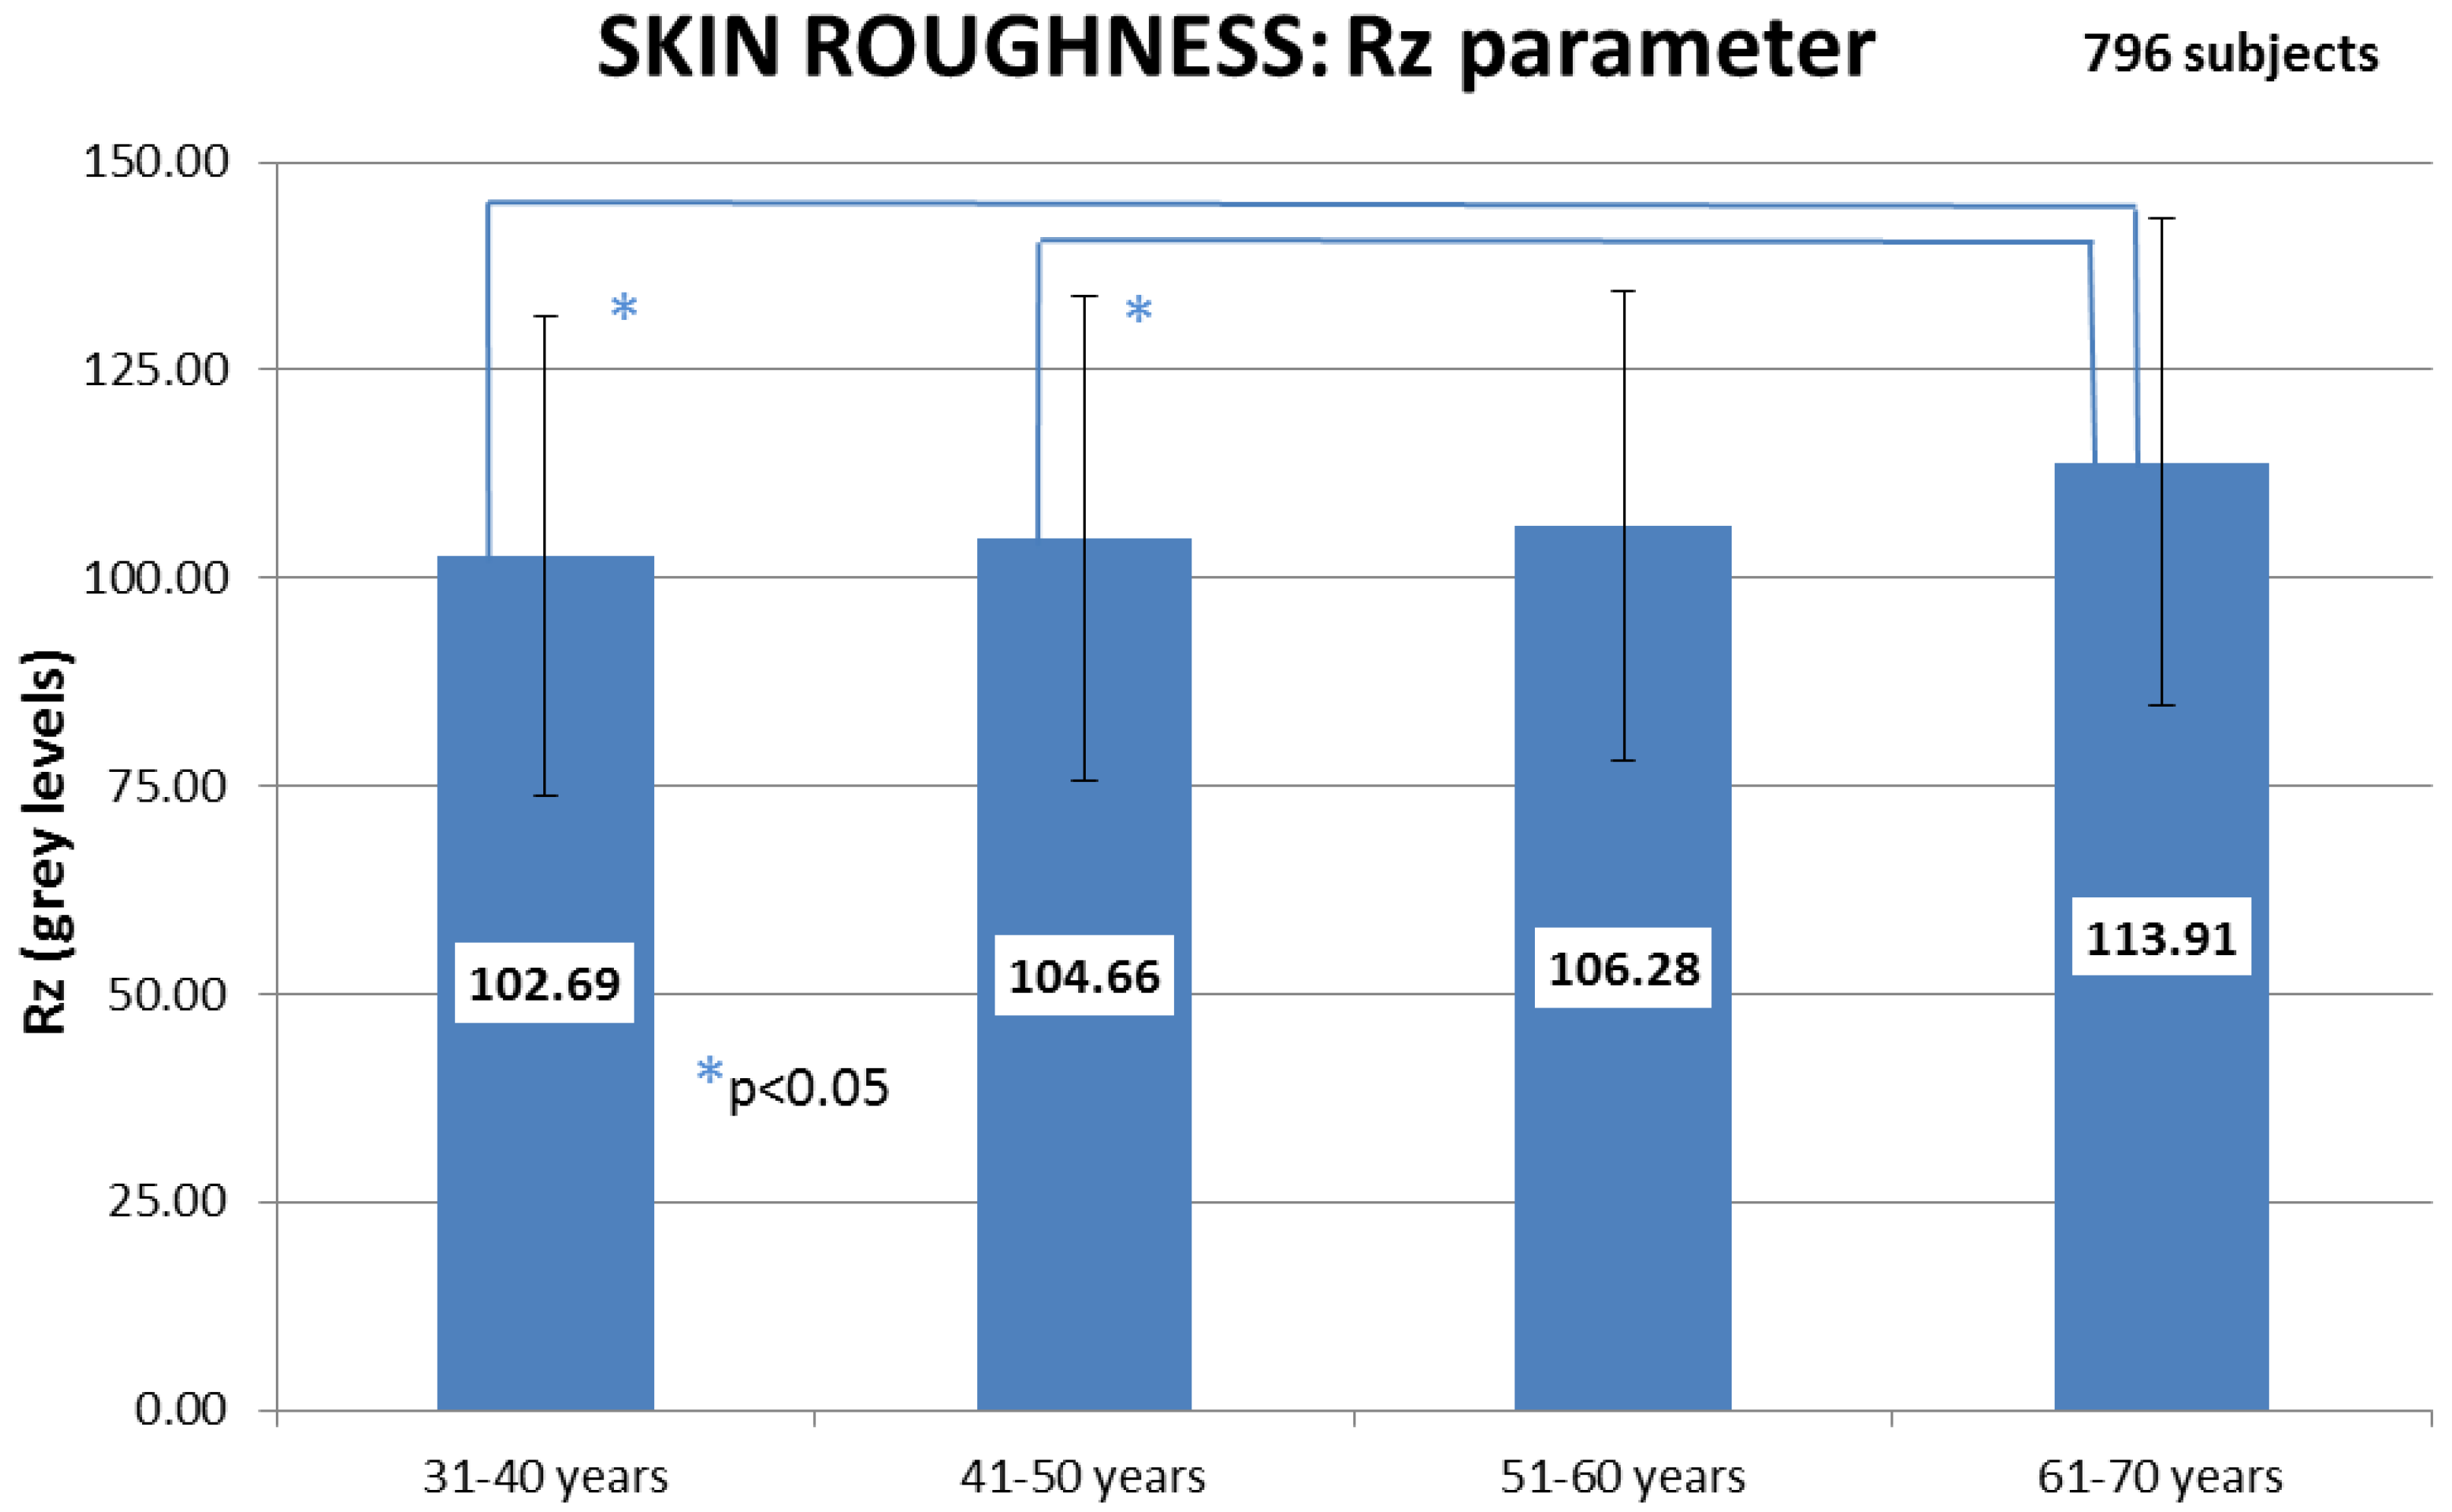
Figure 6). A statistically significant difference between the values of 61–70 years old women and the age groups 31–40 and 41–50 years old was evidenced.
Table 3.
Skin roughness (Ra parameter) mean basal values and standard deviations.
Table 3.
Skin roughness (Ra parameter) mean basal values and standard deviations.
| Age Group | Mean Value | Standard Deviation |
|---|
| 31–40 years | 19.82 | 5.85 |
| 41–50 years | 20.52 | 5.38 |
| 51–60 years | 21.44 | 5.57 |
| 61–70 years | 22.71 | 6.30 |
Table 4.
Skin roughness (Rz parameter) mean basal values and standard deviations.
Table 4.
Skin roughness (Rz parameter) mean basal values and standard deviations.
| Age Group | Mean Value | Standard Deviation |
|---|
| 31–40 years | 102.69 | 28.85 |
| 41–50 years | 104.66 | 29.17 |
| 51–60 years | 106.28 | 28.26 |
| 61–70 years | 113.91 | 29.20 |
Figure 5.
Skin roughness basal values (Ra parameter) as a function of the age group. Statistical comparison among the age groups:
![Cosmetics 01 00117 i001]() p
p < 0.01 (31–40
vs. 61–70 years; 41–50
vs. 61–70 years).
Figure 5.
Skin roughness basal values (Ra parameter) as a function of the age group. Statistical comparison among the age groups:
![Cosmetics 01 00117 i001]() p
p < 0.01 (31–40
vs. 61–70 years; 41–50
vs. 61–70 years).
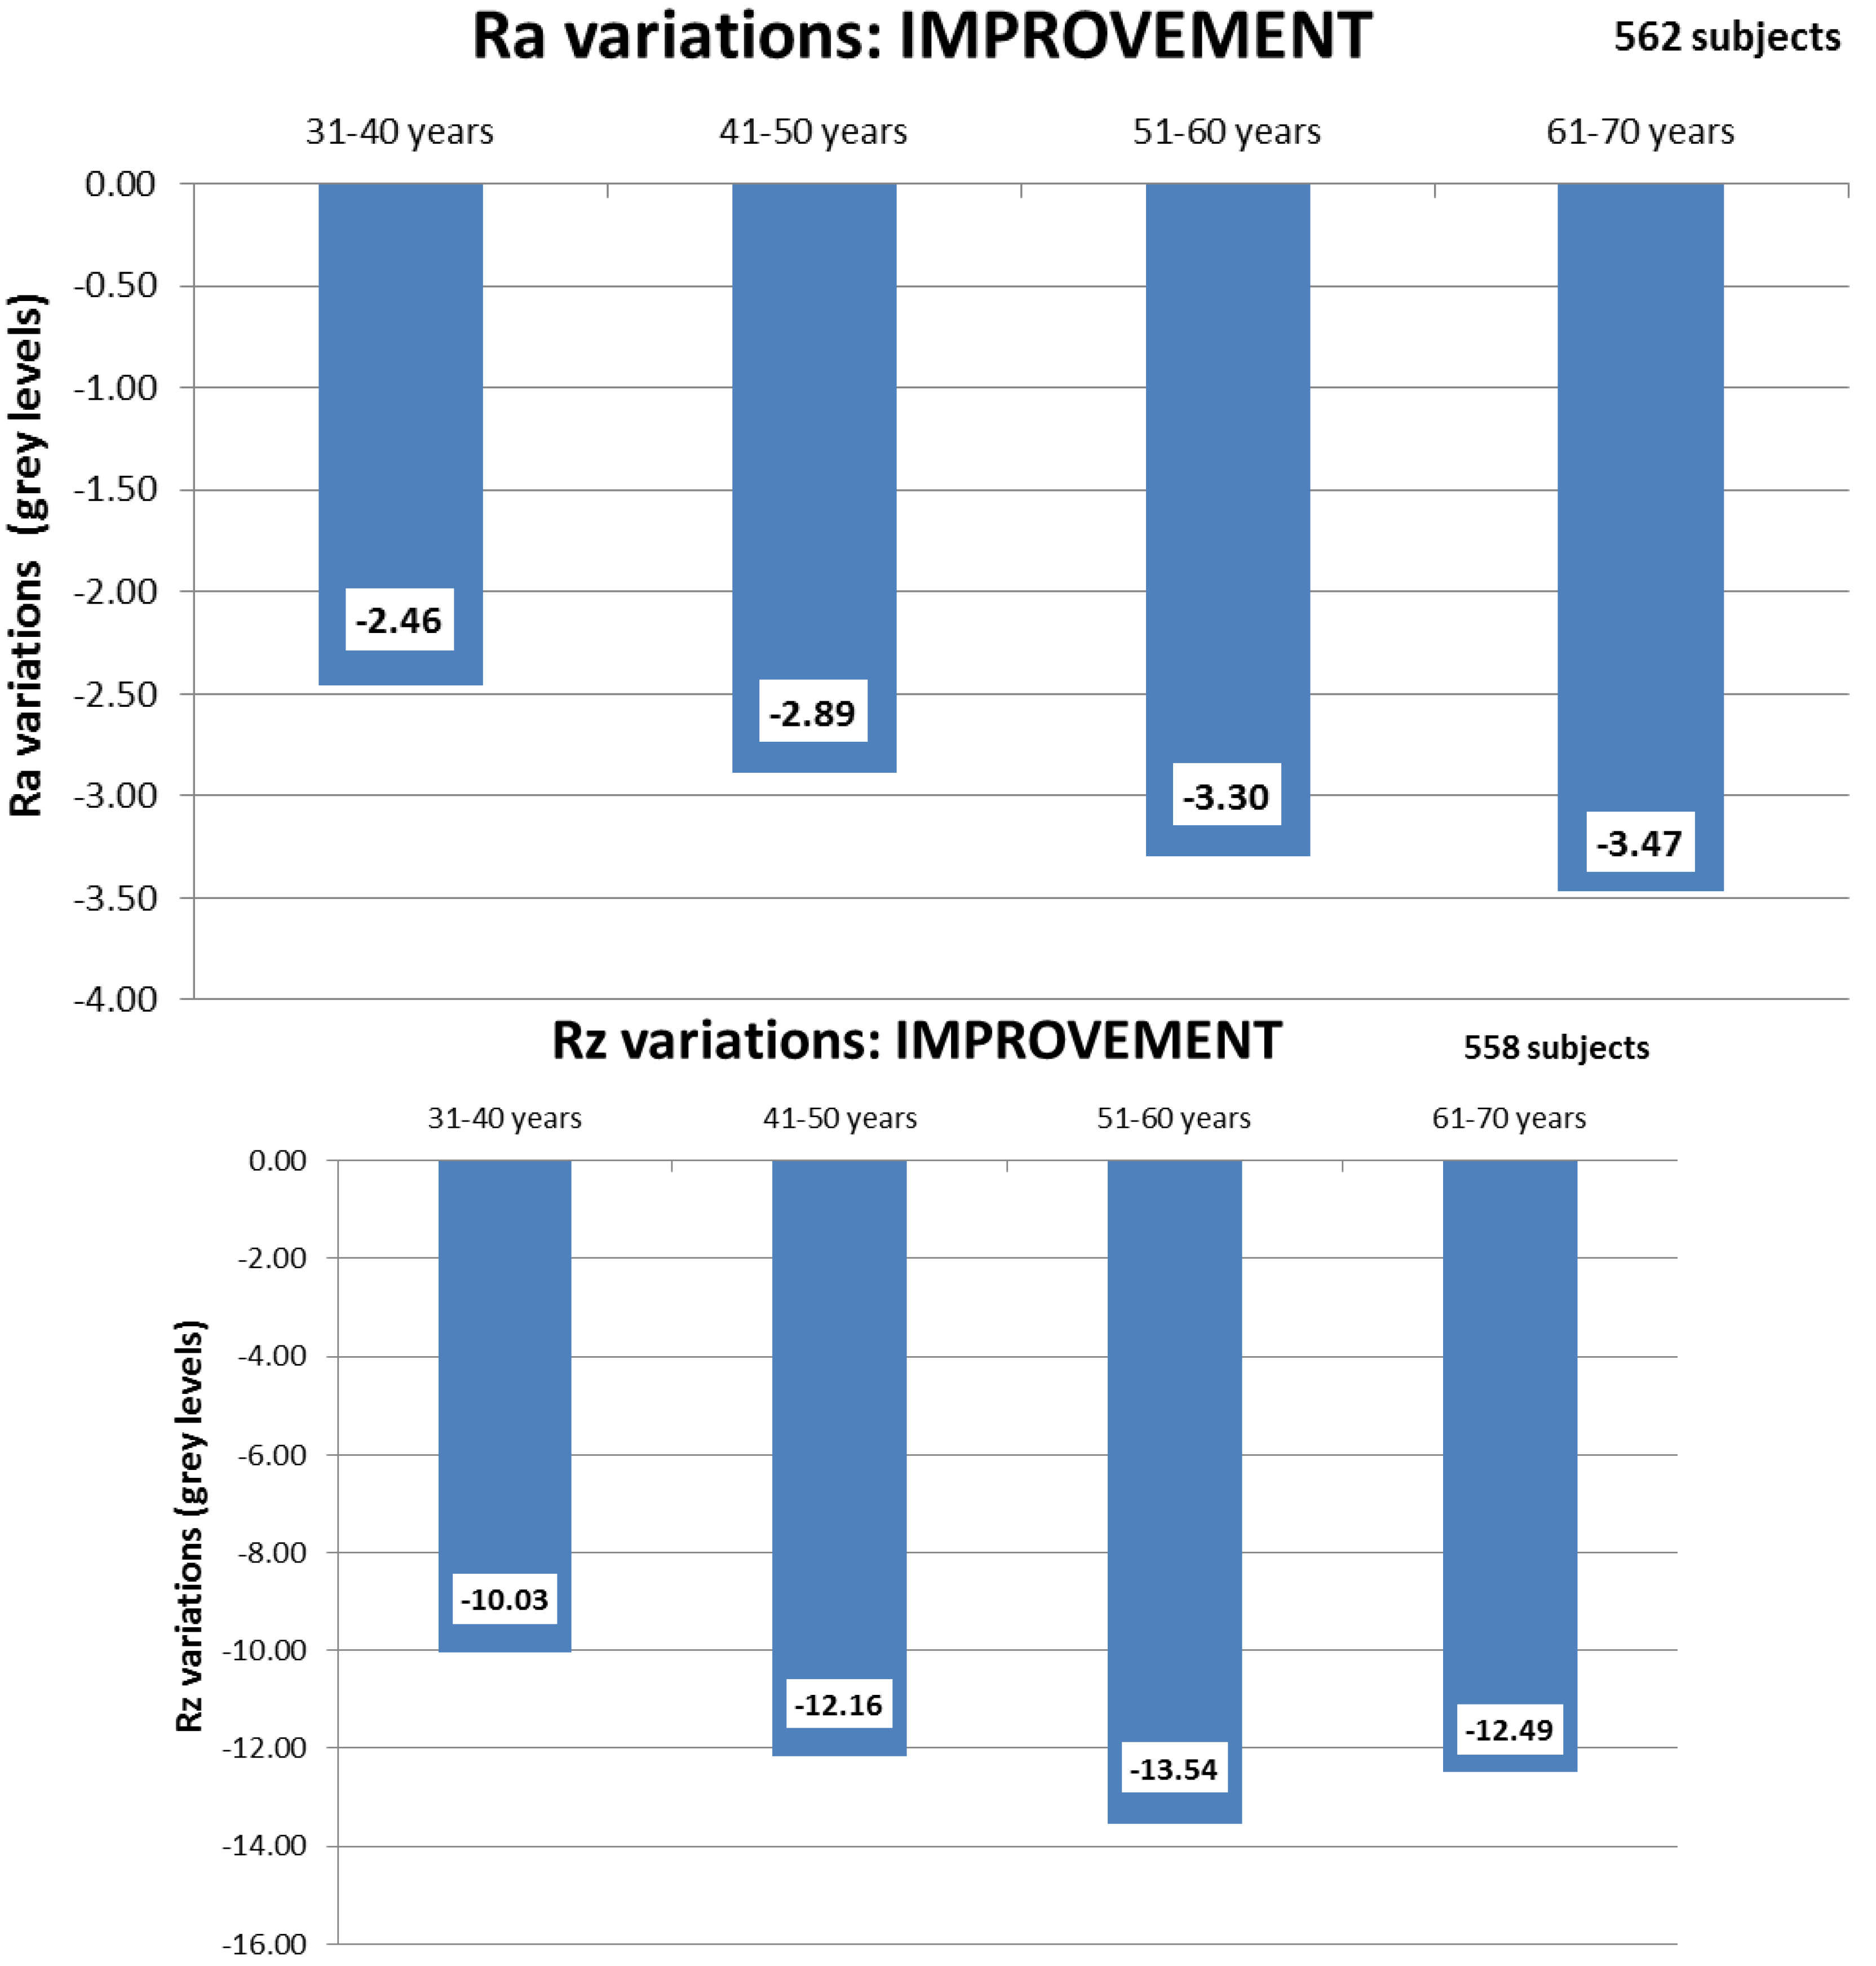
The comparison among the decreases in skin roughness recorded in the four age groups did not show any statistically significant difference (
Figure 7) even if the data indicate that the susceptibility to improvements increases with ageing.
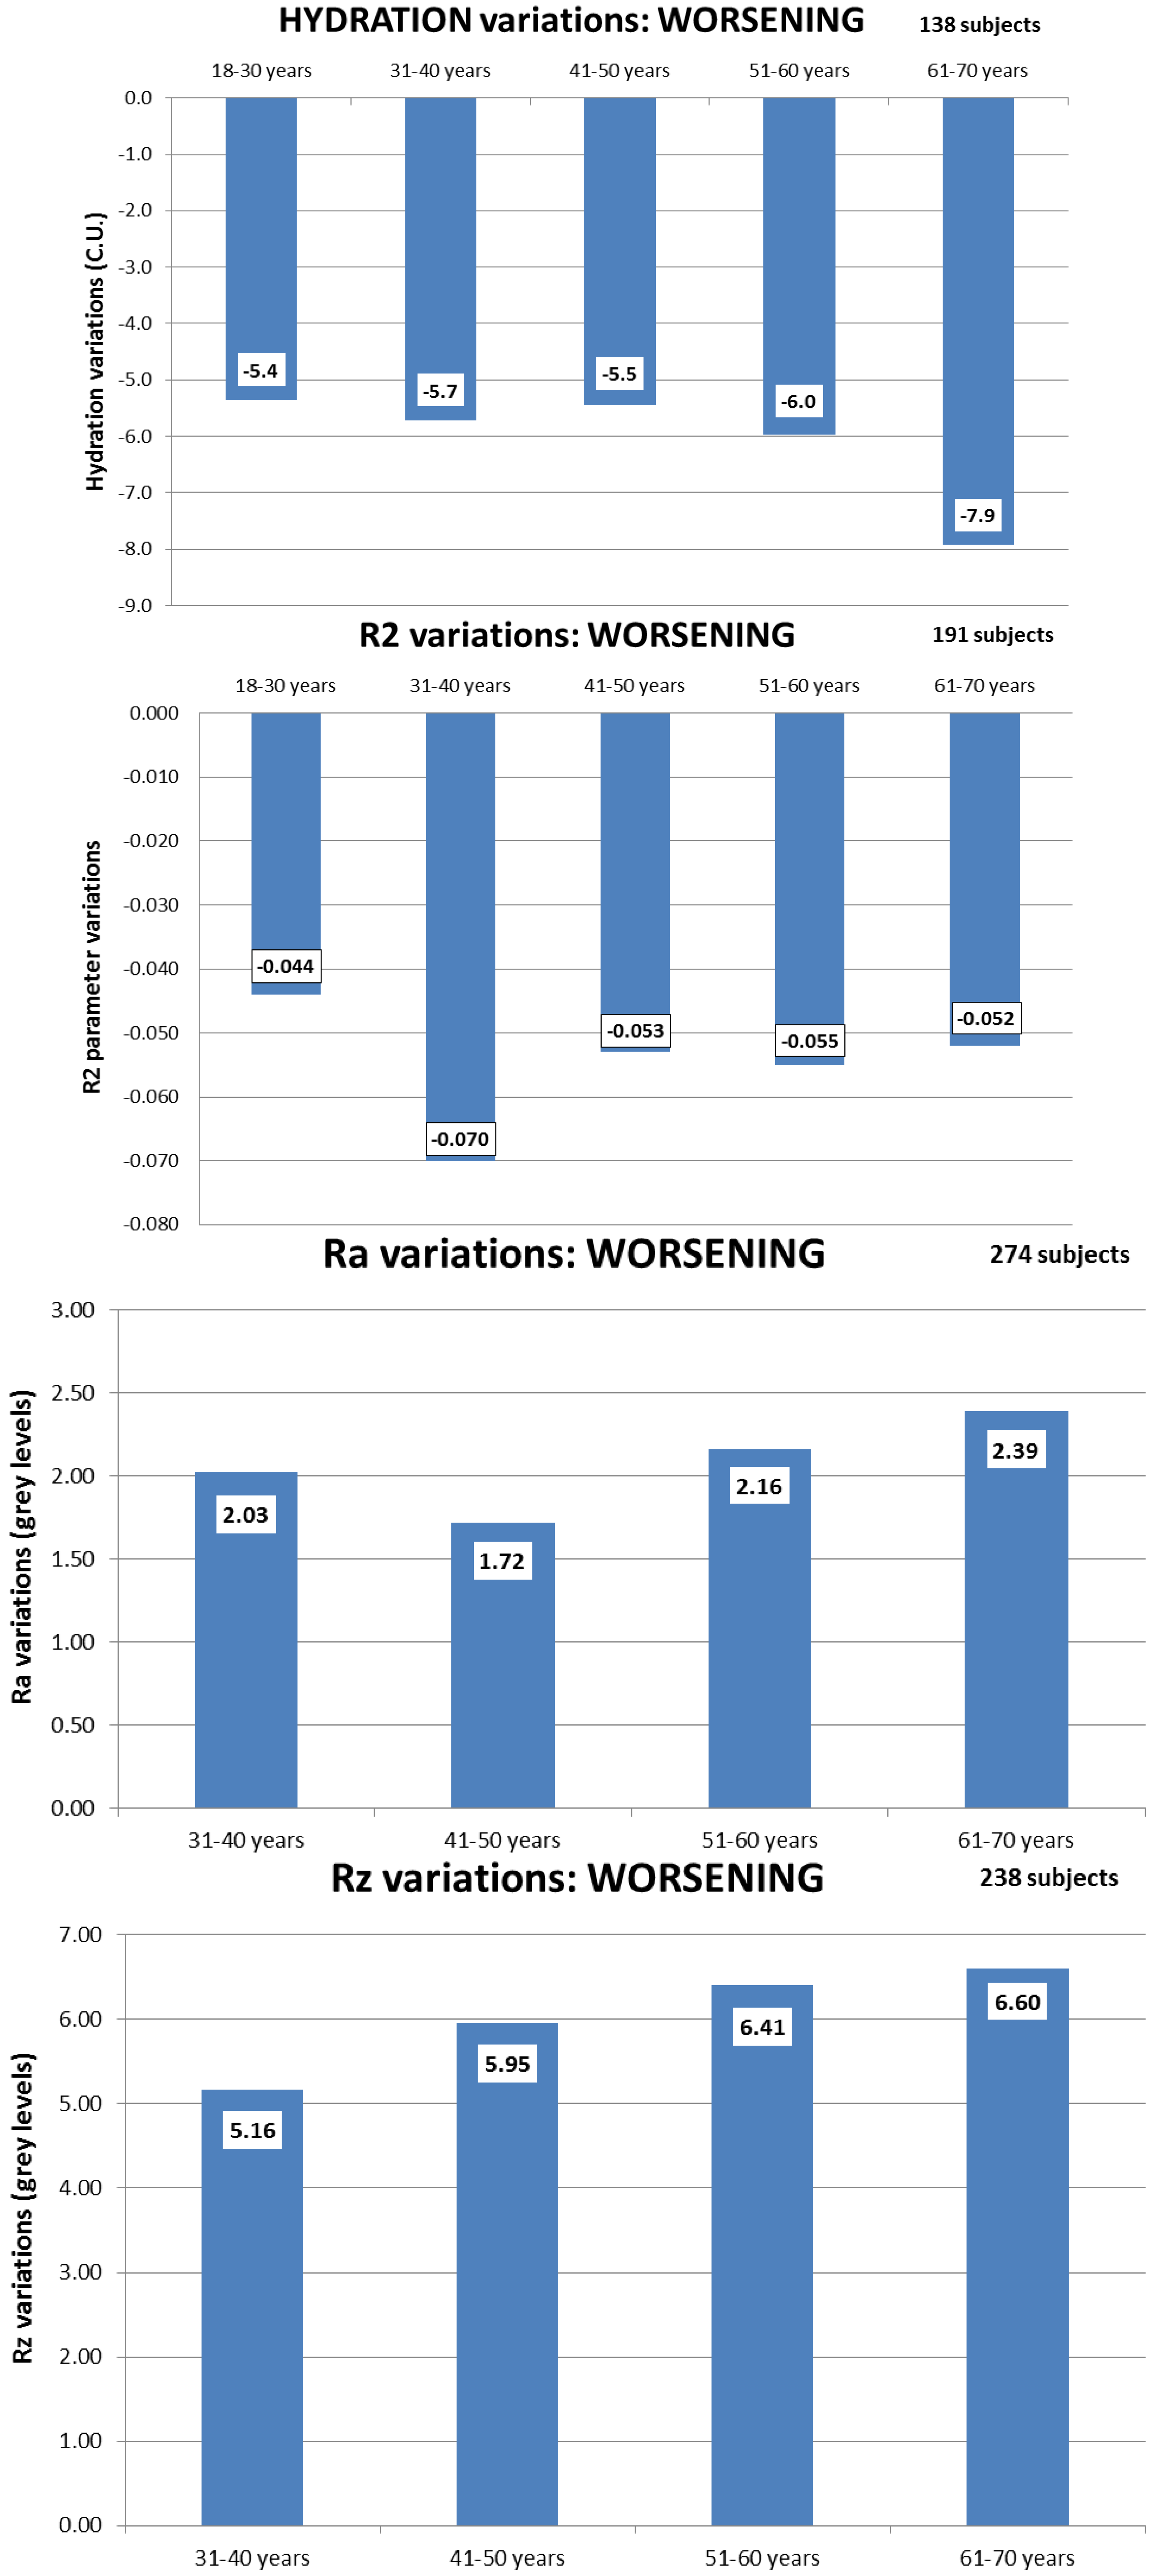
3.4. Skin Hydration, Elasticity and Roughness Variations (Negative Variations: Worsening)
In any efficacy study it is possible to observe one or more subjects showing some worsening of the considered parameters values. We also analyzed this type of variations. However, due to the negligible number of cases considered, we could not draw any statistical conclusions from them. For all the considered parameters, no statistically significant difference was detected among the age groups (
Figure 8), even if significant difference was detected, also in this case, the oldest age group (women between 61 and 70 years old) showed the higher level of worsening concerning the hydration parameter.
We noticed that the age groups which were more susceptible to improvements seemed to correspond to the ones which were also more susceptible to worsening.
Figure 6.
Skin roughness basal values (Rz parameter) as a function of the age group. Statistical comparison among the age groups:
![Cosmetics 01 00117 i001]() p
p < 0.05 (31–40
vs. 61–70 years; 41–50
vs. 61–70 years).
Figure 6.
Skin roughness basal values (Rz parameter) as a function of the age group. Statistical comparison among the age groups:
![Cosmetics 01 00117 i001]() p
p < 0.05 (31–40
vs. 61–70 years; 41–50
vs. 61–70 years).
Figure 7.
Improvements in skin roughness values (Ra and Rz parameters) at the end of a cosmetic treatment as a function of the age group. Statistical comparison among the age groups: p > 0.05 (non-significant).
Figure 7.
Improvements in skin roughness values (Ra and Rz parameters) at the end of a cosmetic treatment as a function of the age group. Statistical comparison among the age groups: p > 0.05 (non-significant).
Figure 8.
Worsening of skin hydration, elasticity and roughness values at the end of cosmetic treatments as a function of the age group. Statistical comparison among the age groups: p > 0.05 (non-significant) for all the considered parameters.
Figure 8.
Worsening of skin hydration, elasticity and roughness values at the end of cosmetic treatments as a function of the age group. Statistical comparison among the age groups: p > 0.05 (non-significant) for all the considered parameters.
4. Conclusions
The analysis of a large amount of basal data and variations obtained at the end of anti-age cosmetic treatments for the face yielded interesting results that might bring to several conclusions. The data were related to the skin parameters of hydration, elasticity and roughness and were collected in a six-year period during efficacy studies performed in our laboratory.
The basal data of skin hydration showed the tendency to a statistically significant increase, proportional to the increase of the subjects’ age. In particular, women between 51 and 70 years old showed basal values of skin hydration remarkably higher than the younger ones. This finding may be in contrast with the data reported in literature. A possible explanation could be attributed to the group of volunteers we considered, i.e., mature women living in a big city and likely to take much care of their skin and to apply daily moisturizing face creams. These subjects might have selected such effective creams on the basis of a long practical experience, which led to an actual increase in their basal skin hydration level. Women between 61 and 70 years old resulted also to be the most susceptible to improvement after cosmetic treatments. This result was evidenced by a statistically significant difference between the positive variations (improvements) obtained in the age group 61–70 years old and the younger age groups. On the basis of these results, it can be concluded that women over 60 years old represent a cluster of volunteers worth being included in a study aimed at testing the moisturizing efficacy of a cosmetic product.
As for elasticity, the basal values of R2 decreased with the volunteers’ age, showing the loss of skin tonicity and the augmentation of skin laxity over ageing. In general, all the age groups showed similar susceptibility to improvements in skin elasticity after cosmetic treatments. However, the highest improvements were found in the 31–50 year old women group.
The basal values of skin roughness (Ra and Rz parameters) increased with the age of the subjects. Indeed, a statistically significant difference between the roughness values of women of the oldest age group (61–70 years old) and the youngest groups (31–50 years old) was evidenced.
The statistical comparison among the positive variations (improvements) recorded in the different age groups did not show any statistically significant difference. However, the improvement values obtained at the end of the cosmetic treatments showed a tendency to increase with the age of the volunteers, both for Ra and Rz parameters. In particular, women over 50 years of age seemed to react better to a cosmetic treatment.
As for the analysis of the negative variations (worsening), we could not draw any statistical conclusions from these cases, due to the small number of cases occurred. We can only confirm the fact that modern cosmetic formulations show a remarkable degree of efficacy (greater number of improvements compared to worsening effects). However, no statistically significant difference was detected among the age groups with regard to all the considered parameters.
Author Contributions
Claudia Cartigliani, Sara Brancato, Adriana Bonfigli and Luigi Rigano wrote the paper; Claudia Cartigliani, Sara Brancato and Adriana Bonfigli performed the clinical studies; Claudia Cartigliani analyzed the data; Luigi Rigano supervised the whole work.
Conflicts of Interest
The authors declare no conflict of interest.
References
- Seidenari, S. Diagnostica non Invasiva in Dermatologia; EDRA Medical Publishing & New Media: Milano, Italy, 1998. [Google Scholar]
- Guidelines for the Evaluation of the Efficacy of Cosmetic Products. Available online: https://www.cosmeticseurope.eu/publications-cosmetics-europe-association/guidelines.html?view=item&id=23 (accessed on 5 May 2008).
- Berardesca, E.; European Group for Efficacy Measurements on Cosmetics and Other Topical Products (EEMCO). EEMCO guidance for the assessment of stratum corneum hydration: Electrical methods. Skin Res. Technol. 1997, 3, 126–132. [Google Scholar] [CrossRef]
- Piérard, G.E. EEMCO guidance to the in vivo assessment of tensile functional properties of the skin. Part 1: Relevance to the structures and aging of the skin and subcutaneous tissues. Skin Pharmacol. Appl. Skin Physiol. 1999, 12, 352–362. [Google Scholar] [CrossRef]
- Rodrigues, L.; European Group for Efficacy Measurements on Cosmetics and Other Topical Products (EEMCO). EEMCO guidance to the in vivo assessment of tensile functional properties of the skin. Part 2: Instrumentation and test modes. Skin Pharmacol. Appl. Skin Physiol. 2001, 14, 52–67. [Google Scholar]
- Lévêque, J.L. EEMCO guidance for the assessment of skin topography. J. Eur. Acad. Dermatol. Venereol. 1999, 12, 103–114. [Google Scholar]
- Corcuff, P.; Lévêque, J.L. Skin surface replica image analysis of furrows and wrinkles. In Handbook of Non-Invasive Methods and the Skin; Serup, J., Jemec, G.B.E., Eds.; CRC Press Inc: Boca Raton, FL, USA, 1995; pp. 89–96. [Google Scholar]
- Farinelli, N.; Berardesca, E. The skin integument: Variation relative to sex, age, race and body region. In Handbook of Non-Invasive Methods and the Skin; Serup, J., Jemec, G.B.E., Eds.; CRC Press Inc: Boca Raton, FL, USA, 1995; pp. 23–26. [Google Scholar]
- Borroni, G.; Berardesca, E.; Bellosta, M.; Bernardi, L.; Rabbiosi, G. Evidence for regional variations in water content of the stratum corneum in senile skin: An electrophysiologic assessment. Ital. Gen. Rev. Derm. 1982, 19, 91–95. [Google Scholar]
- Berardesca, E.; Farinelli, N.; Rabbiosi, G.; Maibach, H.I. Skin Bioengineering in the noninvasive assessment of cutaneous aging. Dermatologica 1991, 182, 1–6. [Google Scholar] [CrossRef]
© 2014 by the authors; licensee MDPI, Basel, Switzerland. This article is an open access article distributed under the terms and conditions of the Creative Commons Attribution license (http://creativecommons.org/licenses/by/3.0/).


 p < 0.0001 (18–30 vs. 51–60 years);
  p < 0.001 (18–30 vs. 61–70 years);
  p < 0.0001 (31–40 vs. 51–60 years; 31–40 vs. 61–70 years); * p < 0.001 (41–50 vs. 51–60 years); ** p < 0.05 (41–50 vs. 61–70 years).


 p < 0.0001 (31–40 vs. 51–60 years; 31–40 vs. 61–70 years); * p < 0.01 (41–50 vs. 61–70 years).


