1. Introduction
Dermatological use of nanoparticles has shown promise for the delivery of drugs and other therapeutic agents for both medical and cosmetic purposes [
1]. There have already been successful commercialization of nanoparticle-based products in the dermatological field, including sunscreen formulations and vitamin A products [
2]. DeLouise, in a review, described various therapeutic and cosmetic applications of nanoparticles, and emphasized the need for developing a method that can determine penetration of nanoparticles through skin layers [
3]. The most potential applications of nanoparticle-based delivery systems in the dermatological field to date have been for treating skin cancer, wound healing, and delivery of antimicrobial agents [
2,
3]. In addition, nanoparticles are applied topically for systemic delivery of drugs; an example is Estrasorb, a commercial formulation that uses topical application of an emulsion for systemic delivery of estradiol [
4]. Titanium dioxide and zinc oxide nanoparticles are most commonly used in sunscreen products to protect the skin from sun’s ultraviolet (UV) radiation, which is considered to be the main cause of skin cancer [
5].
Much more controversial are applications designed to deliver nanoparticles and the drugs incorporated in them past the skin’s outer surface and into deeper tissues [
3,
6]. The skin, of course, is not just a flat surface, but is made up of compact layers of cells and connective tissue. The epidermis is the outer layer, and serves as the physical and chemical barrier between the interior body and exterior environment. The dermis is the deeper layer providing the structural support for the skin, and is divided into stratum papillare, a loose connective tissue and the reticular layer, which is a more dense connective tissue. Finally below that is the hypodermis, which consists of deposits of fat. The skin’s thickness varies with location on the body and the health status of the individual, but the outside layer, the epidermis, is generally around 100 µm or less in thickness [
7]. The dermis, the next layer in, is generally 1–2 mm thick [
5,
8]. It is difficult to generalize about the effectiveness of nanoparticles at penetrating the skin because of wide variations between skin models (in thickness, follicle density, living
vs. non-living tissue), variety in types and sizes of nanoparticles, differing methods of application, and different receptiveness of damaged
vs. intact skin [
2].
Confocal fluorescence microscopy and other spectroscopic techniques are commonly used to detect and study the penetration of nanoparticles through skin [
9]. Microscopy is frequently combined with use of a mechanical sectioning technique called tape stripping, which allows for examination of thin skin layers of progressive depth [
10]. However, stripping generally cannot remove any layers deeper than the stratum corneum, and the removed layers are of uneven thickness [
11]. Additionally, the detection of fluorescent dyes in the skin can be confounded by the presence of substantial background autofluorescence over a wide wavelength range (peaks between ~450 and 625 nm) [
12]. When working with dermatological applications of nanoparticles, therefore, it would be useful to have a method for imaging fluorescence that (1) was free of interfering background signal, (2) operated on a macro (in millimeters) viewing scale, rather than either a micro or
in vivo scale, and (3) also able to quantify the signal intensity. Recent methods reported include techniques, such as Raman spectroscopy, which has been used to quantify the penetration of nanoparticles into skin at micro-scale depths [
13,
14].
In this study, we used a novel, relatively simple, quantifiable imaging method to detect and assess the penetration of nanoparticles into and through the epidermis, and even into the dermis. The nanoparticles incorporated a dye that fluoresces in the near-infrared wavelength range and thus avoids interference from the skin’s natural autofluorescence. We have previously investigated the above dye-loaded nanoparticles to study their biodistribution and tumor localization as a function of surface charge and size. The incorporated dye provides a high intensity, stable signal at a very low (0.1%
w/
w) dye loading in nanoparticles in the near-infrared region [
15], the dye and dye-loaded nanoparticles are nontoxic [
16], and can detect as low as 5 µg of nanoparticles [
15].
2. Materials and Methods
2.1. Materials
Poly(d,l-lactic-co-glycolic acid) (PLGA) with an inherent viscosity of 0.95–1.20 was purchased from Durect Corporation (Cupertino, CA, USA). Near-infrared (NIR) dye (SDB 5491) was purchased from H.W. Sands Corporation (Jupiter, FL, USA). Polyvinyl alcohol (PVA) was purchased from Sigma-Aldrich (St. Louis, MO, USA). Human cadaver skin was obtained from the Anatomy Gifts Registry (Hanover, MD, USA).
2.2. Formulation of Nanoparticles
Nanoparticles were formulated by an emulsion solvent evaporation method [
15]. In brief, polymer solution of 90 mg PLGA and 100 µg of near-infrared dye in 3 mL chloroform was emulsified into 18 mL of 2%
w/
v PVA solution using a stepped microtip probe for a total time of six minutes on a Misonix Sonicator XL (Qsonica, Newtown, CT, USA), and then processed for five minutes at 5000 psi with an Emulsiflex-C5 high-pressure homogenizer (Avestin, Ottawa, ON, USA). The emulsion was stirred overnight in a fume hood with a face velocity of 210 ft/min (6400 cm/min), followed by one hour of stirring in a vacuum desiccator, in order to completely evaporate the chloroform. The nanoparticles were washed by ultracentrifugation, three times for 30 min at 30,000 RPM (82,000 ×
g), in an Optima XE-90 with a 50.2Ti rotor (Beckman Coulter, Brea, CA, USA), and resuspended after each centrifugation with autoclaved Milli-Q water (ASTM Type 1 water, produced by the EMD Millipore Super-Q Plus filtration system; EMD Millipore, Darmstadt, Germany). They were sonicated as above for two minutes after each resuspension. After a final centrifugation at 4000 RPM (2000 ×
g) for 10 min in a Thermo Electron Sorvall legend RT Plus centrifuge (Thermo Scientific, Waltham, MA, USA), the supernatant was frozen and then lyophilized in a Freezone 4.5 (Labconco, Kansas City, MO, USA) for 48 h in a 1% sucrose solution to minimize particle aggregation during lyophilization.
2.3. Characterization of Nanoparticles
Nanoparticle size and zeta potential were determined by dynamic light scattering with the NICOMP 380 ZLS (Particle Sizing Systems, Port Richey, FL, USA). Measurements were made on a nanoparticle suspension of approximately 0.2 mg nanoparticles/mL of water. Nanoparticles were tested for release of the incorporated dye in phosphate-buffered saline (PBS) with 1% bovine serum albumin to maintain sink condition. For this test, 2 mg of nanoparticles suspended in 1 mL of this buffer was dialyzed against 5 mL of the same buffer in a 1 mL Float-A-Lyzer with 0.5 kD cut-off (Spectrum Laboratories, Rancho Dominguez, CA, USA). Buffer was collected and replaced at predetermined time points for four days, and the fluorescence signal from the samples was captured and quantified using a near-infrared filter on the Maestro in vivo fluorescence imaging system (Model: Maestro EX 3.0, PerkinElmer, Waltham, MA, USA), as described in detail below. Release sample readings were compared to those of a standard plot from a series of dilutions (1–200 ng) of dye in the same buffer. Dye stock solution was prepared in ethanol at a concentration of 2.5–50 µg/mL.
2.4. Permeation Studies through the Skin Layers
Lyophilized nanoparticles were mixed into a commercially available oil-in-water skin cream (2–3 mg of particles to approximately 50 mg of cream), and applied gently with a small stainless steel spatula to the entire epidermal surface of each skin specimen. Cream Ingredients: Water/Agua, mineral oil, isopropyl palmitate, petrolatum, glycerin, steric acid, ceresin, glyceryl stearate, cetyl alcohol, sorbitan oleate, candela wax, triethanolamine, laureth-23, fragrance, preservatives, and chelating agents. Control specimens received only the cream. Skin samples were frozen when received, and measured at least 8 × 8 inches in epidermal surface area. Thickness skin samples ranged from five to ten millimeters. Individual specimens, approximately 15 mm long × 5 mm wide, were cut from these large samples with a new #10 disposable scalpel (Fisher Scientific, Waltham, MA, USA). Contiguous pairs of specimens were matched as treated and control specimens for each trial. The skin specimens were thawed to room temperature before cream was applied to their epidermal surface with extra care to ensure that no cream touched the sides of the specimens. The specimens were then placed with epidermal side facing the top in individual wells of a sterile 6-well tissue culture plate (Corning Inc., Corning, NY, USA) and 50 µL of Milli-Q water was pipetted at the bottom of each specimen to prevent drying of the tissue. The water in the plate did not come in contact with the epidermal layer but sufficient enough to keep the tissue hydrated. Plates were covered with a lid, wrapped in foil, and incubated for either 3 h or 24 h, in a Labnet 311DS incubator (Labnet International, Edison, NJ, USA) maintained at a temperature of 32 °C to simulate normal body temperature at the surface of the skin [
17]. After incubation, the cream was removed with consistent motions of a lint-free laboratory tissue (Kimberly-Clark, Irving, TX, USA) on each specimen, and specimens were handled only with sanitized tongs that did not touch the epidermal surface, so that no cream touched the cut sides of the specimen as it was removed. Each pair of specimens was mounted between glass microscope slides in a package that compressed the samples uniformly and held them stably in place for imaging on both sides. Specimens were not moved once placed into position on a slide, to prevent spreading of any cream or nanoparticles from the surface to the sides of the specimens.
To ensure that the signal seen was due to penetration of nanoparticles themselves and not from dye that might have been released from nanoparticles in the cream and diffused through the skin, cream containing nanoparticles was applied over dialysis membrane with a molecular weight cut-off of approximately 14 kDa (Sigma-Aldrich), which was placed on top of skin specimens. Released dye could diffuse through the dialysis membrane but nanoparticles would remain on top of it. These specimens were also mounted between glass slides for imaging as described above.
2.5. Imaging
The Maestro imaging system was used to obtain images of each specimen from both sides to quantify the NIR signal of nanoparticles due to their penetration through the skin layers. The system recorded fluorescence signal using two filter sets, blue to acquire wavelengths from 500 nm to 720 nm (Excitation wavelength = 455 nm) and near-infrared to acquire wavelengths from 740 nm to 950 nm (Excitation wavelength = 704 nm). With the imaging system, it is possible to move the sample stage up and down to adjust the position of the sample with respect to the lens. In our study, the imaging was at stage 2C level. Signals were acquired in 10 nm increments through the specified range, with a 1000 ms exposure time at each wavelength. Specimens exhibited background autofluorescence with an emission peak at 550 nm, and the near-infrared dye displayed an emission peak at 780 nm. The Maestro system separated and quantified those signals for comparison between treated and control specimens, and between different regions of each specimen.
3. Results and Discussion
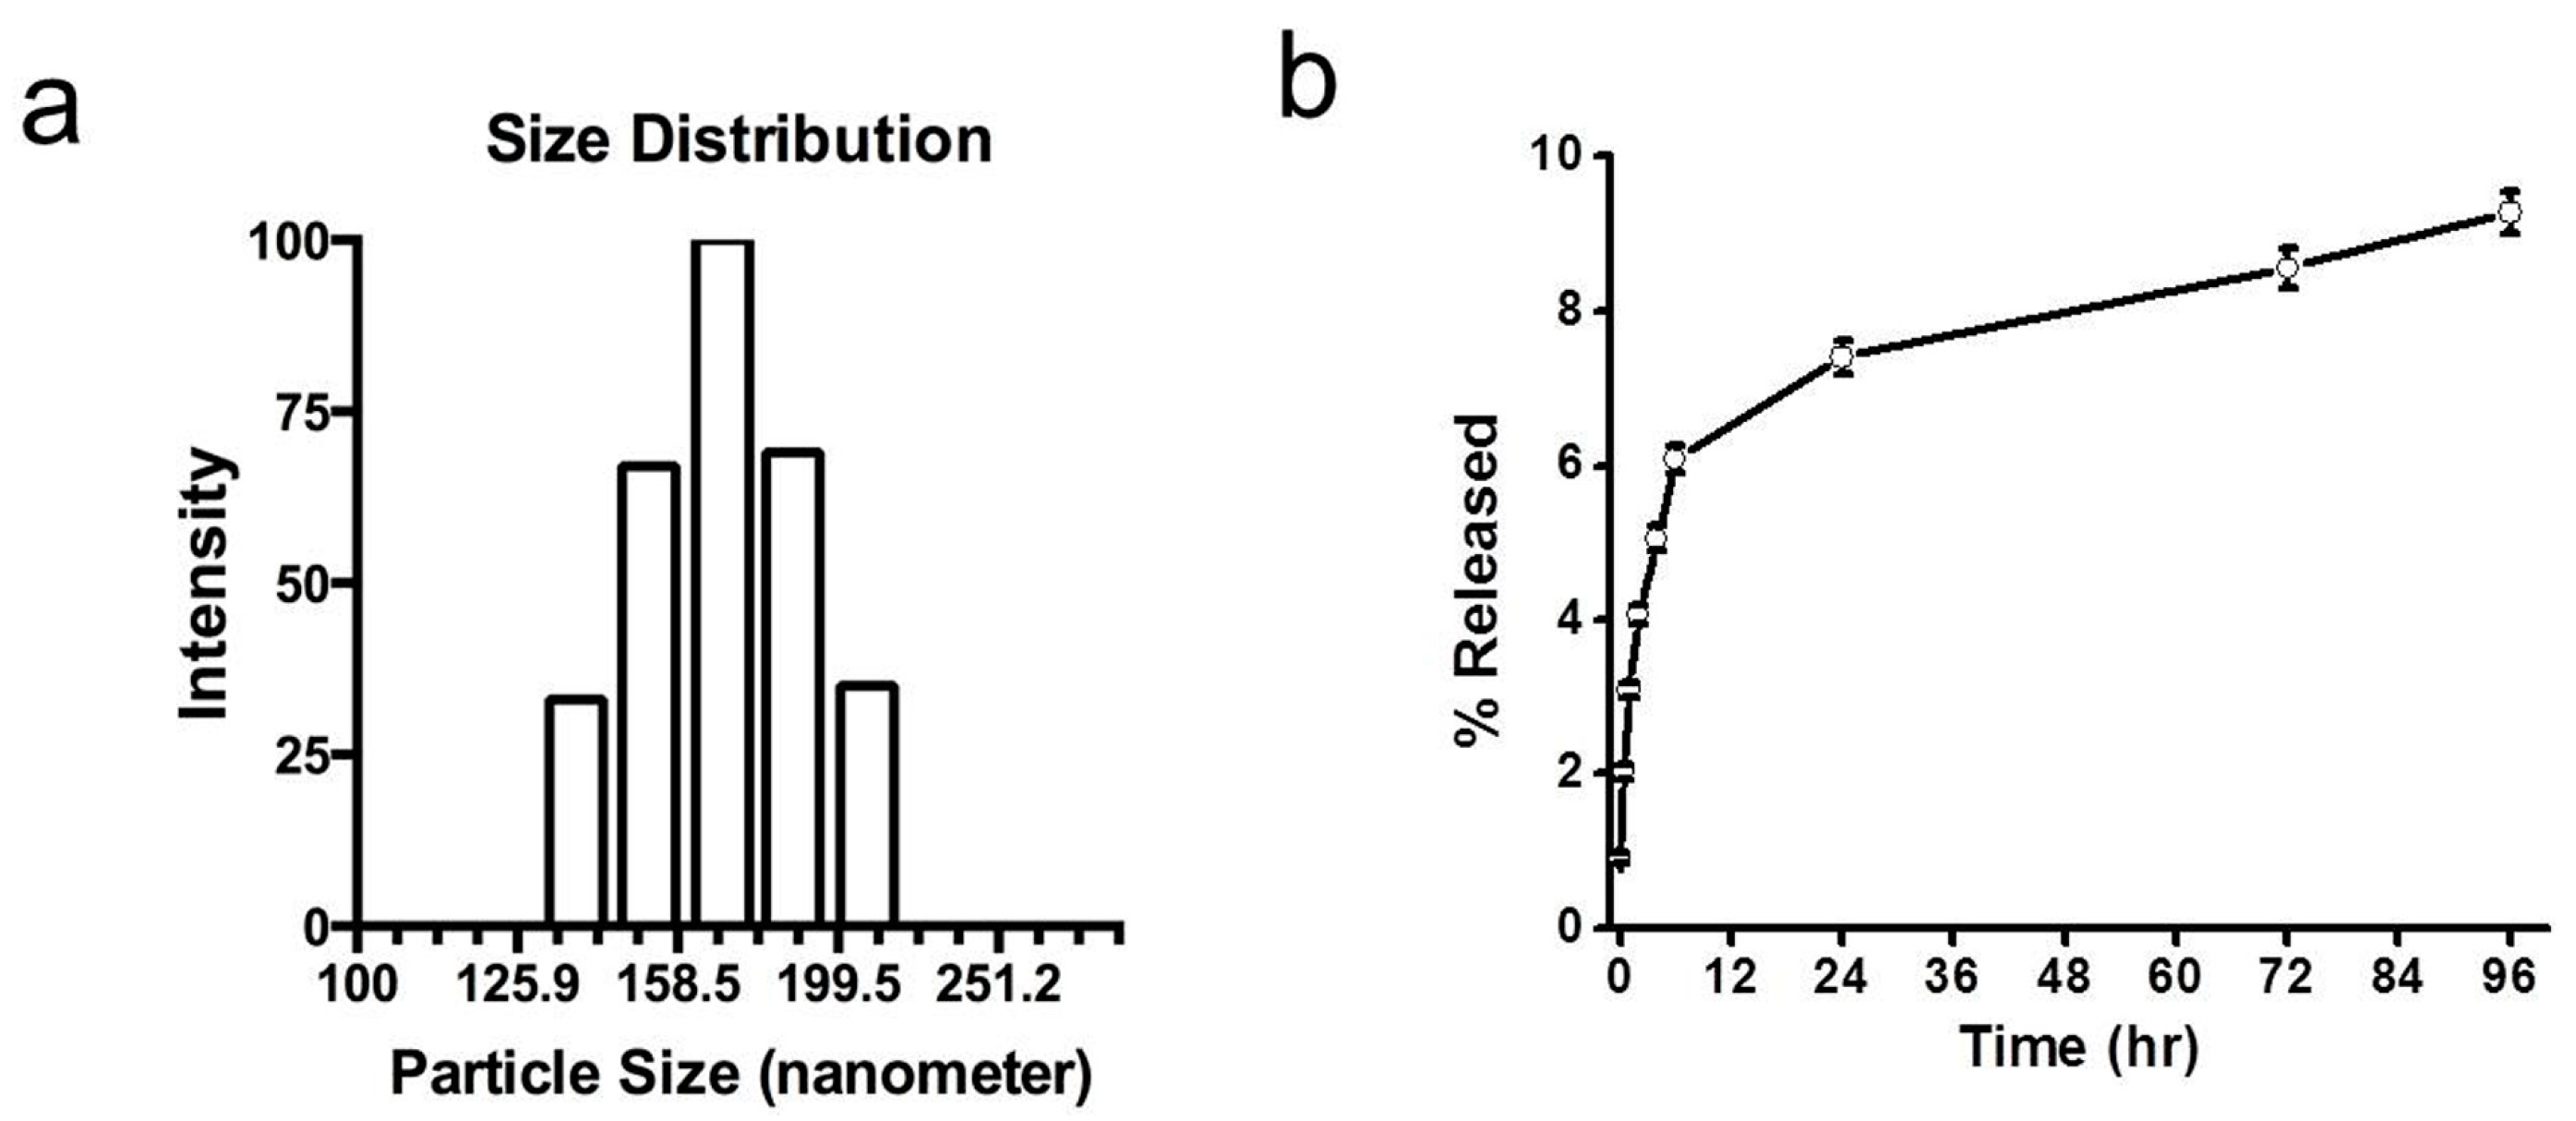
The particles had a mean diameter of approximately 165 nm with a polydispersity index of 0.135 (
Figure 1a). The release of dye in 1% bovine serum albumin (BSA) solution in PBS was less than 10% in 96 h, with about 2% release occurring in 3 h and 7% in 24 h (
Figure 1b). In the testing of dye release in commercial oil-in-water skin cream, treated specimens where dialysis membrane was placed between the skin and sample, showed no greater near-infrared fluorescence than did control specimens, indicating that there was no release of dye into the cream and, hence, the signal seen through the skin layers is due to nanoparticles and not that of the released dye. In our previous studies, another fluorescence dye, 6-coumarin, which was encapsulated into PLGA nanoparticles as a marker for cellular uptake of nanoparticles, was characterized for the dye release by incubating a suspension of the dye-loaded nanoparticles in the presence of olive oil at 37 °C. The dye release from nanoparticles under these conditions was only 0.6% in 48 h [
18]. The release of hydrophobic compounds such as the dyes used in our study depends on their loading. Since the dye loading is significantly lower (0.05% for 6-coumarin and 0.1% for NIR dye) than the threshold loading (~10% to 30%
w/
w, depending upon the polymer composition and characteristics of the drug molecules) required for rapid release [
19], the incorporated dyes could act as a marker for nanoparticles. We validated the uptake of 6-coumarin dye-loaded nanoparticles by transmission electronic microscopy of cells [
20]. Since our publication, 6-coumarin dye has been extensively used as a marker for PLGA-based nanoparticles to study their cellular uptake and intracellular trafficking [
21]. Nonetheless, further confirmation of nanoparticle penetration in the skin layers by some other methods, such as electronic microscopy to show the presence of actual nanoparticles, could validate the data seen with optical imaging techniques like the one used in this study.
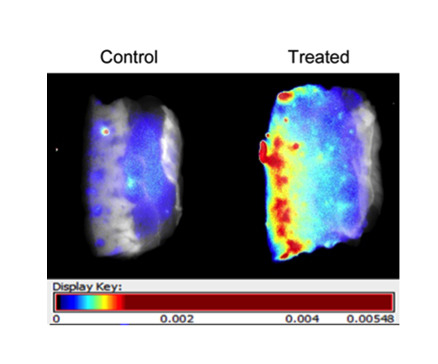
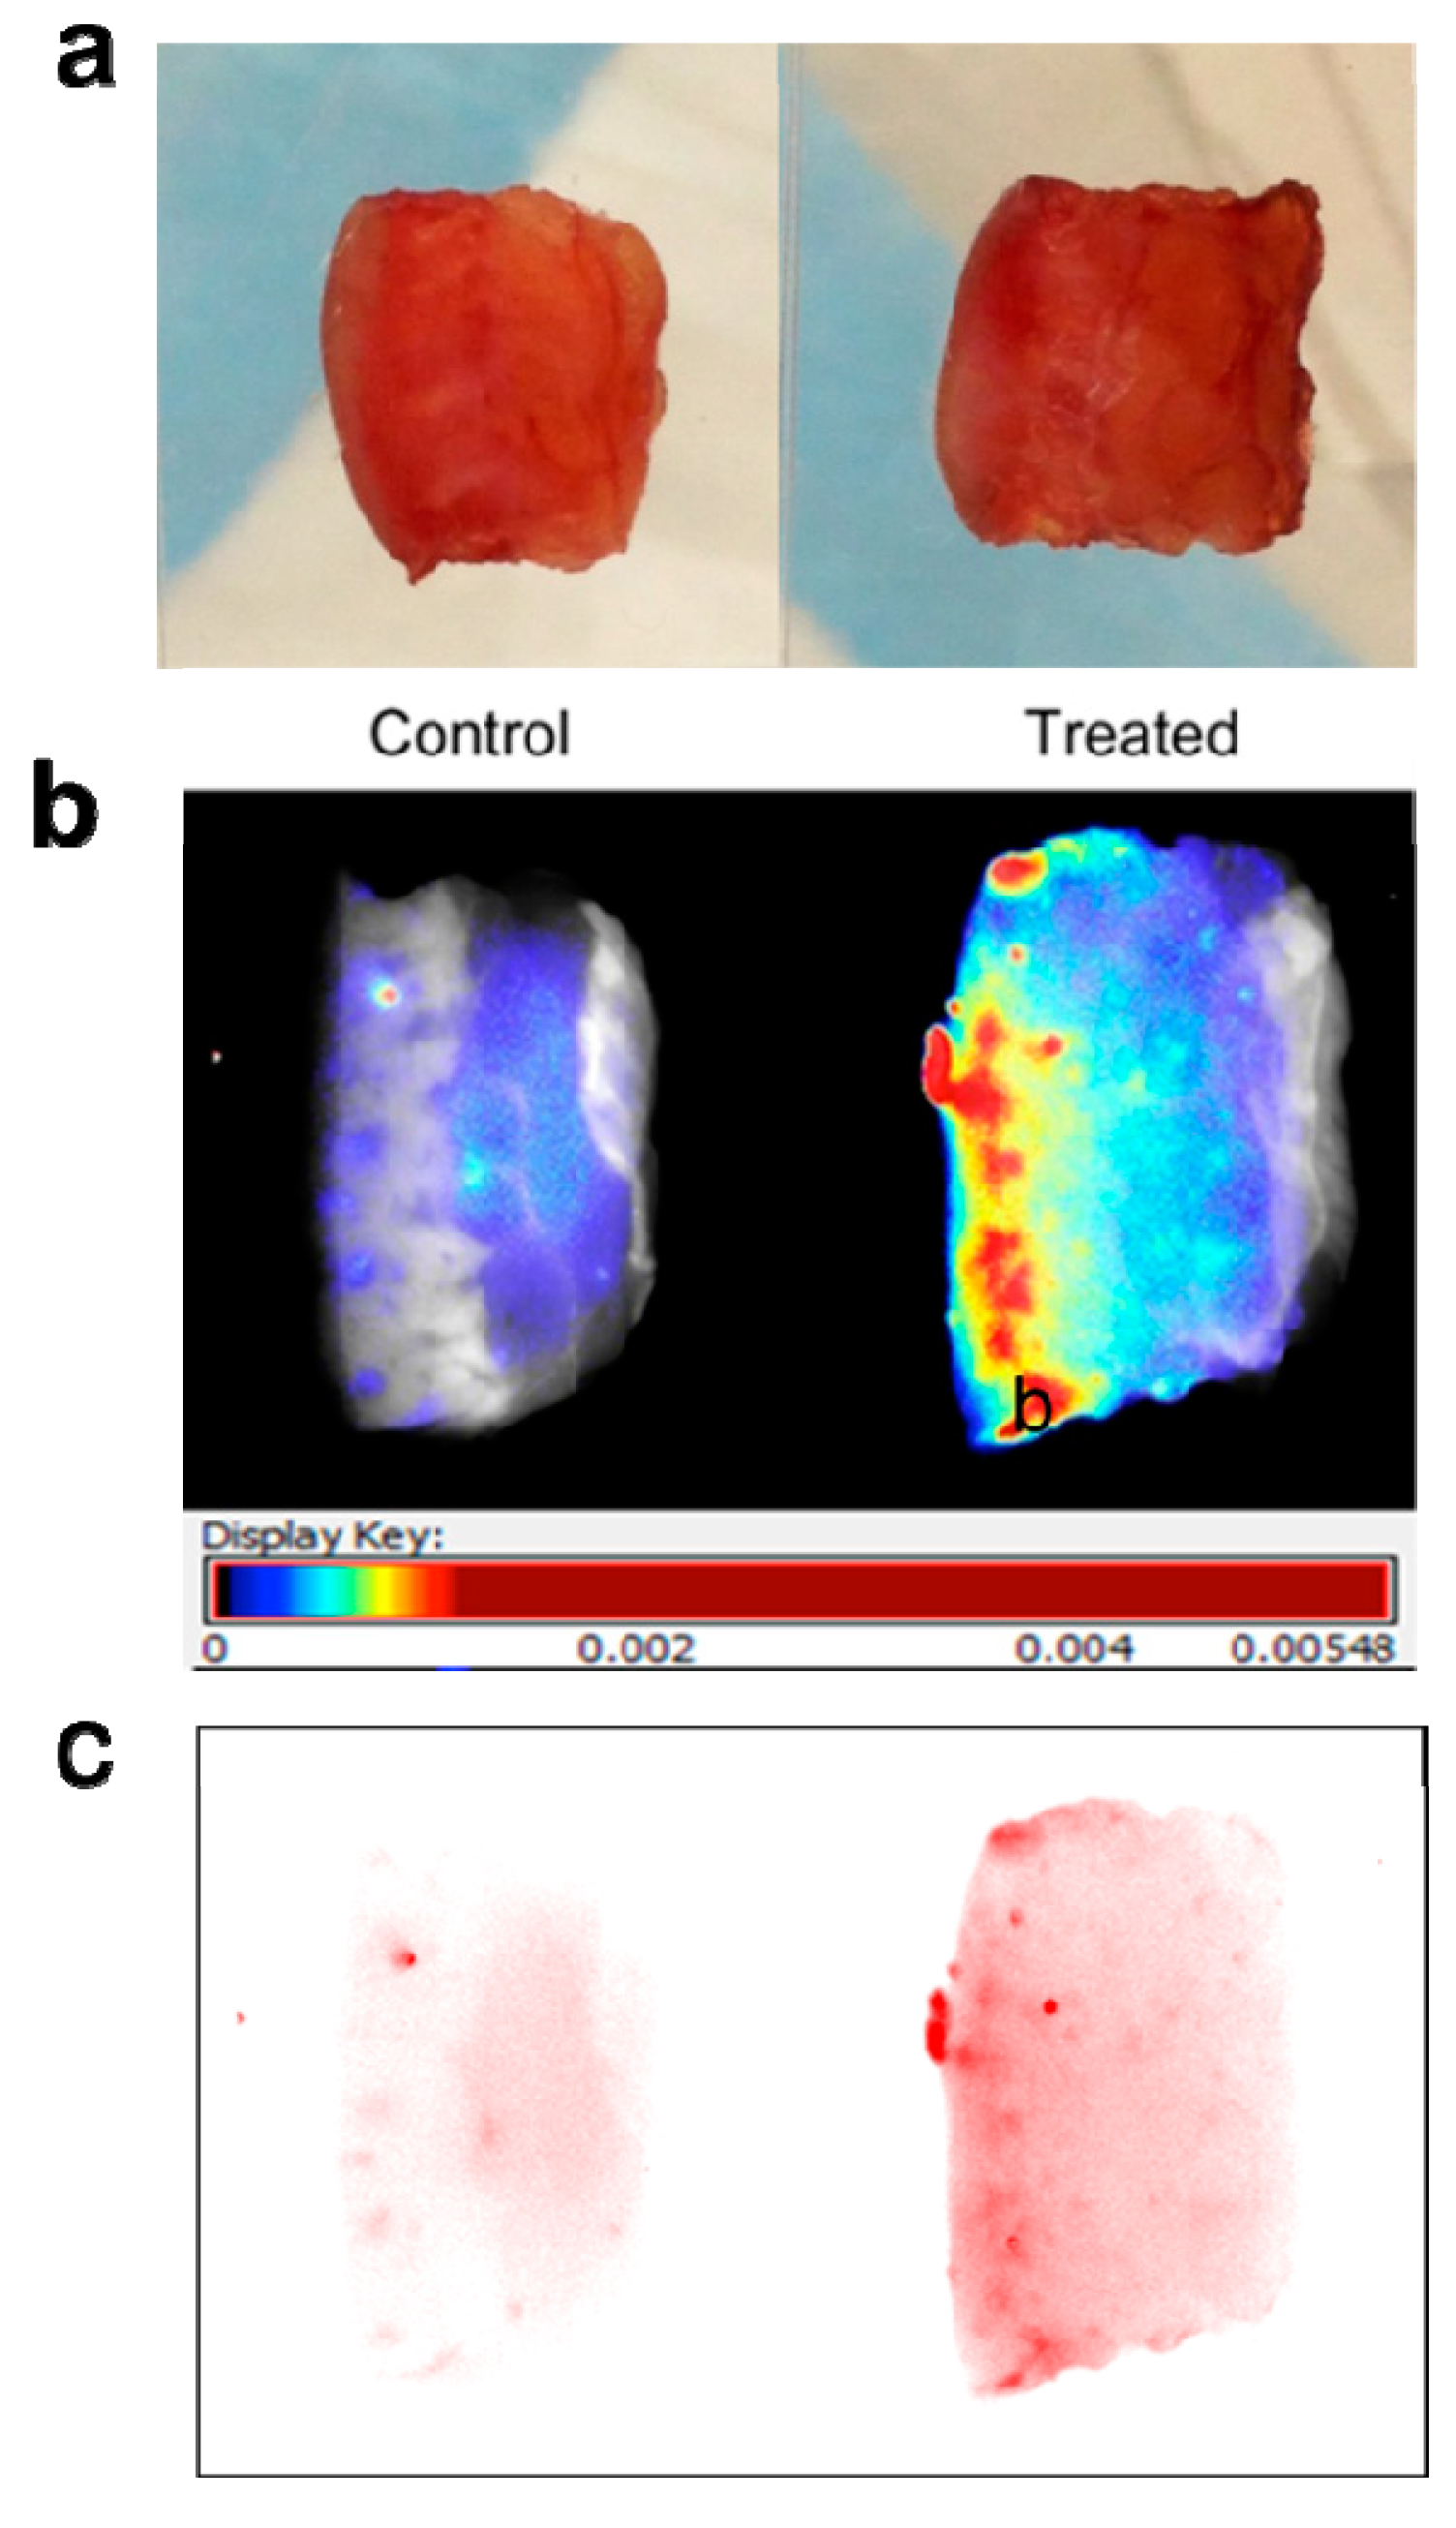
Maestro images were taken of specimen pairs mounted between glass slides (
Figure 2a). Fluorescence signal was visualized in two ways: first, translated to heat maps (
Figure 2b), with warm colors representing high fluorescence signal and cool colors representing low fluorescence signal), and second, with near-infrared signal shown as a single color (red) of varying intensity (
Figure 2c). Both demonstrate clear diffusion of near-infrared signal through the treated specimen.
Figure 1.
Characterization of near-infrared dye-loaded nanoparticles. (a) Gaussian distribution of nanoparticles. Nanoparticles had a mean hydrodynamic diameter of 165 nm with a polydispersity index of 0.135. (b) Dye release from nanoparticles in buffer under in vitro conditions. Nanoparticles in release buffer released less than 10% of their total incorporated dye in 96 h. Data show mean ± standard error, with n = 3.
Figure 2.
Mounting and imaging of skin specimens. Each pair has the Control specimen on the left (treated with cream only) and the Treated specimen on the right (treated by application of dye-containing nanoparticles in cream). The epidermal surface is on the left for all specimens. Note that (b) and (c) depict the same pair of specimens, while (a) depicts a different pair. (a) Skin specimens mounted between glass slides for imaging. Each pair of specimens, after treatment with nanoparticles mixed into skin cream, was mounted between glass microscope slides in a package that compressed the samples uniformly and held them stably in place for imaging on both sides. (b) Skin specimens with fluorescence signal translated to heat maps. Warm colors (high fluorescence signal) and cool colors (low fluorescence signal) demonstrate clear diffusion of near-infrared signal through the treated specimen. (c) Skin specimens with near-infrared signal intensity shown in one color. The Control specimen has very little signal; the treated specimen shows reducing intensity moving from epidermal surface to dermis.
![Cosmetics 02 00225 g002]()
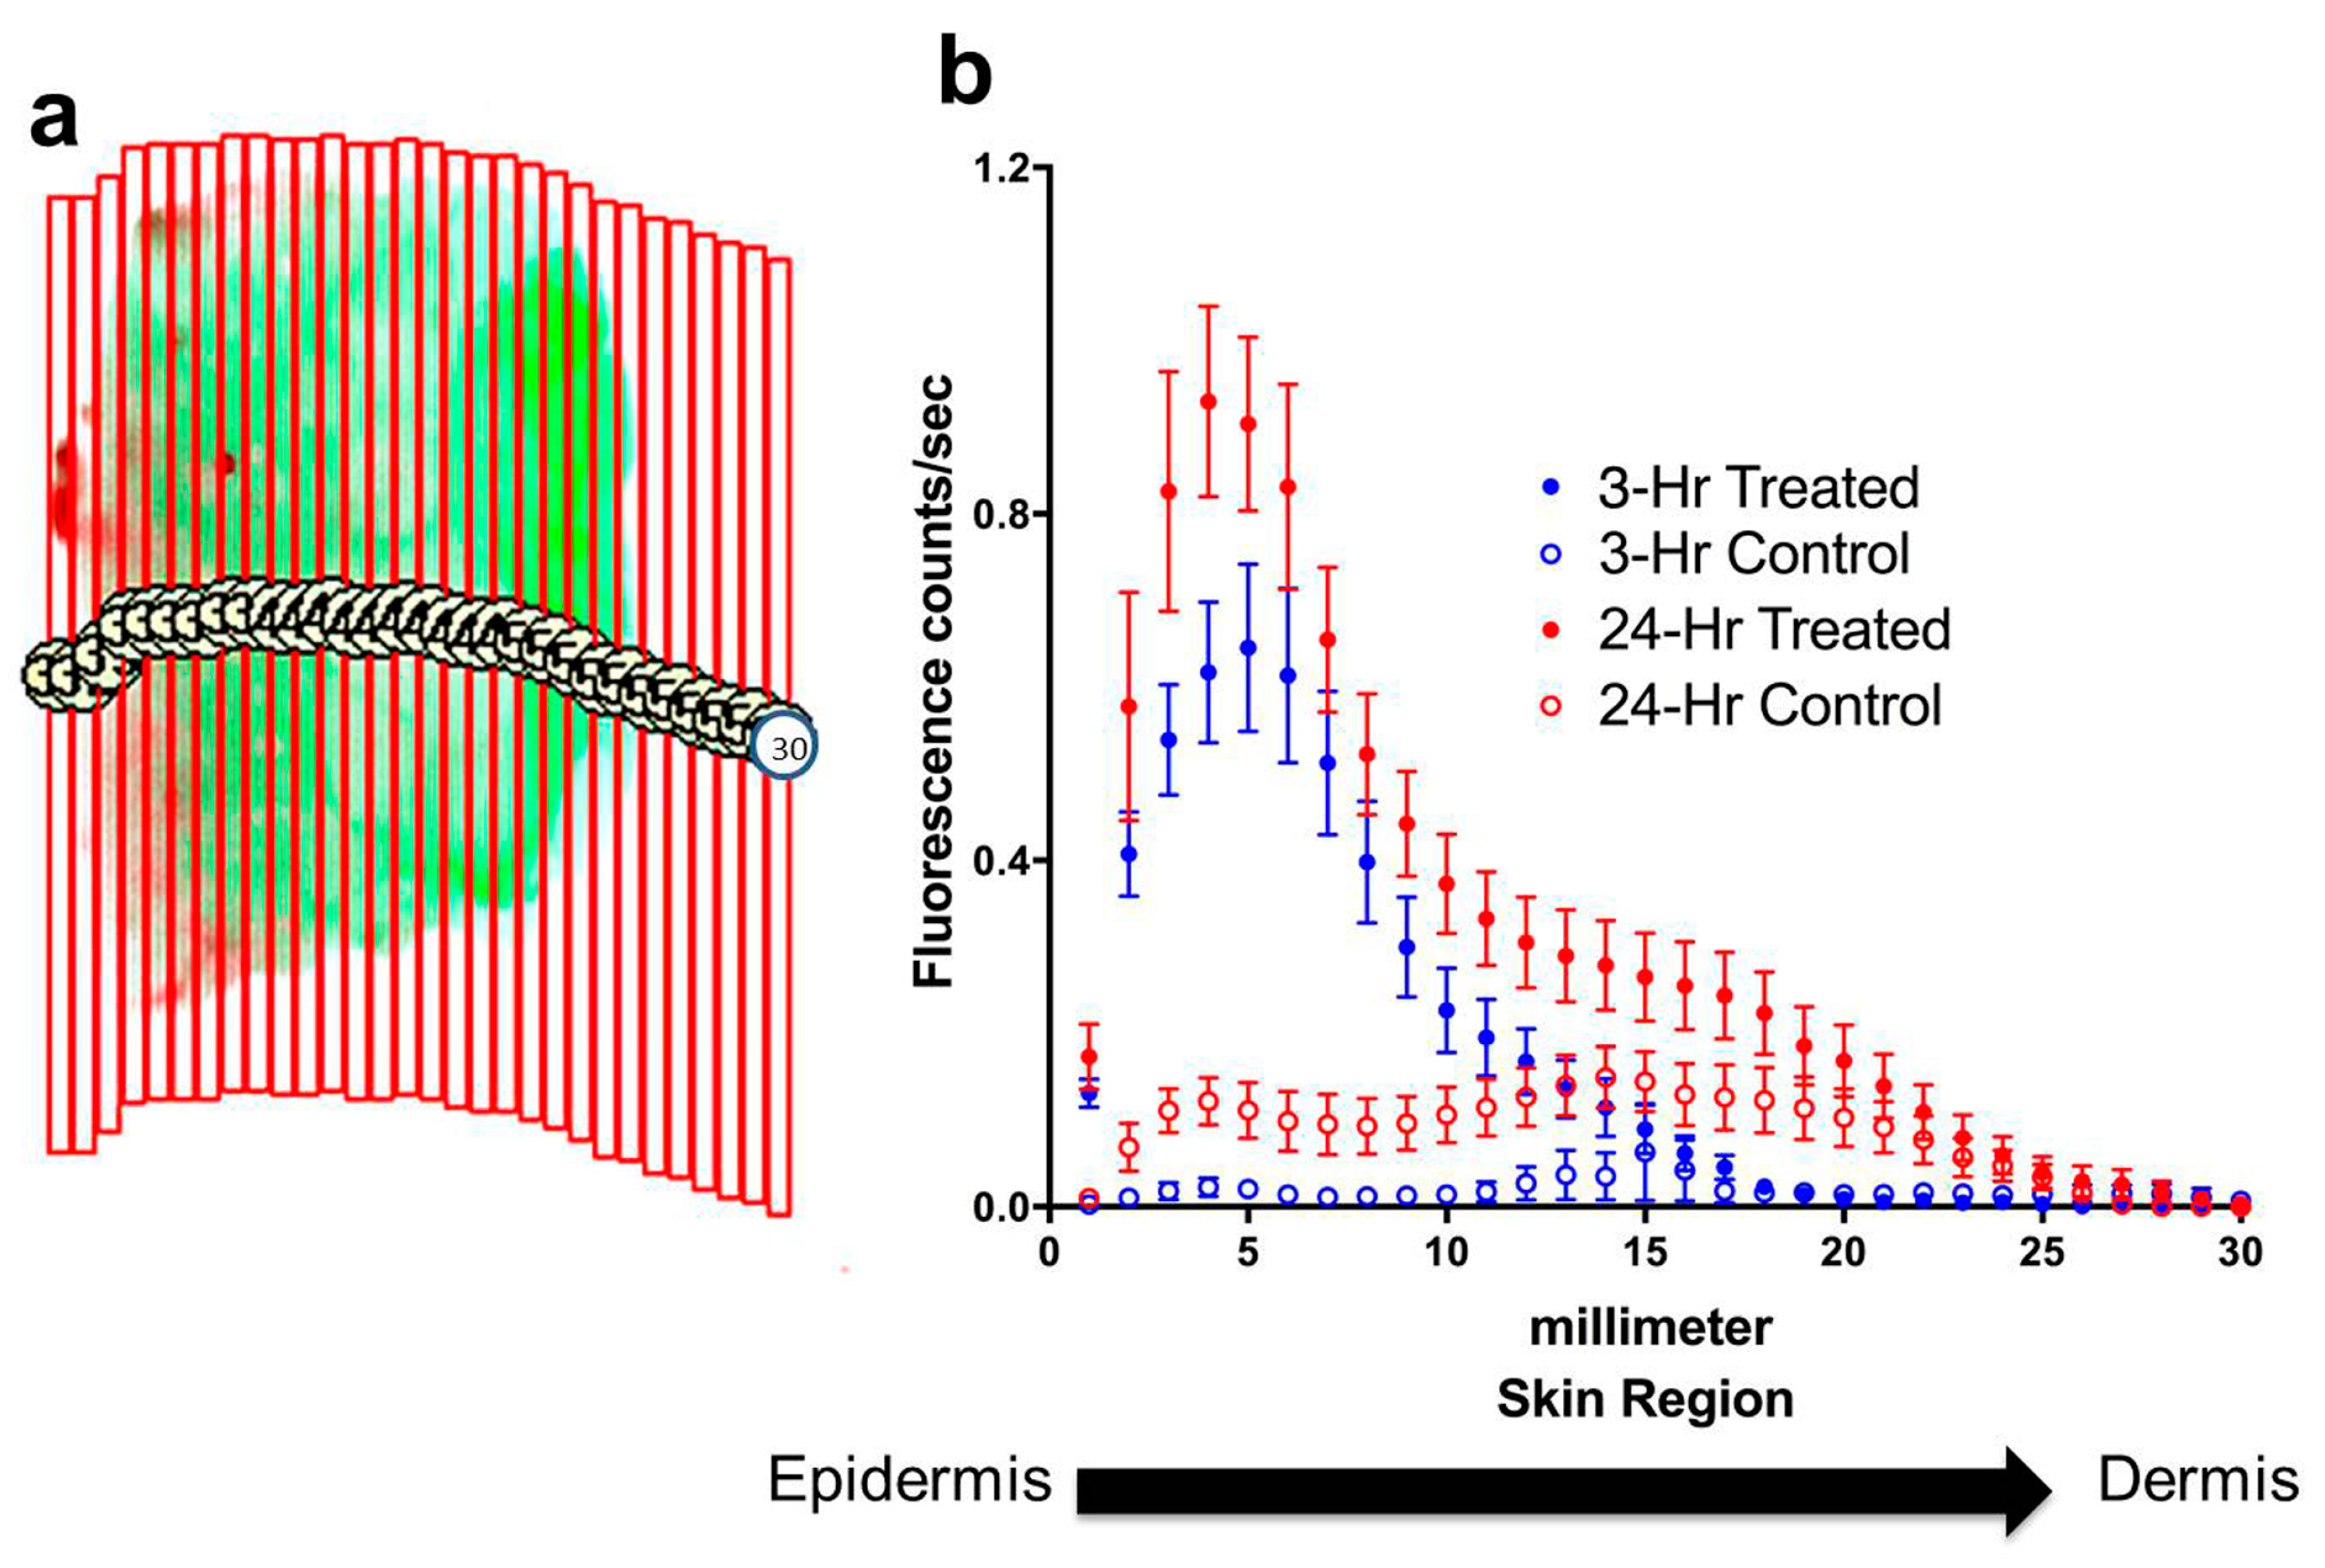
To determine the depth of penetration by dye-containing nanoparticles into the skin, the fluorescence signal of the near-infrared dye was quantified both in total for each specimen and for each of thirty 0.5 mm-wide, vertical regions spanning the cross-section of the specimen (
Figure 3a). The digital sectioning data for each incubation group were compiled, and corresponding control measurements were subtracted from treated specimen measurements, to chart average signal diffusion through these specimens for each incubation time group (
Figure 3b). The fluorescence signal in treated specimens was at a peak on the surface of the skin, where some residue of cream and nanoparticles will remain even after the cream has been manually removed. The signal also shows the penetration of nanoparticles through the skin layers, with an almost exponential decrease in signal intensity with the depth of the skin. The control specimens where only cream was applied displayed insignificant signal throughout the skin layers, indicating that there is no near-infrared background signal from the cream or from the skin itself.
Figure 3.
Digital sectioning and quantification of penetration of nanoparticles through skin specimens. (a) Illustration of digital sectioning for quantification of near-infrared signal through skin layers. The fluorescence image of each specimen was divided into a uniform set of thirty 0.5 mm-wide, vertical regions spanning the cross-section of the specimen, and the signal was quantified for each region. (b) Quantification of signal intensity through skin layers following 3-hour and 24-hour incubations. Quantified near-infrared signals for each group show progression of the signal well into the skin in a characteristic diffusion gradient pattern. The control specimens displayed a consistently lower signal than treated specimens, and 24-hour incubation with nanoparticle cream produced higher signal than 3-hour incubation. Data show mean ± standard error, with n = 12 for 3-hour incubation, n = 16 for 24-hour incubation.
Note that the images in
Figure 2 show that, for a particular specimen, the distribution of nanoparticles is not uniform even in the same layer of the skin. Individual specimens may exhibit more and less intense small regions of near-infrared fluorescence signal at different locations, likely due to either 1) their specific distribution of fibroblast, adipose and other cell types, or 2) localization of nanoparticles into hair follicles. It has been known that nanoparticles can diffuse through hair follicles and from there to the skin [
2,
22]. Inside follicles, the stratum corneum is present but is thinner, and thus presents a less well-armored barrier. The most likely other pathway for diffusion of nanoparticles is through the sweat glands, which reach into the dermis and may have an inner diameter of 10–100 µm [
23]. We do not anticipate that application of cream would have disrupted the epidermis to cause nanoparticles to penetrate the skin layer. Badihi
et al. have shown diffusion of PLGA-based nanoparticles (Size ~170 nm) loaded with dehydroepiandrosterone (DHEA), an endogenous hormone through skin layers in pig skin tissue and human skin culture, and shown increased synthesis of collagen in human skin tissue following treatment with DHEA-loaded nanoparticles [
24]. In another study, protoporphyrin, a photosensitizer, loaded in PLGA-NPs (size 290 nm) demonstrated higher delivery of protoporphyrin to mouse skin
in vivo than protoporphyrin in solution following topical application [
25].
Further study could attempt to quantify the clustering of near-infrared signal readings around visible follicles or sweat glands. Even if much of the total nanoparticle penetration does take place through follicles or sweat glands, this would not negate the value of nanoparticles in keeping their contents stable for long enough to reach a deeper target, or to deliver a sustained-release dose in the skin layers.
Table 1.
Estimated layer divisions in mounted skin specimens and diffusion of nanoparticles through different layers. The epidermal surface is represented by the first six sections, which is enough to encompass the entire surface no matter how uneven. The 1–2 mm dermis is represented by the following twelve sections, and the inner hypodermis by the remaining twelve sections.
| Region | Original Thickness | Multiple Applied | Thickness After Mounting | Multiple Calculated | Digital Sections | % of Total Signal: 3 h * | % of Total Signal: 24 h * |
|---|
| Entire sample | 5–6 mm | – | 15 mm | 3× | – | – | – |
| Epidermis | 100 µm | 3× | 300 µm | – | 1–6 | 59% | 55% |
| Dermis | 1–2 mm | 3× | 3–6 mm | – | 7–18 | 41% | 40% |
| Hypodermis | 3–4 mm | 3× | 9–12 mm | – | 19–30 | 0% | 5% |
It is important to note that although the digital sectioning makes it appear that the nanoparticles have penetrated up to 10–12 mm into the skin, this distance is amplified because of the compression of the sample (after incubation with nanoparticles has been completed) within the glass mounting prior to imaging. However, by measuring specimens with a millimeter rule and comparing the original thickness of each specimen with its thickness after mounting, we can estimate demarcations of different layers of the skin as reflected in
Table 1. Note that these are estimates only, based on the average thickness of these layers in normal skin and overall stretching of the skin tissue when placed between the glass slides for imaging [
5,
6,
7]. Further, the assumption was made that the stretching of the different layers of the skin when placed between the glass slides is proportional. Further microscopic analysis would be required to accurately determine the boundaries between skin layers. Nonetheless our analysis provides gross estimation of nanoparticle penetration into different layers of the skin.


