What Makes Indian Women Look Older—An Exploratory Study on Facial Skin Features

1
Oriflame R&D, A98 Y6W0 Bray, Ireland
2
Oriflame Skin Research Institute, Oriflame Cosmetics AB, 111 21 Stockholm, Sweden
*
Author to whom correspondence should be addressed.
Cosmetics 2018, 5(1), 3; https://doi.org/10.3390/cosmetics5010003
Submission received: 13 November 2017
/
Revised: 22 December 2017
/
Accepted: 25 December 2017
/
Published: 1 January 2018
Abstract
:It remains important to investigate skin ageing signs across different skin types for targeted solutions. Limited data is available on Indian skin changes throughout ageing, hence three fields were investigated: skin features during the ageing process, their relationship with perceived age and self-declared skin ageing concerns. Photographs, skin topography, colour and biophysical measurements of 202 Indian female volunteers, 30–65 years old, were collected. Another panel of 693 naïve graders, 20–65 years old, estimated the age of photographs previously collected. Associations between 28 skin features and real/perceived age were assessed using linear correlation coefficients. Skin feature scores of an older perceived group were compared versus the scores of a younger perceived group, to establish skin features that lead to an older appearance. Additionally, the naïve graders were asked to rank 12 skin ageing concerns by importance. Twenty-four features correlated with real and perceived age. The ages of the volunteers were overestimated, especially those in their 30s. Skin features related to skin brightness suggested an older look for volunteers in their 30s. From the 40s onwards, wrinkles around the eye area, glabellar and corner of the mouth were also drivers for looking older. In the 50s, features such as upper lip wrinkles, hydration and roughness on the crow’s feet were worse in the older perceived group, while nasolabial folds suggested an older appearance in the 60s. By having identified skin features that worsen with age and contribute to an older perceived face, this research will facilitate the creation of tailored products and communication for Indian women to look after their skin concerns throughout the ageing process.
1. Introduction
Human culture is deeply impregnated with the value of beauty and the passions that are inextricably bound to it, with exposure from early childhood to fairytales and the beauty norms of “princesses”. It has been suggested that human beauty standards are believed to be innate [1] and serve the purpose of healthy mate selection. A youthful appearance in women is more appealing to men as it reflects their reproductive potential [2]. The cosmetic industry has well capitalized on this quest for youth, as evidenced by the weight of the anti-ageing segment in skin care sales [3,4] and consequently, numerous investigations have aimed to describe skin feature changes occurring during the natural process of ageing [5,6], in order to offer products that “rejuvenate” skin appearance. Furthermore, there is ongoing research to identify aggravating factors and their contribution to skin alteration, whether they are intrinsic or extrinsic (e.g., sun exposure [7,8], tobacco [9] and recently, pollution [10]).
Consequently, people are not ageing at the same pace and this is translated into people looking younger or older than their real age. “Perceived age”, or the estimated age of a person, was shown to be predictive of short-term mortality and survival in a longitudinal study [11,12]. Skin wrinkles, lip height and hair greying have been found to correlate with perceived age, which has been suggested as a better biomarker than chronological age [13]. Previous work conducted on a large Russian cohort highlighted that age perception was primarily driven by topographic cues, such as crow’s feet, glabellar wrinkles, under eye wrinkles, forehead wrinkles, upper lip wrinkles, nasolabial fold wrinkles and colour cues to a lesser extent [14]. Another study with manipulation of photographs by topography and/or colour smoothening demonstrated that, albeit both treatments decreasing perceived age, topography was a better cue for age perception, while colour distribution was a stronger one for health [15]. Still in the area of image manipulation, artificial changes of facial contrast between facial features (e.g., mouth, eyes) and surrounding skin on photographs of French women had an effect on perceived age assessment, with women looking younger when contrast increased and looking older with decreased contrast [16].
Because these findings are from Caucasian panels, there is a need to undertake this type of research in other skin types, as skin characteristics may vary across ethnicities. Indeed, differences have been reported for skin colour and its distribution [17], onset for wrinkling [18], skin barrier [19], biochemical composition of the stratum corneum [20] and so on. China, a fast growing market for cosmetics, has been under the spotlight with regards to age perception research in the past few years; wrinkles and hyperpigmentation were shown to be the most correlated skin features with perceived age, regarded as a better measure of facial skin than real age [21]. In a previous study from Chanel, images of Chinese women were perceived younger by a Chinese panel to a greater extent after artificial reduction of dark spots, compared to wrinkles or sagging reduction. Interestingly, images from Caucasian women were perceived younger by the same Chinese panel, mostly after artificial reduction of wrinkles/sagging [22], thus pointing out how age perception is driven by ethnic background. Lifestyle factors having an influence on the perceived age of Chinese have been studied as well, notably the detrimental effect of sun exposure [23], but also factors associated with a younger look, among them, greater years of education, a lower number of household members, frequency of visits to the doctor, product usage or physical activity [24].
India, another fast-growing market, has received little attention in the area of skin ageing research, in comparison. A large scale study, conducted by L’Oréal, focused on the skin colour and its changes throughout chronological ageing in four different Indian cities (Mumbai, Chennai, Delhi and Kolkata). Skin colour diversity was high, with large ranges of skin brightness (L*) and skin colour (ITA) values across the whole panel, yet little changes in skin complexion were observed with age [25] as opposed to other ethnicities [17]. Another key finding was the prevalence of many pigmentary disorders at early stages of life, such as hyper-pigmented spots, melasma, ill-defined pigmented macules and dark circles. In the area of wrinkling/tissue slackening, a photographic scale has been developed from images of 300 women from the Mumbai region [26]. However, to our knowledge, there are still gaps in the literature regarding a comprehensive view of facial Indian skin ageing and which skin features could contribute towards an older perceived look. In this present work, we aim to provide answers through a large range of skin measurements and perceived age attribution of photographs from Indian women.
2. Materials and Methods
2.1. Volunteers
Two hundred and two healthy Indian female volunteers, aged 30–65 years old (mean age = 46.8, SD = 10.2), were recruited by Mascot Spin Control India, in a large base study, conducted in Mumbai, India. This sample size was decided in accordance with similar investigations related to perceived ageing [14,16,21]. Recruitment was performed in order to obtain around 25 volunteers per 5-year age brackets (e.g., 30–34 years, 34–39 years old, 40–44 years old, etc.). Volunteers were asked to remove facial jewelry and earrings and went through a 20-min period of acclimatization under a controlled temperature (21 ± 3 °C) and relative hygrometry (50 ± 10%) prior to the measurements. The volunteers were requested to wear a black mobcap and a black cloth, in order to avoid the potential influence of extrinsic colours. Non-inclusion criteria were having applied a cosmetic product (including make-up) on the studied areas the day of the study, excessive facial hair that could interfere with the observation of the features on the picture, having undergone any surgical intervention on their face (lifting, Botox injections, hyaluronic acid injections, collagen injections), having undergone any microdermabrasion or lactic acid/chemical peeling on facial skin in the last 6 months, having practiced water activities (swimming pool, sauna, hammam, balneotherapy) in the previous week, having practiced sport the day of start of the study, having consumed caffeine-based products (coffee, cola, tea), alcohol, highly spiced foods and/or smoked in the two hours preceding the measurements. This study was carried out in conformity with the most recent recommendations of the World Medical Association (Declaration of Helsinki 1964, amended in Seoul, Korea, 2008). All procedures involved in the study were explained in detail and written informed consent was obtained from all volunteers.
2.2. Photographs Followed by Facial Attribute Assessment through Image Analysis
Photographs of facial front and 37° profile view photographs were captured using a standard imaging device, based on a high resolution digital camera (VISIA® Complexion Analysis, Canfield Scientific Inc., Fairfield, NJ, USA), under general standard white and cross-polarised lighting conditions; thus, a total of 6 photographs were obtained per volunteer. Image analysis was performed on cross-polarised and standard white photographs, using image analysis software (Image-Pro Plus 7, Media Cybernetics Inc., Rockville, MD, USA) customized by a proprietary colour-measuring macro and the built-in VISIA® Complexion Analysis 2.0 software with automatic colour and texture-feature detection ability, respectively.
2.3. Grading of Ageing Signs
Photographic expert grading, based on published scales [6], was performed by 3 expert graders on cropped standard white light photographs, previously captured with the VISIA CA. Graders were trained on a photo database for accuracy (Spearman correlation of at least 0.85 versus known grades) and repeatability (±1 point on initial grade only allowed twice out of 10 pictures) prior to the assessment. Grading was performed by all graders under the same conditions (same display monitor and lighting conditions) and blinded, with no knowledge of the volunteers’ ages. Photographs were randomised for each grader in order to avoid fatigue bias.
2.4. Probe Measurement
Several probe measurements were included in this study. Prior to measurements, all probes were calibrated as per instruction manuals. Skin biomechanical properties were measured on the cheek, using the Cutometer MPA580 (CK Electronic GmbH, Cologne, Germany), with a 2-mm probe aperture. Ten consecutive cycles were used, with a suction time of 1 s, followed by 1 s of relaxation time. The parameters, F4 (skin ability to be stretched or “laxity” and R5 (skin ability to recover or “elasticity”), were exploited for the analysis, as both offer a comprehensive view of skin biomechanical properties. Skin oiliness was measured on the forehead, using the Sebumeter SM815 (CK Electronic GmbH, Cologne, Germany), skin hydration was measured on the cheek with the Corneometer CM825 (CK Electronic GmbH, Cologne, Germany) and skin colour was measured on the cheek with the Chromameter CR-400 (Konica Minolta, Warrington, UK).
2.5. Silicone Rubber Replicas Analysed by Fringe Projection
Profile roughness was measured from a silicone replica of the crow’s feet area (Silflo, Flexico Developments Ltd., Hertfordshire, UK), using the DermaTOP system (DermaTOP®, Eotech, Marcoussis, France), with average axial and lateral resolutions of 10 μm. Roughness parameters were extracted from a surface of 43 mm × 32 mm (12 cm²).
A summary of all skin features measured can be seen in Table 1, compartmented in three categories: wrinkle/texture, skin color and biophysical.
2.6. Perceived Age Assessment by Naïve Graders
The front view, full face photographs of volunteers, captured under general white light, were viewed by a total of 693 female participants of Indian nationality, recruited by Millward Brown (N = 346 in Mumbai and N = 347 in Delhi), aged from 20 to 65 years old, who were asked to estimate the “age of the face”, referred to as “perceived age”. These female participants who did the assessment are referred as naïve graders and had no particular skincare or skin ageing/age perception knowledge. This multi-centric assessment was performed using a computer-based questionnaire (MediaLab 2008 v1.33, Empirisoft Corporation, New York, NY, USA), enabling the randomised display of photograph selection. In order to avoid assessor fatigue and age bias reported in age perception, the study was designed so that each assessor evaluated a subset of 29 photographs, with each individual photograph being assessed 100 times on average (min 97, max 105) by the same age distribution profile. The mean perceived age value was calculated for each subject. The perceived age was used for correlation with skin features, while the difference between real and perceived age was used to identify skin ageing features impacting age perception at different chronological decades.
2.7. Self-Declared Skin Ageing Concerns
In order to get further knowledge on what concerns Indian women have during the ageing process, the naïve graders were asked to rank, from 1 to 12 (1 being the most important), the features laid out in Table S1, when considering their skin ageing concerns.
2.8. Statistical Analysis
2.8.1. Correlation of Skin Facial Attributes with Chronological and Perceived Ages
Twenty-eight facial features were measured from the different instruments and techniques (Table 1). Pearson linear correlation coefficients were calculated to establish the relationship of the facial features versus chronological and perceived ages. Only parameters correlating significantly with chronological/perceived age are highlighted with colours–blue for positive correlations and orange for negative correlations.
2.8.2. Age Perception Accuracy
A scatterplot of chronological age (X axis) versus perceived age (Y axis) of all volunteers was created to first visualise how naïve graders were accurate, with regards to age estimation, on the whole panel. The latter was then divided into 4 subgroups, according to their real age (30–39, 40–49, 50–59 and 60–65 years old) and box-plots of the median error on age perception, (perceived age minus chronological age) were created for each age subgroups. A Kruskal–Wallis ANOVA was then performed to compare the median error for age perception between the subgroups.
2.8.3. Age Specific Relevance of Skin Ageing Features in Relation to Perceived Age
Unpaired t-tests were performed to identify skin features that are likely to contribute towards an older perceived look for each age subgroup.
2.8.4. Self-Declared Skin Ageing Concerns of Naïve Graders
Results were expressed as percentage of graders per age subgroup (30–39, 40–49, 50–59 and 60–65 years old) who ranked a specific skin ageing concern first.
All calculations were performed using STATISTICA V13 (Dell, Round Rock, USA), and the significance level of α = 0.05 was set throughout all analyses.
3. Results
3.1. Correlation of Skin Facial Attributes with Chronological and Perceived Age
Numerous skin facial attributes were found to correlate with both chronological and perceived ages, indicating a worsening with increased chronological/perceived age (Table 2, Table 3 and Table 4). Strong correlations (r ≥ 0.7) were observed with the roughness of the crow’s feet area, crow’s feett, nasolabial fold, upper lip, glabellar and under eye wrinkle depth. Moderate correlations (0.4 < r < 0.7) were observed for the number of crow’s feet wrinkles, forehead and corner of the mouth wrinkle depth, overall skin roughness, severity of UV spots, number/severity of localised red areas, skin sallowness, skin elasticity and skin hydration. Severity of pores, UV spot number, number of brown spots, severity of brown spots and skin laxity correlated weakly with chronological/perceived age (r < 0.4 ) There was no significant relationship between cheek redness, facial colour unevenness, under eye dark circles and chronological/perceived age. Overall, topographic features (wrinkles/roughness) experience more dramatic changes during the ageing process and are better cues for age perception, compared to skin colour and skin biophysical parameters.
3.2. Age Perception Accuracy
Perceived age was found to correlate strongly with chronological age (r = 0.9, p < 0.0001), thus an older woman was perceived as older looking. Figure 1 outlines the scatterplot of the volunteers’ ages on the X axis versus the age difference (perceived minus real age) on the Y axis. However, people’s ages tended to be overestimated, with 73% of the overall panel of volunteers being perceived as older than their real age, versus 16% being perceived as younger. This effect was even more visible for those under 40 years, where only three people were perceived as younger.
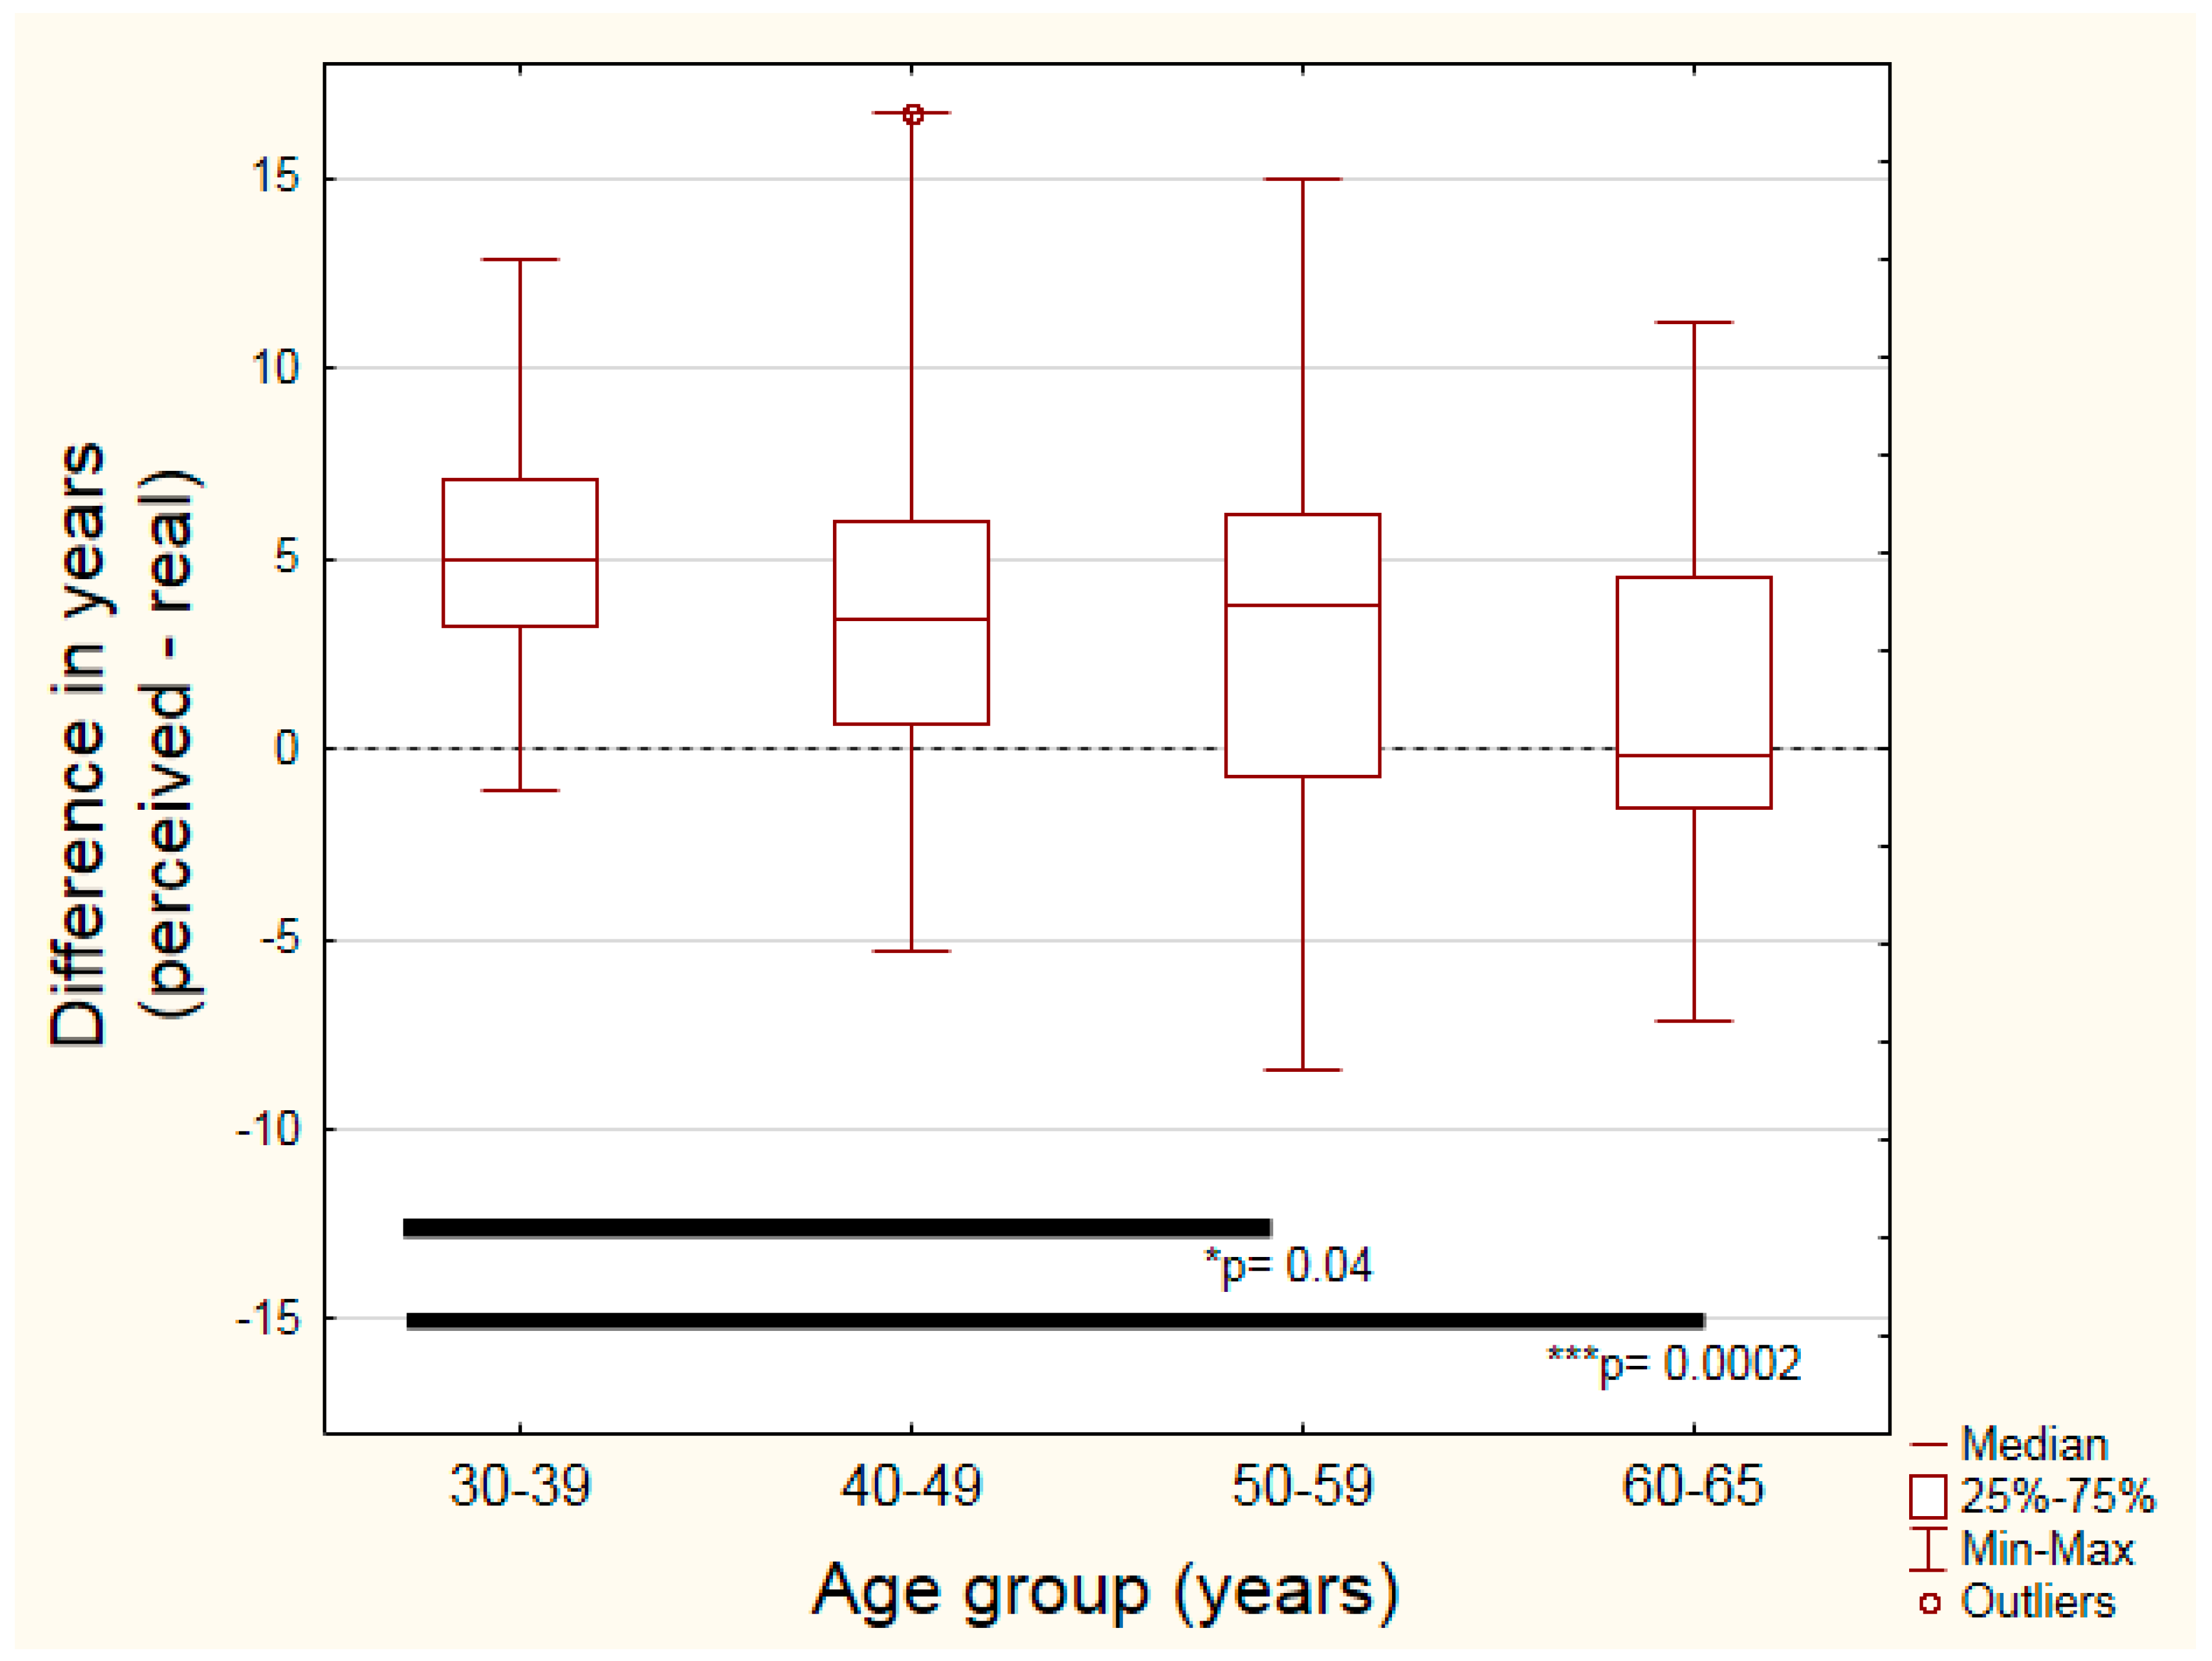
The panel of volunteers was then divided in four subgroups, according to their real age (30–39, 40–49, 50–59 and 60–65 years old) and box-plots of the median age differences (perceived age—real l age) were created, as shown in Figure 2. The median age difference was the largest in 30–39 years group (+4.92 years) and was significantly different versus the median of the 50–59 (+3.73 years) and 60–65 year groups. The latter group had the lowest median, nearly centered on zero (−0.15 years). These results depict how naïve graders were inaccurate for the youngest group of volunteers, while demonstrating a much better accuracy in the older group of volunteers, which had accumulated signs of ageing.
3.3. Age Specific Relevance of Skin Ageing Features in Relation to Perceived Age
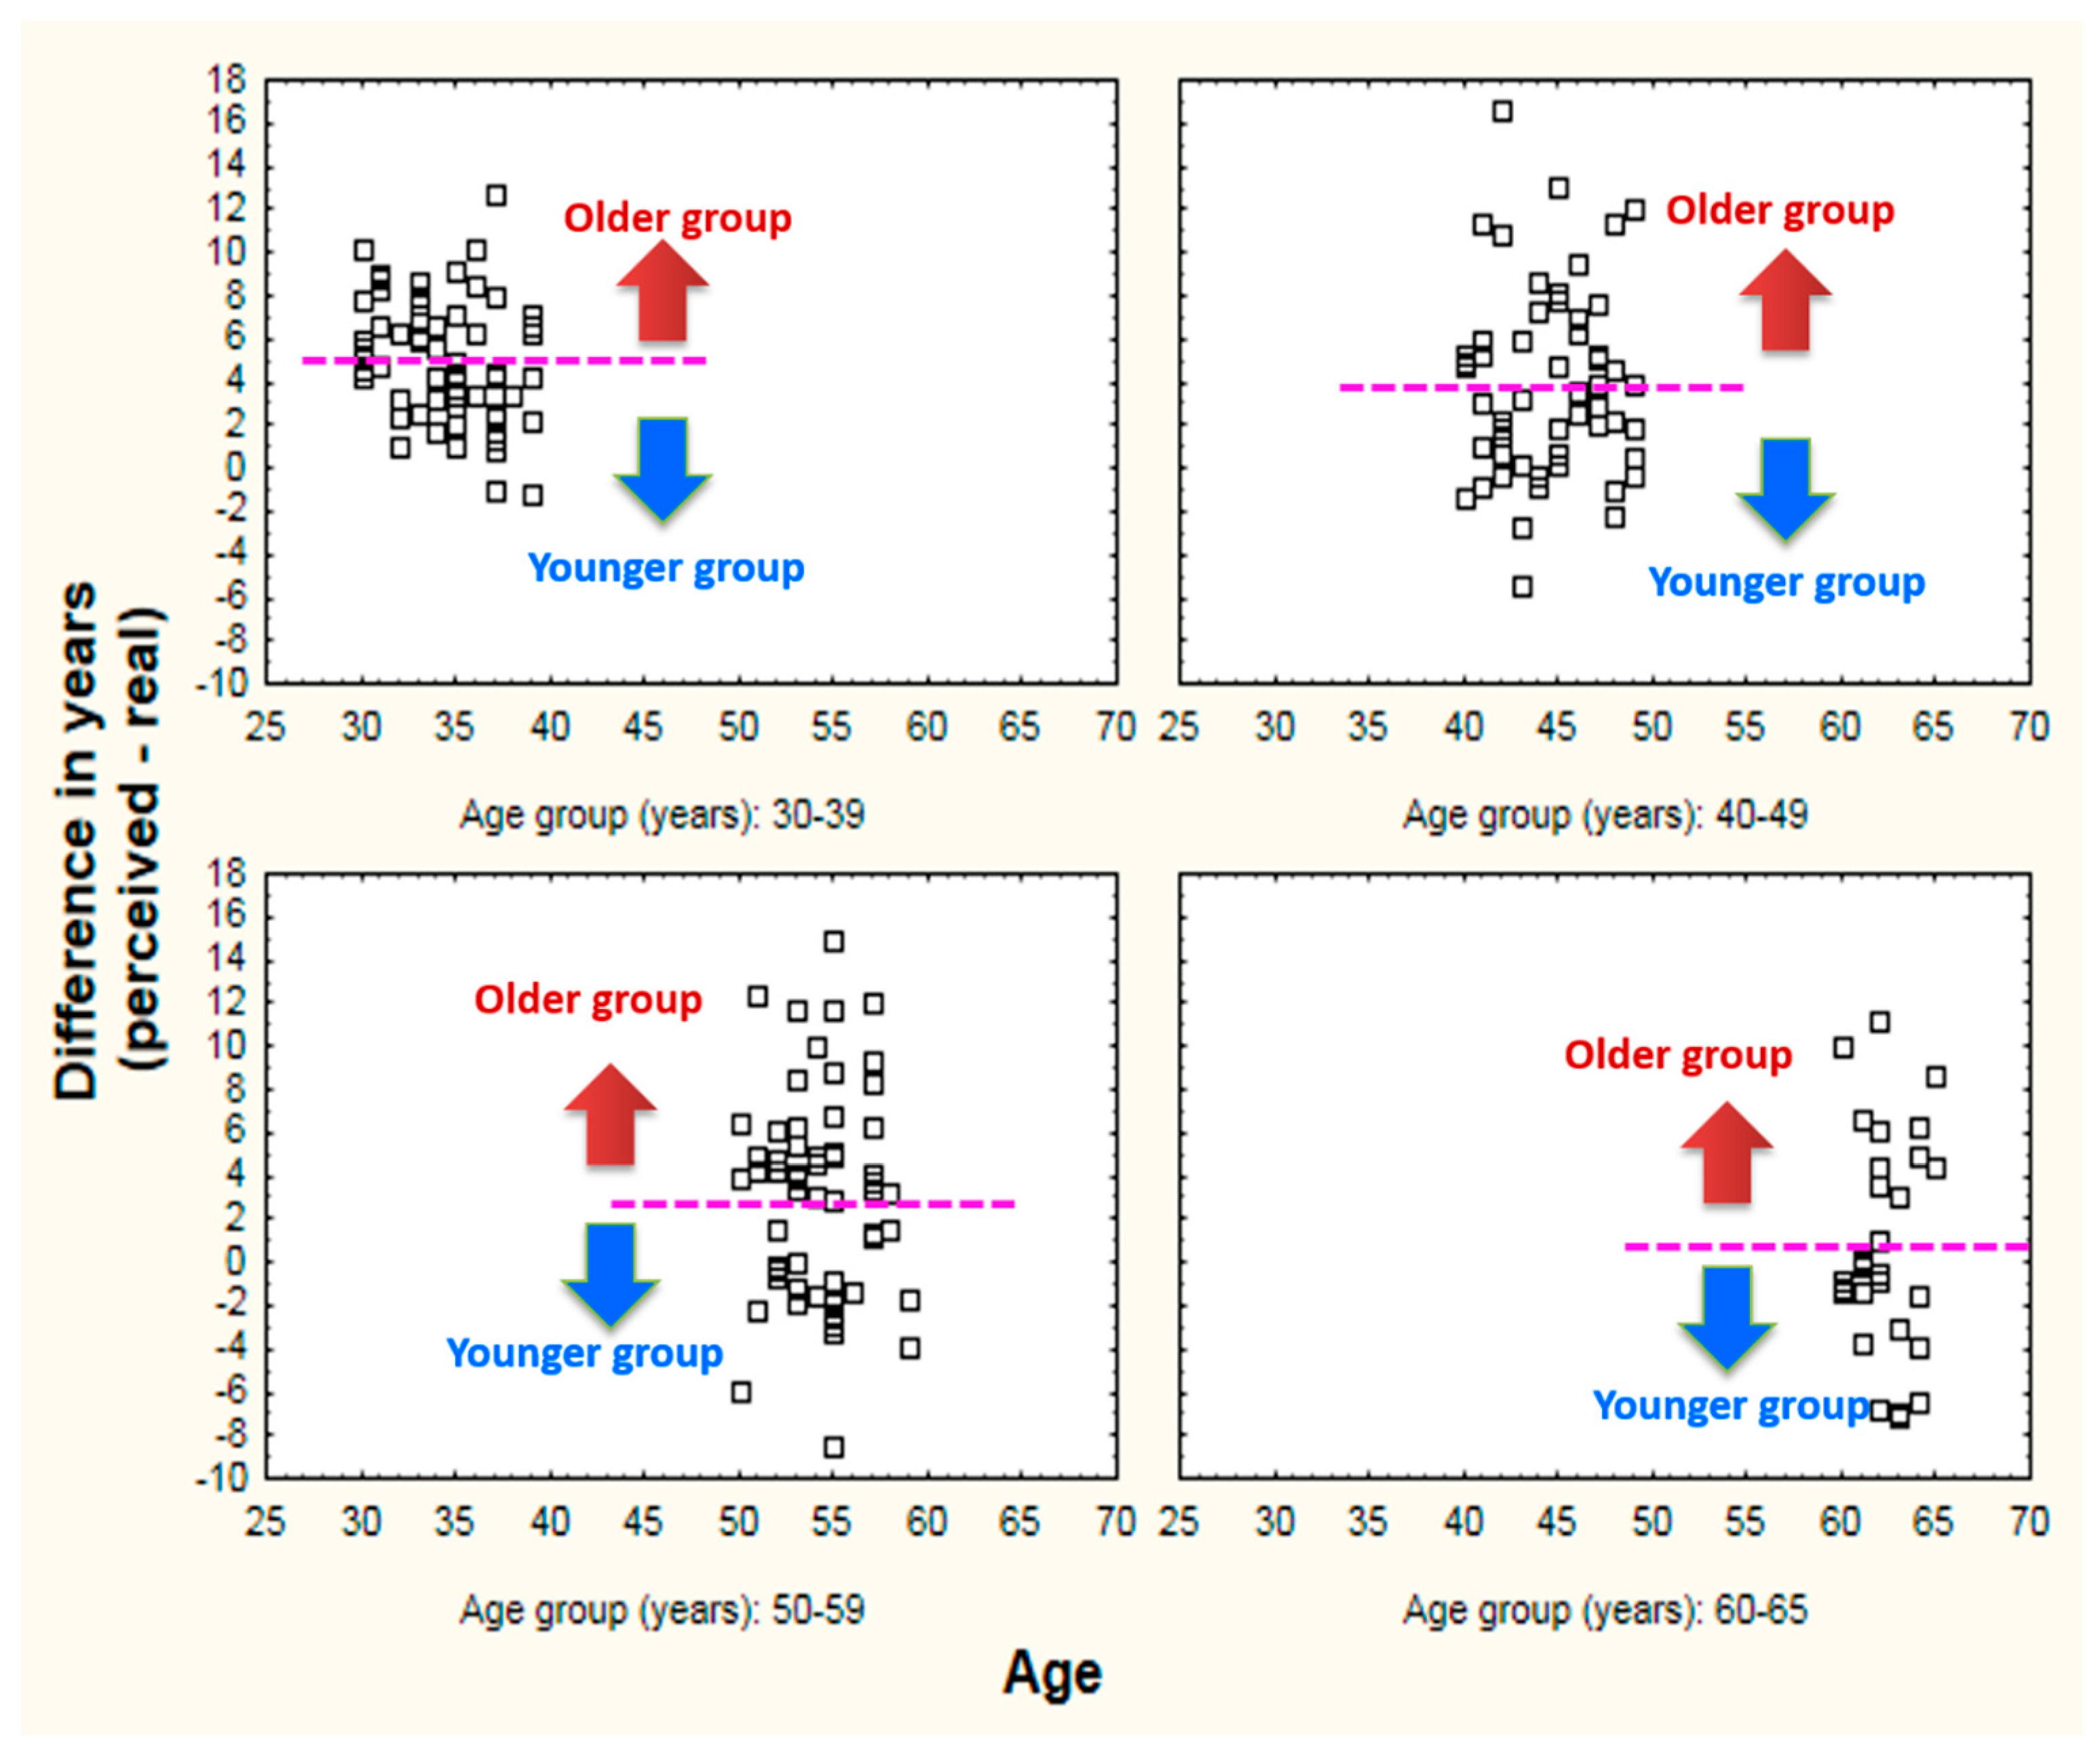
With the aim of understanding the skin features leading to an older perceived look, each of the previous age subgroups of volunteers were split in two halves, according to the median age difference, as shown by Figure 3. Table 5 describes the number of volunteers in each group and the value of the median age difference for each chronological decade.
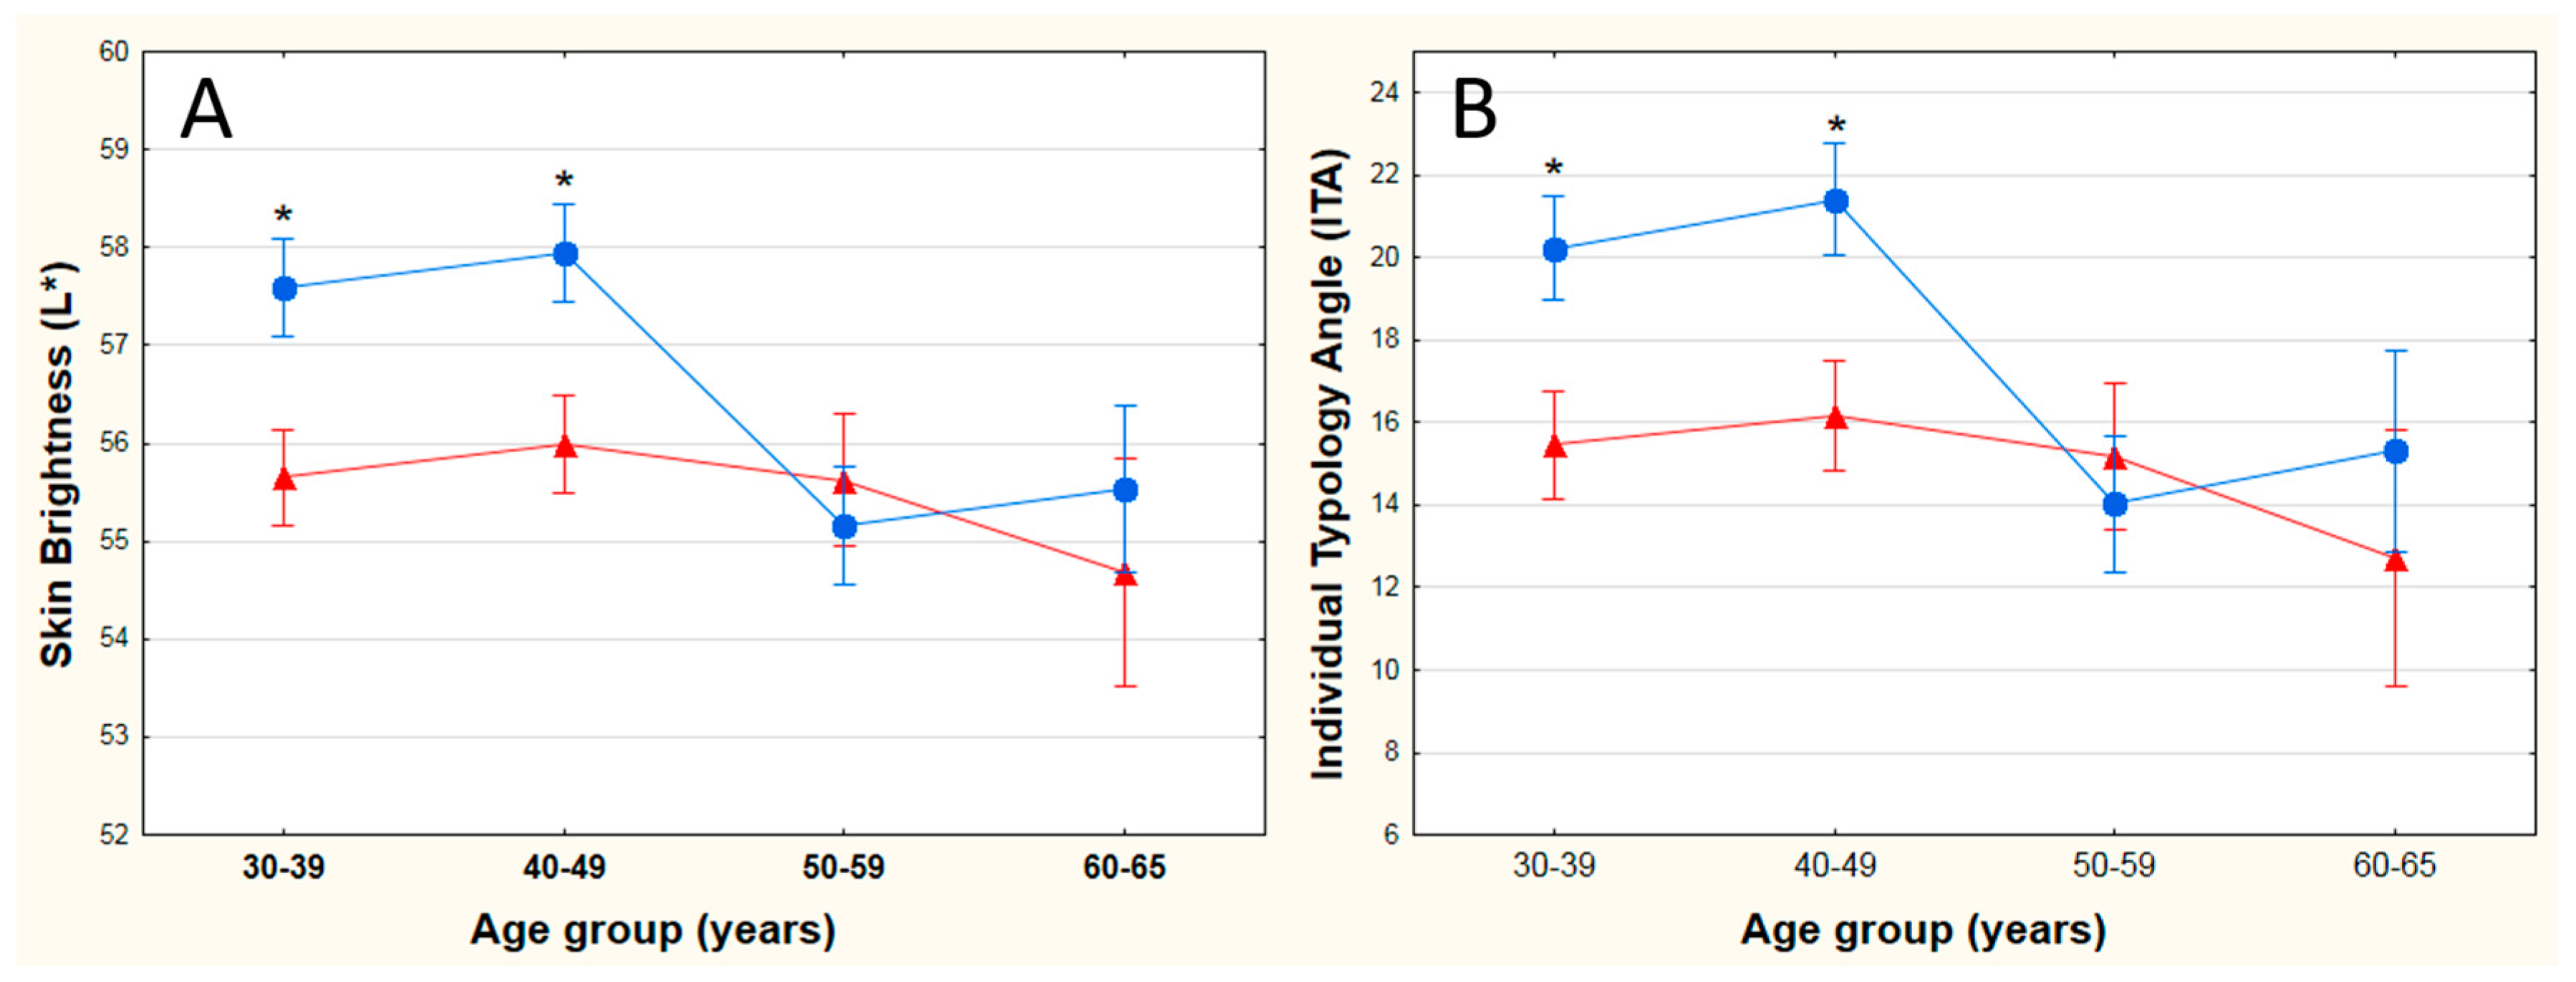
In the age bracket of 30–39 years, the group of female volunteers perceived older (above median age difference) had a lower skin brightness (L*) and ITA, thus darker skin, compared to the younger looking group, as outlined in Figure 4. Significant gaps between both groups in ITA and L* were also visible in the 40–49 year age bracket.
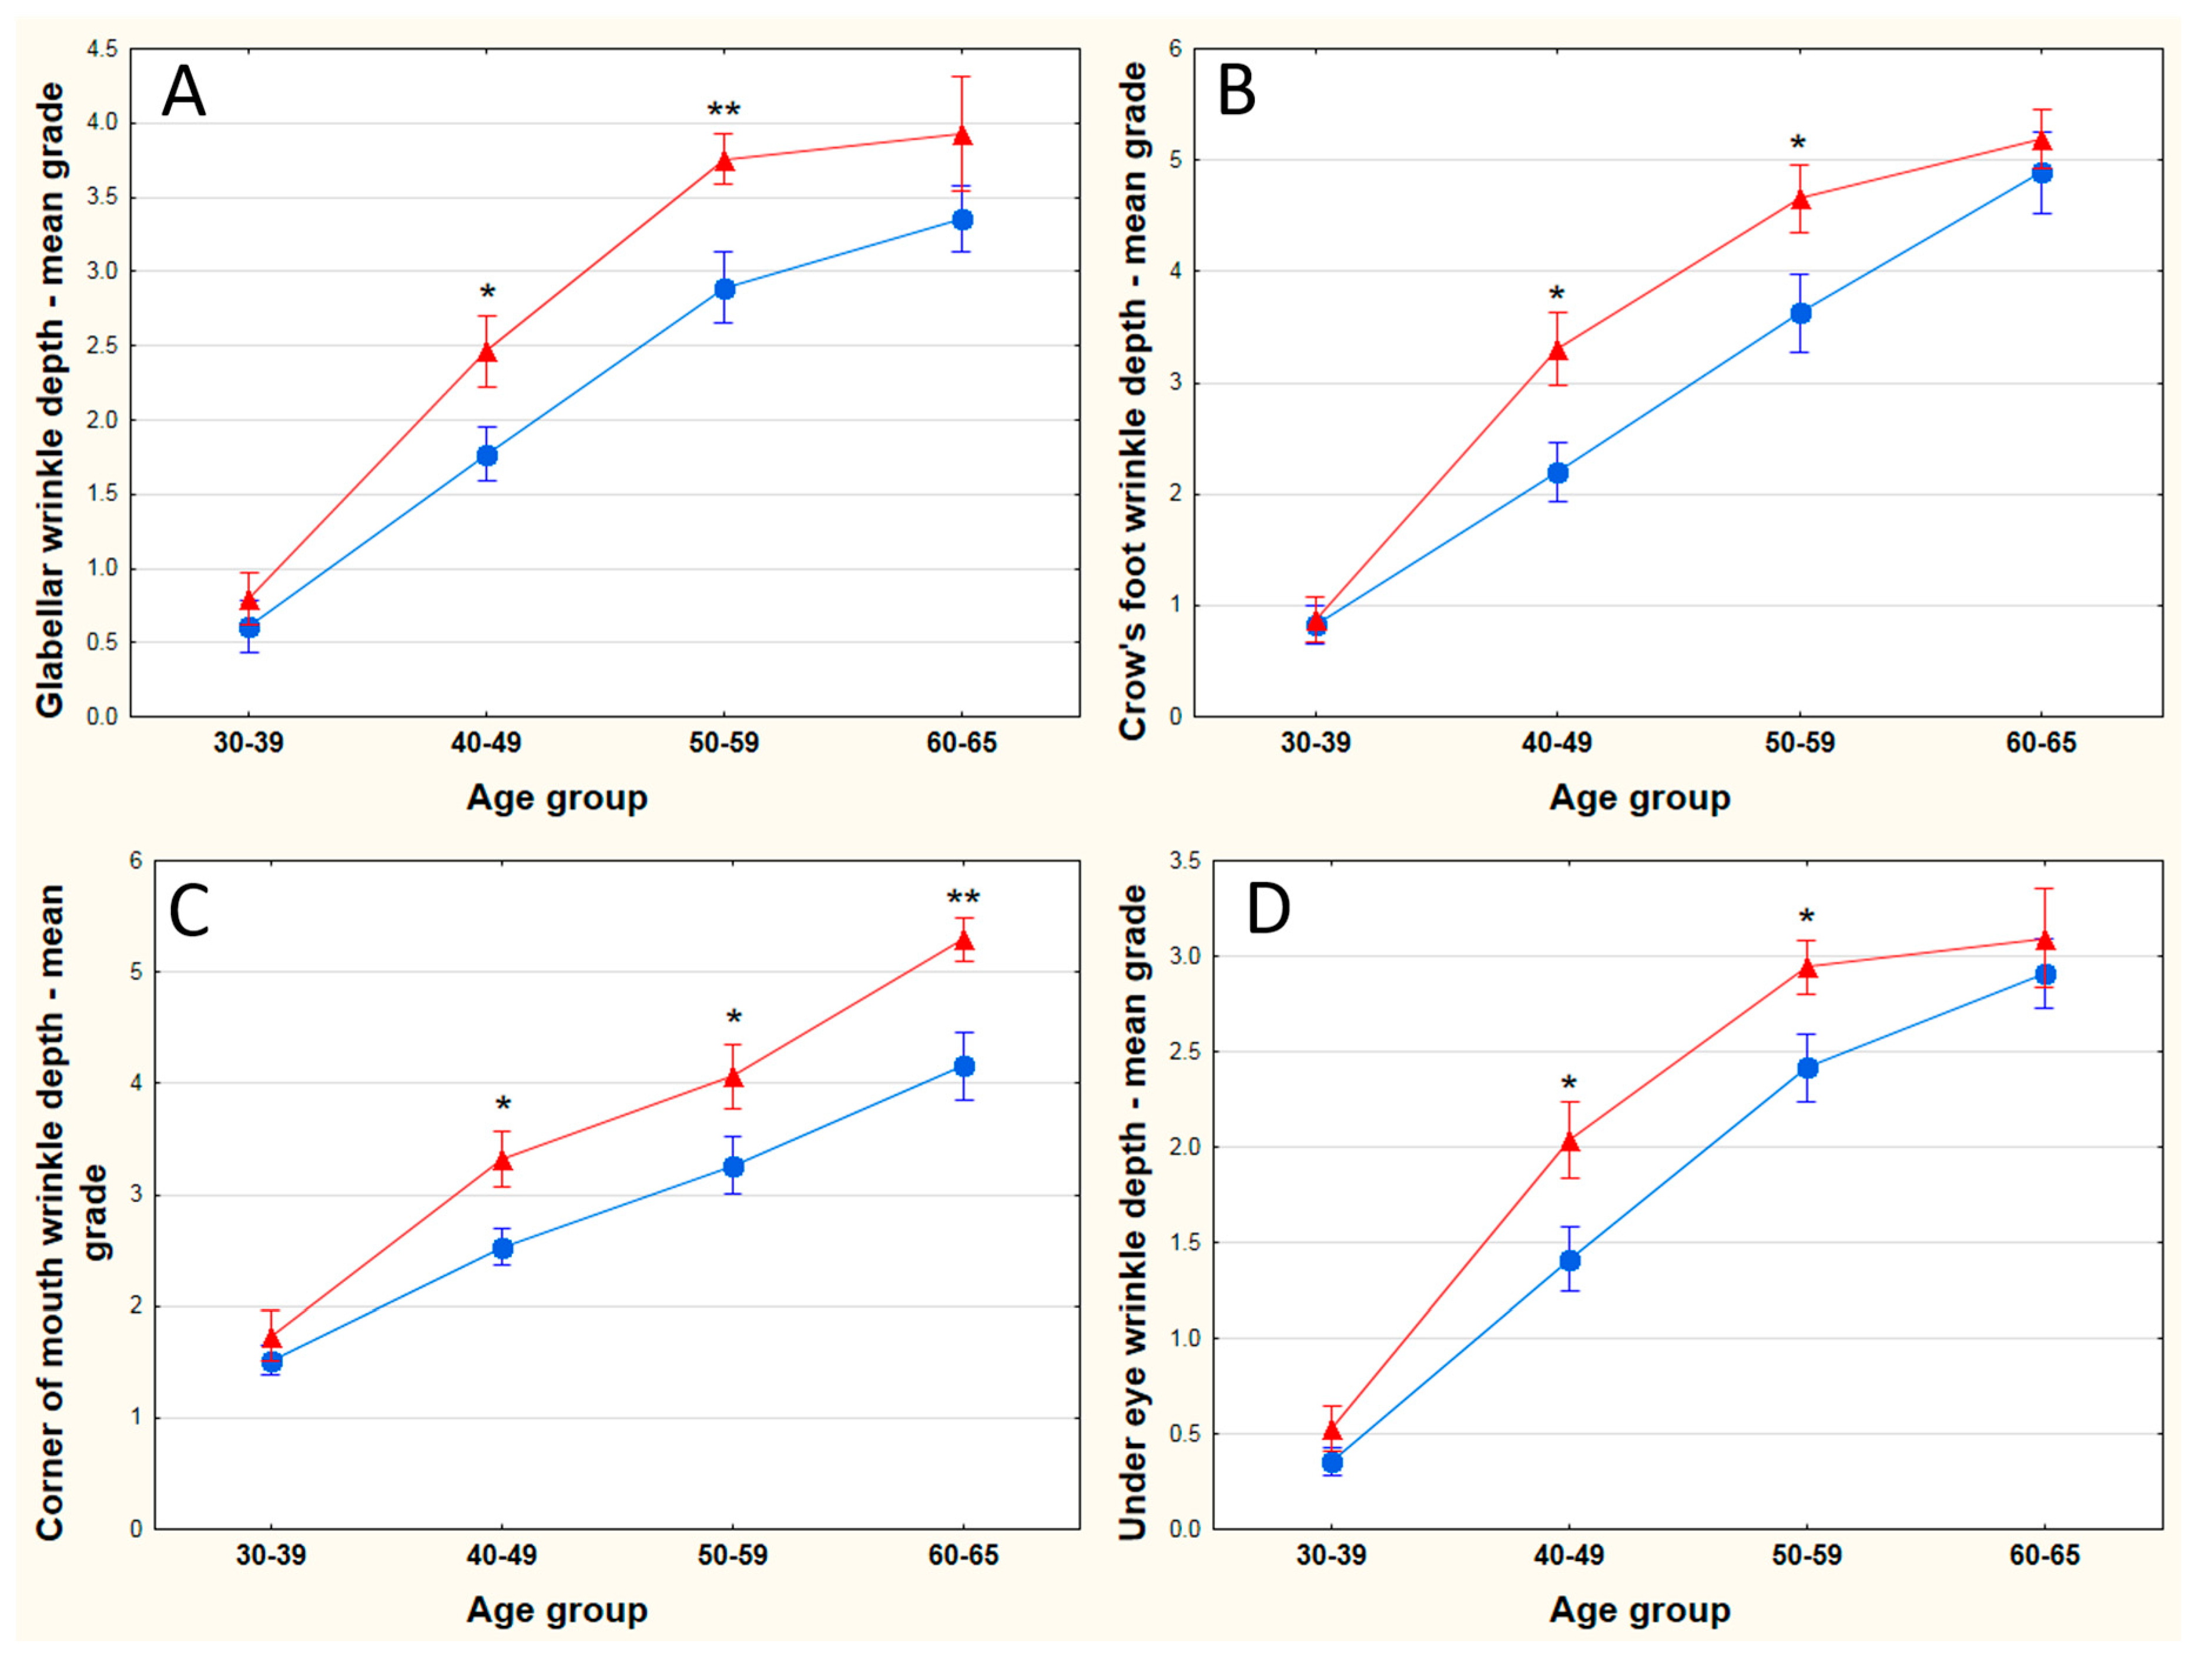
From the 40s onwards, a set of facial features related to wrinkles were found to suggest an older perceived look. The mean depth grade was significantly higher for the older perceived group of women for crow’s feet, glabellar, under eye and corner of the mouth wrinkles (Figure 5). The difference in severity of these wrinkles between the two groups remained significant in the 50–59 year bracket, and even throughout the 60–65 year bracket for the corner of the mouth wrinkles in particular. Forehead wrinkle depth difference between the two groups was marked for women aged 40–49 years old, albeit not significantly (p = 0.058).
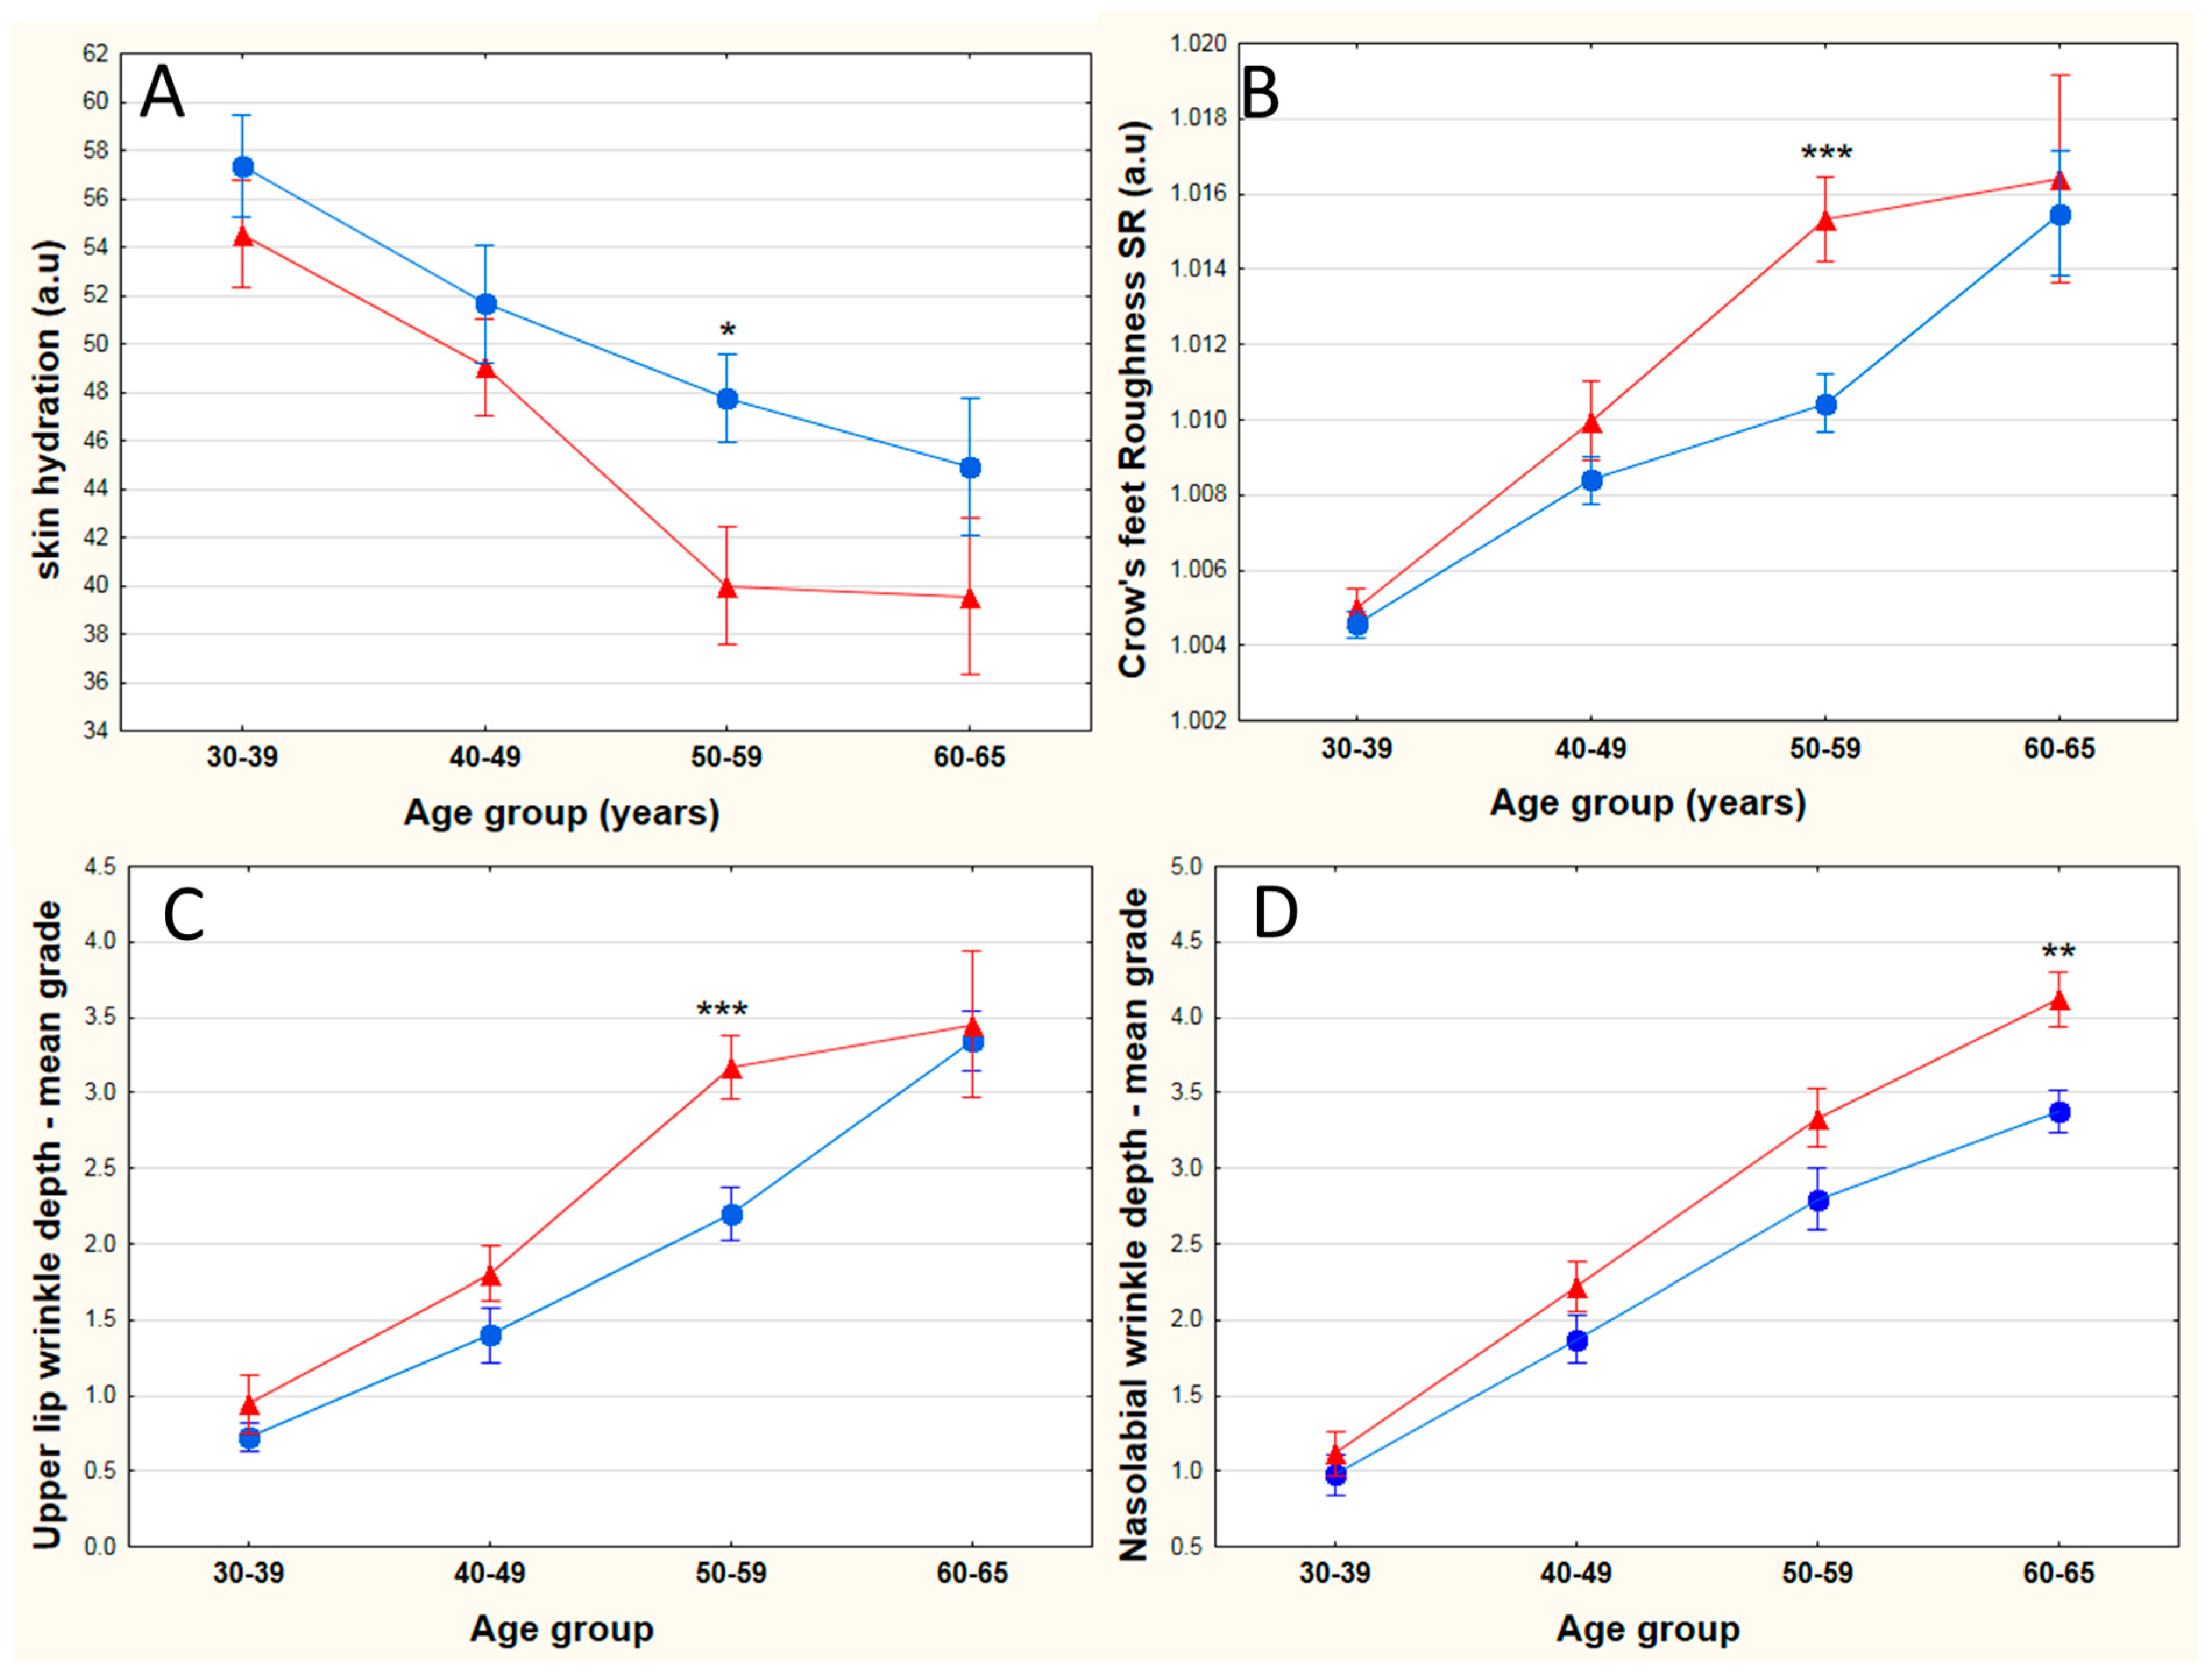
For the 50s age range, a new wrinkle specific drove an even older look: upper lip wrinkles. Another topographic cue–skin roughness (SR) on the crow’s feet area—was also found to be much higher in the oldest perceived portion of the panel. Skin hydration on the cheek was continuously decreasing in both groups across the different age brackets, yet the drop was significantly steeper in the 50s for the older looking group (Figure 6). In the area of skin hyperpigmentation problems, the severity of localized red areas was significantly higher for the older perceived group (Figure S1). Specific to the 60s, the nasolabial fold wrinkle depth was significantly higher for the older portion of the panel (Figure 6). The wrinkle around the corner of the mouth was the only facial feature contributing to an increased perceived age in this decade.
Numerous skin features did not appear to suggest an older perceived look (e.g., pores, dark circles, cheek redness, skin oiliness), among them, skin biomechanical properties. Nevertheless, it is worthwhile to mention the nearly linear and steady decline of skin elasticity (R5) in both groups of volunteers (below/above median age difference) throughout ageing, while skin laxity (F4) worsened in a dramatic fashion between the 40–49 year and 50–59 year age ranges, as illustrated by Figure S2. A summary of all skin features responsible for an older facial appearance for each chronological group is displayed in Figure S3.
3.4. Self-Declared Skin Ageing Concerns
The self-declared skin ageing concerns from the naïve graders laid out in Table S1 were analysed per age cluster (20–29, 30–39, 40–49, 50–59 and 60–65 years). When looking at primary skin concerns selected by the panel of graders per age group, skin dullness, followed by wrinkles outside the eye corner and forehead wrinkles/frown lines were the main concerns in the 20s. Wrinkles in the eye area (outside of corner and under) and skin dullness were the top three concerns in the 30s and 40s. A similar pattern was observed in the 50s although there is a growing concern for forehead wrinkles/frown lines over dullness. In the 60s, the trio of main concerns was the wrinkles on the eye area (outside of corner and under), but also wrinkles around the corner of the mouth. The top three key concerns for each age cluster are outlined in Figure S4.
4. Discussion
This is the first study evaluating the impact of topographic, colour and biophysical measurements on the perceived age of Indian women (n = 202), aged 30 to 65 years old, by the mean of photographs, evaluated by 693 naïve Indian graders.
Both chronological and perceived ages correlated with numerous skin facial features. The strongest relationships were observed with the topographic cues and to a lesser extent, with colour/pigmentation cues, which is consistent with previous investigations [15]. Additionally, skin biophysical parameters of the skin, such as hydration, elasticity and laxity worsened with increased ageing or perceived ageing, thus complementing the colour and topographic assessments. Compared to another investigation on a Russian population with a very similar methodology [14], correlation coefficients of all wrinkles/roughness measurements with age were higher in India, suggesting more severe deterioration of these parameters throughout the ageing process versus Russian skin. Similarly to previous studies involving chronological and perceived aged relationships with skin features, most of the correlation coefficients with perceived age were generally higher than those with chronological age [21,23,27], confirming again that age perception is a critical tool for the understanding of skin ageing.
A specificity of this study, beyond the fact it was performed on an Indian population, is how critical the naïve graders panel was with regards to perceived age attribution of the recruited volunteers. Indeed, compared to investigations of the same kind performed in France, in China or Russia, volunteers’ ages were largely overestimated, as visualized on a scatterplot of perceived age versus real age, with 73% of the panel perceived older [14,21,28]. Thus, this study limitation prevented us directly comparing younger looking versus older looking volunteers, as per previous works. This large overestimation was the most striking in the 30–39 year portion of the evaluated panel, as opposed to the 60–65 year portion, and could be explained by the imprecision in giving a perceived age, due to low severities of skin facial features in the 30s. Age bias is very unlikely to be the cause since each photograph was evaluated 100 times on average by the same age distribution profile and the naïve grader panel age group was 20 to 65 years old. A possible explanation for this tough assessment may lie in the low social economic background and skin care habits of the recruited female volunteers, with only 25% of the panel reporting using a moisturizer, 15% using a sunscreen, 10% using facial cleanser and no one using anti-ageing products, according to a lifestyle questionnaire they answered when taking part in the study (data not shown). A previous study on Chinese women reported that subjects using facial moisturizer frequently looked 2.38 years younger versus those who did not, while subjects never using facial soap/cleanser looked 4.27 years older than those who frequently used them [24]. Additionally, pigmentary disorders are frequent in facial Indian skin [25] and could potentially be a key factor in this observed overestimation. Another study limitation is the geographical location of the volunteers–from the Mumbai area only–and thus not fully representing the complex diversity of the climatic conditions and ethnicities in India.
Skin facial features giving an older look varied according to the age range of the volunteers assessed. In the 30s, only skin colour parameters (L* and ITA) related to the lightness of the skin were shown to emphasize an older face. From the 40s onwards, along the lightness of the skin, four wrinkles contributed to an older perceived look: corner of the mouth, glabellar, crow’s feet and under eye wrinkles. This assessment is pretty consistent with the findings from the skin ageing self-perception in the 30s and 40s, where the graders selected crow’s feet, under eye wrinkles and skin dullness as important skin concerns and thus would have been sensitive to these features. India is a country rather obsessed with skin brightening [29], with ads for skin-related product featuring models who tend to have a fair skin [30] and our results suggests that Indian woman are sensitive to skin lightness as early as the 30s. In the 50s, a new wrinkle conveyed an older perceived look on the upper lip on top of a higher roughness on the crow’s feet and lower skin hydration on the cheek. This is quite similar to other findings on Chinese women who look older than their real age, who had lower hydration on their cheek and rougher skin on the crow’s feet, albeit the instrumentation used was different [21]. Volunteers, 60–65 years old, only had two skin features driving an older perceived age: nasolabial fold and corner of the mouth wrinkles. These parameters suggests that skin sagging takes a toll on age perception at this stage, compared to other facial features, and the big changes in skin laxity (F4) observed at 50–59 years old could prefigure this phenomenon. Many features did not hint at an older perceived look, such as redness of cheek, pore severity or uneven skin colour. It could be argued that the low concern expressed for these features by the naive graders, according to the self-declared skin ageing concerns questionnaire, was overwhelmed by bigger concerns, such as wrinkling and skill dullness in the process of the grading. Overall, in the process of attributing an age to a person, there was a shift of attention to signs of ageing from the upper part of the face (e.g., crow’s feet, under eye, glabellar wrinkles) towards the lower part of the face (e.g., upper lip wrinkles, nasolabial fold and corner of the mouth wrinkles) as assessed subjects became older. Further investigation into perceived ageing should be expanded to examine regional patterns throughout India.
5. Conclusions
Although this study enabled the establishment of relationships between various skin features and chronological ageing, it is the use of the perceived age that provided further understanding on which ageing signs hint an older appearance of an Indian woman to the eyes of other Indian women. The latter were not fixed through the ageing journey–skin brightness remained relevant in the 30s and the 40s, while from the 40s onwards, various type of wrinkles were the most recurring clues. Together, these findings unlock possibilities for more targeted and relevant skincare products for Indian younger looking skin.
Supplementary Materials
The following are available online at www.mdpi.com/2079-9284/5/1/3/s1. Table S1: List of skin ageing concerns included in the ranking question for the naïve graders. Figure S1: Skin redness severity changes across the different age subgroups. Circles represent subjects below the median of perceived age difference while triangles represent subjects above the median group. Average values (±SEM) are plotted by chronological age groups. . The statistical analysis was done using unpaired t-tests, ** p < 0.01. Figure S2: Skin biomechanical changes across the different age subgroups. Circles represent subjects below the median of perceived age difference while triangles represent subjects above the median group. Average values (±SEM) are plotted by chronological age groups for (A) skin elasticity R5 and (B) skin laxity F4. No significant differences were observed between subjects below and above the median of perceived age difference. Figure S3: Overview of skin facial features hinting an older appearance for each chronological age group. Figure S4: Percentage representation of the top three skin ageing concerns ranked first in the Self-declared skin ageing concerns questionnaire. The panel of graders was split into five age groups: 20–29, 30–39, 40–49, 50–59 and 60–65 years old.
Acknowledgments
We thank Mascot Spin Control India for the skin data collection on Indian female volunteers in Mumbai, Millward Brown Poland for the recruitment of naïve graders who did the perceived age assessment in Mumbai and Delhi. We thank the Ori-Derm team for their assistance with data analysis and the Oriflame R&D staff who supported the writing of this manuscript. This work was funded entirely by Oriflame Cosmetics. There are no conflicts of interest.
Author Contributions
Eve Merinville, Gemma Grennan and Alain Mavon designed the study; Eve Merinville, Cyril Messaraa, Carla O’Connor and Gemma Grennan analysed the data; Cyril Messaraa wrote the paper.
Conflicts of Interest
The authors declare no conflict of interest.
References
- Langlois, J.H.; Kalakanis, L.; Rubenstein, A.J.; Larson, A.; Hallam, M.; Smoot, M. Maxims or myths of beauty? A meta-analytic and theoretical review. Psychol. Bull. 2000, 126, 390–423. [Google Scholar] [CrossRef] [PubMed]
- Thornhill, R.; Grammer, K. The body and face of woman: One ornament that signals quality? Evol. Hum. Behav. 1998, 202, 105–120. [Google Scholar] [CrossRef]
- Facial Skincare China Mintel Report 2017. Available online: http://store.mintel.com/facial-skincare-china-august-2017 (accessed on 26 December 2017).
- Facial Skincare and Anti-Aging—US—Mintel Report 2017. Available online: http://store.mintel.com/us-facial-skincare-and-anti-aging-market-report (accessed on 26 December 2017).
- Glogau, R.G. Physiologic and structural changes associated with aging skin. Dermatol. Clin. 1997, 15, 555–559. [Google Scholar] [CrossRef]
- Bazin, R.; Doublet, E. Skin Aging Atlas: Volume 1, Caucasian Type; Editions Med’Com: Paris, France, 2007. [Google Scholar]
- Jackson, R. Elderly and sun-affected skin. Distinguishing between changes caused by aging and changes caused by habitual exposure to sun. Can. Fam. Phys. 2001, 47, 1236–1243. [Google Scholar]
- Flament, F.; Bazin, R.; Laquieze, S.; Rubert, V.; Simonpietri, E.; Piot, B. Effect of the sun on visible clinical signs of aging in Caucasian skin. Clin. Cosmet. Investig. Dermatol. 2013, 6, 221–232. [Google Scholar] [CrossRef] [PubMed]
- Morita, A. Tobacco smoke causes premature skin aging. J. Dermatol. Sci. 2007, 48, 169–175. [Google Scholar] [CrossRef] [PubMed]
- Hüls, A.; Vierkötter, A.; Gao, W.; Krämer, U.; Yang, Y.; Anan, D.; Stolz, S.; Matsui, M.; Kan, H.; Wang, S.; Jin, L.; Krutmann, J.; et al. Traffic related air pollution contributes to development of facial lentigines: Further epidemiological evidence from Caucasians and Asians. J. Investig. Dermatol. 2016, 136, 1–3. [Google Scholar] [CrossRef] [PubMed]
- Christensen, K.; Iachina, M.; Rexbye, H.; Tomassini, C.; Frederiksen, H.; McGue, M.; Vaupel, J.W. “Looking old for your age”: Genetics and mortality. Epidemiology 2004, 15, 251–252. [Google Scholar] [CrossRef] [PubMed]
- Christensen, K.; Thinggaard, M.; McGue, M.; Rexbye, H.; Hjelmborg, J.V.B.; Aviv, A.; Gunn, D.; Van der Ouderaa, F.; Vaupel, J.W. Perceived age as clinically useful biomarker of ageing: Cohort study. BMJ 2009, 339. [Google Scholar] [CrossRef]
- Gunn, D.; Rexbye, H.; Griffiths, C.E.M.; Murray, P.G.; Fereday, A.; Catt, S.D.; Tomlin, C.C.; Strongitharm, B.H.; Perrett, D.I.; Catt, M.; et al. Why some women look young for their age. PLoS ONE 2009, 4, e8021. [Google Scholar] [CrossRef] [PubMed] [Green Version]
- Merinville, E.; Grennan, G.Z.; Gillbro, J.M.; Mathieu, J.; Mavon, A. Influence of facial skin ageing characteristics on the perceived age in a Russian female population. Int. J. Cosmet. Sci. 2015, 37, 3–8. [Google Scholar] [CrossRef] [PubMed]
- Fink, B.; Matts, P.J. The effects of skin colour distribution and topography cues on the perception of female facial age and health. J. Eur. Acad. Dermatol. Venereol. 2008, 22, 493–498. [Google Scholar] [CrossRef] [PubMed]
- Porcheron, A.; Mauger, E.; Russell, R. Aspects of facial contrast decrease with age and are cues for age perception. PLoS ONE 2013, 8, e57985. [Google Scholar] [CrossRef] [PubMed]
- De Rigal, J.; Des Mazis, I.; Diridollou, S.; Querleux, B.; Yang, G.; Leroy, F.; Barbosa, V.H. The effect of age on skin color and color heterogeneity in four ethnic groups. Skin Res. Technol. 2010, 16, 168–178. [Google Scholar] [CrossRef] [PubMed]
- Noveau-Richard, S.; Yang, Z.; Mac-Mary, S.; Li, L.; Bastien, P.; Tardy, I.; Bouillon, C.; Humbert, P.; de Lacharrière, O. Skin Ageing: A comparison between Chinese and European populations. J. Dermatol. Sci. 2015, 40, 187–193. [Google Scholar] [CrossRef] [PubMed]
- Muizzuddin, N.; Hellemans, L.; Van Overloop, L.; Corstjens, H.; Declercq, L.; Maes, D. Structural and functional differences in barrier properties of African American, Caucasian and East Asian skin. J. Dermatol. Sci. 2010, 59, 123–128. [Google Scholar] [CrossRef] [PubMed]
- Hellemans, L.; Muizzuddin, N.; Declercq, L.; Maes, D. Characterization of stratum corneum properties in human subjects from a different genetic background. J. Investig. Dermatol. 2005, 124, A62. [Google Scholar]
- Mayes, A.E.; Murray, P.G.; Gunn, D.A.; Tomlin, C.C.; Catt, S.D.; Wen, Y.B.; Zhou, L.P.; Wang, H.Q.; Catt, M.; Granger, S.P. Ageing appearance in China: biophysical profile of facial skin and its relationship to perceived age. J. Eur. Acad. Dermatol. Venereol. 2010, 24, 341–348. [Google Scholar] [CrossRef] [PubMed]
- Porcheron, A.; Latreille, J.; Jdid, R.; Tschachler, E.; Morizot, F. Influence of skin ageing features on Chinese women’s perception of facial age and attractiveness. Int. J. Cosmet. Sci. 2014, 36, 312–320. [Google Scholar] [CrossRef] [PubMed]
- Flament, F.; Bazin, R.; Ye, C.; Laquieze, S.; Rubert, V.; Decroux, A.; Simonpietri, E.; Piot, B. Solar exposure (s) and facial clinical signs of aging in Chinese women: Impacts upon age perception. Clin. Cosmet. Investig. Dermatol. 2015, 8, 75–84. [Google Scholar] [CrossRef] [PubMed]
- Mayes, A.E.; Murray, P.G.; Gunn, D.A.; Tomlin, C.C.; Catt, S.D.; Wen, Y.B.; Zhou, L.P.; Wang, H.Q.; Catt, M.; Granger, S.P. Environmental and lifestyle factors associated with perceived facial age in Chinese women. PLoS ONE 2010, 5, e15270. [Google Scholar] [CrossRef] [PubMed]
- Hourblin, V.; Nouveau, S.; Roy, N.; de Lacharriere, O. Skin complexion and pigmentary disorders in facial skin of 1204 women in 4 Indian cities. Indian J. Dermatol. Venereol. Leprol. 2014, 80, 395–401. [Google Scholar] [CrossRef] [PubMed]
- Bernois, A.; Huber, A.; Derome, C.; Drouault, Y.; de Quéral, D.; Schnebert, S.; Perrier, E.; Heusèle, C. A photographic scale for the evaluation of facial skin aging in Indian women. Eur. J. Dermatol. 2011, 21, 700–704. [Google Scholar] [PubMed]
- Arce-Lopera, C.; Igarashi, T.; Nakao, K.; Okajima, K. Image statistics on the age perception of human skin. Skin Res. Technol. 2013, 19, 273–278. [Google Scholar] [CrossRef] [PubMed]
- Nkengne, A.; Bertin, C.; Stamatas, G.N.; Giron, A.; Rossi, A.; Issachar, N.; Fertil, B. Influence of facial skin attributes on the perceived age of Caucasian women. J. Eur. Acad. Dermatol. Venereol. 2008, 22, 982–991. [Google Scholar] [CrossRef] [PubMed]
- Verma, S.B. Obsession with light skin–shedding some light on use of skin lightening products in India. Int. J. Dermatol. 2010, 49, 464–465. [Google Scholar] [CrossRef] [PubMed]
- Li, E.P.H.; Min, H.J.; Belk, R.W.; Kimura, J.; Bahl, S. Skin lightening and beauty in four Asian cultures. Adv. Consum. Res. 2008, 35, 444–449. [Google Scholar]
Figure 1.
Scatterplot of volunteers’ ages on the X axis versus the age difference (real—perceived age) on the Y axis. Volunteers were perceived older than their real age when above the dotted line and younger when below the dotted line.
Figure 1.
Scatterplot of volunteers’ ages on the X axis versus the age difference (real—perceived age) on the Y axis. Volunteers were perceived older than their real age when above the dotted line and younger when below the dotted line.
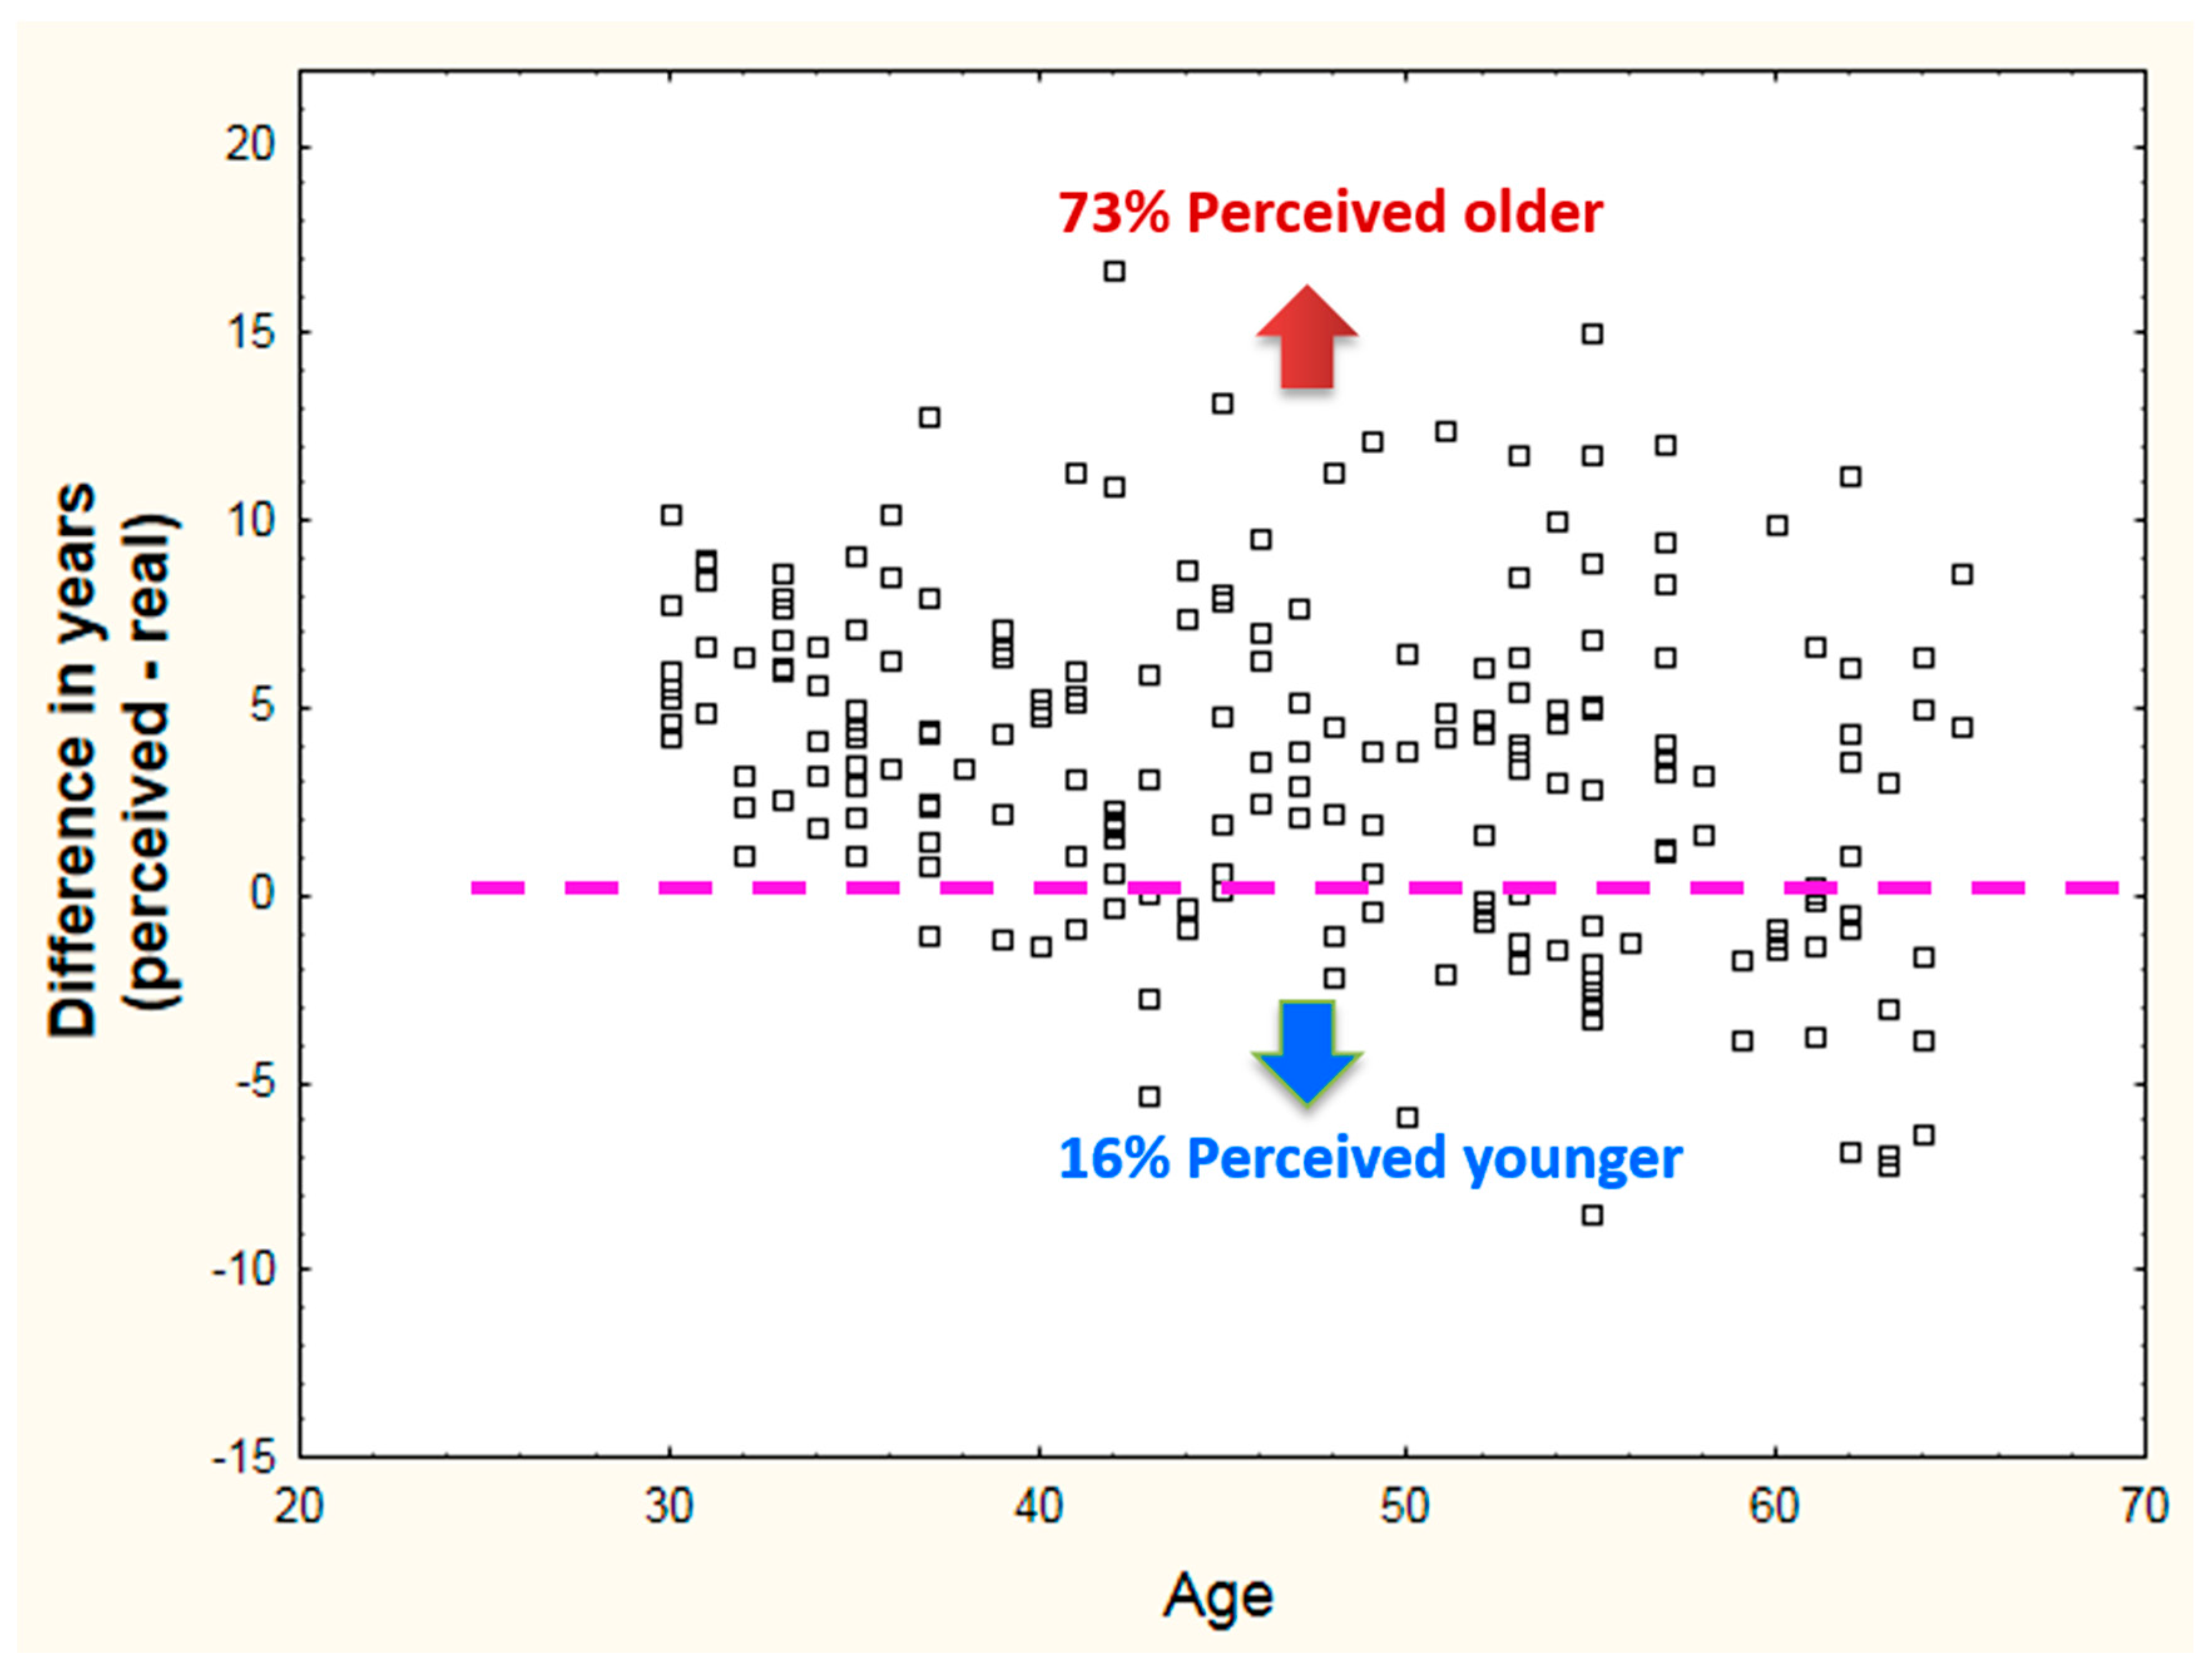
Figure 2.
Box-plot of the median perceived age minus real age for each age subgroup (30–39, 40–49, 50–59 and 60–65 years old). Starred bars indicate medians that were statistically different from each other (Kruskal–Wallis ANOVA, * p < 0.05, p *** < 0.001).
Figure 2.
Box-plot of the median perceived age minus real age for each age subgroup (30–39, 40–49, 50–59 and 60–65 years old). Starred bars indicate medians that were statistically different from each other (Kruskal–Wallis ANOVA, * p < 0.05, p *** < 0.001).

Figure 3.
Scatterplot of volunteers’ ages on the X axis versus the age difference (real—perceived age) on the Y axis for each age subgroups (30–39, 40–49, 50–59 and 60–65 years) with their respective median age difference (dotted line).
Figure 3.
Scatterplot of volunteers’ ages on the X axis versus the age difference (real—perceived age) on the Y axis for each age subgroups (30–39, 40–49, 50–59 and 60–65 years) with their respective median age difference (dotted line).

Figure 4.
Skin facial features contributing to an older perceived look from the 30s onwards. Circles represent subjects below the median perceived age difference, while triangles represent subjects above the median group. Average values (±SEM) are plotted by chronological age groups for (A) skin brightness (L*) and (B) individual typology angle (ITA). The statistical analysis was done using unpaired t-tests, * p < 0.05.

Figure 5.
Skin facial features contributing to an older perceived look from the 40s onwards. Circles represent subjects below the median perceived age difference, while triangles represent subjects above the median group. Average values (±SEM) are plotted by chronological age groups for (A) glabellar wrinkle depth, (B) crow’s feet wrinkle depth, (C) corner of the mouth wrinkles and (D) upper eye wrinkle depth. The statistical analysis was done using unpaired t-tests, * p < 0.05, ** p < 0.01.

Figure 6.
Skin facial features contributing to an older perceived look from the 50s or the 60s onwards. Circles represent subjects below the median perceived age difference while triangles represent subjects above the median group. Average values (±SEM) are plotted by chronological age groups for (A) crow’s feet roughness SR; (B) skin hydration; (C) upper lip wrinkles and (D) nasolabial wrinkle depth. The statistical analysis was done using unpaired t-tests, * p < 0.05, ** p < 0.01, *** p < 0.001.

Table 1.
List of facial attributes measured from photographs, probes and fringe projection on replicas, according to their category.
Table 1.
List of facial attributes measured from photographs, probes and fringe projection on replicas, according to their category.
| Technique/Instrument | Feature measured | Category |
|---|---|---|
| Expert grading on photo | Crow’s feet wrinkle depth | Wrinkle/texture |
| Expert grading on photo | Number of crow’s feet wrinkles | |
| Expert grading on photo | Nasolabial wrinkle depth | |
| Expert grading on photo | Upper lip wrinkle depth | |
| Expert grading on photo | Corner of the mouth wrinkle Depth | |
| Expert grading on photo | Glabellar wrinkle depth | |
| Expert grading on photo | Under eye wrinkle depth | |
| Expert grading on photo | Forehead wrinkle depth | |
| DermaTOP on replica | Skin roughness on the crow’s Feet Area (SR) | |
| Visia CA software | Overall skin roughness | |
| Visia CA software | Pore severity | |
| Visia CA software | Number of localised red areas | Skin Colour |
| Visia CA software | Severity of localised red areas | |
| Visia CA software | Number of brown spots | |
| Visia CA software | Severity of brown spots | |
| Visia CA software | UV spots number | |
| Visia CA software | Severity of UV spots | |
| Chromameter | Skin brightness (L*) | |
| Image Pro Plus on photo | Under eye dark circle severity | |
| Chromameter | Skin sallowness (b*) | |
| Image Pro Plus on photo | Skin colour intensity (C) | |
| Chromameter | Skin Colour (ITAº) | |
| Chromameter | Cheek redness (a*) | |
| Image Pro Plus on photo | Facial colour unevenness | |
| Corneometer | Skin hydration | Biophysical |
| Sebumeter | Skin oiliness | |
| Cutometer | Skin elasticity (R5) | |
| Cutometer | Skin laxity (F4) |
Table 2.
List of facial wrinkles and texture-related feature measures and their correlation with both chronological and perceived age. Significant correlations are highlighted in colour—blue for positive correlations or orange for negative correlations. A darker the colour indicates a stronger correlation.
| Feature | Chronological Age Pearson Coefficient (p-Value) | Perceived Age Pearson Coefficient (p-Value) |
|---|---|---|
| Crow's feet wrinkle depth | 0.750 (p < 0.001) | 0.773 (p < 0.001) |
| Number of crow's feet wrinkles | 0.541 (p < 0.0001) | 0.568 (p < 0.0001) |
| Nasolabial fold wrinkle depth | 0.765 (p < 0.001) | 0.795 (p < 0.001) |
| Upper lip wrinkle depth | 0.707 (p < 0.001) | 0.740 (p < 0.001) |
| Forehead wrinkle depth | 0.626 (p < 0.001) | 0.675 (p < 0.001) |
| Glabellar wrinkle depth | 0.735 (p < 0.001) | 0.794 (p < 0.001) |
| Under eye wrinkle depth | 0.773 (p < 0.001) | 0.797 (p < 0.001) |
| Corner of the mouth wrinkle depth | 0.665 (p < 0.001) | 0.691 (p < 0.001) |
| Roughness of the crow’s feet area | 0.769 (p < 0.001) | 0.815 (p < 0.001) |
| Overall skin roughness | 0.472 (p < 0.0001) | 0.511 (p < 0.0001) |
| Severity of pores | 0.311 (p < 0.0001) | 0.288 (p < 0.0001) |
| Colour Code for Correlation Strength and Direction | ||
| r < 0.4 | 0.4 < r < 0.7 | r ≥ 0.7 |
| r < −0.4 | −0.4 < r < −0.7 | r ≥ −0.7 |
Table 3.
List of facial features related to skin colour and pigmentation and their correlation with both chronological and perceived ages. Significant correlations are highlighted in colour–blue for positive correlations or orange for negative correlations. A darker colour indicates a stronger correlation.
| Feature | Chronological Age Pearson Coefficient (p-Value) | Perceived Age Pearson Coefficient (p-Value) |
|---|---|---|
| UV spot number | 0.263 (p < 0.0001) | 0.191 (p < 0.01) |
| Severity of UV spots | 0.445 (p < 0.0001) | 0.463 (p < 0.0001) |
| Number of brown spots | 0.313 (p < 0.0001) | 0.328 (p < 0.0001) |
| Severity of brown spots | 0.316 (p < 0.0001) | 0.48 (p < 0.0001) |
| Number of localised red areas | 0.509 (p < 0.0001) | 0.477 (p < 0.0001) |
| Severity of localised redness | 0.550 (p < 0.0001) | 0.592 (p < 0.001) |
| Skin brightness | −0.186 (p < 0.01) | −0.257 (p < 0.0001) |
| Skin sallowness | −0.412 (p < 0.0001) | −0.409 (p < 0.0001) |
| Skin colour (ITA) | −0.181 (p < 0.05) | −0.253 (p < 0.0001) |
| Cheek redness | −0.008 (p = 0.905) | −0.014 (p = 0.839) |
| Facial colour unevenness | 0.117 (p = 0.098) | 0.075 (p = 0.287) |
| Under eye dark circles | 0.068 (p = 0.335) | 0.056 (p = 0.432) |
| Colour intensity | −0.164 (p < 0.05) | −0.213 (p < 0.01) |
| Colour Code for Correlation Strength and Direction | ||
| r < 0.4 | 0.4 < r < 0.7 | r ≥ 0.7 |
| r < −0.4 | −0.4 < r < −0.7 | r ≥ −0.7 |
Table 4.
List of facial features related to skin biophysical properties and their correlation with both chronological and perceived ages. Significant correlations are highlighted in colour–blue for positive correlations or orange for negative correlations. A darker colour indicates a stronger correlation.
| Feature | Chronological Age Pearson Coefficient (p-Value) | Perceived Age Pearson Coefficient (p-Value) |
|---|---|---|
| Skin hydration | −0.408 (p < 0.0001) | −0.486 (p < 0.0001) |
| Skin oiliness | −0.044 (p = 0.530) | −0.05 (p = 0.481) |
| Skin elasticity (R5) | −0.630 (p < 0.001) | −0.618 (p < 0.001) |
| Skin laxity (F4) | 0.315 (p < 0.0001) | 0.298 (p < 0.0001) |
| Colour Code for Correlation Strength and Direction | ||
| r < 0.4 | 0.4 < r < 0.7 | r ≥ 0.7 |
| r < −0.4 | −0.4 < r < −0.7 | r ≥ −0.7 |
Table 5.
List of facial features related to skin biophysical properties and their correlation with both chronological and perceived ages. Significant correlations are highlighted in colour–blue for positive correlations or orange for negative correlations. A darker colour indicates a stronger correlation.
| Chronological Age Groups | 30–39 | 40–49 | 50–59 | 60–65 |
|---|---|---|---|---|
| Median age difference (perceived–real) | 4.92 years | 3.40 years | 3.73 years | −0.15 years |
| Younger group—volunteers below median age difference (N) | 29 | 29 | 28 | 15 |
| Older group—volunteers above median age difference (N) | 29 | 29 | 29 | 14 |
© 2017 by the authors. Licensee MDPI, Basel, Switzerland. This article is an open access article distributed under the terms and conditions of the Creative Commons Attribution (CC BY) license (http://creativecommons.org/licenses/by/4.0/).
Share and Cite
MDPI and ACS Style
Merinville, E.; Messaraa, C.; O’Connor, C.; Grennan, G.; Mavon, A. What Makes Indian Women Look Older—An Exploratory Study on Facial Skin Features. Cosmetics 2018, 5, 3. https://doi.org/10.3390/cosmetics5010003
AMA Style
Merinville E, Messaraa C, O’Connor C, Grennan G, Mavon A. What Makes Indian Women Look Older—An Exploratory Study on Facial Skin Features. Cosmetics. 2018; 5(1):3. https://doi.org/10.3390/cosmetics5010003
Chicago/Turabian StyleMerinville, Eve, Cyril Messaraa, Carla O’Connor, Gemma Grennan, and Alain Mavon. 2018. "What Makes Indian Women Look Older—An Exploratory Study on Facial Skin Features" Cosmetics 5, no. 1: 3. https://doi.org/10.3390/cosmetics5010003
Note that from the first issue of 2016, this journal uses article numbers instead of page numbers. See further details here.