
Modelling and Optimization of Multi-Service Optical Switching Networks with Threshold Management Mechanisms


1
Faculty of Computing and Telecommunications, Institute of Communication and Computer Networks, Poznan University of Technology, ul. Polanka 3, 60-965 Poznań, Poland
2
Faculty of Electrical and Information Engineering, Institute of Microwave and Photonic Engineering, Graz University of Technology, Inffeldgasse 12/I, A-8010 Graz, Austria
*
Author to whom correspondence should be addressed.
Electronics 2021, 10(13), 1515; https://doi.org/10.3390/electronics10131515
Submission received: 27 May 2021
/
Revised: 19 June 2021
/
Accepted: 21 June 2021
/
Published: 23 June 2021
(This article belongs to the Special Issue Telecommunication Networks)
Abstract
:DWDM networks make use of optical switching networks that allow light waves of multiple lengths to be serviced and provide the possibility of converting them appropriately. Research work on optical switching networks focuses on two main areas of interest: new non-blocking structures for optical switching networks and finding traffic characteristics of switching networks of the structures that are already well known. In practical design of switching nodes in optical networks, in many cases, the Clos switching networks are successfully used. Clos switching networks are also used in Elastic Optical Networks that can effectively manage allocation of resources to individual multi-service traffic streams. The research outcomes presented in this article deal with the problems of finding traffic characteristics in blocking optical switching networks with known structures. This article aims at presenting an analysis of the influence of traffic management threshold mechanisms on the traffic characteristics of multi-service blocking Clos switching networks that are used in the nodes of elastic optical networks as well as their influence on the traffic efficiency of network nodes. The analysis was carried out on the basis of research studies performed in a specially dedicated purpose-made simulation environment. The article presents a description of the simulation environment used in the experiments. The study was focused on the influence of the threshold mechanism, which is one of the most commonly used and elastic traffic management mechanisms, and on the traffic characteristics of switching networks that service different mixtures of multi-service Erlang, Engset and Pascal traffic streams. The conducted study validates the operational effectiveness and practicality of the application of the threshold mechanism to model traffic characteristics of nodes in an elastic optical network.
1. Introduction
For a long time, we have seen an increase in the amount and variety of network services, accompanied by an increase in the need for bitrate and the ever-increasing number of devices. New devices in the data transmission network pose new challenges and necessitate fulfilling new requirements in telecommunications networks. In order to meet the requirements, it is necessary to not only increase the bitrate of telecommunications links but also, to a growing degree, to provide the possibility to diversify service quality for various traffic classes in telecommunications nodes.
Rapid development of access and backbone optical networks has created a situation in which they have become the basic solutions that can simultaneously offer alike resource management mechanisms with high variability of service quality and high bitrates. Presently, and concurrently with the development of systems based on Dense Wavelength-Division Multiplexing (DWDM) technology, telecommunications optical networks of the next generation are the subject of intense research and interest in a large number of research centres and the subject of a large number of publications [1,2].
Optical networks technology provides the possibility to increase the transmission speed up to 100 and 400 Gbps, or even 1 Tbps. This opportunity for effective use of high network bitrates for the network users’ necessity with different demands, much lower than the capacity of the network, can be successfully fulfilled by the execution of the elastic optical networks (EONs) concept [3], i.e., networks that offer the possibility to allocate resources elastically from a shared resource pool to different optical paths.
It is then necessary for DWDM networks to deploy optical switching networks that would be capable of converting and transmitting optical signals over various lengths of light waves. Research studies on optical switching networks primarily deal with the following two main areas: development of new non-blocking structures for optical switching networks [4] and designation of characteristics for switching networks from the point of view traffic loadability with already-known structures. The construction of non-blocking networks involves either a high number of switching points or complex algorithms to control connection setups. Apparently, however, optical Clos switching networks, primarily three-stage networks, can in many cases be successfully used to construct switching nodes [5,6]. These networks are also used in the case of EONs that provide effective management of resource allocation to individual multi-service traffic streams. The study presented in this article concerns the issues related to the designation of characteristics describing blocking of optical networks with known structure from the point of view of traffic loadability of the network.
This article aims to analyze and discuss the influence of threshold traffic management mechanisms on traffic characteristics describing multi-service blocking switching networks with Clos structure used in the nodes of EONs and their influence on the traffic loadability of network nodes. The rest of the article is structured as follows. Section 2 presents the concept of Elastic Optical Networks. The next section includes a description of the structure of the blocking switching network in which threshold mechanisms for traffic management have been introduced. The section discusses the traffic structure (Section 3.1), the operation of the threshold mechanism (Section 3.2) and the corresponding path choice algorithm (Section 3.3). Section 4 is devoted to the simulation environment. It includes a presentation and description of the input data for the simulator (Section 4.1), simulation algorithm (Section 4.2) and the simulation termination condition (Section 4.3), among others. Section 5 presents exemplary results of the simulation studies, along with their interpretation. The article ends with the Conclusions (Section 6), which presents the most important conclusions resulting from the study carried out.
2. Elastic Optical Networks
The DWDM technology uses mainly the conventional transmission optical band (C-band, form 1530 to 1565 nm) and long-wavelength transmission optical band (L-band, from 1565 to 1625 nm), it is caused by the low attenuation of the optical signal in these bands. The frequencies used in DWDM are presented in the so-called a frequency grid defined by ITU-T in the recommendation G.694.1 [7]. Based on this standard, we can use the fixed or flexible frequency grid in relation to the application needs. Flexible GRID give the occasion of elastic allocation of network resources (the so-called frequency slot unit—FSU) of the channel bandwidth to different optical paths. The idea of the flexible GRID is the basic concept used in the EONs. When creating elastic frequency grid ITU-T [7], it is assumed that bandwidths of a particular optical channel are allocated depending on nominal values of mid-band frequency and channel bandwidth . The channel bandwidth is calculated as the multiplicity of 12.5 GHz:
In Equation (1), m is a positive integer number, and 12.5 GHz is the FSU [4]. The mid-band frequency of given channels can be calculated based on the following formula:
In (2), parameter n is integer number and 0.00625 is the continuous frequency shift (in THz). Each combination of channels is viable, provided they do not overlap. The main advantage of the application of the elastic GRID is the provision of the application of different transmission speeds.
If we know the structure of switching networks used in elastic optical networks and the number of FSUs required by particular traffic streams, then we are prepared for the analysis of optical switching networks. If we additionally assume that FSU in optical switching networks can be treated such as the Allocation Unit in electronic switching networks [8,9], then in the modeling of optical switching networks, we can use the methods elaborated for multi-service switching networks [10].
3. Structure of the Switching Network with Introduced Threshold Mechanisms
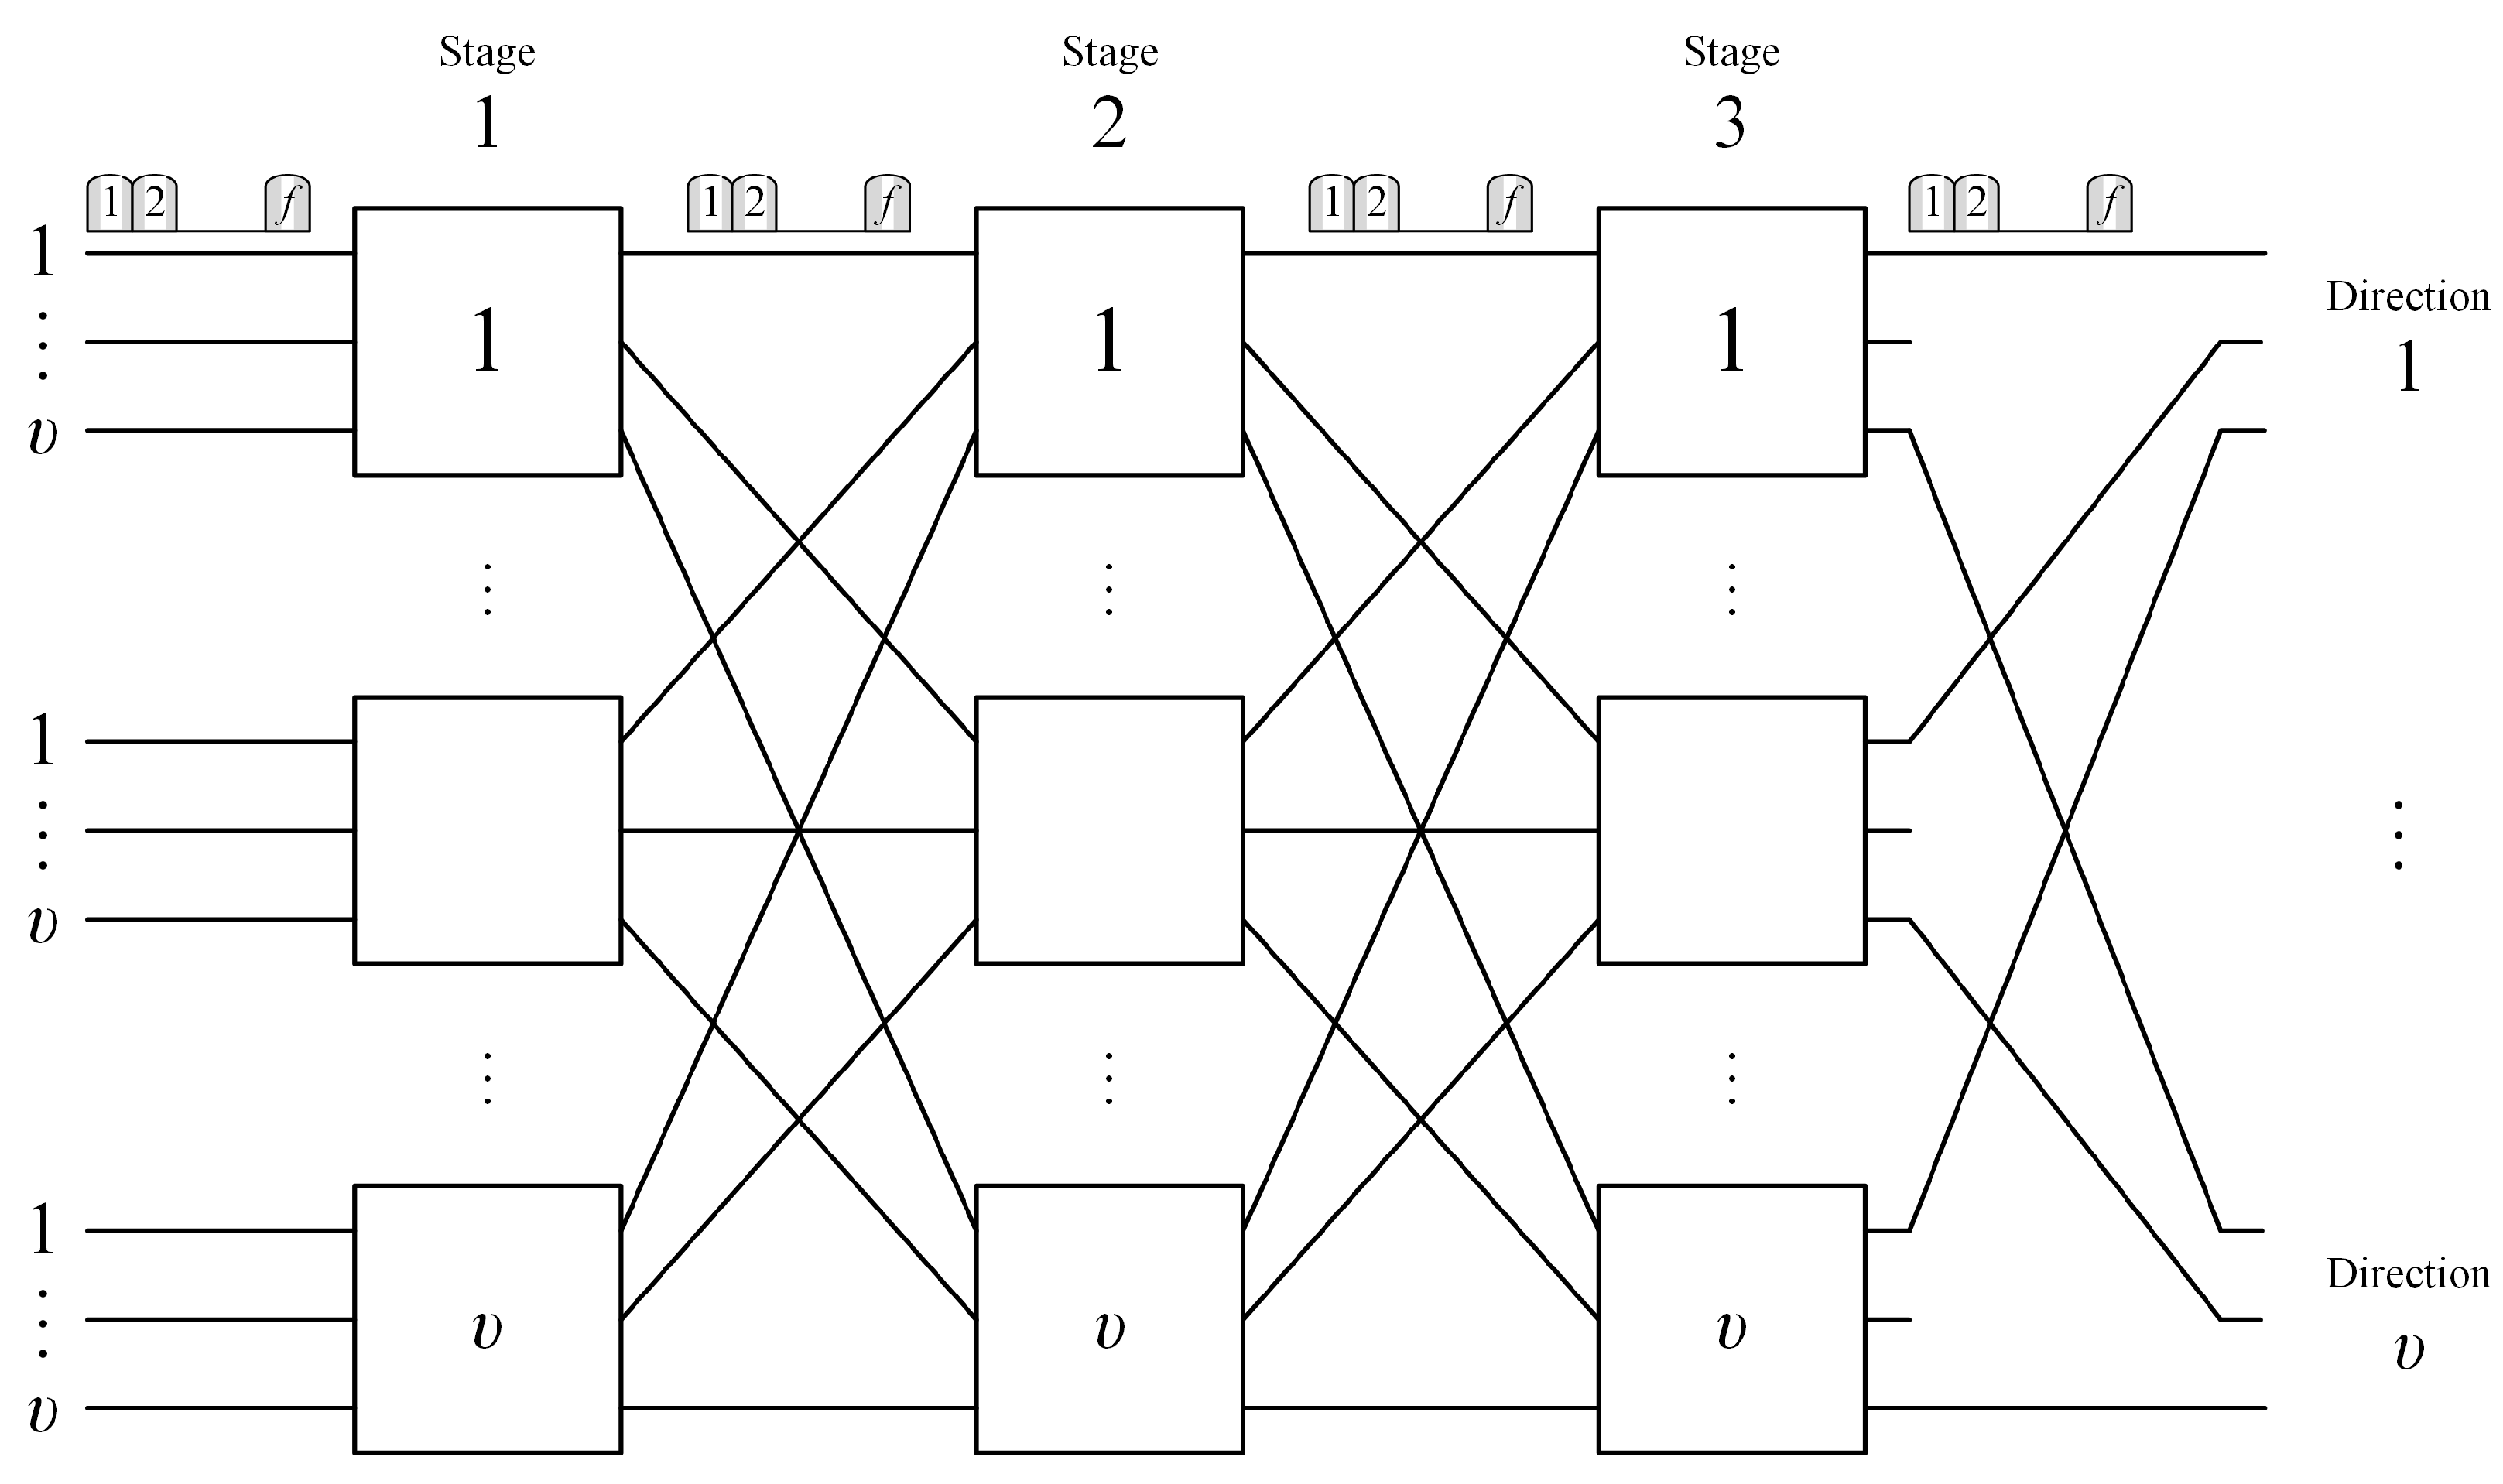
The three-stage Clos optical switching fabric (Figure 1) used in the nodes of EONs is built from switches. The capacity of a single link of a switching fabric is equal to f FSUs. Additionally, each one link of the given last stage switch belongs to one of outgoing directions. (A more extensive description of the structure of the Clos switching network can be found, for example, in [11,12].)
In the network under consideration, the most popular and elastic call admission control (CAC) mechanism, i.e., the threshold mechanism, is used to manage traffic. The threshold mechanisms, on the basis of which a decision on whether a new call (request) will be accepted for service or not is made, as well as on the number of allocated FSUs, were implemented (introduced) in the output directions. The algorithm that executes the procedure for the admittance of a new call monitors the occupancy level in a given output direction (the output direction demanded by a new call) and makes a decision on the number of the FSUs to be specifically allocated. If the occupancy level in a given output direction exceeds the set threshold value, this means that this call can be admitted for service with a decreased number of FSUs only. The threshold value is defined on the basis of the introduced value of the threshold area, expressed as the percentage of the capacity of a given output direction.
The assumption in the network was that switches of the first and the last stage allowed both the frequency slot (wave length) and the switch output (optical fiber) to be changed. Another assumption was that the switches of the middle stage could only perform a change in the outgoing optical fiber. This means that for a switch of the second stage, any changes in the channel frequency are not possible.
Further on in this Section, the call streams offered to the network (Section 3.1), the principle of operation of threshold mechanisms in EONs (Section 3.2), and the algorithm to control connection setup in the network (Section 3.3) are presented.
3.1. Call Streams Offered to the Switching Fabric
In principle, all services offered to multi-service switching networks can be modelled at the call (or stream) level by Erlang, Engset and Pascal call streams [13]. Therefore, the assumption in our study was that the switching fabric was offered three types of traffic streams:
- Erlang call streams, where each class is defined by the intensity parameter for the arrival of new calls and the number of FSUs required to set up a connection (in this article, index i specifies Erlang’s traffic class, index j any Engset traffic class and index k any Pascal traffic class, whereas the index c defines any traffic class, regardless of the traffic stream type);
- Engset call streams, where each class is determined by intensity of the arrival of new calls generated by a single source , the number of traffic sources , and the number of FSUs required for a call to be set up,
- Pascal call streams, where the intensity of the arrival of new calls , the number of traffic sources and the number of FSUs demanded for a new call to be set up are defined.
In the case of different types of traffic streams, the intensity of a new call arrival shows a different dependence in relation to the current load of the system. The intensity of new Erlang call arrival does not depend on the occupancy state of the system. In the case of Engset traffic stream, the value of the intensity parameter is inversely proportional to the occupancy state of the system. In contrast, new Pascal calls appear more frequently as the system load increases. In the case of all call classes of any type, the parameter of the exponential distribution of the service time is also determined, where m is the sum of all call classes of any type ().
3.2. Threshold Mechanisms in the Switching Network
The essential feature of the threshold mechanism introduced to the network is the management of the admission of new calls by way of limiting the number of FSUs allocated to them, based on the current occupancy state of the system. The lower the load, the higher the number of allocated FSUs, while the changes in the number of allocated FSUs occur in jumps and depend on the threshold (level) of the load in the system [14]. The introduced threshold mechanism defines the size of individual threshold areas as the percentage value of the total capacity of the output direction. The threshold mechanism is introduced to a given set of traffic classes that is a sub-set of all call classes offered to the switching fabric.
Each class c, which belongs to the set , is defined by the set of threshold values written in the following form: , where the index c of each of the elements defines the number of a call class, whereas the second index defines the number of a threshold and specifies the number of thresholds defined for class c. The assumption is also that there is the following dependence between the introduced values of the thresholds: .
Each threshold area is limited by a pair of values, where in the case of class c belonging to the set , the threshold area q is limited by the values and . Additionally, in the threshold area q, a set of parameters is also defined, which satisfy the following dependencies and . This means that the number of allocated FSUs to calls of individual traffic classes is inversely proportional to the current load of the system. When it comes to the average service time of calls of individual traffic classes, it may increase (elastic services) with increasing system load or remain constant (adaptive services). In the case of decreasing the load of the system, we observe the opposite situation.
3.3. Connection Path Choice Algorithms in the Network
This section discusses the basic algorithms used to control the switching network, i.e., the relevant path choice algorithms. The assumption in the simulation environment was that there would be two path selection algorithms used in the switching fabric: the point-to-group (Figure 2) and point-to-point (Figure 3) algorithms. Before the commencement of the simulation experiment, either of the above path-selection algorithms in the switching fabric should be selected.
Path-choice algorithms make it possible to find those elements of the network that have the required resources to service a new call that has arrived at the input to the network. When there is no possibility of finding free resources in the links outgoing from the network, this is followed by external blocking, whereas when resources necessary to set up a connection path in the network cannot be found, this is followed by internal blocking. Therefore, one can distinguish two causes of blocking in the network, internal and external.
4. Simulation Environment
The EON simulator with threshold mechanisms was implemented using the C++ language and the object-oriented programming technique. To develop the simulation model, the process interaction method was used [15]. The developed simulator is capable of determining the loss probability values for particular traffic classes in optical switching networks with point-to-point and point-to-group selection, in which threshold mechanisms have been implemented in outgoing directions. The input data for the simulation program are read from a text file. The results obtained using the simulation program, at the end of its operation, are written to a file. The developed simulation program in the future can be used to verify analytical models that will enable the determination of the traffic characteristics of switching networks with threshold mechanisms typically in the nodes of EON networks. In the immediate future, the present authors intend to develop and publish these methods.
The description of the simulation environment is divided into three parts. The first part discusses the parameters used in the simulation experiment as input data of the simulation process. The next part presents the basic simulation algorithm. The description is concluded with a discussion on the conditions for the simulation experiment to be terminated that decide on the accuracy level of obtained results.
4.1. Input Data
As input data to the simulation program, the structure of the switching network and the capacity of individual links are given. Each traffic class is defined by: the number of demanded FSUs, the value of mean service time, the number of Engset traffic sources, and the number of Pascal traffic sources. Furthermore, a value of a is specified, which is numerically equal to the traffic value offered to a single FSU.
In order to conduct simulation experiments of the switching network built of the switches, in which the capacity of each single link is f FSUs, the following parameters should be given:
- The number of Erlang call streams (classes),
- The number of Engset call streams (classes),
- The number of Pascal call streams (classes),
- The set of call streams for which the threshold mechanism is introduced,
- The number of required FSUs necessary to set up a new connection for calls of class c in a given threshold area q and the average service time for class c calls,
- The number of Engset, Pascal traffic sources.
Based on the values of the above-mentioned parameters, the intensity parameters , and of calls generated by the sources of Erlang, Engset and Pascal traffic stream, respectively, are determined in the simulation program:
The parameters , and , determined on the basis of Formula (3), are treated as the parameters of the exponential distribution that describes the process of new call arrival of calls of individual traffic classes.
4.2. General Simulation Algorithm
The algorithm shown in Figure 4 has been implemented in the simulation program. In the simulation algorithm, two events (arrival of a new call and termination of call service) were defined.
When considering a system that is offered different types of call streams ( Erlang call classes, Engset call classes and Pascal call classes), it is necessary to define and implement functions that handle events arrival of a new call and termination of call service. Functions implementing event handling for calls of Erlang, Engset and Pascal traffic classes, respectively, have been described in detail in [16]. When using the functions described in [16], it is taken into account that class c requires FSUs to set up a new connection. The value of depends on the occupancy state (threshold area q) that the system is currently in.
4.3. Condition for Simulation Termination
The simulation end condition is, with a determination of loss probabilities, determined based on the number of the least active class reports generated (generally, it is the class with the lowest value of the intensity parameter). The average of the results is calculated on the basis of the data obtained from five simulation series. In order to obtain 95% confidence intervals not exceeding 5% of the mean value of the results, the simulator must generate at least 10,000,000 calls of the class with the lowest intensity of appearance of new calls.
The confidence intervals are calculated using the following formula:
where is the mean value of d results (simulation courses), and is the value of the t-Student distribution for degrees of freedom. The parameter determining the standard deviation is calculated using the following formula:
where is the result obtained in the s-th simulation run.
5. Numerical Results
The developed simulation program enables simulation tests of optical switching fabrics with the Clos structure, in which each switch can have any number of inputs/outputs and any number of switches in each stage (the number of switches in each section should be the same).
Not only the required transmission speed but also the modulation technique used have an impact on the number of requested FSUs by the calls of particular traffic classes. Based on the data presented in [17], Table 1 shows the dependence of the number of requested FSUs on the required transmission speed and the modulation technique used.
The loss probability results presented in the graphs depending on the traffic value offered to a single FSU were obtained for the following systems:
- System 1:
- -
- Offered traffic: , , FSUs, , , FSUs, , , , , FSUs, , FSUs, , ,
- -
- Network structure: , , FSU,
- -
- Selection algorithm: point-to-group.
- -
- Calue of threshold: of system capacity.
- System 2:
- -
- Offered traffic: , , FSUs, , FSUs, , , FSUs, , , , , FSUs, , FSUs, , FSUs, , ,
- -
- Network structure: , , FSUs,
- -
- Selection algorithm: point-to-group.
- -
- Values of thresholds: , of system capacity.
- System 3:
- -
- Offered traffic: , , FSUs, , , FSUs, , , , , FSUs, , FSUs, , ,
- -
- Network structure: , , FSUs.
- -
- Selection algorithm: point-to-point.
- -
- Value of threshold: of system capacity.
The results of the simulation experiments are presented in the form of graphs with confidence intervals that were determined on the basis of the t-Student distribution (with a 95 percent confidence level) for five simulation series, in the function of traffic offered to a single FSU (Figure 5, Figure 6, Figure 7, Figure 8, Figure 9, Figure 10, Figure 11, Figure 12, Figure 13, Figure 14, Figure 15, Figure 16, Figure 17, Figure 18, Figure 19, Figure 20, Figure 21 and Figure 22) or in the function of the size of the threshold area (Figure 23, Figure 24 and Figure 25). The duration of each simulation series was determined based on the time needed to generate 10,000,000 calls of class with the lowest intensity. The exemplary duration times for individual experiments are presented in Table 2.
The duration of each simulation series was determined based on the time needed to generate.
The exemplary duration times of individual experiments are given in Table 2. The results apply to the total length of time of one simulation series in relation to the number of calls of the least active class required for the simulation run to terminate. The simulations were run on a server platform with Intel Xeon X5670 processor and 32GB RAM memory.
The ensuing analysis of the graphs shown in Figure 5, Figure 6, Figure 7, Figure 8, Figure 9, Figure 10, Figure 11, Figure 12, Figure 13, Figure 14, Figure 15, Figure 16, Figure 17, Figure 18, Figure 19, Figure 20, Figure 21, Figure 22, Figure 23, Figure 24 and Figure 25 leads to the following conclusions:
- A comparison of the values of the loss probabilities for calls of individual traffic classes in the systems without threshold mechanisms (Figure 5, Figure 6, Figure 7, Figure 8, Figure 9, Figure 10, Figure 11, Figure 12 and Figure 13) with the values of the loss probability in the systems with introduced threshold mechanisms (Figure 14, Figure 15, Figure 16, Figure 17, Figure 18, Figure 19, Figure 20, Figure 21 and Figure 22) shows that the values of the loss probability for the calls to which the threshold mechanism was introduced decrease (class 3—Systems 1 and 3, and classes 3 and 4—System 2), whereas the values of the loss probability of the calls to which the threshold mechanism was not introduced increase.
- From the analysis of the graphs presented in Figure 23, Figure 24 and Figure 25, it can be observed that from a certain size of the threshold area, there are no changes in the loss probability for the calls of individual classes. This means that for a defined value of traffic, an appropriate minimum size of the threshold area for which we can obtain the desired changes in the loss probability can be matched.
6. Concluding Remarks
This article presents the results of a study that fits into the current body of research on the determination of traffic characteristics of blocking optical networks with known structures. The results presented in the article make it possible to analyse the influence of threshold mechanisms in traffic management on the traffic characteristics of multi-service blocking Clos switching fabrics used in the nodes of EONs and their influence on traffic efficiency of network nodes. The present investigations carried out by the authors focused on the influence of the threshold mechanism, one of the most commonly mechanisms used and elastic traffic management, on the traffic characteristics of switching networks that service different mixtures of multi-service Erlang, Engset and Pascal traffic streams. The present study confirms the practical applicability of the proposed threshold mechanism in modelling traffic characteristics of nodes in elastic optical networks. The developed simulation program can be used to verify analytical models of EON nodes with threshold mechanisms. The presented simulation program can also be the basis for building a new simulator enabling the determination of the traffic characteristic of EON nodes using other structures of switching networks.
Author Contributions
Conceptualization, M.S. and P.Z.; methodology, P.Z.; software, M.S.; validation, E.L., M.S. and P.Z.; formal analysis, E.L.; investigation, M.S.; resources, E.L.; writing—original draft preparation, M.S. and P.Z.; writing—review and editing, M.S.; visualization, M.S.; supervision, P.Z.; project administration, E.L.; funding acquisition, P.Z. All authors have read and agreed to the published version of the manuscript.
Funding
This research was funded by Polish National Science Center (UMO-2016/23/B/ST7/03925). The APC was funded by the Polish National Science Center.
Data Availability Statement
The data presented in this study are available on request from the corresponding author. The data are not publicly available due to the project limitation.
Conflicts of Interest
The authors declare no conflict of interest. The funders had no role in the design of the study; in the collection, analyses, or interpretation of data; in the writing of the manuscript, or in the decision to publish the results.
Abbreviations
The following abbreviations are used in this manuscript:
| DWDM | Dense Wavelength Division Multiplexing |
| EON | Elastic Optical Networks |
| FSU | Frequency Slot Unit |
| QAM | Quadrature Amplitude Modulation |
| QPSK | Quadrature Phase-Shift Keying |
References
- Shiraiwa, M.; Furukawa, H.; Miyazawa, T.; Awaji, Y.; Wada, N. Concurrently establishing and removing multi-wavelength channels reconfiguration system: Implementation for a dynamic and agile next-generation optical switching network. In Proceedings of the International Conference on Photonics in Switching, Florence, Italy, 22–25 September 2015; pp. 136–138. [Google Scholar]
- Rizzelli, G.; Maier, G.; Quagliotti, M.; Schiano, M.; Pattavina, A. Assessing the Scalability of Next-Generation Wavelength Switched Optical Networks. J. Light. Technol. 2014, 32, 2263–2270. [Google Scholar] [CrossRef]
- Kabaciński, W.; Michalski, M.; Rajewski, R.; Żal, M. Optical datacenter networks with elastic optical switches. In Proceedings of the IEEE International Conference on Communications, Paris, France, 21–25 May 2017; pp. 1–6. [Google Scholar]
- Kabaciński, W.; Michalski, M.; Rajewski, R. Strict-Sense Nonblocking W-S-W Node Architectures for Elastic Optical Networks. J. Light. Technol. 2016, 34, 3155–3162. [Google Scholar] [CrossRef]
- Dorren, H.J.S.; Calabretta, N.; Raz, O. A 3-stage CLOS architecture for high-throughput optical packet switching. In Proceedings of the Asia Communications and Photonics Conference and Exhibition, Shanghai, China, 2–6 November 2009; pp. 1–6. [Google Scholar]
- Aakanksha, A.; Shailendra, M.; Tarun, G. Routing in all-optical three stage-Clos interconnection networks. Int. J. Comput. Sci. Eng. 2012, 2, 19–22. [Google Scholar]
- Recommendation ITU-T G.694.1, Spectral Grids for WDM Applications: DWDM Frequency Grid, International Telecommunication Union—Telecommunication Standardization Sector (ITU-T), Rev.3, October 2020. Available online: https://www.itu.int/rec/T-REC-G.694.1-202010-I/en (accessed on 27 May 2021).
- Głąbowski, M.; Sobieraj, M.; Stasiak, M. An approach to analytical modelling of optical switching networks. In Proceedings of the IEICE General Conference, Tokyo, Japan, 20–23 March 2018. [Google Scholar]
- Kaczmarek, S. Multistage optical switching networks. J. Telecommun. Inf. Technol. 2002, 2, 21–25. [Google Scholar]
- Stasiak, M. An approximate model of a switching network carrying mixture of different multichannel traffic streams. IEEE Trans. Commun. 1993, 41, 836–840. [Google Scholar] [CrossRef]
- Stasiak, M.; Zwierzykowski, P. Point-to-group blocking in the switching networks with unicast and multicast switching. Perform. Eval. 2002, 48, 249–267. [Google Scholar] [CrossRef]
- Głąbowski, M.; Sobieraj, M.; Stasiak, M.; Stasiak, M.D. Modeling of Clos Switching Structures with Dynamically Variable Number of Active Switches in the Spine Stage. Electronics 2020, 9, 1073. [Google Scholar] [CrossRef]
- Głąbowski, M.; Kmiecik, D.; Stasiak, M. On Increasing the Accuracy of Modeling Multi-Service Overflow Systems with Erlang-Engset-Pascal Streams. Electronics 2021, 10, 508. [Google Scholar] [CrossRef]
- Głąbowski, M.; Sobieraj, M. Point-to-Group Blocking Probability in Switching Networks with Threshold Mechanisms. In Proceedings of the 2009 Fifth Advanced International Conference on Telecommunications, Venice, Italy, 24–28 May 2009; pp. 95–100. [Google Scholar]
- Tyszer, J. Object-Oriented Computer Simulation of Discrete-Event Systems; Kluwer Academic Publishers: Norwell, MA, USA, 1999. [Google Scholar]
- Głąbowski, M.; Ivanov, H.; Leitgeb, E.; Sobieraj, M.; Stasiak, M. Simulation studies of elastic optical networks based on 3-stage Clos switching fabric. Opt. Switch. Netw. 2020, 36, 100555. [Google Scholar] [CrossRef]
- Politi, C.T.; Anagnostopoulos, V.; Matrakidis, C.; Stavdas, A.; Lord, A.; López, V.; Fernández-Palacios, J.P. Dynamic Operation of Flexi-Grid OFDM-based Networks. In Proceedings of the Optical Fiber Communication Conference and Exposition, Los Angeles, CA, USA, 4–8 March 2012; pp. 1–3. [Google Scholar]
Short Biography of Authors
 | Maciej Sobieraj received his master’s degree in electronics and telecommunications from Poznan University of Technology, Poland, in 2008. Then, in 2014, he obtained a Ph.D. degree in the field of telecommunication networks. Since 2007 he has been working at Poznan University of Technology, Poland, first at the Chair of Communications and Computer Networks at the Faculty of Electronics and Telecommunications, and then, since 2019, at the Institute of Communications and Computer Networks at the Faculty of Computing and Telecommunications. He is the co-author of more than 50 scientific papers. Maciej Sobieraj is engaged in research in the area of modeling multi-service cellular systems and switching networks and traffic engineering in TCP/IP networks. In recent years, Dr. Sobieraj has been involved in research related to elastic optical networks. |
 | Piotr Zwierzykowski received his master’s degree in telecommunications from Poznan University of Technology, Poland, in 1995, and then a Ph. D. degree (with honours) and D.Sc. degree in telecommunications from the same university in 2002 and 2015, respectively. Since 1995, Piotr has been working at Poznan University of Technology, Poland, first at the Institute of Electronics and Telecommunications at the Faculty of Electrical Engineering, and then, since 2005, at the Chair of Communications and Computer Networks at the Faculty of Electronics and Telecommunications and since 2019, at the Institute of Communications and Computer Networks at the Faculty of Computing and Telecommunications at Poznan University of Technology. Piotr Zwierzykowski is engaged in research and teaching activities in the field of analysis and modelling of multi-service switching systems and networks. Prof. Piotr Zwierzykowski is the author/co-author of more than 200 publications, including 4 books, 33 chapters in books, over 50 journal articles and more than 140 conference papers. Recently, Piotr has also been working as the Guest/Lead Editor for numerous journals published by Elsevier, Hindawi, IEICE, IET, MDPI and Wiley. |
 | Erich Leitgeb received his M.Sc. and Ph.D. (with honours) at Graz University of Technology in 1994 and 1999, respectively. From 1982 to 1984, he attended the military service, including training to become an officer for communications in the Austrian army, and he is still active as an expert in military communications (current military rank: Lieutenant-Colonel). In 1994, he started research in optical communications at the Department of Communications and Wave Propagation (TU Graz). Since January 2000, he has been a project leader of international research projects in the field of optical communications, and he established and leads the research group for Optical Communications at TU Graz and joined several international projects (such as COST 270, COST 291, COST IC0802, the EU project SatNEx and SatNEx 2, and IC1101; currently, he participates in MP1401, CA15127, and CA16220) and ESA projects in different functions. Since 2011, he has been Professor of Optical Communications and Wireless Applications at the Institute of Microwave and Photonic Engineering at Graz University of Technology. Erich Leitgeb is the author or co-author of 7 book chapters, around 50 journal publications, 150 peer-reviewed conference papers, around 45 invited talks and more than 70 international scientific reports. |
Figure 1.
Three-stage Clos switching network.

Figure 2.
Point-to-group selection algorithm.

Figure 3.
Point-to-point selection algorithm.

Figure 4.
Graphical representation of general simulation algorithm.

Figure 5.
Total loss probability in switching network (System 1).

Figure 6.
Internal loss probability in switching network (System 1).

Figure 7.
External loss probability in switching network (System 1).

Figure 8.
Total loss probability in switching network (System 2).

Figure 9.
Internal loss probability in switching network (System 2).

Figure 10.
External loss probability in switching network (System 2).

Figure 11.
Total loss probability in switching network (System 1).

Figure 12.
Internal loss probability in switching network (System 3).

Figure 13.
External loss probability in switching network (System 3).

Figure 14.
Total loss probability in switching network with threshold mechanisms (System 1).

Figure 15.
Internal loss probability in switching network with threshold mechanisms (System 1).

Figure 16.
External loss probability in switching network with threshold mechanisms (System 1).

Figure 17.
Total loss probability in switching network with threshold mechanisms (System 2).

Figure 18.
Internal loss probability in switching network with threshold mechanisms (System 2).

Figure 19.
External loss probability in switching network with threshold mechanisms (System 2).

Figure 20.
Total loss probability in switching network with threshold mechanisms (System 3).

Figure 21.
Internal loss probability in switching network with threshold mechanisms (System 3).

Figure 22.
External loss probability in switching network with threshold mechanisms (System 3).

Figure 23.
Total loss probability in switching network with threshold mechanisms for Erl depending on the threshold area (System 1).
Figure 23.
Total loss probability in switching network with threshold mechanisms for Erl depending on the threshold area (System 1).

Figure 24.
Internal loss probability in switching network with threshold mechanisms for Erl depending on the threshold area (System 1).
Figure 24.
Internal loss probability in switching network with threshold mechanisms for Erl depending on the threshold area (System 1).

Figure 25.
External loss probability in switching network with threshold mechanisms for Erl depending on the threshold area (System 1).
Figure 25.
External loss probability in switching network with threshold mechanisms for Erl depending on the threshold area (System 1).


Table 1.
Possible number of requested FSUs depending on required transmission speed and modulation technique [17].
Table 1.
Possible number of requested FSUs depending on required transmission speed and modulation technique [17].
| Number of FSUs | Bitrate (Gbps) | Maximum Distance (km) | Modulation Format |
|---|---|---|---|
| 1 | 40 | 685 | 64-QAM |
| 1 | 40 | 1024 | 32-QAM |
| 1 | 40 | 1677.9 | 16-QAM |
| 2 | 40 | 2585.2 | QPSK |
| 2 | 100 | 546 | 64-QAM |
| 2 | 100 | 847.2 | 32-QAM |
| 3 | 100 | 1342.5 | 16-QAM |
| 5 | 100 | 2007.3 | QPSK |
| 3 | 160 | 475 | 64-QAM |
| 4 | 160 | 756.5 | 32-QAM |
| 4 | 160 | 1170.5 | 16-QAM |
| 8 | 160 | 1710.9 | QPSK |
| 7 | 400 | 335 | 64-QAM |
| 8 | 400 | 579.6 | 32-QAM |
| 10 | 400 | 835.1 | 16-QAM |
| 20 | 400 | 1133 | QPSK |
| 10 | 600 | 274 | 64-QAM |
| 12 | 600 | 501.4 | 32-QAM |
| 15 | 600 | 686.7 | 16-QAM |
| 30 | 600 | 877.3 | QPSK |
Table 2.
Exemplary duration times of individual simulation experiments.
| No. of Calls | Time |
|---|---|
| 1 mln | 3 min 30 s |
| 10 mln | 26 min |
| 100 mln | 3 h 12 min |
Publisher’s Note: MDPI stays neutral with regard to jurisdictional claims in published maps and institutional affiliations. |
© 2021 by the authors. Licensee MDPI, Basel, Switzerland. This article is an open access article distributed under the terms and conditions of the Creative Commons Attribution (CC BY) license (https://creativecommons.org/licenses/by/4.0/).
Share and Cite
MDPI and ACS Style
Sobieraj, M.; Zwierzykowski, P.; Leitgeb, E. Modelling and Optimization of Multi-Service Optical Switching Networks with Threshold Management Mechanisms. Electronics 2021, 10, 1515. https://doi.org/10.3390/electronics10131515
AMA Style
Sobieraj M, Zwierzykowski P, Leitgeb E. Modelling and Optimization of Multi-Service Optical Switching Networks with Threshold Management Mechanisms. Electronics. 2021; 10(13):1515. https://doi.org/10.3390/electronics10131515
Chicago/Turabian StyleSobieraj, Maciej, Piotr Zwierzykowski, and Erich Leitgeb. 2021. "Modelling and Optimization of Multi-Service Optical Switching Networks with Threshold Management Mechanisms" Electronics 10, no. 13: 1515. https://doi.org/10.3390/electronics10131515
Note that from the first issue of 2016, this journal uses article numbers instead of page numbers. See further details here.