Article

Lower-Limb Electromyography Signal Analysis for the Bottom Group of Muscles Fitness Norm before and after Intensive Exercise

1
Department of Automatic Control Engineering, Feng Chia University, Taichung 40724, Taiwan
2
Office of Physical Education and Sports Affairs, Feng Chia University, Taichung 40724, Taiwan
3
Center for Quality Management, Taichung Veterans General Hospital, Taichung 40705, Taiwan
*
Author to whom correspondence should be addressed.
Electronics 2021, 10(20), 2458; https://doi.org/10.3390/electronics10202458
Submission received: 26 August 2021 / Revised: 5 October 2021 / Accepted: 6 October 2021 / Published: 10 October 2021
(This article belongs to the Special Issue Electronic Devices on Intelligent IoT Applications)

Abstract

:
Muscular fitness is not only the ability of the body to adapt to work and the environment but also the operational ability of physical behavior. We speculated whether research could be conducted on the theory of muscular fitness and its qualitative/quantitative relationship based on muscular fitness and exercise physiology from the perspective of muscular endurance and muscular exploration. This study used standing long jumps as a standard metric for physical fitness to identify the bottom 20% groups. The experiment involved eight freshmen from the bottom 20% groups, and the pre-tests of the participants’ electromyography (EMG) signals under different exercise intensities were measured and after performing a set of intensive exercises for post-tests. The signal’ characteristics measured in time and frequency domains were analyzed to find the correlation between them and the participants’ muscular fitness. Weighted squats were chosen as the strength movements, which were separated into an exercise experiment and a force plate experiment. Both experiments included three different exercise intensities: 8 repetition maximum (RM), 18RM, and 28RM. The EMG signals were captured and analyzed in both time and the frequency domains. Finally, paired sample tests were performed to determine the difference of features under different exercise intensities. The comparison of readings before and after intensive exercises shows that, for the exercised experiment, a significant difference in the mean absolute (MAV), the variance of EMG (VAR), the root mean square value (RMS), and the average amplitude of change (AAC) was observed under 8RM. Under 18RM, MAV, VAR, and AAC showed a significant difference. In the force plate experiment, RMS, AAC, mean frequency (MNF), and median frequency (MDF) showed a statistically significant difference under the intensity of 18RM. As for intensity under 28RM, MAV, VAR, RMS, and AAC also showed significant difference.

1. Introduction

Until the beginning of the 20th century, the explanation of physical fitness was generally considered “to promote physical health through physical exercise”. During that period, it was mostly considered that muscular strength and health were the most important health factors; therefore, they were tested at that time. Most of the key items also improved muscle strength. However, after the beginning of the 20th century and gradually focusing on the performance of movement, physical fitness gradually changed from a single type of movement to multiple different exercises. In addition to muscle power, increased heart rate and blood pressure after exercise are often used to identify physical fitness, and the test items include sprint, high jump, standing long jump, and push-ups [1].
Physical fitness is defined as the adaptability of the body to changes in the environment. It is also the ability of blood vessels, the heart, muscles, and lungs to function. The key elements of physical fitness include the following: muscle fitness, flexibility, cardiopulmonary fitness, and body composition. Labat et al. [2] proposed a method to determine the nonlinearity parameter B/A for various biological solutions and soft tissues using thermodynamic and finite amplitude methods. Some studies [3,4] from the perspective of the analysis of cardiopulmonary signal focused on exploring the responsive state and recovery ability of different cardiopulmonary fitness norms under different exercise intensities.
Electromyography (EMG) records muscle activity from neighboring skin areas: Whenever a muscle contracts, a burst of electric activity is generated, which propagates through adjacent tissues [5]. In addition to electromyograph, electro-diagnostic medical technology [6] is used to analyze the biomechanics of human motion [7,8]. The course begins in the brain. Triggering muscle movements begin in the motor cortex, where neural activity (a series of action potentials) causes electrical signals to be sent to the spinal cord, and the information about the movement is conveyed to the relevant muscle via motor neurons. This begins with the upper motor neurons, which carry the signal to lower motor neurons. The lower motor neurons are the actual instigators of muscle movement, as they innervate the muscle directly at the neuromuscular junction. These innervations cause the release of calcium ions within the muscle, ultimately creating a mechanical change altering the tension in the muscle [9,10]. As this process involves depolarization (a change in the electrochemical gradient), the difference in current can be detected by EMG. In some climates, the time domain characteristics usually present muscle exertion levels. The greater the EMG amplitude of the same muscle, the greater the force of contraction [11], as observed especially during static isometric contraction exercises [12,13]. Frequency-domain or spectral-domain features are usually used in assessing muscle fatigue and analyzing motor unit recruitment. To transform the EMG signal in the time-domain to the frequency-domain, a fourier transformation of the autocorrelation function of the EMG signal is employed, which also provides a power spectrum. However, frequency-domain features show better performance when assessing muscle fatigue [14,15]. Mean frequency (MNF) and median frequency (MDF) are the most useful and popular frequency-domain features, and they are frequently used for the assessment of muscle fatigue in surface EMG signals [16].
Bilodeau et al. [17] determined the EMG signal characteristics of the quadriceps muscles, such as root mean square (RMS), mean power frequency (MPF), and median frequency (MDF) with increasing force and with fatigue. Zaman et al. [18] examined young subjects’ surface electromyography (EMG) signals at different levels of maximum voluntary contractions (MVC) and analyzed spectral shifts in mean and median frequencies (MNF and MDF). Boyas et al. [19] used MPF to explore changes in electrical activity distribution among synergist muscles and tested relations between changes in surface electromyographic parameters with endurance time. Our previous research [20] analyzed the EMG signals (lower limbs) with various levels of muscular fitness (the top 20%, middle 20%, and bottom 20% groups) for different exercise intensities and fatigue periods. In the study, a short-term intensive exercise was also designed, and two exercise experiments (pre-test and post-test) were conducted to further explore the EMG features of the bottom physical fitness group before (group B) and after (group A) intensive exercise.

2. Materials and Methods
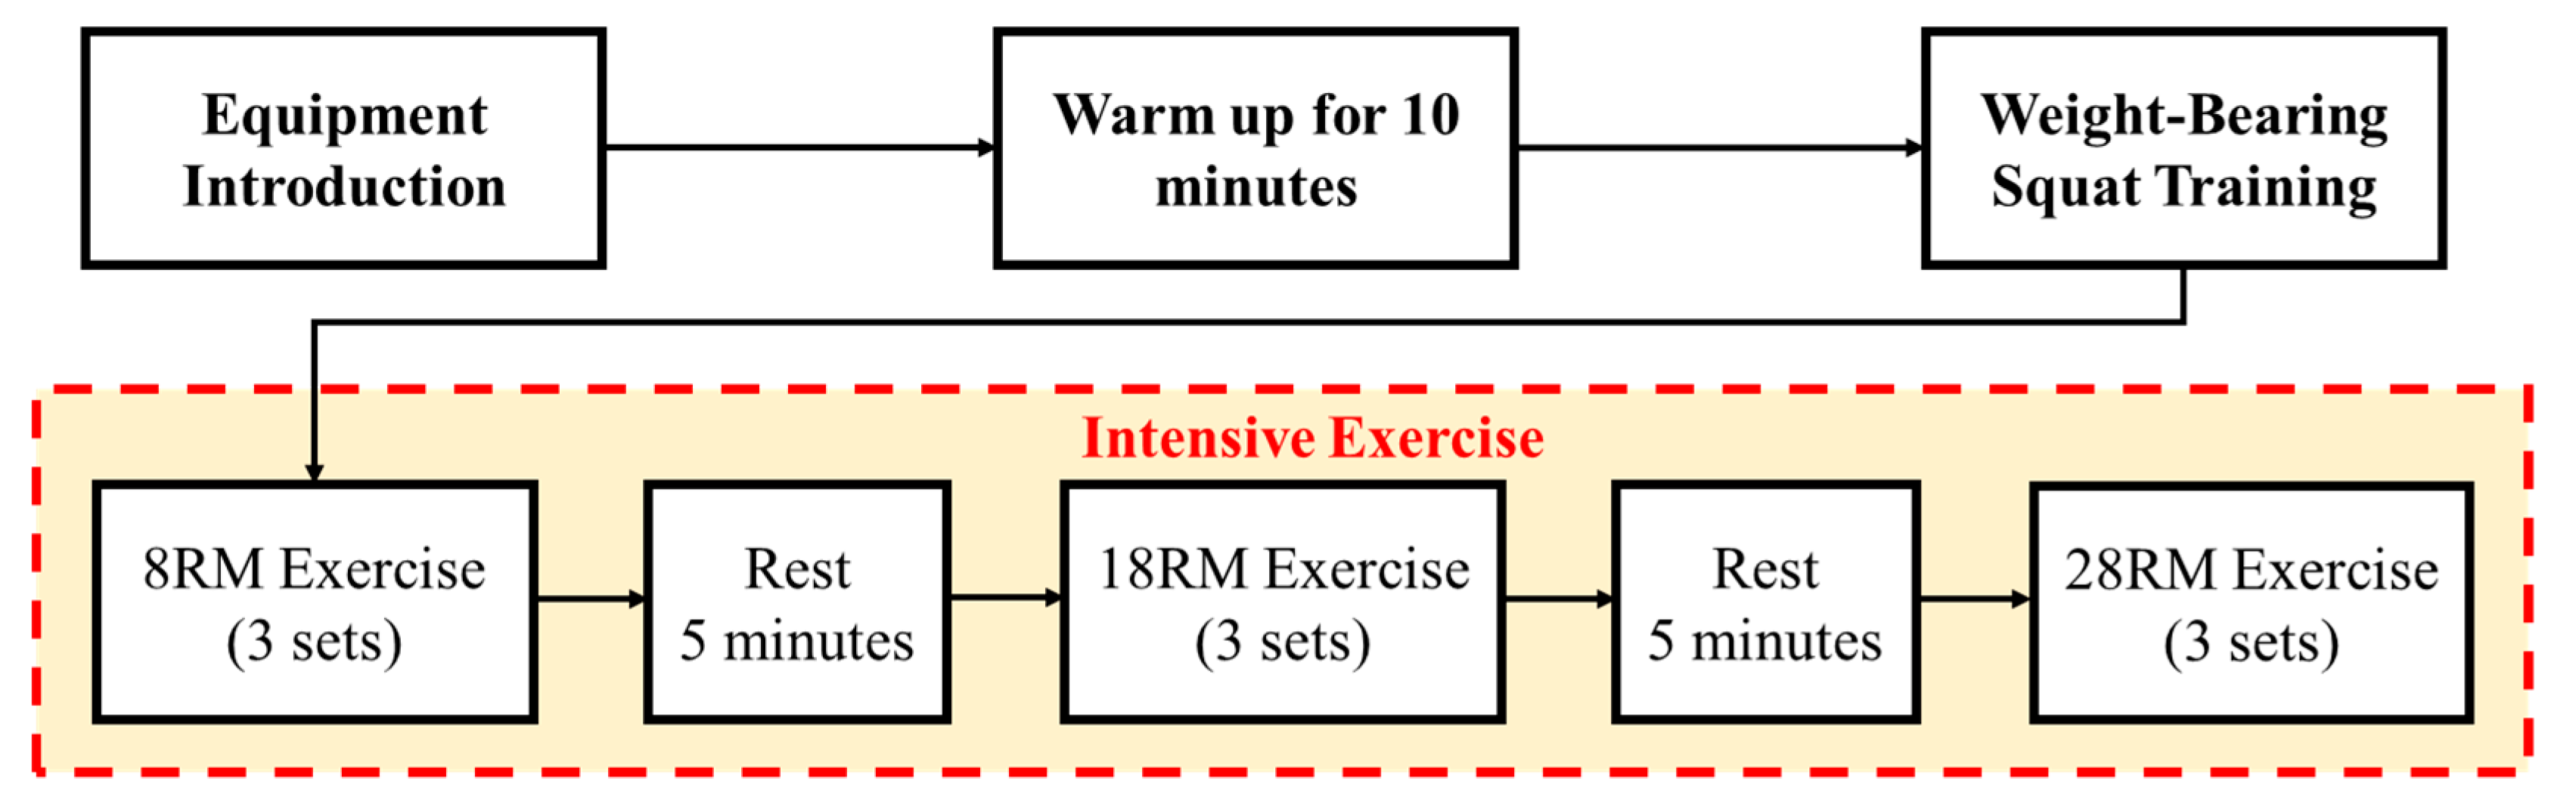
The exercise experiment intensity of this study is divided into the following four types: no load, 8 repetitions (RM), 18RM, and 28RM. After completing each exercise experiment (isotonic contraction), the force plate experiment (isometric contraction) was performed in order to acquire the EMG signal and the strength failure signal immediately. Then, the features of each item before and after the intensive exercise were analyzed for statistically significant differences. Figure 1 shows the experimental flowchart.
Before conducting the experiment, the subjects (bottom 20% groups) needed to fill in the PAR-Q questionnaire, which explained the experiment procedure, sports equipment, and introduced the measuring equipment. Then, the maximum one-repetition maximum (1RM) was calculated to determine the maximum muscle strength, no load exercise, light exercise (28RM), moderate exercise (18RM), and vigorous exercise (8RM). After each exercise, the participant was given 3 min of rest. The experimental procedure conducted is mentioned below.
Step 1:
The procedure, functioning of the equipment, and purpose of the experiments were explained to the participants. Subjects were instructed to warm up their body. The procedure, functioning of the equipment, and purpose of the experiments were explained to the participants.
Step 2:
No load experiment: The participants were asked to squat 15 times on the Smith machine without bearing any load, during which EMG signals were collected. After the exercise experiment, the subjects stood on the force plate to lift the fixed barbell with maximum effort and performed isometric contraction of the quadriceps until exhaustion, and their EMGs and force signals were collected during the same time.
Step 3:
1RM experiment: An initial weight that was within the subject’s perceived capacity (50% of capacity) was selected. Resistance was gradually increased by 2.5 kg to 20 kg until the subject was unable to complete the selected repetition. All repetitions were to be performed at the same speed of movement and range of motion.
Step 4:
8RM experiment: The participants were asked to squat with 8RM on the Smith machine, during which EMG signals were collected. After the exercise experiment, the subjects stood on the force plate to lift the fixed barbell with maximum effort and performed isometric contraction of the quadriceps until exhaustion, and their EMGs and force signals were collected during the same period.
Step 5:
18RM experiment: The participants were asked to squat with 18RM on the Smith machine, during which EMG signals were collected. After the exercise experiment, the subjects stood on the force plate to lift the fixed barbell with maximum effort and performed isometric contraction of the quadriceps until exhaustion, and their EMGs and force signals were during the same period.
Step 6:
28RM experiment: The participants were asked to squat with 28RM on the Smith machine, during which EMG signals were collected. After the exercise experiment, the subjects stood on the force plate to lift the fixed barbell with the maximum effort and performed isometric contraction of the quadriceps until exhaustion, and their EMGs and force signals were during the same period.
The Lower-Limb EMG signals of participant were collected using a Vernier EMG Sensor with LabQuest 2 built on an NI ELVIS II engineering laboratory workstation, then EMG signals processing and features extraction in the MATLAB platform were performed.
We used weight-bearing squats to strengthen the muscles of the lower limbs, once a week at 1 h each time, as a short-term intensive exercise for 4 weeks. In order to make sure that the subject can load the maximum upper limit of each set of training, the interval between each set is 3 min [21]. The flowchart of the intensive exercise training is shown in Figure 2. The subjects of bottom 20% groups after a short-term intensive exercise are shown, and the above experimental procedure will be performed again for post-test.

2.1. Subjects and Ethical Approval

The proposed method conformed to the standards and was approved by the Research Ethics Committee (NCUEREC-104-073, National Changhua University of Education, Taiwan). All subjects in the experiment were recruited from students at Feng Chia University (Taichung, Taiwan). The subjects were categorized into 3 groups according to their muscular power fitness norms based on their standing long jumps, which were in the top group (the best 20%: 10 volunteers); in the middle group (the middle 20%: 11 volunteers); and in the bottom group (the lowest 20%: 8 volunteers) of the total enrolled 2017 freshmen [20]. Table 1 shows the bottom group and their mean information. The mean 1RM of bottom groups showed statistical significance before and after intensive exercise.

2.2. Exercise Intensity

The subjects who performed the weight-bearing squat experiment are all freshmen and not professional athletes. In order to enable all three physical fitness norms to complete the exercise experiment and to avoid the potential high-intensity injury risk of the bottom 20% groups of physical fitness norms, the exercise experiment intensity was divided into three levels: light exercise (28RM), moderate exercise (18RM), and vigorous exercise (8RM). The definition of the exercise intensity as 1RM, which is calculated by the estimated percentage of 1RM, was achieved at each exercise level, as expressed in Equation (1):
1 RM = 100 × W ( 52.2 + ( 41.9 e 0.055 × R ) )
where RM is the repetitions maximum, W is the barbell load, and R is the number of repetitions.
  • Heavy load experiment (8RM) ≈ 80% HRmax
  • Moderate load experiment (18RM) ≈ 55% HRmax
  • Light load experiment (28RM) ≈ 30% HRmax

2.3. Normalized EMG and Its Features

In the exercise experiment, the first and last EMG signals under four different intensities were chosen in order to capture the EMG signals using the short-time Fourier transform (STFT) in order to integrate the STFT figure and then to conduct valley detection by using thresholds [22]. In the force plate experiment, the force-time curve decreasing segment was contrasted, followed by choosing the time of the declining force in the full range of force from 90% to 10% and segmenting the same time for the EMG signal. The EMG signals were used a band pass filter (low-pass 22 Hz; high-pass 35 Hz), and full-wave rectification was conducted; the EMG signals were normalized by Equation (2).
Normalized   EMG = EMG Max | EMG |
Then, two methods were employed to investigate the EMG signals: time-domain analysis and frequency-domain analysis.

2.3.1. Time-Domain Analysis

Time-domain analysis included the analysis of the mean absolute value (MAV), the variance of EMG (VAR), the root mean square (RMS), the average amplitude change (AAC), and EMG during the exercise and force plate experiments. These time-domain features usually represent the level of muscle exertion and can be represented by Equations (3)–(6):
  • MAV: A method of detecting muscle contraction levels, as shown in (3);
MAV = 1 N i = 1 N | x i |
  • VAR: Indicating the power of the EMG signal, as shown in (4);
VAR = 1 N i = 1 N ( x i ) 2
  • RMS: Related to the constant force and the non-fatiguing contractions of the muscles, as shown in (5);
RMS = 1 N i = 1 N x i 2
  • AAC: The cumulative length of the waveform in the segment intuitively, as shown in (6).
AAC = 1 N i = 1 N 1 | x i + 1 x i |  

2.3.2. Frequency-Domain Analysis

The characteristics of the frequency domain-analysis used in this study are MDF and MNF. After the raw myoelectric signal is converted by fast Fourier, the data can be converted from the time domain. It is the frequency spectrum in the frequency domain. At this time, the vertical axis is the myoelectric power intensity distribution, and the horizontal axis is the frequency. The MNF and MDF equations are shown in (7) and (8):
  • MNF: The average frequency which is calculated by the sum of the product of the EMG power spectrum and the frequency divided by the total sum of the spectrum intensity, as shown in (7);
MNF = f = f 0 f c fP ( f ) f = f 0 f c P ( f )
  • MDF: The frequency at which the spectrum is divided into two regions with equal amplitude, as shown in (8).
j = 1 MDF P j = j = MDF M P j = 1 2 j = 1 M P j

2.4. Statistical Analysis

Continuous variables are described as mean ± standard deviation (SD). The EMG features of bottom group before and after the intensive exercises were used in paired sample t-test to test differences. Statistical significance was accepted for values of p < 0.05.

3. Results and Discussions

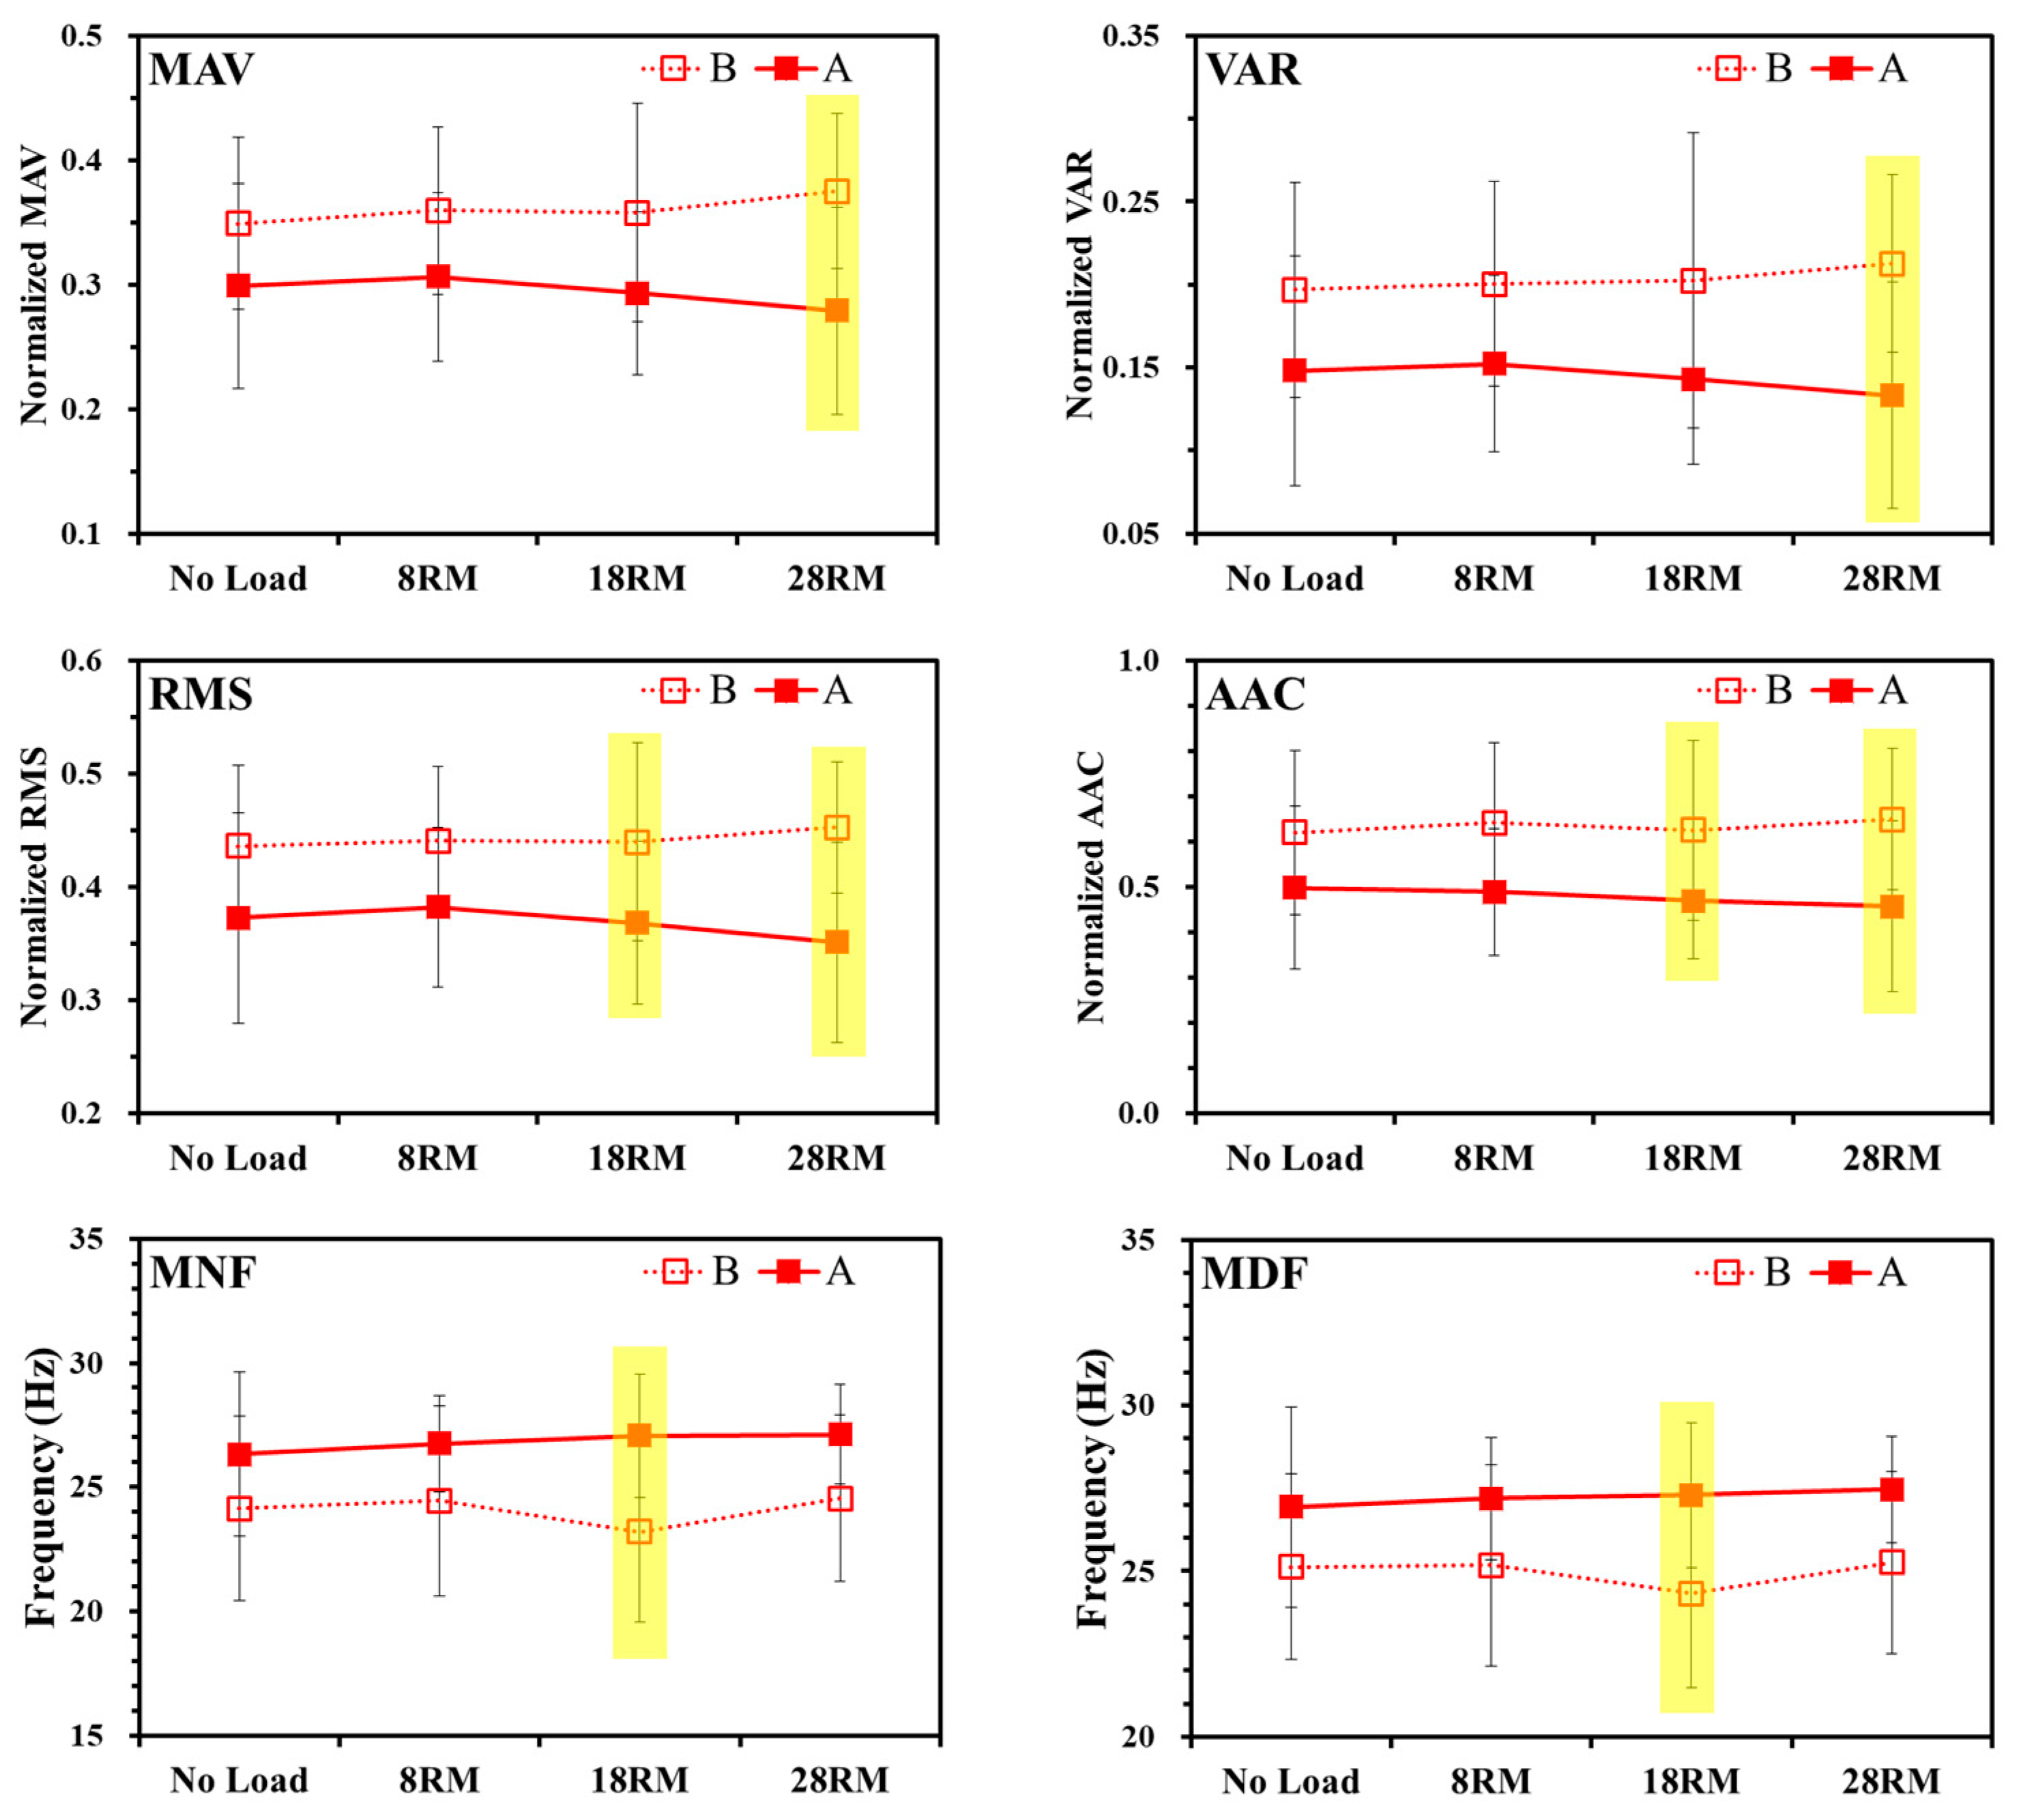
3.1. Exercise Experiment

Table 2 and Figure 3 show the results of EMG features and statistical analysis in graded exercise experiment for the bottom physical fitness group before (group B) and after (group A) the intensive exercise. The MAV displayed the same style (A > B) in the upper left panel of Figure 3. MAV indicated significant differences in 8RM and 18RM exercise experiments (8RM: p = 0.001; 18RM: p = 0.01) but not in the No Load and 28RM exercise experiments. VAR displayed the same style (A > B) in the upper right panel of Figure 3. VAR indicated significant differences in 8RM and 18RM exercise experiments (8RM: p = 0.001; 18RM: p = 0.034) but not in the No Load and 28RM exercise experiments. The RMS displayed the same style (A > B) in the middle left panel of Figure 3. RMS indicated significant differences only in the 8RM exercise experiment (p = 0.001). The AAC displayed the same style (A > B) in the middle right panel of Figure 3. AAC indicated significant differences in the 8RM and 18RM exercise experiment (8RM: p = 0.001; 18RM: p = 0.008) but not in the No Load and 28RM exercise experiments. The MNF did not display the same style (A > B) in the bottom left panel of Figure 3. MAV did not indicate a significant difference in any of the exercise intensities. The MDF did not display the same style (A > B) in the bottom left panel of Figure 3. MAV did not also indicate a significant difference in any of the exercise intensities.
In previous research [20], the time-domain features MAV, VAR, RMS, and AAC displayed a similar style for all groups (Top 20% > Middle 20% > Bottom 20%) in all exercise experiments and showed that strong muscle explosive power was greater than that of the weaker. In this study, the results indicate that the time-domain features of the bottom group increased significantly after short-term intensive exercise, and no significant differences were discovered in the frequency-domain features MNF and MDF between any two groups. The comparison of the characteristics of the two research results is consistent. Figure 4 shows the comparison of exercise experiment results of the present study with our previous research [20].

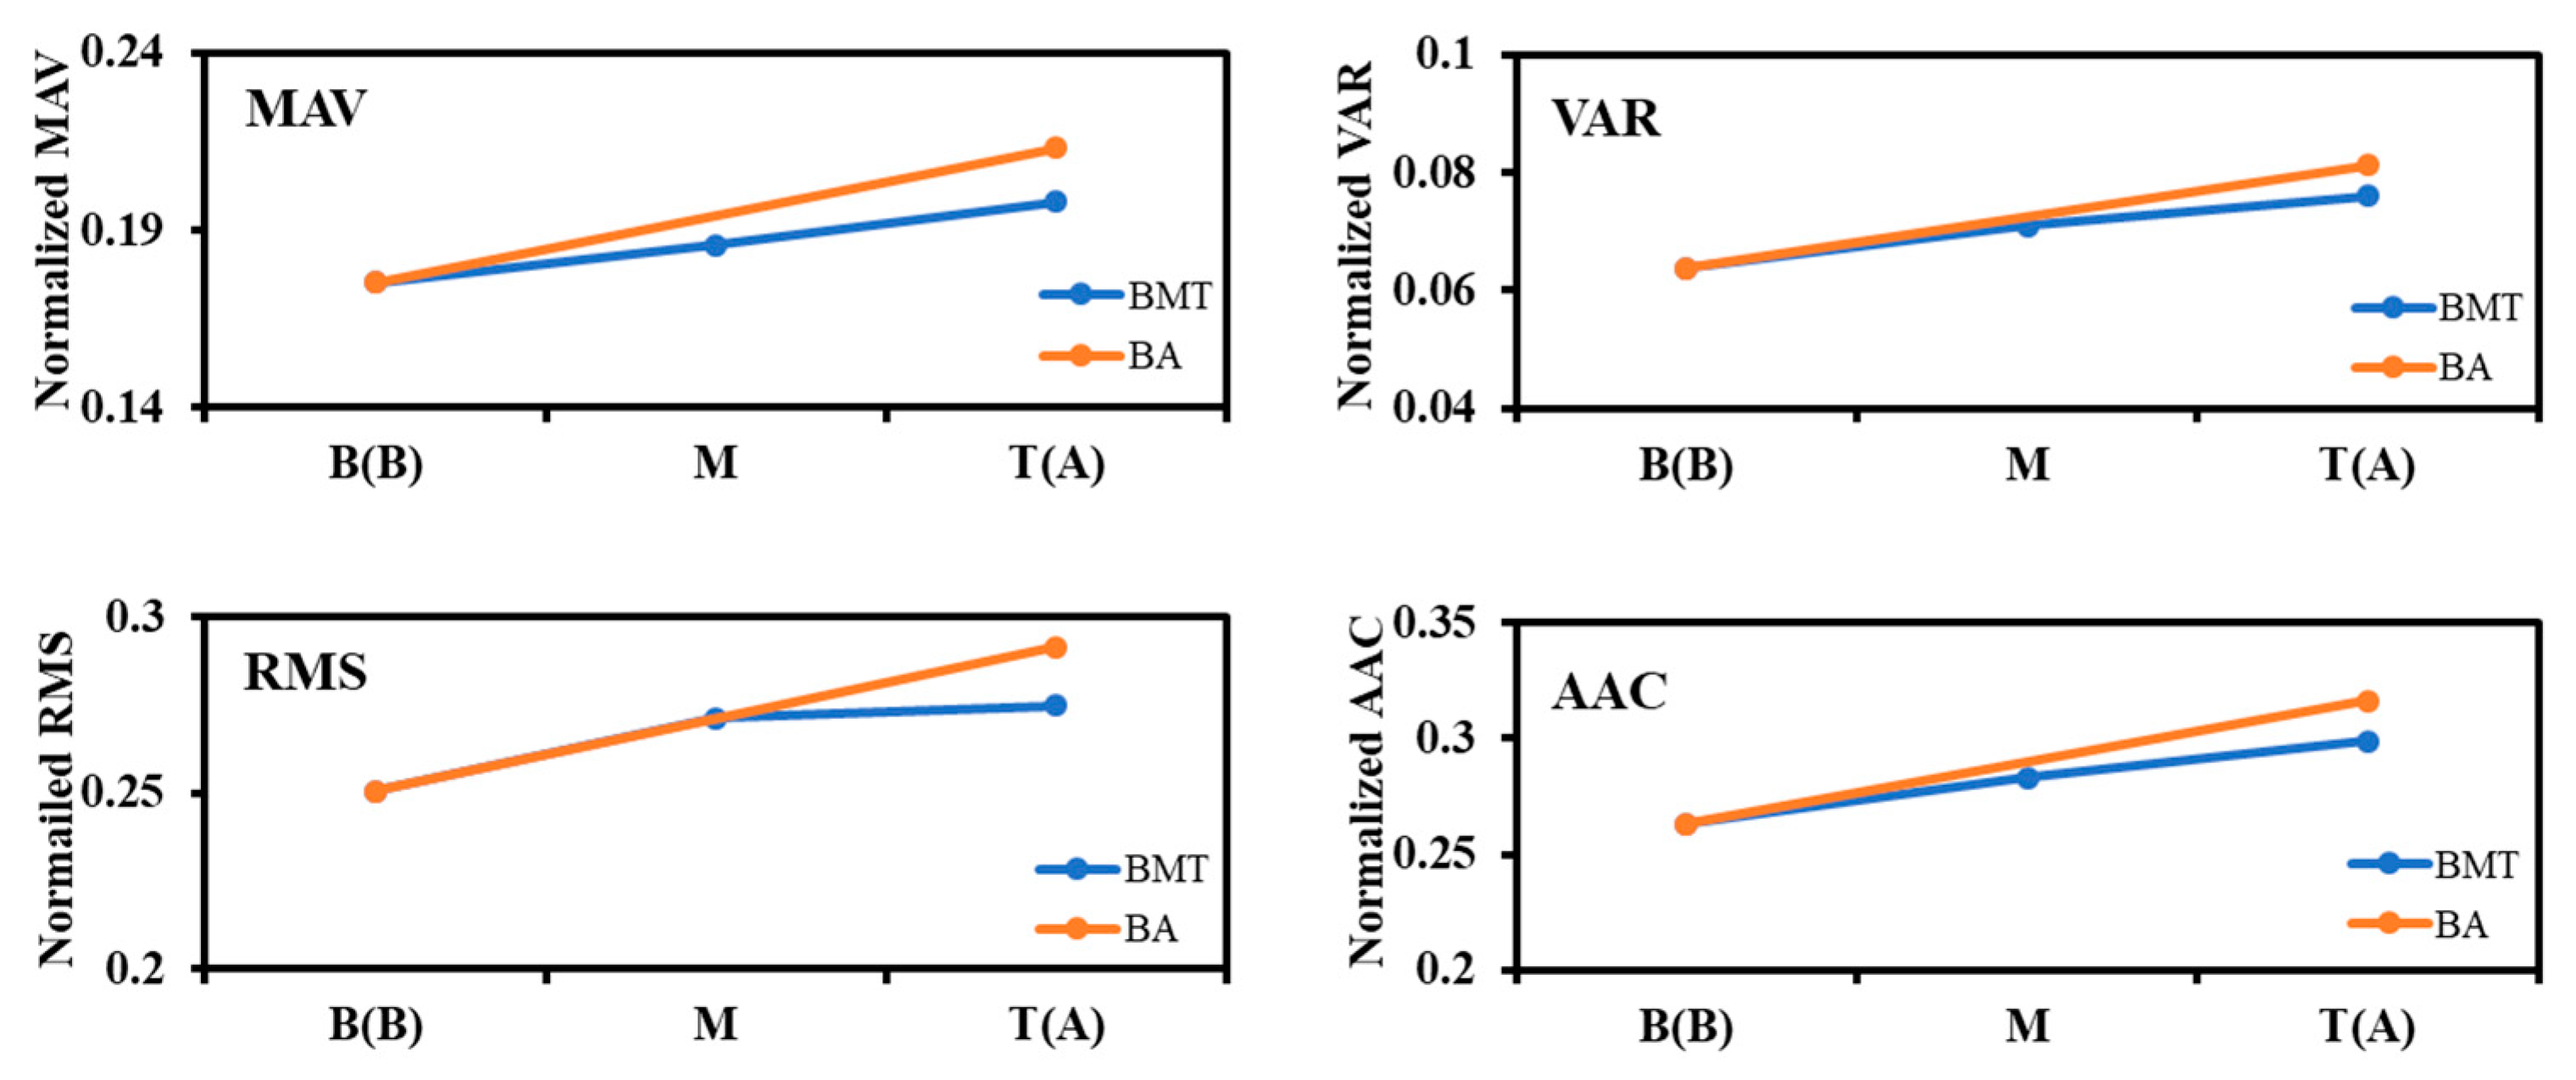
3.2. Force Plate Experiment

Table 3 and Figure 5 show the results of EMG features and statistical analysis in graded force plate experiment for the bottom physical fitness group before (group B) and after (group A) the intensive exercise. MAV displayed the same style (B > A) in the upper left panel of Figure 5. MAV indicated significant differences in the 28RM force plate experiment (p = 0.001) but not in the No Load, 8RM, and 18RM force plate experiments. VAR displayed the same style (B > A) in the upper right panel of Figure 5. VAR indicated significant differences in the 28RM force plate experiment (p = 0.001) but not in No Load, 8RM, and 18RM force plate experiments. RMS displayed the same style (B > A) in the middle left panel of Figure 5. RMS indicated significant differences in the 18RM and 28RM force plate experiment (18RM: p = 0.047; 28RM: p = 0.002) but not in the No Load and 8RM force plate experiments. AAC displayed the same style (B > A) in the middle right panel of Figure 5. AAC indicated significant differences in the 18RM and 28RM force plate experiments (18RM: p = 0.006; 28RM: p = 0.001) but not in the No Load and 8RM force plate experiments. MNF displayed the same style (A > B) in the bottom left panel of Figure 5. MNF indicated significant differences in the 18RM force plate experiment (p = 0.033) but not in the No Load, 8RM, and 28RM force plate experiments. The MDF displayed the same style (A > B) in the bottom right panel of Figure 5. MDF indicated significant differences in the 18RM force plate experiment (p = 0.03) but not in the No Load, 8RM, and 28RM force plate experiments.
Boyas et al. [19] pointed out that when muscle fatigue occurs, the muscles often have to recruit more motor units in order to maintain certain muscle tension, which makes the time domain characteristic values of subjects with poor physical fitness increase more than those with better physical fitness. Callewaert et al. [23] also showed that when fatigue occurs, the RMS value of the untrained boy group is greater than that of the training group. Halin et al. [24] also showed that gymnasts have higher frequency-domain features compared to untrained boys. In our previous research [20], the time-domain features MAV, VAR, RMS, and AAC displayed a similar style for all groups (Bottom 20% > Top 20% > Middle 20%), and the frequency-domain features MNF and MDF displayed a similar style for all groups (Top 20% > Middle 20% > Bottom 20%) in all force plate experiments. In this study, the time-domain features of the bottom group decreased significantly after short-term intensive exercise, and the frequency-domain features increased significantly. The comparisons of the characteristics of the two research results are consistent. Figure 6 shows the comparison of force plate experiment results of the present study with our previous research [20].

4. Conclusions

A previous study [20] has been performed based on EMGs recorded in exercise and force plate experiments under different exercise intensities for three university freshmen groups with different levels of physical fitness, time-domain, and frequency-domain analysis. In this study, the same materials and methods have been performed after short-term intensive training of lower limb muscle strength for the bottom group that indicated changes in the features of the lower limb EMG signal tended to be close to the top group. In the exercise experiment, especially at 8RM, the time domain characteristic values of the bottom group after undergoing short-term intensive training were higher than before the intensive exercise. It is verified from the indicators that intensive exercise training can increase muscle power. In the force plate experiment, the time domain characteristic values of the bottom group were higher than after the intensive exercise, and the frequency domain characteristic values are smaller than that after the intensive exercise. This result also verified that, when fatigue occurs, the RMS value of the untrained boy group is greater than that of the training group [23] and that gymnasts have higher frequency-domain features compared to untrained boys [24].
Some limitation and experimental biases should be considered in this report. The subjects were recruited in 2017 and comprised freshmen at Feng Chia University. Their muscular power fitness in the standing long jump comprised the lowest 20%. However, it was not possible to confirm the physical condition of the subjects and whether they performed the test as best as possible, and the sample of subjects is limited and cannot represent all young people. Considering that the subjects that performed the weight-bearing squat experiment are not professional athletes, the three levels of intensity design (8RM; 18RM; 28RM) in the exercise experiment considered that all physical fitness norms of the subjects (Top 20%; Middle 20%; Bottom 20%) could be operated, especially the bottom group. According to NSCA [25], a repetition zone greater than 12 belongs to endurance training (therefore, 18 and 28 reps are in the same repetition zone). In this study, 18RM and 28RM muscle endurance trainings have different intensities in terms of the number of repetitions and the period of rest time between sets. Since each level of exercise experiment has been performed to exhaustion, that fatigue should occur sooner in beginners. The different order of exercise intensity performed may also affect the experimental results.

Author Contributions

Conceptualization, C.-K.C. and S.-L.L.; data curation, T.-C.W.; formal analysis, C.-K.C., S.-L.L., and Y.-S.H.; methodology, C.-K.C. and S.-L.L.; project administration, C.-K.C.; resources, T.-C.W.; software, Y.-S.H.; supervision, C.-K.C., S.-L.L., and C.-L.W.; validation, C.-L.W.; visualization, Y.-S.H.; writing—original draft, C.-K.C. All authors have read and agreed to the published version of the manuscript.

Funding

This research received no external funding.

Acknowledgments

This study was supported by the Ministry of Science and Technology (MOST 105-2221-E-035-095-MY2), Taiwan.

Conflicts of Interest

The authors declare no conflict of interest.

References

  1. Sylvia, L.G.; Bernstein, E.E.; Hubbard, J.L.; Keating, L.; Anderson, E.J. A practical guide to measuring physical activity. J. Acad. Nutr. Diet 2014, 114, 199–208. [Google Scholar] [CrossRef] [Green Version]
  2. Labat, V.; Remenieras, J.P.; Matar, O.B.; Ouahabi, A.; Patat, F. Harmonic propagation of finite amplitude sound beams: Experimental determination of the nonlinearity parameter B/A. Ultrasonics 2000, 38, 292–296. [Google Scholar] [CrossRef]
  3. Chen, C.K.; Lin, S.L.; Huang, C.Y.; Wang, T.C.; Yao, T.Y.; Wu, C.L. Statistical analysis on heart rate variability for graded cardiopulmonary groups with different exercise intensities. J. Med. Biol. Eng. 2020, 40, 440–450. [Google Scholar] [CrossRef]
  4. Chen, C.K.; Huang, C.Y.; Wang, T.C.; Lin, S.L.; Wu, C.L.; Lin, J.Y.; Yao, T.Y.; Ko, Y.H. Heart rate variability analysis for distinct cardiopulmonary fitness norms under different exercise intensities. Sports Exerc Res. 2021, 23, 183–209. [Google Scholar]
  5. Slater, L.V.; Hart, J.M. Muscle activation during different Squat techniques. J. Strength Cond. Res. 2017, 31, 667–676. [Google Scholar] [CrossRef] [PubMed]
  6. Li, Z.; Hayashibe, M.; Fattal, C.; Guiraud, D. Muscle fatigue tracking with Evoked EMG via recurrent neural network: Toward personalized neuroprosthetics. IEEE Comput. Intell. Mag. 2014, 9, 38–46. [Google Scholar] [CrossRef]
  7. Zhao, J.D.; Jiang, L.; Cai, H.G.; Liu, H.; Hirzing, G. A novel EMG motion pattern classifier based on wavelet transform and nonlinearity analysis method. In Proceedings of the 2006 IEEE International Conference on Robotics and Biomimetics, Kunming, China, 17–20 December 2006; pp. 1494–1499. [Google Scholar]
  8. Pan, L.Z.; Crouch, D.L.; Huang, H. Comparing EMG-based human-Machine Interfaces for estimating continuous, coordinated movements. IEEE Trans. Neural Syst. Rehabil. Eng. 2019, 27, 2145–2154. [Google Scholar] [CrossRef]
  9. Valentin, S.; Zsoldos, R. Surface electromyography in animal biomechanics: A systematic review. J. Electromyogr. Kinesiol. 2016, 28, 167–183. [Google Scholar] [CrossRef] [PubMed] [Green Version]
  10. Picard, N.; Strick, P.L. Motor areas of the medial wall: A review of their location and functional activation. Cereb. Cortex 1996, 6, 342–353. [Google Scholar] [CrossRef] [Green Version]
  11. Luo, J.; Liu, C.; Yang, C.G. Estimation of EMG-based force using a neural-network-based approach. IEEE Access 2019, 7, 64856–64865. [Google Scholar] [CrossRef]
  12. Ricard, M.D.; Ugrinowitsch, C.; Parcell, A.C.; Hilton, S.; Rubley, M.D.; Sawyer, R.; Poole, C.R. Effects of rate of force development on EMG amplitude and frequency. Int. J. Sports Med. 2005, 26, 66–70. [Google Scholar] [CrossRef]
  13. Chang, J.; Chablat, D.; Bennis, F.; Ma, L. Estimating the EMG response exclusively to fatigue during sustained static maximum voluntary contraction. Adv. Phys. Ergon. Hum. Factors 2016, 489, 29–39. [Google Scholar]
  14. Cao, L.; Wang, Y.; Hao, D.M.; Rong, Y.; Yang, L.; Zhang, S.; Zheng, D.C. Effects of force load, muscle fatigue, and magnetic stimulation on surface electromyography during side arm lateral raise task: A preliminary study with healthy subjects. Biomed. Res. Int 2017, 2017, 9. [Google Scholar] [CrossRef]
  15. Wang, L.J.; Wang, Y.T.; Ma, A.D.; Ma, G.G.; Ye, Y.; Li, R.J.; Lu, T.F. A comparative study of EMG indices in muscle fatigue evaluation based on grey relational analysis during all-out cycling exercise. Biomed. Res. Int. 2018, 2018, 8. [Google Scholar] [CrossRef] [Green Version]
  16. Cifrek, M.; Medved, V.; Tonković, S.; Ostojić, S. Surface EMG based muscle fatigue evaluation in biomechanics. Clin. Biomech. 2009, 24, 327–340. [Google Scholar] [CrossRef] [PubMed]
  17. Bilodeau, M.; Schindler-Ivens, S.; Williams, D.; Chandran, R.; Sharma, S.S. EMG frequency content changes with increasing force and during fatigue in the quadriceps femoris muscle of men and women. J. Electromyogr. Kinesiol. 2003, 13, 83–92. [Google Scholar] [CrossRef]
  18. Zaman, A.A.; Sharmin, T.; Khan, M.A.A.; Ferdjallah, M. Muscle fatigue analysis in young adults at different MVC levels using EMG metrics. In Proceedings of the 2007 IEEE SoutheastCon, Richmond, VA, USA, 22–25 March 2007; pp. 390–394. [Google Scholar]
  19. Boyas, S.; Maïsetti, O.; Guével, A. Changes in sEMG parameters among trunk and thigh muscles during a fatiguing bilateral isometric multi-joint task in trained and untrained subjects. J. Electromyogr. Kinesiol. 2009, 19, 259–268. [Google Scholar] [CrossRef] [PubMed]
  20. Chen, C.K.; Lin, S.L.; Wang, T.C.; Lin, Y.J.; Wu, C.L. Lower-limb electromyography signal analysis of distinct muscle fitness norms under graded exercise intensity. Electronics 2020, 9, 2147. [Google Scholar] [CrossRef]
  21. Mayhew, J.L.; Ware, J.R.; Prinster, J.L. Test & Measurement: Using lift repetitions to predict muscular strength in adolescent males. Strength Cond. J. 1993, 15, 35–38. [Google Scholar]
  22. Shair, E.F.; Abdullah, A.R.; Zawawi, T.; Ahmad, S.A.; Saleh, S. Auto-segmentation analysis of EMG signal for lifting muscle contraction activities. J. Telecommun. Electron. Comput. Eng. 2016, 8, 17–22. [Google Scholar]
  23. Callewaert, M.; Boone, J.; Celie, B.; Clercq, D.D.; Bourgois, J. Quadriceps muscle fatigue in trained and untrained boys. Int. J. Sports Med. 2013, 34, 14–20. [Google Scholar] [CrossRef] [PubMed] [Green Version]
  24. Halin, R.; Germain, P.; Buttelli, O.; Kapitaniak, B. Differences in strength and surface electromyogram characteristics between pre-pubertal gymnasts and untrained boys during brief and maintained maximal isometric voluntary contractions. Eur. J. Appl. Physiol. 2002, 87, 409–415. [Google Scholar] [CrossRef] [PubMed]
  25. National Strength & Conditioning Association. NSCA’s Guide to Program Design; Hoffman, J., Ed.; Human Kinetics: Champaign, IL, USA, 2011; ISBN 978-1-4925-8277-9. [Google Scholar]
Figure 1. Schematic diagram of experimental procedures.
Electronics 10 02458 g001
Figure 2. Flowchart of the intensive exercise training.
Electronics 10 02458 g002
Figure 3. Average EMG measures for the bottom physical fitness group before (group B) and after (group A) the intensive exercise in graded exercise experiments.
Electronics 10 02458 g003
Figure 4. Comparison of the exercise experiment results of the present study with our previous research [20].
Electronics 10 02458 g004
Figure 5. Average EMG measures for the bottom physical fitness group before (group B) and after (group A) the intensive exercise in graded force plate experiments.
Electronics 10 02458 g005
Figure 6. Comparison of the force plate experiment results of the present study with our previous research [20].
Electronics 10 02458 g006
Table 1. Basic mean information of bottom groups.
Intensive Exercisep
Before (B)After (A)
n88
Height (cm)166.84 ± 9.20166.50 ± 8.890.212
Weight (kg)69.03 ± 16.8669.25 ± 15.630.765
BMI (kg/m2)24.65 ± 4.8824.84 ± 4.390.490
1RM (kg)63.63 ± 7.9587.38 ± 12.580.000 *
Standing long jump (cm)186.88 ± 13.23198.63 ± 11.480.100
* Significant distinctiveness (p < 0.05).
Table 2. Statistical analysis of EMG features in exercise experiment (Mean ± SD).
FeaturesIntensive ExercisesExercise Experiment
No Load8RM18RM28RM
Time-domainMAVB0.199 ± 0.0260.175 ± 0.0160.169 ± 0.0190.164 ± 0.019
A0.206 ± 0.0350.213 ± 0.0160.202 ± 0.0360.195 ± 0.026
(mV)p0.7390.001 *0.01 *0.103
VARB0.080 ± 0.0140.064 ± 0.0090.064 ± 0.0090.064 ± 0.011
A0.085 ± 0.0220.087 ± 0.0100.081 ± 0.0230.079 ± 0.016
(mV)p0.7060.001 *0.034 *0.302
RMSB0.278 ± 0.0250.251 ± 0.0160.249 ± 0.0210.249 ± 0.022
A0.286 ± 0.0360.292 ± 0.0170.281 ± 0.0370.278 ± 0.027
(mV)p0.6910.001 *0.050.226
AACB0.313 ± 0.0380.272 ± 0.0230.263 ± 0.0300.257 ± 0.027
A0.325 ± 0.0530.335 ± 0.0270.316 ± 0.0590.306 ± 0.042
(mV)p0.6810.001 *0.008 *0.066
Frequency-domainMNFB28.81 ± 0.5928.58 ± 0.5628.57 ± 0.2628.65 ± 0.31
A28.77 ± 0.4628.76 ± 0.5528.6 ± 0.3128.6 ± 0.33
(Hz)p0.9060.3680.920.86
MDFB29.19 ± 0.8228.54 ± 0.8528.50 ± 0.4528.58 ± 0.37
A28.96 ± 0.8428.85 ± 0.8128.52 ± 0.5428.74 ± 0.58
(Hz)p0.6470.3780.8460.637
* Significant differences (p < 0.05).
Table 3. Statistical analysis of EMG features in force plate experiment (Mean ± SD).
FeaturesIntensive ExercisesExercise Experiment
No Load8RM18RM28RM
Time-domainMAVB0.349 ± 0.0690.359 ± 0.0670.358 ± 0.0880.375 ± 0.062
A0.306 ± 0.0680.306 ± 0.0680.293 ± 0.0650.279 ± 0.083
(mV)p0.1460.1420.0610.001 *
VARB0.197 ± 0.0650.200 ± 0.0620.203 ± 0.0890.213 ± 0.054
A0.148 ± 0.0690.152 ± 0.0530.143 ± 0.0520.133 ± 0.068
(mV)p0.1030.1220.0720.001 *
RMSB0.436 ± 0.0710.441 ± 0.0650.439 ± 0.0880.453 ± 0.058
A0.373 ± 0.0930.382 ± 0.0700.368 ± 0.0720.351 ± 0.088
(mV)p0.1040.0950.047 *0.002 *
AACB0.620 ± 0.1810.642 ± 0.1770.625 ± 0.1980.649 ± 0.156
A0.4985 ± 0.18010.4894 ± 0.14000.4692 ± 0.12880.457 ± 0.1889
(mV)p0.1440.0640.006 *0.001 *
Frequency-domainMNFB24.13 ± 3.7124.46 ± 3.8323.19 ± 3.6424.55 ± 3.35
A26.33 ± 3.2926.75 ± 1.9527.07 ± 2.527.13 ± 2.02
(Hz)p0.2660.1880.033*0.097
MDFB25.13 ± 2.7925.17 ± 3.0324.32 ± 2.8325.26 ± 2.76
A26.93 ± 3.0127.19 ± 1.8427.29 ± 2.1827.46 ± 1.61
(Hz)p0.2720.180.03*0.089
* Significant differences (p < 0.05).
Publisher’s Note: MDPI stays neutral with regard to jurisdictional claims in published maps and institutional affiliations.

