
Optimal Size of a Smart Ultra-Fast Charging Station


1
Department of Energy, Politecnico di Milano, Via La Masa 1, 20156 Milan, Italy
2
Research Group in Sustainable and Renewable Electrical Technologies, Department of Electrical Engineering, Higher Technical School of Engineering of Algeciras (ETSIA), University of Cadiz, 11202 Cadiz, Spain
*
Author to whom correspondence should be addressed.
Electronics 2021, 10(23), 2887; https://doi.org/10.3390/electronics10232887
Submission received: 24 October 2021
/
Revised: 13 November 2021
/
Accepted: 18 November 2021
/
Published: 23 November 2021
(This article belongs to the Special Issue Electric Vehicle Charging: Technologies and Issues)
Abstract
:An ever-increasing penetration of electric vehicles (EVs) on the roads inevitably leads to an ever-stringent need for an adequate charging infrastructure. The emerging ultra-fast charging (UFC) technology has the potential to provide a refueling experience similar to that of gasoline vehicles; hence, it has a key role in enabling the adoption of EVs for medium-long distance travels. From the perspective of the UFC station, the differences existing in the EVs currently on the market make the sizing problem more challenging. A suitably conceived charging strategy can help to address these concerns. In this paper, we present a smart charging station concept that, through a modular DC/DC stage design, allows the split of the output power among the different charging ports. We model the issue of finding the optimal charging station as a single-objective optimization problem, where the goal is to find the number of modular shared DC/DC converters, and where the power rate of each module ensures the minimum charging time and charging cost. Simulation results show that the proposed solution could significantly reduce the required installed power. In particular, they prove that with an installed power of 800 kW it is possible to satisfy the needs of a UFC station composed of 10 charging spots.
1. Introduction
Electric mobility has become a key component of the energy transition. Indeed, the attention and the diffusion of Electric Vehicles (EVs) is growing fast, since they represent an effective option to reduce greenhouse gas emissions and other environmental and economic concerns [1]. The increasing penetration of EVs, leads to an ever-growing demand for Ultra-Fast Charging Stations (UFCS) which are required to fulfill EVs batteries particularly when long-medium distance travels are performed. This type of charging system has proved to positively affect the range anxiety related to EVs [2]. Nonetheless, compared with the well-established conventional fueling stations, these type of charging facilities are not suitably available everywhere. Thus, in order to enable EV adoption, many governments are providing a large number of investments in fast-charging stations to promote transportation electrification [3]. For instance, in September 2019, South Korea announced nearly USD 900 million for the e-mobility subsidies; out of the total amount, USD 609 million is planned to be used for the development of EV charging infrastructure. Similarly, in June 2020, Tata Power announced its plan to expand the EV charging network in India by over 700 by the end of the year 2021. However, to make the presence of UFCS widespread, several issues should be addressed: their locations, operation and installation costs, and how to optimally size the overall station and each port within it. Moreover, given the high power levels at stake within this type of charging infrastructure [4], also the problem of their impact on the grid and of the optimal management [5] of the charging procedure, these issues should be addressed; however, this is not in the purpose of this paper.
As the name suggest, Ultra-Fast Charging Stations main aim is to charge EVs batteries as fast as possible [6]. However, given the differences in terms of battery characteristics that exist on the EVs currently on the market, some critical aspects emerge in the choice of the optimal size of the overall station, and of the power rating of individual charging points within the station [7]. For instance, the charging curves of the top sell electric cars to date are reported in Figure 1.
UFCS must simultaneously meet the needs of many different battery specifications of EVs and ensure they fully satisfy every single power capability. To make the concept clearer, let us consider, for instance, a UFCS composed of 120 kW chargers. On one hand, if a BMW i3 is connected to a charging point of the station, the corresponding charger will be able to charge at the maximum rate of the vehicle, resulting however in low efficiency, due to the low load operating condition. On the other hand, if an Audi e-Tron is connected, then we can conclude that the charging station cannot entirely satisfy the power capability of such a model. In addition, assuming there are three vehicles that need 40 kW maximum charging power, each 120-kW port can only meet the demand of a car, even if the maximum power of 120 kW can be achieved. Another limitation of a non-modular system is its poor expansion capability; as a matter of fact, in the future more vehicles are expected to have high charging powers. Therefore, it is urgent the definition of a smart charging system includes the solving of the above-mentioned problems. To address these problems, in this paper, a smart charging system based on the parallel connection of modular DC/DC converters is proposed.
Input-Parallel–Output-Parallel (IPOP), DC/DC conversion systems have been drawing more attention in recent years and have been extensively used in various high-power applications. For instance, the use of paralleled modular converters has been widely adopted to perform the connection of multiple distributed generators (based on renewable energy sources such as photovoltaic panels, wind generators, and fuel cells) in all the DC-grid technologies [6,7,8,9]. As a matter of fact, in this field, the IPOP configurations allow an increase in efficiency since it provides scalability of the generated power.
For the above-mentioned charging issues, and for all its advantages, the modular configuration is gaining attention also in the field of charging systems. For instance, in [10] the authors have implemented a modular EV charger composed of H-bridges and bi-directional isolated Dual-Half Bridges (DHB) connected in Input-series-output-parallel (ISOP) configuration. The architecture is incorporated with split battery units, which operate as active power buffers, consequently increasing the power density. In [11] the authors propose a topology consisting of several IPOP-connected identical modules based on Series-Resonant Converters with Clamped Voltage Capacitor (CVC-SRC). The block diagram of the proposed architecture is shown in Figure 2. As shown, by modifying the number of modules, the power delivers to the connected EV’s battery can be scaled. Finally, in [12], a modular Input-Series Output-Parallel (ISOP) DC-DC converter for EVs fast charger is proposed and its control for equal power sharing is deeply analyzed. However, in all the listed literature, the scalability always refers to a single charging port. Instead, in this work, the scheme of a scalable and modular charging station composed of more charging ports is proposed.
There are two main challenges that need to be tackled in a modular DC/DC conversion system. The first issue concerns the voltage stability and current balance problems of each module that arise because of the presence of differences in the various module parameters in real applications [13]. To guarantee the correct operation of parallel–parallel DC/DC conversion systems, the balance between the modules must be ensured, i.e., voltage stability and proper sharing of the output current among the converters parallel connected at the output side. Many previous studies have addressed this issue [14,15,16,17]. Specifically, various output current sharing approaches have been proposed, and they can be divided mainly into two categories: passive droop [17] and active-sharing methods [18]. Systematic and comprehensive classification of all possible voltage and current sharing control strategies for IPOP systems is given in [15]. The second challenge is the physical implementation of the control structure for the overall control of the system. Since the considered system consists of several modules, the control structure is generally classified as either a centralized control structure or as a distributed control structure. The decentralized structure has the advantage of being more flexible and provides a higher scalability; indeed, it doesn’t require a central controller or communications between the modules [19]. Nevertheless, the most suitable control structure depends also on the chosen communication topology. Some examples of different communication topologies are the single bus communication architecture [20], the master-slave distributed architecture [16,21], and the ring architecture [22].
This paper proposes a new approach for the design of extreme fast-charging stations. The proposed architecture features high flexibility capacity: it adapts well to the currently existing differences in EVs performances and specifications, and, at the same time, it can be easily upgraded for the future requirements of EVs. Then, the problem of planning the optimal size of the charging station power stage is addressed. The problem is formulated as a single objective optimization problem, which is finally solved by a genetic algorithm (GA) and aims to minimize the electrification costs as well as the power unsupplied to the EVs connected to the station. The proposed approach has been applied to A1 Italian highway and the size of the UFCS in different scenarios has been discussed.
Our contributions in this paper can be summarized as follows:
- A novel UFC station modular architecture is developed to overcome the too-low flexibility of existing fast charging systems.
- An optimization algorithm is developed to size the components of the proposed architecture so that the individual charging port capacity and the overall power of the charging station are not a priori chosen values.
- The sensitivity analysis is performed to demonstrate the impacts of various parameters on the optimal solution.
The rest of the paper is organized as follows: Section 2 presents the architecture of the smart UFC station; Section 3 formulates the optimal sizing problem for the presented station; the proposed solution is further investigated through a case study in Section 4; and a sensitivity analysis is performed in Section 5. Lastly, the conclusive observations are given in Section 6.
2. System Architecture
To meet the charging needs expressed in the previous section, a novel modular and reconfigurable UFCS architecture is here proposed (Figure 3).
The secondary winding of the Line-Frequency (LF) transformer supplies the common AC/DC stage. A DC bus approach has been used mainly because it allows easier integration of Renewable Energy Sources (RES) and Battery Energy Storage Systems (BESS), which can mitigate many critical aspects of such a charging station. Moreover, in a modular system, having a common AC/DC conversion stage reduces the number of components to be replicated, thereby reducing the cost. The LF transformer and the common AC/DC converter can be substituted with the emerging technology of Solid-State Transformer (SST), which is basically a multi-stage power electronic converter that transfers the power in different forms (AC/DC) with voltage modulating features. Depending on the nature of power requirements (AC or DC), the number of stages is defined. High-frequency transformer links with multi-stage power electronic converters help in reducing the size and weight of the entire charging system.
The DC/DC stage is then composed of N + M base modules. Each module embeds the DC/DC power conversion stage and the control part. The power base modules in the systems are equal and can be paralleled to provide higher charging current and, hence, charging power rates. The power modules are defined as “fixed modules” because they can be used only by the p-th corresponding charging port (CPp); hence, each module charges a single battery independently. If the power demands of the connected vehicles are lower than the rate of the base modules, then the respective fixed modules work in stand-alone mode. Therefore, this also means that a power equal to the power rate of the base module is always guaranteed to each vehicle connected to the station, and it also means that the number of fixed modules equals the number of charging points of the station. The rating of the base module is determined through a Genetic-Algorithm-based optimization, described in the next section. The modules, instead, are called “shared modules” since they can be shared between all the charging ports, thanks to the presence of the smart relays/switches. The module can be paralleled only with one module at a time.
Because the system is modular and reconfigurable, as the power capabilities of the next-generation electric cars rise, additional power modules can be added to expand the power capacity of the entire system.
2.1. DC-DC Converter Topology
The power converter modules can be implemented using a variety of different configurations and topologies. However, in the choice, it must be kept in mind that for multiport charging stations, IEC 61851-23 expressly requires galvanic insulation between each individual output [23]. Moreover, since UFC stations aim to recharge EV batteries within the shortest possible periods of time, only unidirectional dc-dc converters will be considered. Figure 4a,b illustrates the most common typologies of isolated DC/DC converters for modular fast-charging applications.
In Figure 4a, an LLC resonant converter is fully depicted. This type of isolated dc-dc converter seems the most suitable choice for a modular ultra-fast charging station because of its many advantages, such as the ability to operate at Zero-Voltage Switching (ZVS) or Zero-Current Switching (ZCS), a wide output voltage regulation, and very high efficiency. Moreover, in [24] authors propose an iterative design procedure for an LLC resonant converter that has to be used in a modular and reconfigurable 60-kW DC/DC conversion stage for EV ultra-fast battery charger.
In Figure 4b, a phase-shift full-bridge (PSFB) converter is shown. The phase shifted full bridge (PSFB) belongs to the family of Dual Active Bridge (DAB) converters where the active switches on the secondary are replaced with diodes. Due to this, it allows only unidirectional power transfer. The choice of DAB is made keeping in mind its inherent advantages such as soft-switching, high power density, and simple controller structure.
A more complete review of DC/DC converters topologies for UFC can be found in [25].
2.2. System Controller Unit
The system controller is connected to each of the base modules, relays, and charging ports, via a communication bus. The charging port (CP) collects the necessary charging parameters from the battery management systems (BMSs) of the connected EVs and sends such information to the system controller unit (SCU), which sets the relays configuration and the charging modules, accordingly. Therefore, for this application a centralized master-slave control method has been chosen. The master-slave architecture brings numerous benefits in terms of its clear division of the control function and the small communication delay from a master controller to a slave controller [26]. However, the cost of such a communication system is quite high. Moreover, the number of communication ports on the master module increases with the number of the modules, thus increasing communication burden and the cost of the master module.
The data sent by the CP to the SCU are the required charging power () and the battery voltage () of the connected vehicles. If the results are zero, it means that to the p-th charging port is not connected to any vehicle. Therefore, in each i-th interval of time, the information in (1) will be sent to the SCU.
3. UFCS Size Optimization
In this section, a Genetic-Algorithm (GA) optimization-based method available in the MATLAB optimization toolbox is used to size the power rating of the base modules as well as the number of shared modules N in the proposed charging station configuration. The optimization algorithm aims to minimize the infrastructure cost on one side, and the penalty related to the “unsupplied” power to the connected electric cars on the other side.
3.1. Objective Function
The objective function to be minimized is the costs related to the conversion stage of the UFCS () in a T scheduling horizon. Since the optimization problem starts from the assumption that the presence of an UFCS in the assumed site is deemed necessary, the objective function does not consider all the other cost related to the operation, construction, and maintenance of the overall UFCS but only the initial costs related to the power conversion system. The objective function is formulated as follows:
where and are the hardware and installation costs of the base modules and power switches weighted in T, respectively. Lastly, represent the penalty coming from the electric vehicles connected to the UFCS, which charges at limited power.
The overall costs of the modular stage are computed in (3) and (4).
However, knowing the scheduling horizon T expressed in days and considering the charging station lifespan Y in years, we get the weighted costs in (5) and (6).
To attribute a penalty cost to the possible power limitations , imposed by the UFCS on the vehicles charging power, the first step is an x-axis change of the charging profile, which is usually given as a function of the battery state of charge. Therefore, the charging speed as a function of time of is obtained by applying the following Formula (7).
In this study, only the time needed to go from 10% up to 80% is considered. This is mainly due to the fact that beyond a SOC of 80% the charging rate slows dramatically.
The next step is the discretization of the charging profiles in time interval d length.
An example of the output of Algorithm 1 is depicted in orange in Figure 5, which represents the vector [1 × 20] in (8).
| Algorithm 1 discretization of charging profile |
| ,, |
| ; |
| 4: Procedure |
| 10: end |
| 12: end |
A list of the different EVs model considered in the optimization process is created. Such a list is composed by electric vehicles, which are randomly chosen among the selected models. However, to approach the real market, the percentage of each model is introduced in the algorithm as . This will allow us to get a list that better approximates the real EV fleet in the studied area.
Algorithm 2 returns a structure composed of two columns and lines, which represent the randomly selected EV’s list that will be charged at the considered charging station. The first column contains the vectors of the discretized charging power rates , and the second column specifies the name of the EV model at which the charging profile belongs.
| Algorithm 2 creation of the EVs’ queue to be charged |
| 4: Procedure: |
| of random integer number from 1 up to 100: |
| 9: end |
| 15: end |
| 16: end |
| 18: end |
Finally, to find the penalty cost, the connecting time of the vehicles is computed according to their maximum capability, which means the charging curve is allowed by the BMS (Figure 1) and kept constant regardless of whether the charging station provides the required power rate or not. For instance, if a Hyundai Kona arrives with a SoC of 10% to the UFCS, its expected charging time to reach 80% according to the charging curve provide by the BMS (Figure 5) is about 41 min, therefore, it is assumed that the e-car will stop at the station for that fixed amount of time, and if the UFCS does not provide the required power level, then the difference between the value of required power and supplied one turns into unsold energy.
Another factor that must be taken into account at this point is the occupancy rate of the station during the scheduling horizon considered in the optimization. This variable depends on many factors, such as the stochastic behavior of e-vehicle drivers, the number and the length of the performed journeys, the position, and the type of charging infrastructure. In the literature, many works try to assess the EVs’ load demand throughout a day for different types of charging infrastructure. For instance, in [27] the authors generate a schedule for the charging events starting from real-world travel data collected through GPS. In contrast, in the authors forecast, the EV charging demand starts from big data containing historical real-world traffic data.
In this work, the parameter is defined as the occupation interval of time (hours) of the station charging points. For instance, a value of equal to 18 means that only 10% of the charging points of the station are assumed occupied for 18 h over the operation horizon. Therefore, it holds:
Instead, is the number of d-length intervals of time in which the station is occupied at the occupation rate and it is computed through (11). Keeping on with the previous example and considering a time interval of 2-min length, then 18 h corresponds to a equal to 540.
For the computation of the overall penalty cost, the matrix containing the charging powers delivered each d minutes by each occupied charging ports must be computed. Such a matrix is denominated and it has CP lines and columns, however only the lines from 1 up to contain values different from zeros.
The matrix has been built by considering the queuing process represented in Figure 6. The UFCS is equipped with CP charging ports and a certain number of them are occupied . Once a charger among the becomes available again in the time interval i, the next EV in the list is served in the now free charging point. In this way, the station is assumed occupied at a rate for a time interval of . When the occupancy rate changes, the number of occupied charging ports is modified too, but the occupation policy remains the same and the EV list continues without being updated. Therefore, as a scheduling policy, we consider the first- come-first-serve (FCFS) policy. In FCFS, the EVs are prioritized based on their arrival time.
The procedure must be repeated for all the considered values of , and this implies that there will be as many as the values considered. The procedure used to assess is represented in Algorithm 3.
| Algorithm 3 Estimation of the output power of each charging column |
| 3: Initialization:, % h represents the progression of the EVs in the list |
| 4: Procedure: |
| 5: In case of rational result, the number of occupied charging ports is rounded to the next whole integer. |
| 6: for |
| 9: end |
| 14: end |
| 15: end |
| ) = 0; |
| %random initial state of charge |
| ; |
| ; |
| 25: end |
| 26: end |
| 27: end |
| =; |
| 30: end |
| ; |
| 32: end procedure |
Once is computed, the penalty cost can be found by following the flowcharts in Figure 7 and Figure 8. Mainly, the procedure compares, in every interval of time, the overall power required by the EVs connected to the station with the possible deliverable one, considering the availability and the power supplied by both the fixed and shared modules. Thus, if the demand in the i-th interval of time is satisfied, the value of unsupplied power is nil, otherwise the value of unsold energy is equal to the unsupplied power times the length d of the interval of time. Finally, the overall unsold energy is computed, summing the energy of each interval of time and the penalty cost by multiplying by the energy price.
The full procedure to achieve is explained below step-by-step. In the first place, through the process in Figure 7, we arrive at the matrix , which has the same dimension of , since it is obtained by subtracting to every element of the power provided by the CP fixed modules of power rate .
The next step aims to obtain from the power the station cannot provide to the connected vehicles. Therefore, the must be removed from the power delivered by the shared modules; however, always remembering the number of shared modules is limited at N, and if one shared module is used for the p-th charging port in the i-th interval of time, then it cannot be used in other ports. Following the flowchart reported in Figure 8, we arrive at the vector specifying the unsupplied power from the station in every i-th. Then, by summing the power missing in each interval of time, we ascertain the overall power unsupplied when the station is at an occupancy rate of . Summing all the cells of the vector we ascertain the overall power unprovided when the station is occupied at .
Repeating the procedures in Figure 7 and Figure 8 for every rate and by multiplying the power missing at each occupation rate for the length d of the intervals of time (12) we arrive at the unsupplied energy in kWh . Summing all the (13) the unsold energy during all the considered T horizon interval is carried oud. Lastly, we can compute the penalty cost through (14).
3.2. Optimization Constraints
The objective function is subjected to the following constraints.
The constraint (15) indicates that both the outputs of the optimization, the number of shared modules and the power rate of each base module, must have positive integer values. Constraint (16) instead determines that the power rate of the base module and can vary in the range 10 kW up to 100 kW. Finally, in (17) the number of shared modules is limited to the number of fix modules.
3.3. Optimization Algorithm
One of the most used heuristic methods to solve single-objective optimization problems characterized by many stochastic variables is the genetic algorithm (GA) [28]. The fundamental law of GA is to seek optimal solutions using an analogy with the theory of evolution. The basic GA steps are shown in Figure 9. The MATLAB software, precisely its optimization toolbox in which GA is already embedded, is used to run the proposed optimization.
4. Numerical Simulation
In this section all the input parameters of the proposed sizing model are reported.
4.1. EVs Fleet
To find the optimal size of the charging station, first the creation of a EVs fleet is necessary. Since the power modules of the architecture can be connected only in parallel, in this study, only electric cars will be assumed. In fact, electric heavy-duty vehicles are expected to have much higher battery voltage (650 V average for electric buses) than electric cars (average battery voltage about 350 V), therefore, to be connected to the same charger of electric cars, a series connection of at least two modules is deemed necessary, but this characteristic is not integrated in the proposed architecture design, so far.
Many differences exist also in different models of electric car such as: battery voltage, battery capacity, maximum allowed charging rate, consumption, etc. To take into account these differences, 11 different electric car models, among the top selling one in Europe, have been included in the fleet of this study. The models are listed in Table 1 with their main characteristics and their charging curves are reported in Figure 1.
Finally, the charging curves of the considered vehicles have been discretized in time intervals 2-min length (d) as shown in Figure 10a. The electric cars are assumed to arrive at the station with a random initial SOC between 10% up to 40%, and if the charging station can provide the maximum charging power required by the vehicle, then it will charge the battery up to 80%.
Following Algorithm 2, a list of 50,000 ( electric cars is then created, assuming the probability values shown in Figure 10b, extrapolated from the car models sold in Italy up to September 2020.
Even if there is a huge difference in terms of allowed maximum charging power, it must be noticed that, because of chemical technical limits of today EVs batteries, the maximum c-rate allowed by the cell/car manufacturer is always in the range 1.5C–2C; therefore, the minimum allowed recharging times, no matter the power provided by the charging infrastructure, results in being in the range of 30–40 min for a refill from 10% up to 80% of SOC. For instance, Tesla Model 3 LR allows a maximum charging power about 150 kW, but it is equipped with a battery capacity of 95 kWh; hence, its maximum c-rate results about 1.58. Instead, if we consider a Mini Cooper-e, the maximum allowed charging power is 50 kW; however, in this case the car is equipped with a battery of about 30 kWh, which means that the maximum c-rate is 1.73.
4.2. Parameters
A case study with the parameters assumptions in the Table 2 has been simulated. The operation horizon of the optimization problem is one week with a time interval of 2 min (T = 5040).
The site of installation has been assumed along the A1 motorway in Italy, since this type of charging station is necessary where medium-long distance travels are more likely. In this road, the peak traffic period is the first week of august. For this week, the assumed occupation rate of the considered charging station is reported in Figure 11.
The GA optimal solution resulted in an optimum base module power rating of 47 kW and a number of 7 shared modules, for a minimum optimization function value of 880 €. This means that the overall installed power would results about 800 kW.
5. Sensitivity Analysis
The problem formulated for optimal sizing of UFCS contains various uncertain factors such as the energy price, hardware and installation costs, and utilization rate. Therefore, in this section, the analysis of the impact of these varying parameters on the size of the UFCS is carried out.
5.1. Energy Price
So far, in the existing UFCS, a price-based charging strategy is not applied. Indeed, the EV owner connects their vehicle to these stations for an average time of half an hour and cannot choose at what time of day to connect. Therefore, for this type of infrastructure, it is not possible to shift the power demand through hourly rates. Nevertheless, different UFCS manufacturers and operators can apply very different rates in their own facilities. For instance, Ionity, a high-power charging station network for electric vehicles to facilitate long-distance travel across Europe, prior to 31 January 2020, charged a fixed rate of 8 Euros per charge, yet, in contrast, with the new pricing structure, owners are billed per kWh and the cost has now surpassed €0.79 per kWh. Pricing to use a Tesla Supercharger may vary by location, and prices may change from time to time; however, the average price in Europe is about 0.32 €/kWh. However, it worth mentioning that Tesla supercharger can be used only by Tesla owners. Finally, Fastned ultra-fast charging station can be used by paying 0.59 €/kWh. Therefore, we can conclude that the charging cost for this type of infrastructure varies in a range from 0.32 up to 0.79 Euros per each kWh.
The variation in the optimization parameters as a function of the energy price variations are depicted in Figure 12. As shown, the increase in the electricity selling prices to the EV user does not strongly affect the size of the architecture. For instance, if the price doubles passing from 0.32 € up to 0.79 € per kWh, the rated power of the module increase of only 1 kW and the number of shared modules N undergoes a rise of just 1 unit. All this is due to the fact that by increasing the price of the recharging process for the customer, the importance of the “loss” for the owner of the station (i.e., the penalty cost value) in the event of energy not supplied to the vehicles also increases.
5.2. Hardware and Installation Costs
The installation of EV ultra-fast chargers normally requires a massive site preparation and electrical infrastructure. For this reason, fast-charging hardware represents only a portion of costs, and the total cost of installing fast-charging stations can vary substantially based on the site. Because these variances are inherently local, exact labor costs and infrastructure needs in addition to hardware and materials must be assessed on a site-by-site basis. In [29] authors have demonstrated that installing a high number of charging stations per location will result in lower per-station costs, because of the ability to amortize increased electrical infrastructure over additional stations. Therefore, in the following, the impact of the number of charging spots inside the stations on the size and the number of modules is estimated through three different scenarios. In the first case, the number of spots in the charging station is fixed at six in the first scenario, at 10 in the second, and at 20 in the last one. The hardware and installations costs per kW along with the obtained results of these three different scenarios are reported in Table 3. As shown, the power rate of the base module does not undergo significant variations; this is due to the fact that the size of the base module has to be a submultiple of the EVs charging power values and, therefore, it is not influenced by the number of charging spots.
5.3. Occupancy Rate
Charging station occupancy ratio varies throughout the day and throughout the year. So far, the occupancy rate in the holiday period in August has been considered in order to size the station for the worst-case scenario. Nevertheless, the occupancy rate during a typical week not corresponding to some holiday is expected to be far different from that represented in Figure 11, and similar to the one shown in Figure 13.
Simulating the above mentioned occupancy rate in the GA optimization, the solution obtained corresponds to an optimum base module power rating of 46 kW and a number of 7 shared modules, for a minimum optimization function value of about 822 €.
5.4. Future Battery Characteristics
Fast-charging speed is linked with developments in electric vehicle battery technology and vehicle range. The chemical technology of EV battery, its capacity and its cooling system are the main limits to the maximum charging rate, that is the speed at which the battery SOC can advance from empty to approximately 80%. Higher capacities, more advanced pack designs, and better cooling systems are expected in the battery packs of the future, which therefore will accept ever higher charge rates. Based on a variety of industry announcements, using variants of current battery chemistries and pack designs, the charging time is expected to be reduced below approximately 14–16 min to charge up at 80%. To translate this trend in the optimization problem, the charging profiles of the EVs are modified as shown in Figure 14. The battery of the future EVs is assumed to be able to receive double the current charging rates, and hence complete the charging process from 20% up to 80% of the SOC in half the time employed to date.
Doubling the acceptable charging rates of the EVs batteries results in the maximum number of shared modules (10 units) and in a power rate of the base module about 50% higher (75 kW) with respect to the scenario with the current charging profiles. Therefore, in this scenario, the overall installed power in the station should be increased at 1.5 MW.
6. Conclusions
The UFCS presented herein is modular and reconfigurable to provide selectable output power ratings for the different electric cars on the market. It is capable of flexible multiport rapid charging with a mix of charging speeds available at the charging site. The UFCS includes power base modules that can be paralleled and hence share power among the group of chargers to satisfy the mix of vehicles that arrive with the ability to charge at their maximum power acceptance rate. The rating of the base module, as well as the number of “shared modules”, is obtained through a GA-based optimization that minimizes the infrastructure cost and the amount of unsupplied power to the EVs.
The results of the optimization show that for a charging station installed along the Italian A1 highway and composed of 10 charging poles, the optimal size would be 800 kW, thus distributed: 10 fixed modules of 47 kW and an additional amount of seven shared modules. The sensitivity analysis shows that the power rate of the base module is almost stable upon the variation in many parameters such as the occupancy rate of the station, the selling price of the energy, the installation and hardware costs. However, in the future, as more batteries will be able to accept higher power rates, both the number of shared modules and the base power rate must increase in order to satisfy the growth of the demand.
An UFCS so designed resolves several limitations and drawbacks of existing extreme fast-charging stations. However, it is well known that the charging demand of EVs in a fast-charging station can considerably increase the network peak load and lead to higher utility service cost and serious stability problems for the distribution network. For these reasons, the next step of this research will focus on integrating the proposed charging system architecture with Renewable Energy Sources (RESs) and an Energy Storage System (ESS).
Author Contributions
Conceptualization C.L. and M.L.; methodology C.L.; software C.L.; formal analysis C.L.; investigation C.L.; resources C.L. and M.L.; writing—original draft preparation C.L.; writing—review and editing L.M.F.-R. and C.L.; project administration, M.L. All authors have read and agreed to the published version of the manuscript.
Funding
This research received no external funding.
Conflicts of Interest
The authors declare no conflict of interest.
Nomenclature
| Acronyms | |
| EV | Electric Vehicle |
| UFC | Ultra-Fast Charging |
| UFCS | Ultra-Fast Charging Station |
| LP | Linear Program |
| SOC | State Of Charge |
| SCU | System Control Unit |
| Index | |
| m | fixed modules index |
| n | shared modules index |
| p | charging port index |
| i | Time intervals index |
| k | electric vehicle model index |
| j | time instants index |
| h | electric vehicles in the queue index |
| Parameters | |
| M | number of fixed modules |
| CP | number of charging ports in the station |
| number of EV models considered in the optimization process | |
| number of EVs considered in charging queue | |
| T | operation horizon [days] |
| d | time interval length [min] |
| number of time intervals in the operation horizon ( | |
| charging profile of the k-th EV model [kW] | |
| power required in the time interval i-th by the EV connected to the p-th charging port [kW] | |
| power required in the time instant j-th by the h-th EV [kW] | |
| power required in the time instant j-th by the k-th EV model [kW] | |
| power required in the time interval i-th by the k-th EV model [kW] | |
| power supplied in the time interval i-th to the EV connected to the p-th charging port [kW] | |
| battery voltage in the time interval i-th of the EV connected to the p-th charging port [V] | |
| occupied charging ports | |
| fixed module | |
| shared module | |
| per-unit cost of connection and switch [€] | |
| per-unit cost of power electronics [€/kW] | |
| BM | base modules overall cost |
| PS | relays and connections between modules cost |
| base modules cost in the considered operation horizon | |
| relays and connections between modules cost in the considered operation horizon | |
| battery capacity of the k-th EV [kWh] | |
| Penalty cost of unsupplied power | |
| Overall power of the charging station [kW] | |
| Y | charging station lifespan [years] |
| expected charging time of the k-th EV to go from 10% up to 80% of SOC | |
| initial SOC of the k-th EV [%] | |
| final SOC of the k-th EV [%] | |
| occupation percentage of the station charging points [%] | |
| occupation interval of time [h] | |
| number of d-length interval of time in which the station is occupied at | |
| cost of the charging energy [€/kWh] | |
| Optimization Variables | |
| base module rated power | |
| N | number of shared modules |
References
- Vithayasrichareon, P.; Mills, G.; Macgill, I.F. Impact of electric vehicles and solar pv on future generation portfolio investment. IEEE Trans. Sustain. Energy 2015, 6, 899–908. [Google Scholar] [CrossRef]
- Wang, L.; Qin, Z.; Slangen, T.; Bauer, P.; van Wijk, T. Grid impact of electric vehicle fast charging stations: Trends, standards, issues and mitigation measures—An overview. IEEE Open J. Power Electron. 2021, 2, 56–74. [Google Scholar] [CrossRef]
- Policies to Promote Electric Vehicle Deployment—Global EV Outlook 2021—Analysis—IEA. Available online: https://www.iea.org/reports/global-ev-outlook-2021/policies-to-promote-electric-vehicle-deployment (accessed on 20 October 2021).
- Chen, Z.; Ma, L.; Liu, P.; Li, Z. Electric vehicle development in China: A charging behavior and power sector supply balance analysis. Chem. Eng. Res. Des. 2018, 131, 671–685. [Google Scholar] [CrossRef]
- Aziz, M.; Oda, T.; Ito, M. Battery-assisted charging system for simultaneous charging of electric vehicles. Energy 2016, 100, 82–90. [Google Scholar] [CrossRef]
- Tu, H.; Feng, H.; Srdic, S.; Lukic, S. Extreme fast charging of electric vehicles: A technology overview. IEEE Trans. Transp. Electrif. 2019, 5, 861–878. [Google Scholar] [CrossRef]
- Gjelaj, M.; Træholt, C.; Hashemi, S.; Andersen, P.B. Optimal design of DC fast-charging stations for EVs in low voltage grids. In Proceedings of the 2017 IEEE Transportation Electrification Conference and Expo (ITEC), Chicago, IL, USA, 22–24 June 2017; pp. 684–689. [Google Scholar] [CrossRef] [Green Version]
- Hassanzadeh, N.; Yazdani, F.; Haghbin, S.; Thiringer, T. Design of a 50 kW phase-shifted full-bridge converter used for fast charging applications. In Proceedings of the 2017 IEEE Vehicle Power and Propulsion Conference (VPPC), Belfort, France, 11–14 December 2018; pp. 1–5. [Google Scholar] [CrossRef]
- Yoon, H.; Kim, J.; Song, E. Design of a novel 50 kW fast charger for electric vehicles. J. Cent. South Univ. 2013, 20, 372–377. [Google Scholar] [CrossRef]
- Zarkab, M.; Sinh, B.; Panigrahi, B.K. Model predictive control for modular electric vehicle charger. In Proceedings of the 9th 2020 IEEE International Conference on Power Electronics, Drives and Energy Systems (PEDES), Jaipur, India, 16–19 December 2020. [Google Scholar] [CrossRef]
- Vuchev, S.A.; Arnaudov, D.D. Design considerations for stages of modular topology for fast charging of electric vehicles. In Proceedings of the 10th 2019 X National Conference with International Participation (ELECTRONICA), Sofia, Bulgaria, 16–17 May 2019. [Google Scholar] [CrossRef]
- ElMenshawy, M.; Massoud, A. Development of modular DC-DC converters for low-speed electric vehicles fast chargers. Alex. Eng. J. 2021, 60, 1067–1083. [Google Scholar] [CrossRef]
- Hu, T.; Khan, M.M.; Xu, K.; Zhou, L.; Rana, A. Design of an input-parallel output-parallel multi-module DC-DC converter using a ring communication structure. J. Power Electron. 2015, 15, 886–898. [Google Scholar] [CrossRef] [Green Version]
- Cheng, J.; Shi, J.; He, X. A novel input-parallel output-parallel connected DC-DC converter modules with automatic sharing of currents. In Proceedings of the 7th International Power Electronics and Motion Control Conference, Harbin, China, 2–5 June 2012; Volume 3, pp. 1871–1876. [Google Scholar] [CrossRef]
- Chen, W.; Ruan, X.; Yan, H.; Tse, C.K. DC/DC conversion systems consisting of multiple converter modules: Stability, control, and experimental verifications. IEEE Trans. Power Electron. 2009, 24, 1463–1474. [Google Scholar] [CrossRef]
- Qu, L.; Zhang, D.; Bao, Z. Output current-differential control scheme for input-series-output-parallel-connected modular DC-DC converters. IEEE Trans. Power Electron. 2017, 32, 5699–5711. [Google Scholar] [CrossRef]
- Han, Y.; Ha, J.I. Droop control using impedance of grid-integrated DFIG within microgrid. IEEE Trans. Energy Convers. 2019, 34, 88–97. [Google Scholar] [CrossRef]
- Garcerá, G.; Pascual, M.; Figueres, E. Robust average current-mode control of multimodule parallel DC-DC PWM converter systems with improved dynamic response. IEEE Trans. Ind. Electron. 2001, 48, 995–1005. [Google Scholar] [CrossRef]
- Sadabadi, M.S. A distributed control strategy for parallel DC-DC converters. IEEE Control Syst. Lett. 2021, 5, 1231–1236. [Google Scholar] [CrossRef]
- Kamnarn, U.; Yousawat, S.; Kanthaphayao, Y.; Chunkag, V. Design and implementation of the distributed control for parallel AC/DC converters. In Proceedings of the 2011 14th European Conference on Power Electronics and Applications, Birmingham, UK, 30 August–1 September 2011; pp. 1–9. [Google Scholar]
- Mazumder, S.K.; Tahir, M.; Acharya, K. Master-slave current-sharing control of a parallel DC-DC converter system over an RF communication interface. IEEE Trans. Ind. Electron. 2008, 55, 59–66. [Google Scholar] [CrossRef]
- Gong, L.; Dai, K.; Chen, J.; Huang, Y.; Kang, Y. Design and implementation of distributed control system for cascaded H-Bridge multilevel STATCOM. In Proceedings of the 2011 Twenty-Sixth Annual IEEE Applied Power Electronics Conference and Exposition (APEC), Fort Worth, TX, USA, 6–11 March 2011; pp. 1544–1551. [Google Scholar] [CrossRef]
- The British Standards Institution. BSI Standards Publication Electric Vehicle Conductive Charging System; The British Standards Institution: London, UK, 2014. [Google Scholar]
- Cittanti, D.; Vico, E.; Gregorio, M.; Mandrile, F.; Bojoi, R. Iterative design of a 60 kW All-Si modular LLC converter for electric vehicle ultra-fast charging. In Proceedings of the 2020 AEIT International Conference of Electrical and Electronic Technologies for Automotive (AEIT AUTOMOTIVE), Turin, Italy, 18–20 November 2020. [Google Scholar] [CrossRef]
- Du, Y.; Lukic, S.; Jacobson, B.; Huang, A. Review of high power isolated bi-directional DC-DC converters for PHEV/EV DC charging infrastructure. In Proceedings of the 2011 IEEE Energy Conversion Congress and Exposition, Phoenix, AZ, USA, 17–22 September 2011; pp. 553–560. [Google Scholar] [CrossRef]
- Panov, Y.; Rajagopalan, J.; Lee, F.C. Analysis and design of N paralleled DC-DC converters with master-slave current-sharing control. In Proceedings of the APEC 97—Applied Power Electronics Conference, Atlanta, GA, USA, 27 February 1997; Volume 1, pp. 436–442. [Google Scholar] [CrossRef]
- Brady, J.; O’Mahony, M. Modelling charging profiles of electric vehicles based on real-world electric vehicle charging data. Sustain. Cities Soc. 2016, 26, 203–216. [Google Scholar] [CrossRef]
- Sadeghi-Barzani, P.; Rajabi-Ghahnavieh, A.; Kazemi-Karegar, H. Optimal fast charging station placing and sizing. Appl. Energy 2014, 125, 289–299. [Google Scholar] [CrossRef]
- Ribberink, H.; Wilkens, L.; Abdullah, R.; McGrath, M.; Wojdan, M. Impact of clusters of DC fast charging stations on the electricity distribution grid in Ottawa, Canada. In Proceedings of the Electric Vehicle Symposium 30, Stuttgart, Germany, 9–11 October 2017. [Google Scholar]
Figure 1.
Charging profiles of different EVs.

Figure 2.
Electric scheme of IPOP architecture.
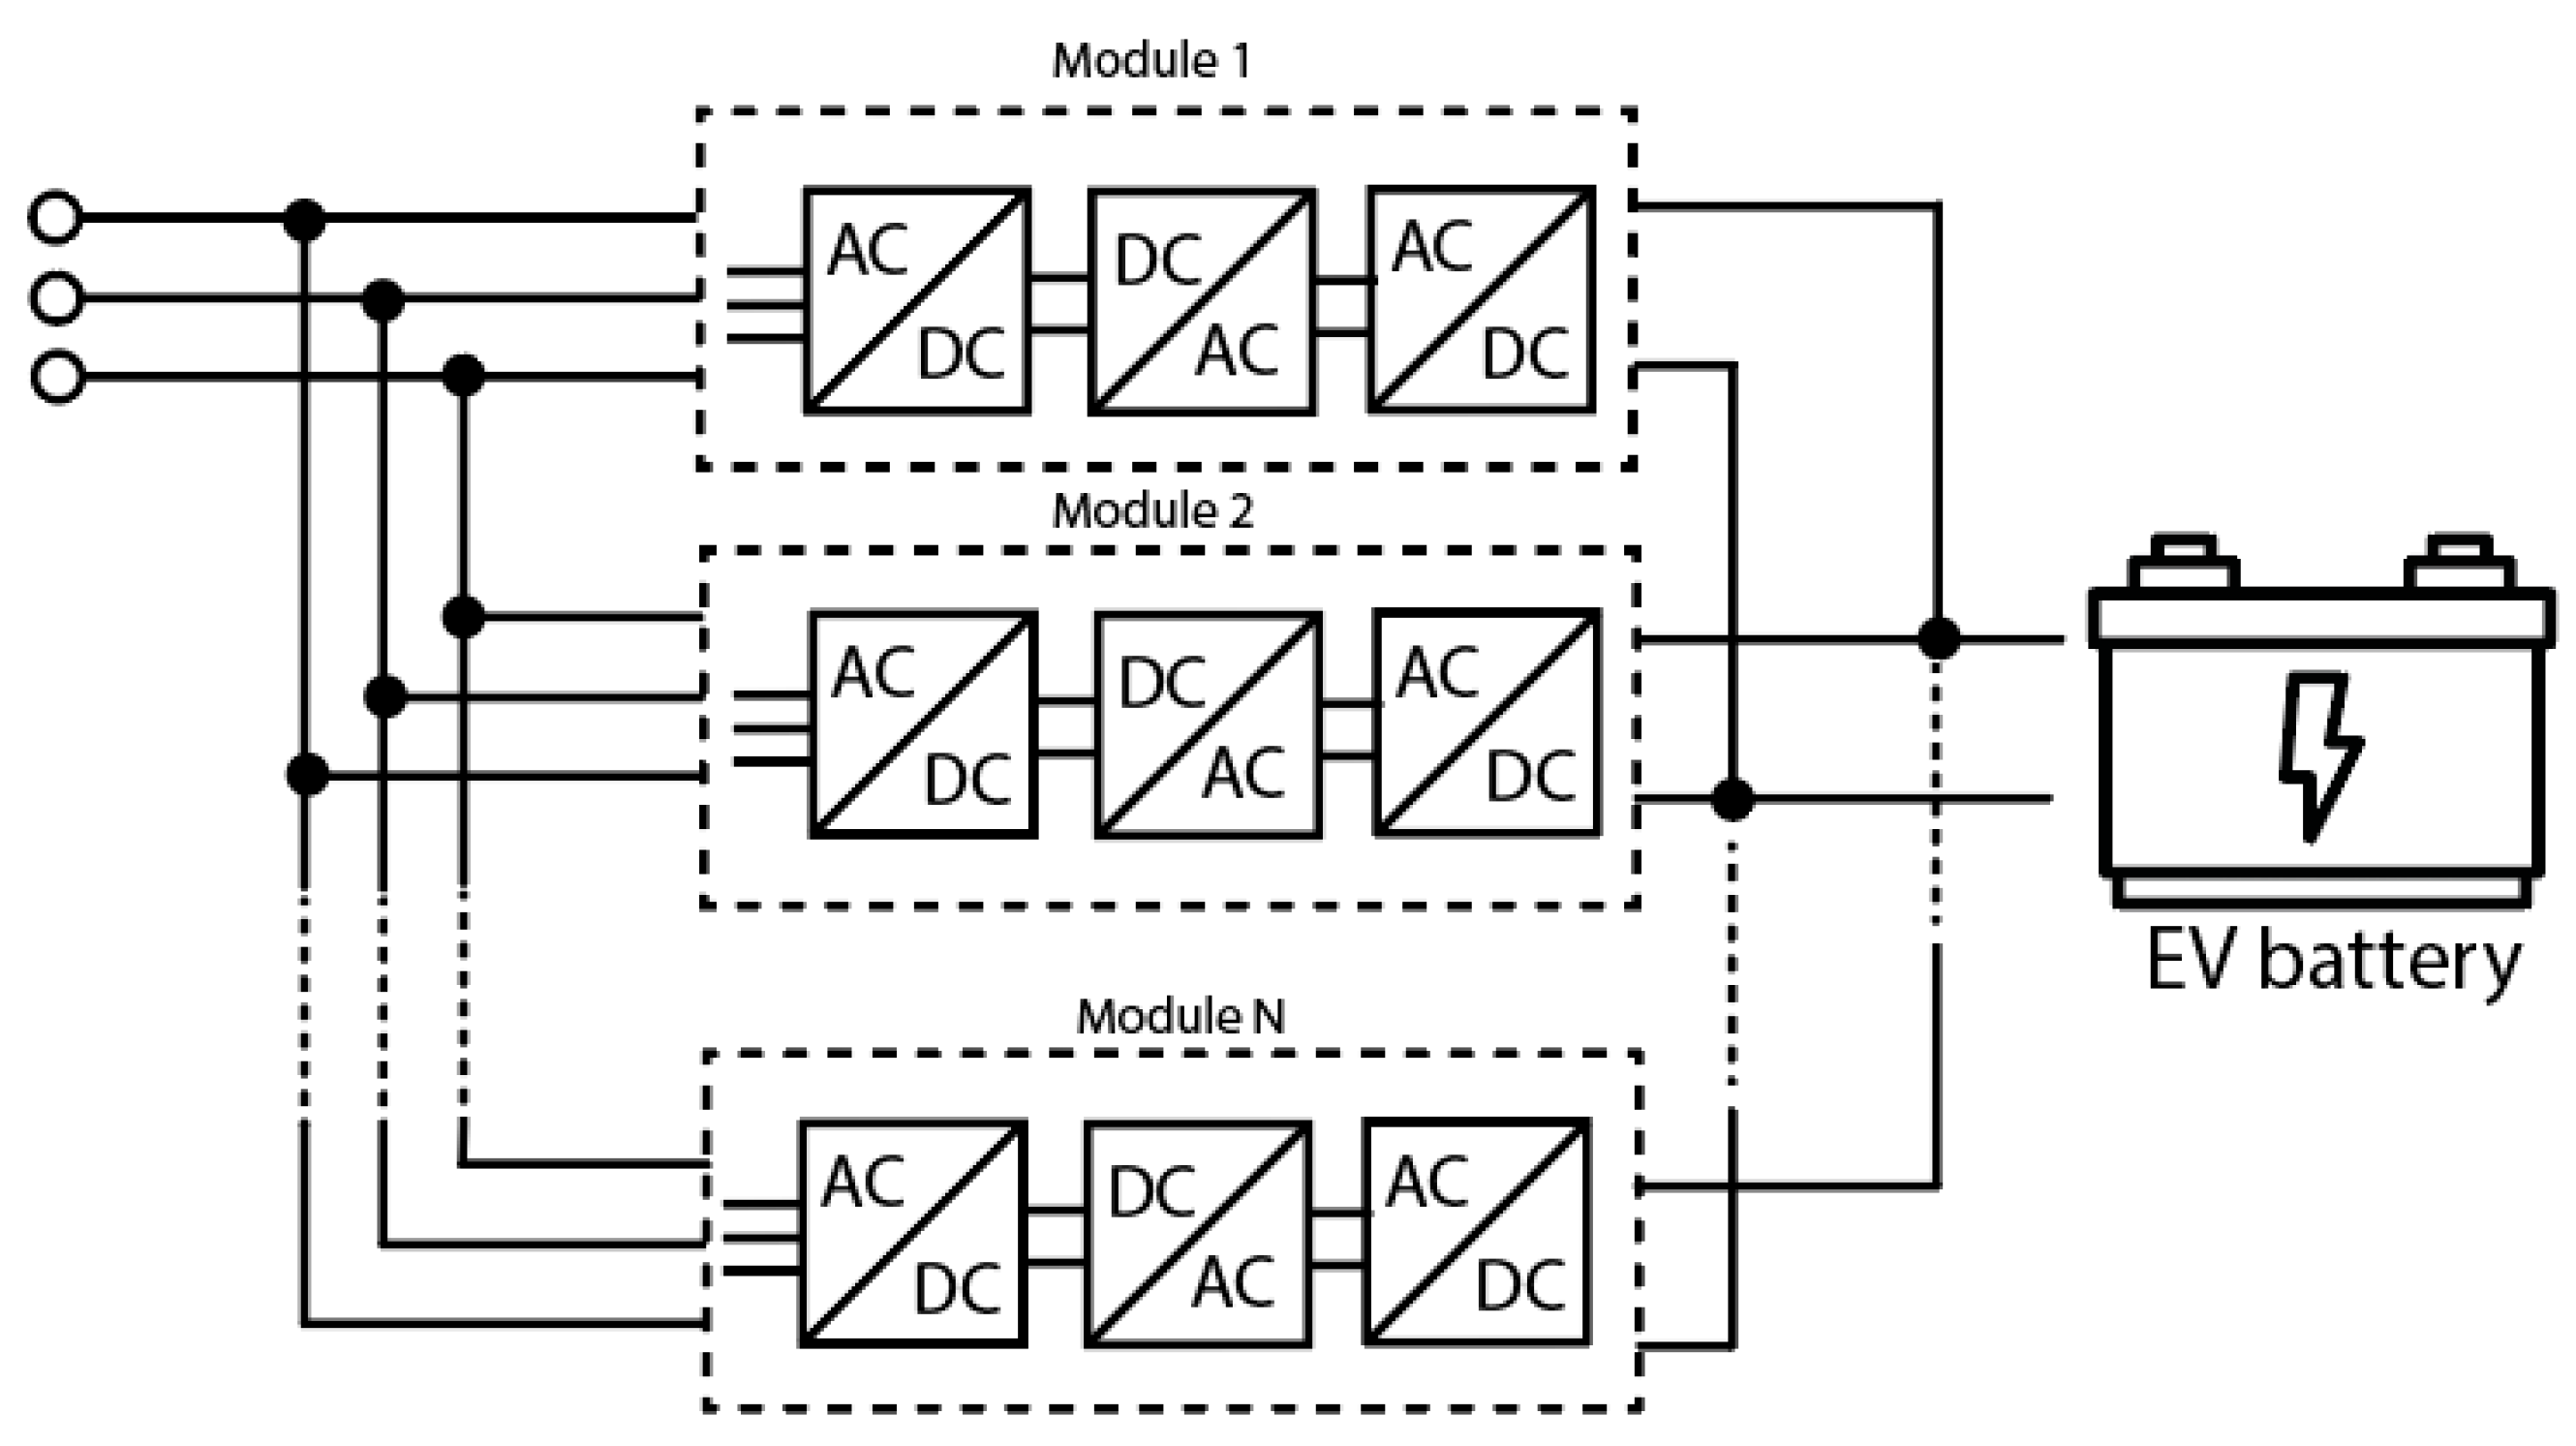
Figure 3.
Block diagram of the proposed modular UFCS.

Figure 4.
DC/DC converter topologies: (a) LLC resonant; (b) PSFB.

Figure 5.
Continuous (in blue) and discretized (in orange) charging profile of Hyundai Kona.

Figure 6.
Queueing process.

Figure 7.
Flowchart to compute the power provided by the fixed modules.

Figure 8.
Flowchart to get the penalty cost.

Figure 9.
GA Flowchart.

Figure 10.
Electric vehicles: (a) discretized charging curves; (b) probability.

Figure 11.
Occupancy rate in the peak week.

Figure 12.
Optimization parameters variables for energy price variations.

Figure 13.
Occupancy rate in a typical working week.

Figure 14.
Future charging profiles.


Table 1.
Considered EV models.
| Model | Battery Capacity [kWh] | Battery Voltage [V] |
|---|---|---|
| Audi e-Tron | 95 | 396 |
| Tesla Model 3 LR a | 74 | 360 |
| Hyundai Kona | 64 | 356 |
| BMW i3 | 42 | 352 |
| Nissan Leaf | 40 | 350 |
| Renault Zoe | 52 | 360 |
| Tesla Model S/X | 100 | 375 |
| Volkswagen e-UP | 32.3 | 357 |
| Opel Corsa-e | 45 | 350 |
| Volkswagen ID3 | 58 | 408 |
| Mini Cooper-e | 28.9 | 350 |
a LR stays for Long Range.
Table 2.
Considered EV models.
| Parameters | Value |
|---|---|
| M | 10 |
| cm [€/kW] | 500 |
| cs [€/kW] | 200 |
| [€/kWh] | 0.79 |
| Installation site | Italian A1 motorway |
Table 3.
Charging spots and costs variations.
| Charging Spots | Hardware Costs cm [€/kW] | Installation Costs cs [€/kW] | N | ||
|---|---|---|---|---|---|
| Scenario 1 | 6 | 670 | 290 | 46 | 5 |
| Scenario 2 | 10 | 500 | 200 | 47 | 7 |
| Scenario 3 | 20 | 300 | 100 | 46 | 13 |
Publisher’s Note: MDPI stays neutral with regard to jurisdictional claims in published maps and institutional affiliations. |
© 2021 by the authors. Licensee MDPI, Basel, Switzerland. This article is an open access article distributed under the terms and conditions of the Creative Commons Attribution (CC BY) license (https://creativecommons.org/licenses/by/4.0/).
Share and Cite
MDPI and ACS Style
Leone, C.; Longo, M.; Fernández-Ramírez, L.M. Optimal Size of a Smart Ultra-Fast Charging Station. Electronics 2021, 10, 2887. https://doi.org/10.3390/electronics10232887
AMA Style
Leone C, Longo M, Fernández-Ramírez LM. Optimal Size of a Smart Ultra-Fast Charging Station. Electronics. 2021; 10(23):2887. https://doi.org/10.3390/electronics10232887
Chicago/Turabian StyleLeone, Carola, Michela Longo, and Luis M. Fernández-Ramírez. 2021. "Optimal Size of a Smart Ultra-Fast Charging Station" Electronics 10, no. 23: 2887. https://doi.org/10.3390/electronics10232887
Note that from the first issue of 2016, this journal uses article numbers instead of page numbers. See further details here.