Article

Reduction of Losses and Operating Costs in Distribution Networks Using a Genetic Algorithm and Mathematical Optimization

by
Fabio Edison Riaño
1,
Jonathan Felipe Cruz
1,
Oscar Danilo Montoya
2,3,*,
Harold R. Chamorro
4 and
Lazaro Alvarado-Barrios
5
1
Estudiantes de Ingeniería Eléctrica, Universidad Distrital Francisco José de Caldas, Bogotá D.C. 11021, Colombia
2
Facultad de Ingeniería, Universidad Distrital Francisco José de Caldas, Bogotá D.C. 11021, Colombia
3
Laboratorio Inteligente de Energía, Universidad Tecnológica de Bolívar, Cartagena 131001, Colombia
4
Department of Electrical Engineering at KTH, Royal Institute of Technology, SE-100 44 Stockholm, Sweden
5
Department of Engineering, Universidad Loyola Andalucía, 41704 Sevilla, Spain
*
Author to whom correspondence should be addressed.
Electronics 2021, 10(4), 419; https://doi.org/10.3390/electronics10040419
Submission received: 11 January 2021 / Revised: 27 January 2021 / Accepted: 5 February 2021 / Published: 9 February 2021

Abstract

:
This study deals with the minimization of the operational and investment cost in the distribution and operation of the power flow considering the installation of fixed-step capacitor banks. This issue is represented by a nonlinear mixed-integer programming mathematical model which is solved by applying the Chu and Beasley genetic algorithm (CBGA). While this algorithm is a classical method for resolving this type of optimization problem, the solutions found using this approach are better than those reported in the literature using metaheuristic techniques and the General Algebraic Modeling System (GAMS). In addition, the time required for the CBGA to get results was reduced to a few seconds to make it a more robust, efficient, and capable tool for distribution system analysis. Finally, the computational sources used in this study were developed in the MATLAB programming environment by implementing test feeders composed of 10, 33, and 69 nodes with radial and meshed configurations.

1. Introduction

1.1. General Context

Distribution networks are a fundamental component of power systems involved in warranty power supply to end customers (i.e., residential, commercial, mixed, and industrial customers) [1,2]. Due to their radial topology, in these systems, a large percentage of power is often lost (i.e., when power energy is transformed to heat energy). Around 70% of the energy losses are presented in power distribution systems, and 13% of the energy delivered to these systems is lost during the distribution stage [3,4]. The author of [5] discussed the amount of money invested in these systems and the type of losses presented; besides, they mentioned that 2/3 parts of the investment in power systems is associated with the distribution, for which distribution is known as “invisible giant” of the power system. In terms of power losses, these can be categorized into technical and non-technical losses [6]. Technical losses occur through the energy dissipation when running power system components such as transmission and distribution lines and primary and secondary conductors; likewise, these are found in transformers’ winding and cores [7,8]. Non-technical losses are caused by external actions of the power system, either due to illegal electrical service connections, non-payment of utility bill by end-customers, or errors in accountability and metering maintenance [9]. Illegal connections may cause overloading and malfunctioning in electrical equipment, for which utility companies’ profitability is affected due to the unidentified power consumption.
The large percentage of losses found in distribution systems and the high levels of investment, operation, and maintenance required have prompted network operators to perform significant amount of research to determine the most practical and economic solutions for reducing the operative costs associated with energy losses [10,11], as the good management of this issue will greatly impact the system’s efficiency and the power supply service’s profitability [8]. Network operators have found that locating distributed generators and capacitor banks in parallel is the most popular mechanism to improve the system performance, as these reduce losses and improve voltage profile [12,13]. Capacitor banks are only useful when their optimal location and suitable size are chosen; accordingly, the power factor and voltage profile are improved. Misdone siting and/or sizing can generate problems such as an increase in power losses or lead the voltage magnitude to reach unacceptable limits [4,14].
Therefore, it is important to employ efficient mathematical models to address the problem of capacitor banks’ location and guarantee their efficient use in the distribution system, improve the technical features of the network for end-customers, [4,13], and increase the economical benefits of energy trading for the network operator.

1.2. Motivation

Reactive management presents a challenge for network operators and end customers. The former seek to decrease technical losses presented in the wires of the primary and/or secondary circuits and transformers’ cores and theirs winding [7,15].Additionally, they intend to eradicate the non-technical losses caused mainly due to illegal connections on the system [6,16]. End customers seek not to be involved in economic penalties due to losses caused by the usage of electric machines at the industrial level, which create inconveniences with the power factor. To control the subject of reactive power, since 2005 in Colombia, the Energy and Gas Regulation Commission (CREG in Spanish) with the CREG 018 resolution, established a limit for the power factor (minimum as 0.9) [17]. Additionally, this resolution satisfies the requirements of the agents (entities entrusted for generation, transmission, and distribution of power to end customers), delineates the role played by the capacitor banks for reactive compensation, and addresses the controlling of power losses in power distribution. It is important to mention that the voltage control performed by plugging and unplugging capacitors banks in parallel corresponds to discrete control. In 2018, the CREG 015 resolution established that reactive power consumption cannot be greater than 50% of the active power consumption. A set of rates was created for this, that is supposed to be reported by the network operator to the liquidator or accounts manager in the first 10 days of each year [18]. In order to guarantee the service quality for end customers and increase the economic benefits for network operators, in this work, the implementation of a discrete genetic algorithm for the optimal siting and sizing of fixed-step capacitor banks is proposed for solving the mixed-integer non-linear programming (MINLP) model that represents the problem [11]. Additionally, this mathematical model is implemented using the General Algebraic Modeling System (GAMS) software by comparing the results obtained with the method proposed [19]. It is important to mention that the objective function considered is related to a reduction in power losses and corresponding costs during a year of operation [13].

1.3. Review of the State of the Art

In the specialized literature of the last 20 years, several works can be found that use the installation of capacitor banks and different strategies to improve the operation of distribution networks. Some of these works are discussed as follows:
In [20], the authors developed a methodology that considers node sensitivity in regard to the active power losses. The methodology proposed was tested in two systems, and it was concluded that the installation of capacitor banks on the most sensitive nodes provides economical benefits and improves voltage profiles. The authors of [21] proposed to locate capacitor banks on the transformer’s low-voltage side using a mixed integer non-linear method and a control operative method of the capacitors with the objective of maximizing the net present value (NPV) of the project and obtaining cost benefits. The project was implemented in a network located at Macao (China), and it was found to be computationally efficient and that a notable NPV can be obtained if the capacitor banks are optimally located. The authors of [22] developed a fuzzy method to find the candidate nodes for bank capacitors’ location; in that work, a set of constraints was included for the voltage limits, number, and siting of capacitors. Apart from that, the sensitivity factors to power losses were used, and the model was implemented in two radial systems: 12 and 34 nodes, respectively. As a result, a prominent reduction was made in the losses and an improvement in the voltage profile, which confirmed that the methodology was suitable for solving this optimization problem.
In [23], the authors developed a genetic algorithm that considered codification in terms of possible capacitor sizes (discrete sizes with desired resolution). Besides, a comparison using pairs was used in the operator for tournament selection, and it was tested in 18-, 69-, and 141-node test systems. Likewise, different type of loads were experimented (commercial, residential, and industrial); obtaining that under these load conditions adequate results regarding the minimization of the objective function value. In [24], a bio-geography optimization algorithm that minimizes the cost function and meets the proposed constraints was discussed. It was applied to radial systems of 10, 15, 34, and 69 nodes, reducing the active power losses after the compensation and stabilization of the voltage level within the range established by the regulatory entity.
The authors of [25] performed their study on a 14-node network with a genetic algorithm for the cost optimization and sizing of capacitor banks. They determined that the method’s accuracy depends on the population size and that the voltage profile proportionally improves with reduction of losses. A binary codification was employed, which increments the required processing times and reduces the possibility of having infeasibilities during the optimization process.
In [26], two novel algorithms were proposed. The first algorithm is a hybrid of the particle swarm optimization algorithm and the Quazi-Newton algorithm, and the second method combines the particle swarm and gravitational search algorithms. The authors employ losses sensitivity factors, which are validated in 33-, 69-, and 111-node test systems. The method was considered robust and efficient, as the voltage profiles are enhanced, losses are minimized, and net saving is maximized. In [27], an optimization method based on the behavior of the ant lions was presented, which minimizes losses and total annual costs from the objective functions. The method was validated in 33- and 64-node test systems, and a significant annual savings and reduction in power losses was found when the capacitor banks location was determined.
In [28], capacitor banks were sized and sited from a discrete genetic algorithm to reduce losses and improve voltage profiles in the networks belonging to the eastern and western regions of Saudi Arabia. Two objective functions were formulated: the cost equilibrium of the capacitors and the total cost of the system after the capacitors’ location. As a result, the genetic algorithm provided feasible solutions for the system, as the voltage profile, losses and power factor were improved. The authors of [29] employed an artificial electric field and a sensitivity factor. Net saving was maximized by reducing the losses, and the algorithm was validated in 69- and 118-node test systems with different installation scenarios of capacitor banks. They concluded that their algorithm is able to maximize the current net saving with low capacity capacitors, reducing losses and improving voltage profiles.
In [30], a heuristic method was developed based on power flows and demand curves in a one-day period. From the capacitor’s location and the nature of the bank, it is possible to determine whether they are fixed or variable. Likewise, the solution obtained is beneficial with the upstream and downstream of every node compensated; besides, the power factor gets closer to the unity, and the voltage profile is improved when compensation is performed. On the other hand, the authors of [31] performed a study under three scenarios, where the second scenario is of interest of this project due to the capacitor bank’s location. With mixed integer non-linear programming, a methodology was developed to find the optimal location of the capacitors, with the following results: a correlation between active or reactive power is injected to the system leading to the improvement of the voltage profile and a reduction in the losses. In the case study of the 33-node test system, node 18 is determined to be the worst in terms of voltage regulation, given its distance with the slack node. When active and reactive power is injected, the power flows are observed to be better distributed compared to the benchmark case.
Finally, the authors of [11] presented a master-salve optimization algorithm for the selection and location of fixed-step capacitor banks in distribution systems. In the master stage, a discrete version of the vortex search optimization algorithm was employed that determines the siting and sizing of the capacitors via a unique codification vector. In the slave stage, a power flow known as the successive approximations method was employed to assess the operative conditions of the network in regard to the technical losses and voltage profiles. The numerical results demonstrated the methodology’s efficiency, with the best results recently presented in the specialized literature on the reduction of the operative costs during one year of operation at maximum load, as compared to different heuristic and metaheuristic methods used in the scientific literature.
The main aspects of the state of the art, that is, the main objective functions and solution strategies, are summarized in Table 1.
With regard to the literature review summarized in Table 1, the main advantages of using combinatorial optimization methods are as follows [2]: (i) the possibility of implementing the optimization procedure to locate and select the set of capacitor banks for reactive power compensation in distribution networks using multiple programming languages, as these approaches can be structured using sequential programming and (ii) the possibility of working in the infeasibility space based on the usage of the fitness function that allows the finding of promissory solution regions; however, heuristic and metaheuristic methods have some disadvantages, such as the following: (i) the impossibility of ensuring that each running of the algorithm will find the same numerical solution and behavior caused by their random nature; (ii) the high number of parameters that must be tuned to ensure an adequate performance between the optimal solution and the processing times required to achieve this solution, and (iii) a high dependence on the programmer, which is demonstrated when the same algorithm is implemented by different authors who, then, report different solutions for the same optimization problem.
To deal with the disadvantages of the metaheuristics and solve the problem under investigation, the following aspects have taken into account for the implementation of the Chu and Beasley genetic algorithm (CBGA): (i) A statistical study will be conducted to determine the rate of convergence of the algorithm to the same solution, which is done by consecutively running the algorithm 100 times; (ii) the different population sizes will be evaluated to determine the best trade-off between the optimal solution and the required processing times; and (iii) the methodology will be applied to distribution networks with radial and meshed configurations and comparisons will be made with powerful solvers available in the GAMS optimization package for solving MINLP problems. The main contribution of the proposed approach will be summarized in the next section.

1.4. Contributions

Based on the review of the state of the art presented in the previous section was performed, the contributions of this work are summarized as follows:
The fixed-step capacitor banks siting and sizing problem is represented via an integer codification and the classic optimization method is applied based on the CBGA, which reaches the optimal solution of the problem in minimum computational times when compared with the results reported in [11].
The solution developed from the interaction between the CBGA and the successive approximations method can be implemented in any radial or meshed distribution system. The selection and location of capacitor banks are not restricted in regard to the size (reactive power supplied) and the number to be installed.
It is important to mention that while genetic algorithms have been widely reported in the specialized literature to solve the problem of optimal selection and location of capacitor banks, as presented in the review of the state of the art, the solutions reported get stuck in local optimums due to the binary codification of two stages that are commonly used for node selection, which increases the algorithm’s complexity and the possibility to obtain infeasible configurations. Furthermore, in this work, the problem of the binary codification is solved using the discrete codification presented in [11], thus accelerating the computational times and reaching the convergence to the best optimal solution reported in the specialized literature.

1.5. Paper Setting

The rest of this paper is organized as follows: Section 2 presents the mathematical formulation of the optimal location of fixed-step capacitor banks in distribution systems, Section 3 presents the features of the CBGA, Section 4 describes the test systems used in this study, Section 5 shows the results obtained for each of the proposed cases and compares them with the solutions found in the specialized literature, and Section 6 discusses the conclusions extracted from the development of this work as well as the possible future works.

2. Mathematical Formulation

In this section, the general mathematical formulation is presented for the location and selection of capacitor banks [32]. The function to minimize is as follows:
min Z = K P Z 1 + i = 1 n b c = 1 k K c Q b c X i b c c ,
where K p is the average cost of energy during the period of analysis, Z 1 is the objective function regarding the active power losses in all the branches of the network, K c is the cost of each capacitor bank selected, Q b c is the value in kvar of each capacitor bank, and X i b c is a binary variable that represents the node and the type of bank to install.
Z 1 = i Ω N V i j Ω N V j Y i j cos θ i θ j ϕ i j ,
where V i , V j are the voltages on each node, which have angles θ i and θ j , respectively, Y i j is the admittance magnitude that connects the nodes i and j, respectively, ϕ i j is the angle, and Ω N represents the set that contains all the network nodes.
The equations for active and reactive power balance defined in Equations (3) and (4) are applied for each node of the system, i.e., k Ω N .
P g i P d i V i j Ω N V j Y i j cos ( θ i θ j ϕ i j ) = 0 , i Ω N
where P g i and P d i represent the generated active power and demanded reactive power at each node, respectively.
Q g i Q d i + b c = 1 k Q b c X i b c V i j Ω N V j Y i j sin θ i θ j ϕ i j = 0 , i Ω N
where Q g i is the generated active power, Q d i is the demanded reactive power, and k represents the maximum number of capacitor banks available for installation in the power network.
V i min V i V i max , i Ω N
j Ω b c X i b c 1 , i Ω N
X i b c { 0 , 1 } , i Ω N & b c Ω b c
b c Ω b c i Ω N X i b c N i n s B C ,
Equation (5) is related to the maximum and minimum voltage limits, Equation (6) determines the number of banks to be located at each node, Equation (7) are the values that the binary variable can take, and Equation (8) defines the maximum number of capacitor banks to be installed in the system ( N i n s B C ).
It is important to mention that the mathematical model developed in Equations (1)–(8) is non-linear and non-convex with a mixed integer non-linear programming structure, which largely complicates its solution, as there are no methodologies in the specialized literature that guarantee an optimal solution. Therefore, in this work, a hybrid method devised with the Chu and Beasley genetic algorithm and the power flow method, known as successive approximations, is proposed. The advantage of this proposal is the ability to find the optimal solution in the test systems under investigation with low computational cost and ease of implementation.

3. Methodology Proposed

To solve the problem of losses and operative cost reduction in distribution systems through the installation of fixed-step capacitor banks, the implementation of a CBGA is proposed. This algorithm is part of the metaheuristic optimization methods based on the knowledge and the selection process presented in the nature, in which the most adapted individuals are more likely to survive and transmit their genes to the offspring. The implementation of this optimization strategy involves the development of the following three stages: selection, crossing and mutation, as presented in [33,34]. Mathematically, the CBGA is considered a combinatorial optimization technique, with a high probability of finding global solutions for large-sized complex problems and with multiple local optimums [35]. It is also necessary to mention that a method for the solution of the power flow problem is required, which, in this case, is the successive approximations method, proposed in [36] and which the simulation results confirm as being faster in terms of computational times and the number of iterations required. This leads to a typical optimization problem defined as master-slave, as indicated in [37], where the CBGA is the master algorithm and the successive approximations method is the slave.
Here, each of the stages are presented and the CBGA implementation is briefly explained with regard to solving the problem of optimal selection and location of fixed-step capacitors in distribution systems for reducing operative costs.

3.1. Codification

To apply the CBGA to the problem under investigation, an appropriate codification is necessary via a vector. This codification is denominated as the individual, which will be part of the initial population (IP). The size of the codification vector is given by 1 × 2 N i n s B C . It is worth remembering that N i n s B C corresponds to the number of capacitor banks available to be installed in the test system. The initial N i n s B C positions of the vector correspond to a random number (represented by “ N o d e ”) between 2 and the number of nodes of the system, other than the reference node that is usually located at node 1. The terminal positions of the mentioned individual correspond to a random number (represented by “ N c a p ”) between 1 and the number of possible banks that can be installed. The codification proposed to provide a solution to the problem is presented in Figure 1, where the individual In is represented by the Equation (9). Aside from this, in Equation (10), it is guaranteed that each individual of the population is unique, which is known as the diversity criteria [35].
I n = I n 1 I n 2 I n 2 N i n s B C
I n I m , n = 1 , 2 , , N i n s B C , m = 1 , 2 , , N i n s B C ,
It is important to highlight that in order to guarantee the feasibility of each individual, it is necessary to make sure that no nodes are repeated on the first N i n s B C , as this would imply the location of more than one type of fixed-step capacitor in the same node, which is not recommended in the specialized literature.

3.2. IP

The IP is created with a matrix of size N i × 2 N i n s B C , where N i is the number of individuals that will be part of the IP, as presented in Equation (11). It is worth mentioning that the individuals have to be different to guarantee a better solution and avoid premature convergence as in [35].
P i = I 1 I 2 I N i = I 11 I 12 I 12 N i n s B C I 21 I 22 I 22 N i n s B C I N i 1 I N i 2 I N i 2 N i n s B C

3.3. Fitness Function Assessment

For the accurate performance of the CBGA, it is necessary to rewrite the objective function presented in Equation (1) by adding two terms, as shown in Equation (12). Then, this fitness function is assessed for each individual of the IP by employing the successive approximations method related to the solution of the power flow problem, which will be addressed later.
min Z A = Z + α max 0 , V min V α min 0 , V max V ,
where α is the penalization factor. This factor, as its name suggests, penalizes those individuals that belong to the IP and are not in compliance with the constraint defined in Equation (5). Notice that V is the voltage vector obtained when the power flow is solved via the successive approximations method by considering the installation of the capacitor banks in the respective nodes according to the codification vector that represents each individual.

3.4. Selection

As mentioned earlier, the first stage of the CBGA is selection, as described by [35], and consists of arbitrarily choosing a subset of individuals of the IP that will be submitted to a tournament for providing two individuals with the best fitness function (in this case, the individuals with the solutions that minimize the cost of the power losses to the greatest extent) [38].
It is important to mention that the number of individuals involved in the tournament is arbitrary and largely dependent on the programmer’s expertise; therefore, in this study, Ref. [10]’s recommendation that the selection process be performed with a tournament composed of four individuals is taken into account.

3.5. Crossing

In this stage, two individuals are created with part of the information belonging to the winners of the tournament as demonstrated in [39]. If the first winner of the tournament is called P i i and the second P i j and a random number is generated between 1 and 2 N i n s B C 1 , the new individuals are obtained via crossing the information of P i i y P i j , as shown in Equation (13).
H i 1 = P i i 1 P i j q P i j c i H i 2 = P i j 1 P i i q P i i c i

3.6. Mutation

Once the crossing is done according to Equation (13), an arbitrary position has to be chosen within the new individuals H i 1 and H i 2 (between 1 and N i n s B C ) to change the value on the said position using a random number between 2 and the number of nodes presented in the test system, i.e., n, which serves to guarantee compliance with Equation (10). After this, the fitness function for H i 1 and H i 2 is evaluated to determine the best fitness function and choose the winner; this is done in the following manner:
if Z A ( H i 1 ) Z A ( H i 2 ) , then R = H i 1 if Z A ( H i 2 ) Z A ( H i 1 ) , then R = H i 2
where R is the offspring winner.

3.7. Replacement of Individual in the Population

In this stage, the IP matrix is sorted with respect to the value taken as the fitness function for each individual. For this, it is sorted in descending order, where the first and last individuals will be those with the greatest and lowest fitness function. Once this order is carried out, the result of the last individual of the matrix is compared with the winning individual according to Equation (14). If the fitness function of the winning individual is less than that of the last individual of the IP, R will take the place corresponding to the loser as long as this individual is different with respect to the other individuals of the IP [3]. If the abovementioned conditions are not complied with, the process will have to be repeated from the selection stage.

3.8. Stopping Criteria

The stopping criteria of the CBGA allows the termination of the iterative process after certain conditions are complied with, as shown in [40]. The the most important conditions mentioned in [40] are as follows: A high percentage of the population converges to a value from a fixed number of evaluations, the objective function results are not improved according to a number of iterations, and central processing unit (CPU) times. Therefore, choosing the number of times the CBGA is assessed is contingent upon the programmer’s expertise and the criteria. For this case, it was tested for a different number of evaluations, and it is observed that for more than 300 iterations, the results do not improve, but the CPU time significantly increases. With less than 40 iterations, the solution gets stuck in local optimums, and the CPU time decreases. According to this, the stopping criteria was established in Table 2.

3.9. Successive Approximations Method

Through the use of Equations (3) and (4) and considering that the compensated reactive power has been added as part of the demand with the corresponding signs, we derive the following:
S g S d = diag V Y bus V ,
where Y bus is the admittance matrix of the system. It is possible to differentiate within the Y b u s matrix the terms of generation and demand as follows:
Y bus = Y g g Y g d Y d g Y d d
where Y g g is the admittance between the generation nodes, Y d d is the admittance between the demand nodes, and Y g d = Y d g T is the admittance matrix that relates to the generation and the demand. Now, if this separation is applied to Equation (15), we obtain the following:
S g = diag V g Y g g V g + Y g d V d ,
S d = diag V d Y d g V g + Y d d V d
where it is observed that V g is the voltage at slack nodes of the distribution system, i.e., known voltages, and V d are the voltages at all the demand nodes, which correspond to the variables under interest.
Notice that, from Equation (18), it is possible to find V d as follows:
V d = Y d d 1 diag 1 V d S d + Y d g V g .
From Equation (19), the iterative form of the successive approximations method reported in [41] can be obtained, such as presented in Equation (20).
V d t + 1 = Y d d 1 diag 1 V d t , S d + Y d g V g ,
where t represents the iterations indicator.
The successive approximations method guarantees convergence as shown by [42], as this method is a particular case of the Banach fixed-point theorem. Is is considered that the solution has been achieved when the error between the voltages of two consecutive iterations is less than a determined tolerance, i.e., min V d t + 1 V d t ϵ , ϵ being the convergence error, which is assigned as 1 × 10 10 for distribution systems, as recommended in [36].

3.10. Implementation of the Proposed Methodology

Figure 2 presents the flow diagram of the optimization methodology proposed for solving the problem of the optimal location of fixed-step capacitor banks in distribution systems and reducing technical losses and operative costs via the implementation of a master/slave optimization strategy, which is composed by the CBGA with integer codification and a power flow algorithm known as successive approximations.
On the other hand, the implementation features of the CBGA are reported in Table 2. These parameters have been adjusted via a heuristic process based on multiple simulations where the trade-off between the simulation time and the quality of the solutions obtained is verified.
At the end of the Simulation Results’ section, a simulation case will be presented using different population sizes that confirms that 20 individuals is enough to explore and exploit the solution space with the proposed CBGA fixed-step capacitor banks can be selected and located in distribution networks with radial and meshed topologies.

4. Test Systems

In this section, the characteristics of the capacitor banks is presented as well as the information regarding the test radial systems employed in the simulation cases. These test feeders are composed by 10, 33, and 69 nodes. These systems operate at medium voltage level and have been used in several publications related to technical losses reduction and power flow analysis [36].

4.1. Characteristics of Capacitor Banks

Table 3 shows the possible capacitor banks that can be installed in the radial distribution systems, including their rates and costs [13].
Note that for all the distribution test feeders presented below, all the options reported for the fixed-step capacitor banks in Table 3 are considered, and it is possible to note that the difference between two continuous capacitor banks is 150 kvar, which corresponds with the minimum step size considered for reactive power compensation in this study.

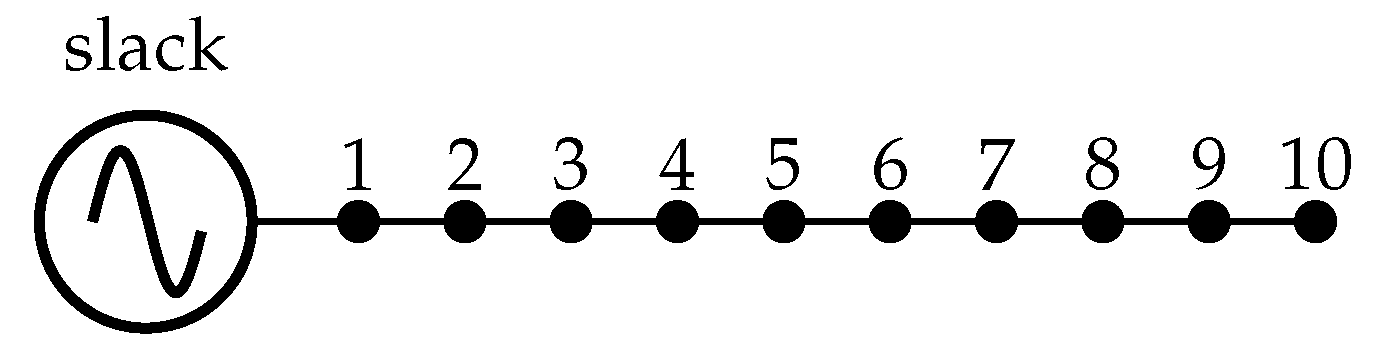
4.2. 10-Node Test System

This system is composed of 10 nodes and 9 branches, whose information has been taken from [43]. In Figure 3, this test configuration can be observed. The bases for the system are 23 kV and 100 kVA. Additionally, the initial network losses are 783.77 kW. In this case, four fixed-step capacitor banks will be installed for the purpose of comparison.
Information regarding the demands and impedance of the 10-node system is reported in Table 4.

4.3. 33 Nodes Test System

The radial distribution network is composed by 33 nodes and 32 lines [44], shown in Figure 4. The base values for this system are 12.66 kV and 10 MVA. The benchmark losses are 210.9867 kW [36]. In this case, three fixed-step capacitor banks are installed for comparison purposes with the main reports of the specialized literature. Table 5 presents the branch information and demand nodes.

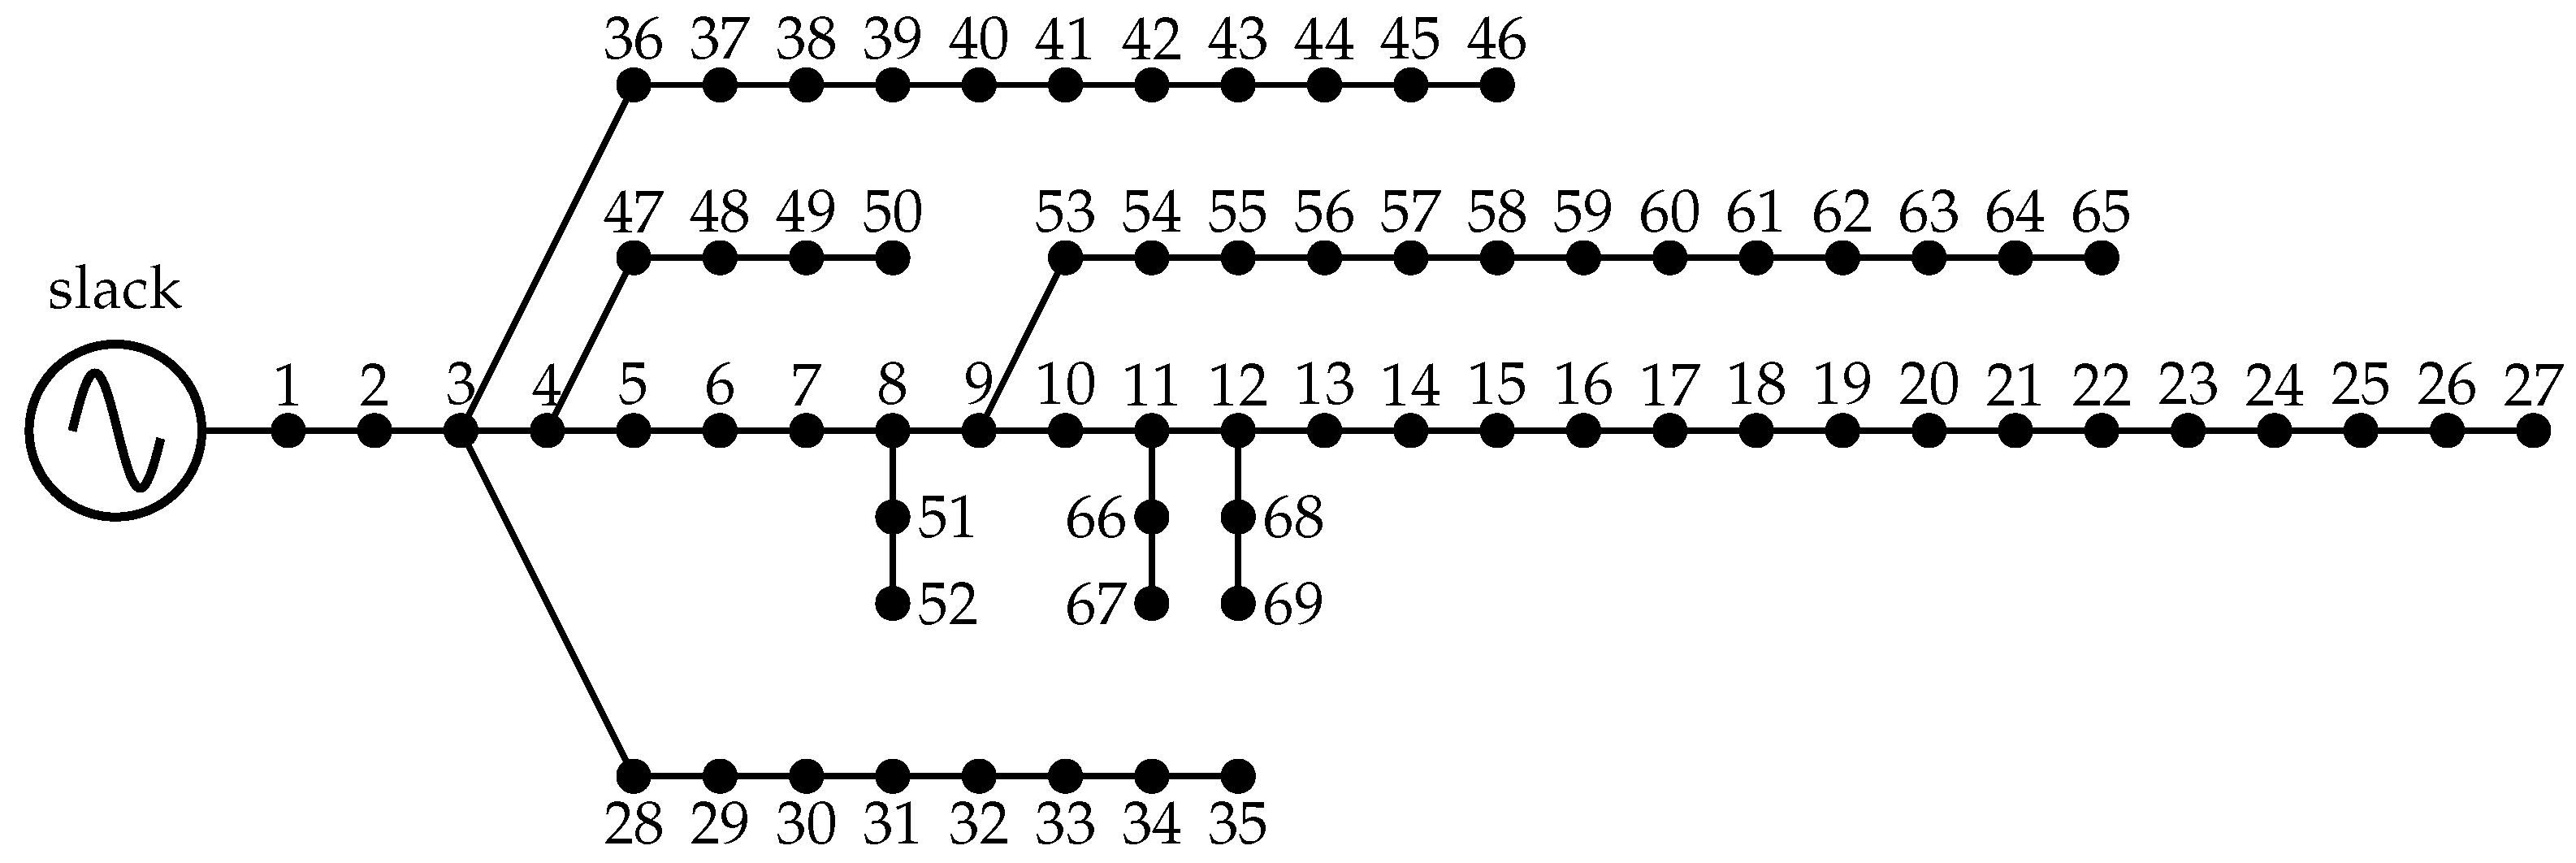
4.4. 69-Node Test System

The radial distribution network is composed by 69 nodes and 68 lines [45]. In Figure 5, this test configuration can be observed. The base values for this system are 12.66 kV and 10 MVA. Additionally, the benchmark losses of the network are 224.9352 kW. In this system, three fixed-step capacitor banks are installed for the purpose of comparison with the findings reported in the specialized literature. System data is reported in Table 6.

4.5. 69-Node Meshed Test System

The 69-node test feeder with a mesh configuration is composed of 69 nodes and 73 lines, taken from [46]. Figure 6 presents the electrical configuration of this test feeder, and Table 7 presents the additional lines considered in this test feeder that are added to the information reported in Table 6 for the radial configuration with the same voltage and power bases. The information of the new lines added was taken from [47].
The initial power losses of this test feeder under peak load condition (see loads in Table 6) are 82.5290 kW; in addition, for this test feeder, the possibility of installing the three fixed-step capacitor banks using the proposed CBGA is considered in order to compare its results with the GAMS optimization package, as in the literature, the problem of the optimal location and sizing capacitor banks in this meshed configuration has not been reported.

5. Simulation Results

To validate the optimization methodology proposed, the proposed optimization model from Equations (1)–(7) is considered for implementation in the commercial optimization software GAMS. This allows one to solve mixed integer non-linear programming models as described in [48,49] by combining the interior point and branch and bound methods. For comparison purposes, the results reported in [11] through the application of discrete vortex method do not take into account the capacitors’ cost, resulting in costs presented in the system lower than those real; furthermore, in this work, these costs have been included within the objective function.

5.1. Computational Implementation

To solve the mixed-integer, non-linear programming model that represents the problem of the location and selection of capacitor banks, the GAMS software is used as a comparison tool, and the programming environment of MATLAB 2020b is used in a desktop computer with AMD Ryzen 7 3700U (AMD, Santa Clara, CA, USA), 2.3 GHz, 16 GB RAM with 64-bits Windows 10 Home Single Language.

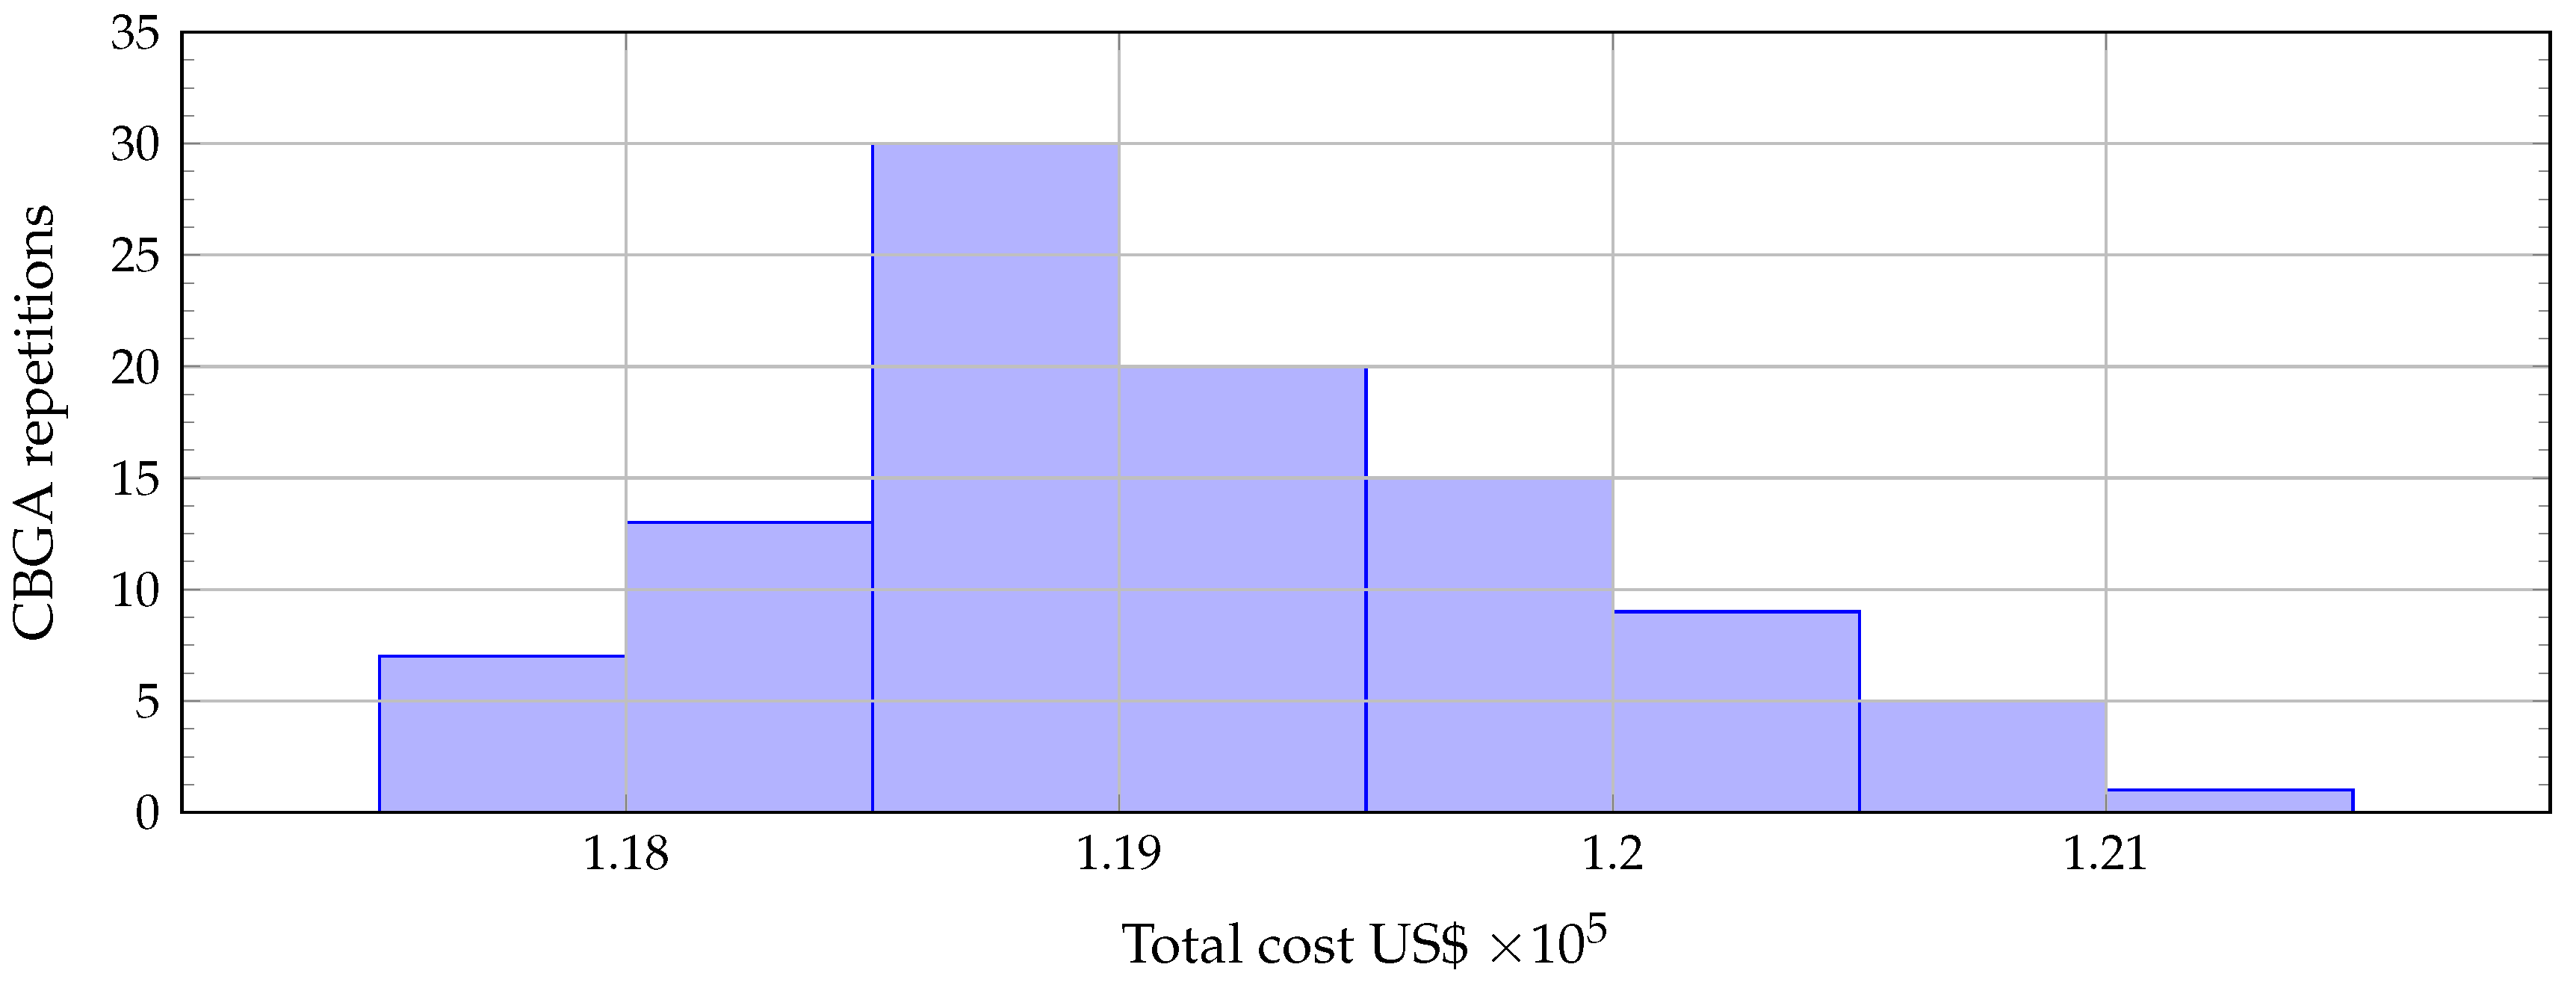
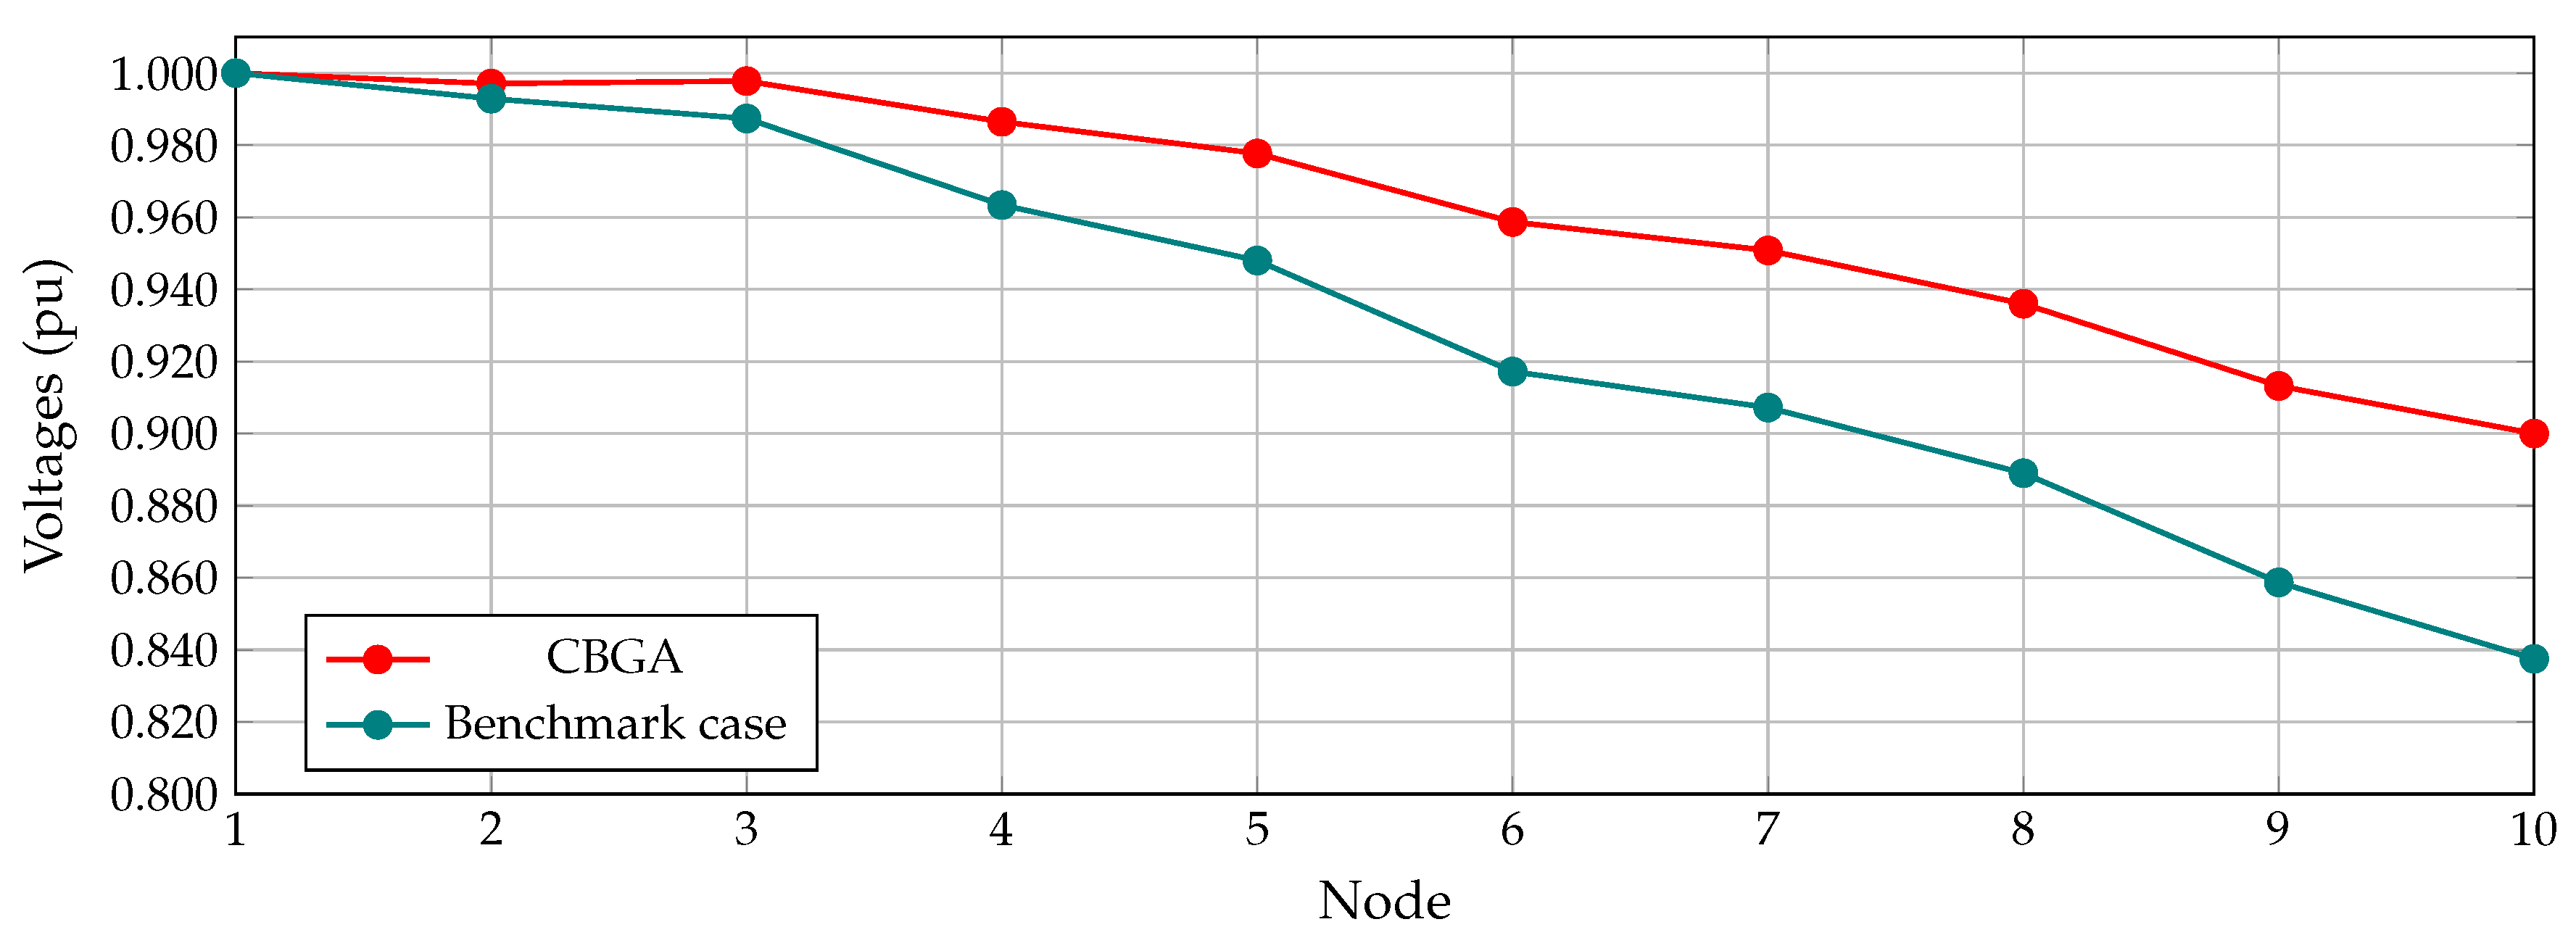
5.2. Results of the 10-Node Test System

According to Table 8, the active power loss in the benchmark case is 783.79 kW. When the proposed methodology is applied to the system, an improvement in the results is evident compared with the method developed by the authors of [43], as the losses of PGSA are 694.93 kW, 783.31 kW for GAMS, while for the proposed method, (i.e., CBGA) the losses are 691.99 kW. This represents a decrease with respect to the benchmark case of 11.34%, 0.06%, and 11.71%, respectively.
In relation to the operative costs of the capacitor banks and the cost of energy losses, from Table 8, it is possible to say that the CBGA presents a better solution with respect to the other methods, as the benchmark case presents a cost of US$131,674, the cost as per the PGSA is US$118,340, US$117,771 is provided by GAMS, and US$117,655 for the methodology proposed. The abovementioned amounts can be translated into reductions of 10.12%, 10.55%, and 10.65%, respectively, as compared to the benchmark case.
To demonstrate that the location of the fixed-step capacitor banks effectively leads to the reduction of the annual operative costs caused by energy losses, Figure 7 presents the discriminated costs for the the 10-node test feeder.
The bar-plot in Figure 7 shows that the PGSA, the GAMS, and the CBGA permit the reduction of the annual operative costs in the network when capacitor banks are installed, as the summation of the final costs of the energy losses and the costs of the capacitor banks are lower than the benchmark case of the grid. In addition, in the case of the proposed CBGA, the investment costs in capacitors is about US$13,995, which amounts to a reduction in the cost of the energy losses by about US$28,014, which clearly compensates the investment costs on these fixed-step capacitor banks with an additional gain about US$14,019 in the annual operative costs for the 10-node test feeder.
With regard to the CBGA, it is worth mentioning that of the total number of times this converges to the best results, as observed in Figure 8, 5% of the solutions given are found to be between US$121,000 and US$121,500.
Figure 9 shows the voltage profile for the 10-node system considering the initial operative status and the effect of including the reactive compensation. It can be observed that at all the nodes (other than the slack node), the voltage magnitude is significantly improved, which implies the efficiency of the system and voltage regulation.
Note that the remaining test feeders considered in this research, i.e., 33 and 69 nodes, are taken as comparative methods for the flower pollination algorithm and the discrete vortex search algorithm, as in the literature, reports that use the GPSA approach proposed in [43] for these test feeders were not found. For this reason, the GPSA approach was only considered in the 10-node test feeder.

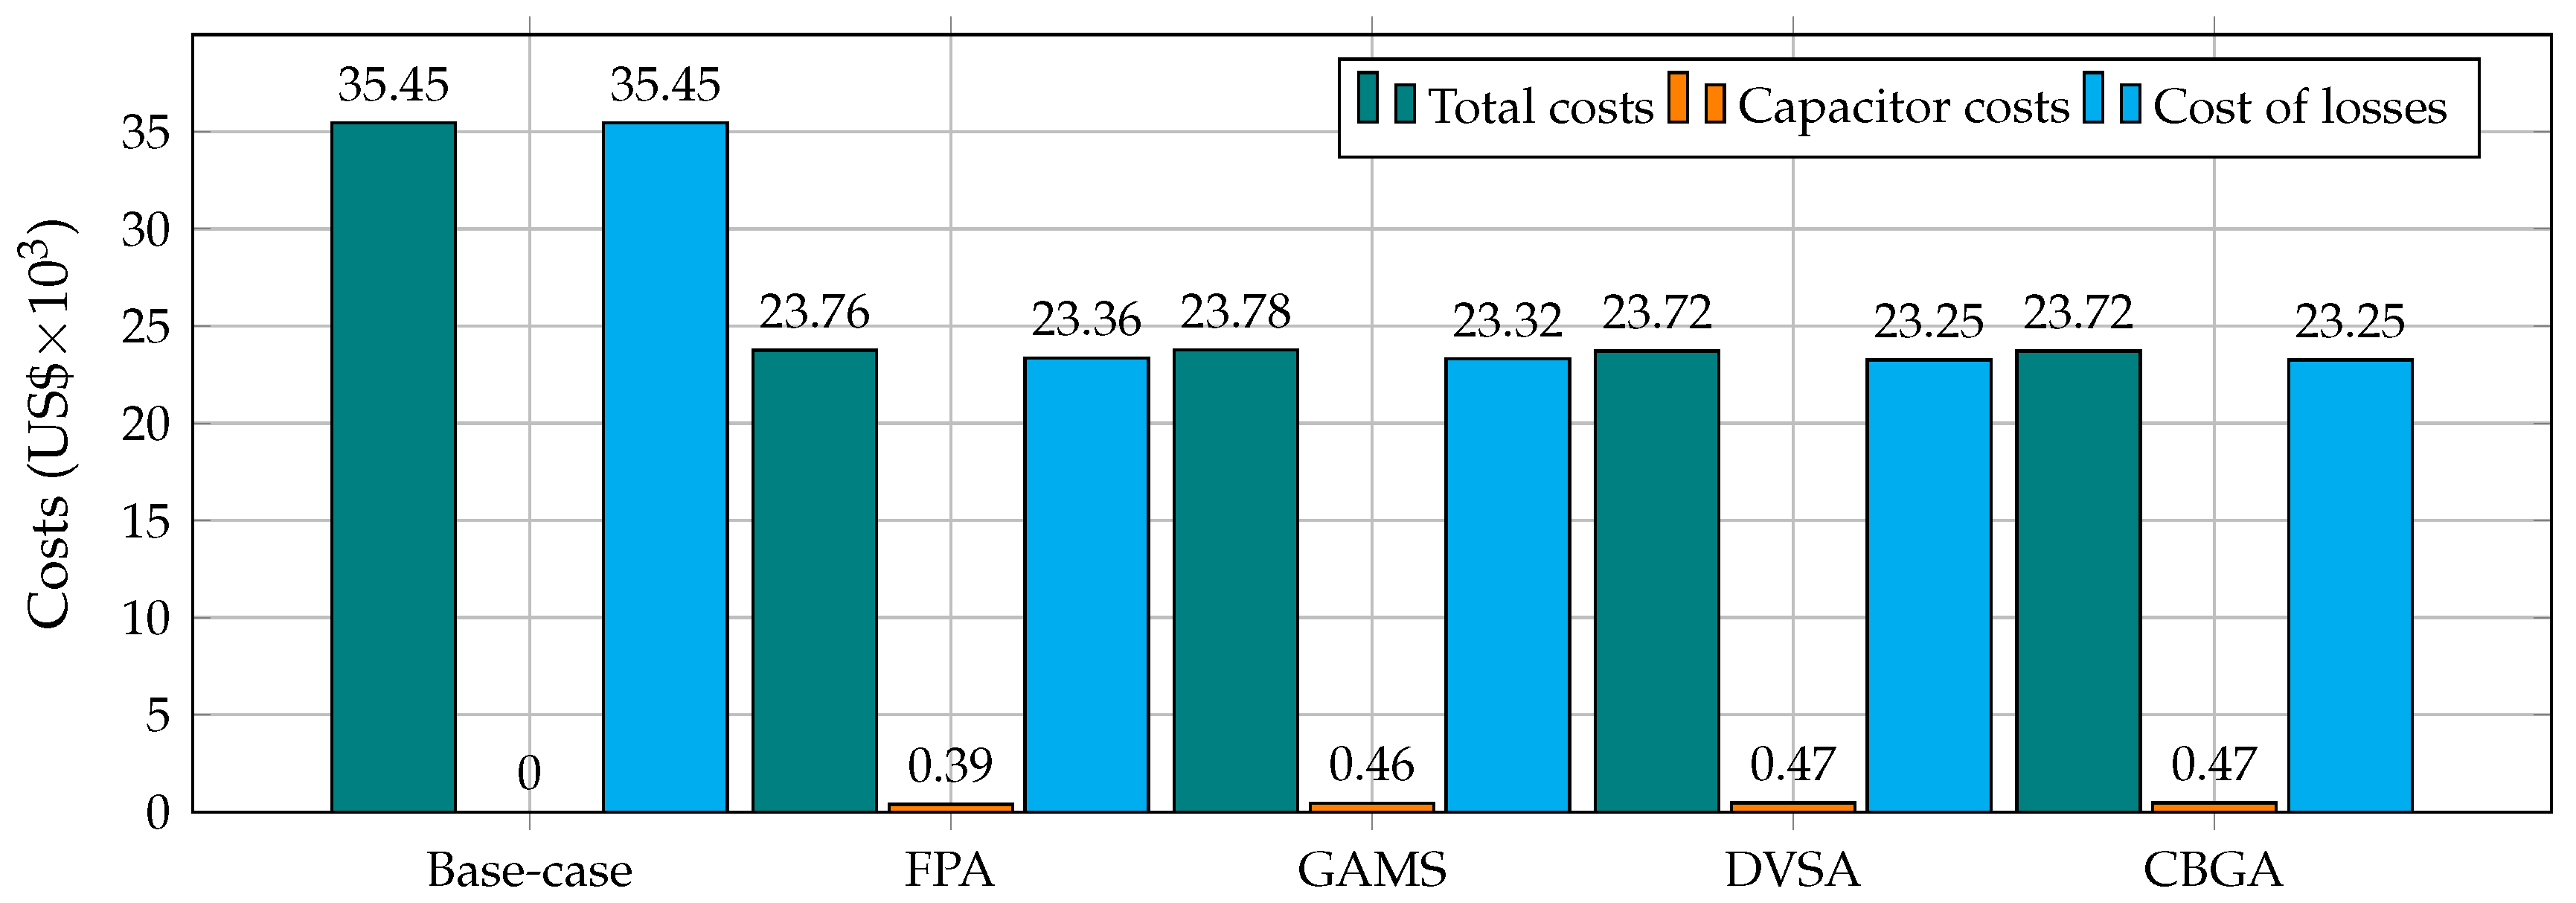
5.3. Results of the 33-Node Test System

Table 9 depicts the results obtained with the comparative methodologies and the approach proposed. In the case of the commercial software GAMS, a reduction of 34.214% was obtained compared with the losses mentioned in Section 4.3. Besides, with respect to the costs proposed in [13], the GAMS provides an increase of US$19, and in comparison to [11], the increase is US$54.16, which means that the solution found is of good quality, but not the best. The CBGA provides a reduction of 34.397% with respect to the benchmark case; and related with [11,13], the costs are reduced by US$36 and US$0.85 respectively, which confirms the robustness and effectiveness of the approach proposed in this study.
Figure 10 presents the histogram for the CBGA in the 33-node test system. It is observed that the best result obtained converges to the optimal solution in 5% of the runs, as observed in the US$23,600 to US$23,800 interval.
Figure 11 presents the discriminated behavior of the costs in the 33-node test feeder for the proposed and the comparative approaches, including the benchmark case.
Observe that the bar-plot in Figure 11 shows that the FPA, the GAMS, the DVSA, and the CBGA permit the reduction of the annual operative costs in the network when capacitor banks are installed, as the summation of the final costs of the energy losses and the costs of the capacitor banks are lower than the benchmark case of the grid. In addition, in the case of the proposed CBGA, the investment costs in capacitors are about US$467.1, which produces a reduction in the costs of the energy losses by about US$12,191.88, thus clearly compensating for the investment costs on these fixed-step capacitor banks with an additional gain of about US$11,724.78 in the annual operative costs for the 33-node test feeder.
On the other hand, Figure 12 presents the voltage profiles for the 33-node system. The solution of the CBGA shows that with the reactive power compensation through the fixed-step capacitor banks at nodes 18 and 33, there was an improvement in terms of voltage regulation greater or equal than 0.930 pu, which is significantly better than the benchmark case of the system.

5.4. Results of the 69-Node Test System

According to Table 10, the best results for the operative costs when installing capacitor banks are provided by the CBGA. This is because US$158.78 is saved with respect to the results reported by the FPA; besides, if this is compared with the solution provided by the DVSA method, a decrease of US$27.65 is observed. Therefore, it can be proved that the savings on annual operative costs is improved, corresponding to 34.35% of savings, i.e., an improvement of 0.42% and 0.07% in relation with the FPA and DVSA methods, respectively.
If a comparison is carried out in regard to the losses, it can be noticed that the proposed methodology reflects an improvement of 0.49 kW and 0.027 kW related to the FPA and the DVSA, respectively, i.e., the reduction in losses for the system with respect to the benchmark case corresponding to 35.17%, 35.37%, and 35.39% for the FPA, DVSA, and CBGA, respectively.
To demonstrate the effectiveness of the installation of fixed-step capacitor banks in the 69-node test feeder, Figure 13 presents the discriminated behavior of the costs for the proposed and the comparative approaches, including the benchmark case.
The bar-plot in Figure 11 shows that the FPA, the GAMS, the DVSA, and the CBGA permit the reduction of the annual operative costs in the network when capacitor banks are installed, as the summation of the final costs of the energy losses and the costs of the capacitor banks are lower than the benchmark case of the grid. In addition, in the case of the proposed CBGA, the investment costs of capacitors is about US$392.85, which leads to a reduction in the costs of the energy losses of about US$12,975.08 that clearly compensates the investment costs on these fixed-step capacitor banks with an additional gain of about US$12,582.23 in the annual operative costs for the 69-node test feeder.
On the other hand, Figure 14 presents the number of times the CBGA provides a result within the range established. It can be noted that the best results are found within US$24,800 and US$25,000, which corresponds to 12 % of the total evaluations.
Figure 15 depicts the voltage profiles of the 69-node radial distribution system before and after the capacitors’ location. It can be clearly observed from this figure that when the losses and operative costs are reduced, the voltage profiles are improved and voltage regulation is enhanced accordingly.

5.5. Results of the 69-Node Meshed Test System

In this subsection, we present the application of the proposed CBGA to locate and select the capacitor banks in meshed distribution networks; for doing so, the 69-node test feeder with mesh configuration presented in Figure 6 is considered. In addition, due to the fact that this system is typically used to validate strategies regarding the reconfiguration of the network [50], here, we only compare the proposed approach with the GAMS optimization package, as no studies investigating the location of capacitor banks have been previously reported in the specialized literature.
Table 11 presents the numerical achievements of the proposed CBGA and the GAMS optimization package. Note that regarding the base case, the GAMS optimization software leads ro a reduction of about 33.21% in active power losses, while the proposed CBGA leads to a reduction of 33.34%. Regarding the operative costs, the CBGA presents a better solution when compared with the GAMS package, as it allows the saving of an additional US$37.2.
Figure 16 shows the histogram of the proposed CBGA for the 69-node test system with meshed configuration; we note that the best solution converges 2% of the times, and it is contained in the US$9600 and US$9700 interval.
Figure 17 presents the voltage profiles of the 69 node test feeder with meshed configuration. Note that is observed an important improvement in the voltage profiles in the nodes located in the neighborhood of the capacitor banks. In addition, the minimum voltage profile in the benchmark case was 0.9653 pu, which is improved to 0.9765 pu when capacitors are installed, i.e., an average improvement of 141.792 V in all the nodes of the network.
To observe the effect that the reactive power compensation has on the minimization of energy losses, Figure 18 presents the magnitude of the current in each branch of the 69-node test feeder with meshed configuration. The following should be noted: (i) In lines 1 to 20 as well as lines 52 to 60, the magnitude of the current decreases with respect to the benchmark case, which implies that the amount of active and reactive power losses will decrease, as these are a function of the square magnitude of the current, and (ii) the downstream of the nodes 12, 22, and 61 provides the reactive power to the supply part of the loads, which implies that the magnitude of the current upstream of these nodes (i.e., lines 1 to 20 and 52 to 60) decreases due to a reduction in the equivalent load as can be observed in Figure 18.

5.6. Analysis of the Processing Times

Table 12 shows the average run times of the two strategies. For the GAMS case, these are fairly high due to the large number of variables managed by the model and its non-linear nature. The results reported by the techniques in the specialized literature are also reported in corresponding publications.
According to the results of Table 12, the best computational times are achieved by the methodology proposed in this work, which confirms its efficiency and applicability to mid-sized and large-sized systems.
To present the effect of the population size on the behavior of the proposed CBGA, Table 13 reports the solutions reached by this in all the test feeders. This simulation considers population sizes of 20, 50, 100, and 150 for the CBGA. From the results in Table 13, it is possible to note the following: (i) the active power losses and annual operative costs have small variations independent of the population size, and (ii) the required processing times to solve the optimization problem is directly proportional to the number of individuals in the population being a minimum of 20 individuals and the maximum being 150 individuals in all the test feeders.

6. Conclusions and Future Works

The methodology proposed to minimize the losses and operative costs of distribution systems employing fixed-step capacitor banks, based on the interaction between the CBGA and the successive approximations method, allowed power losses and operative costs to be reduced by over 34% and 35%, respectively. This methodology significantly decreased the computational times, with an average of 0.205 s for the 33-node test system and 1.07 s for the 69-node test system, which confirmed its superiority in relation to the methodologies available in the specialized literature, including the GAMS software.
An evaluation of the different population sizes of the proposed CBGA helped determine that the best performance is reached when the population is about 20 individuals, as better solutions regarding power losses and annual operative costs were found when it is compared with GAMS and literature reports, with the main advantage being that minimum processing times are required to solve the optimization problem.
Simulation results helped reach the observation that with the capacitor banks’ installation, the voltage on the farthest nodes from the source node tends toward a better regulation voltage. Besides this, applying CBGA in the radial distribution systems composed of 10, 33 and 69 nodes with radial and meshed structures confirms that this method is outstanding when solving mathematical models of MINLP nature, as the solutions found in the specialized literature are substantially improved with minimum computational times.
As future work, it is proposed that the reactive power compensation problem is expanded to operational environments of 24 h with high penetration of renewable generation as well as the MINLP formulation that represents this problem in a convex equivalent in order to guarantee the optimal solution without multiple evaluations, that is, statistical studies.

Author Contributions

Conceptualization, methodology, software, and writing—review and editing, F.E.R., J.F.C., O.D.M.; H.R.C.; and L.A.-B. All authors have read and agreed to the published version of the manuscript.

Funding

This work was partially supported in part by the Laboratorio de Simulación Hardware-in-the-loop para Sistemas Ciberfísicos under Grant TEC2016-80242-P (AEI/FEDER), in part by the Spanish Ministry of Economy and Competitiveness under Grant DPI2016-75294-C2-2-R, in part by the Centro de Investigación y Desarrollo Científico de la Universidad Distrital Francisco José de Caldas under grant 1643-12-2020 associated with the project “Desarrollo de una metodología de optimización para la gestión óptima de recursos energéticos distribuidos en redes de distribución de energía eléctrica”. and in part by the Dirección de Investigaciones de la Universidad Tecnológica de Bolívar under grant PS2020002 associated with the project: “Ubicación óptima de bancos de capacitores de paso fijo en redes eléctricas de distribución para reducción de costos y pérdidas de energía: Aplicación de métodos exactos y metaheurísticos”.

Conflicts of Interest

The authors declare no conflict of interest.

References

  1. Alvarado-Barrios, L.; Alvarez-Arroyo, C.; Escano, J.M.; Gonzalez-Longatt, F.M.; Martinez-Ramos, J.L. Two-Level Optimisation and Control Strategy for Unbalanced Active Distribution Systems Management. IEEE Access 2020, 8, 197992–198009. [Google Scholar] [CrossRef]
  2. Orosz, T.; Sleisz, A.; Tamus, Z.A. Metaheuristic Optimization Preliminary Design Process of Core-Form Autotransformers. IEEE Trans. Magn. 2016, 52, 1–10. [Google Scholar] [CrossRef]
  3. Lohia, S.; Mahela, O.P.; Ola, S.R. Optimal capacitor placement in distribution system using genetic algorithm. In Proceedings of the 2016 IEEE 7th Power India International Conference (PIICON), Bikaner, India, 25–27 November 2016. [Google Scholar] [CrossRef]
  4. Montoya, O.D.; Molina-Cabrera, A.; Chamorro, H.R.; Alvarado-Barrios, L.; Rivas-Trujillo, E. A Hybrid Approach Based on SOCP and the Discrete Version of the SCA for Optimal Placement and Sizing DGs in AC Distribution Networks. Electronics 2020, 10, 26. [Google Scholar] [CrossRef]
  5. Ramírez, S. Electric Distribution Networks; Universidad Nacional de Colombia: Manizales, Colombia, 2009; pp. 653–843. (In Spanish) [Google Scholar]
  6. Bula, I.; Hoxha, V.; Shala, M.; Hajrizi, E. Minimizing non-technical losses with point-to-point measurement of voltage drop between “SMART” meters. IFAC-PapersOnLine 2016, 49, 206–211. [Google Scholar] [CrossRef]
  7. Fragkioudaki, A.; Cruz-Romero, P.; Gómez-Expósito, A.; Biscarri, J.; de Tellechea, M.J.; Arcos, Á. Detection of Non-technical Losses in Smart Distribution Networks: A Review. In Advances in Intelligent Systems and Computing; Springer: Berlin/Heisenberg, Germany, 2016; pp. 43–54. [Google Scholar] [CrossRef]
  8. Devi, S.; Geethanjali, M. Optimal location and sizing determination of Distributed Generation and DSTATCOM using Particle Swarm Optimization algorithm. Int. J. Electr. Power Energy Syst. 2014, 62, 562–570. [Google Scholar] [CrossRef]
  9. Rafael Lozano, C.; Jaimes, S.; Obando, J.D. Assessment Methodology Energy Efficiency: A Proposal. Rev. Teinnova 2016, 1, 22–41. [Google Scholar] [CrossRef]
  10. Montoya, O.D.; Gil-González, W.; Orozco-Henao, C. Vortex search and Chu-Beasley genetic algorithms for optimal location and sizing of distributed generators in distribution networks: A novel hybrid approach. Eng. Sci. Technol. Int. J. 2020. [Google Scholar] [CrossRef]
  11. Gil-González, W.; Montoya, O.D.; Rajagopalan, A.; Grisales-Noreña, L.F.; Hernández, J.C. Optimal Selection and Location of Fixed-Step Capacitor Banks in Distribution Networks Using a Discrete Version of the Vortex Search Algorithm. Energies 2020, 13, 4914. [Google Scholar] [CrossRef]
  12. Almabsout, E.A.; El-Sehiemy, R.A.; An, O.N.U.; Bayat, O. A Hybrid Local Search-Genetic Algorithm for Simultaneous Placement of DG Units and Shunt Capacitors in Radial Distribution Systems. IEEE Access 2020, 8, 54465–54481. [Google Scholar] [CrossRef]
  13. Tamilselvan, V.; Jayabarathi, T.; Raghunathan, T.; Yang, X.S. Optimal capacitor placement in radial distribution systems using flower pollination algorithm. Alex. Eng. J. 2018, 57, 2775–2786. [Google Scholar] [CrossRef]
  14. Dixit, M.; Kundu, P.; Jariwala, H.R. Optimal integration of shunt capacitor banks in distribution networks for assessment of techno-economic asset. Comput. Electr. Eng. 2018, 71, 331–345. [Google Scholar] [CrossRef]
  15. Mousavi-Khademi, M.R.; Chamorro, H.R.; Mousavi-Khademi, M.; Zareian-Jahromi, M.; Sood, V.K.; Guerrero, J.M.; Martinez, W. Optimal Value-based Prices Placement of DER and V2G using Planet Search Algorithm. In Proceedings of the 2020 IEEE Electric Power and Energy Conference (EPEC), Edmonton, AB, Canada, 9–10 November 2020; pp. 1–6. [Google Scholar] [CrossRef]
  16. Lima Pérez, L.; Vasquez Stanescu, C. An intelligent strategy of power utilities for efficient detection of residential customers under fraudulent conditions. REDIP Rev. Digit. Investig. Postgrado 2014, 3, 501–521. [Google Scholar]
  17. Comisión de Regulación de Energía y Gas. Gestión del Flujo de Potencia Reactiva; Comisión de Regulación de Energía y Gas, Ministerio de Minas y Energia: Bogotá D.C., Colombia, 2005; p. 43.
  18. Ministerio de Minas y Energia. Resolucion CREG 015 del 2018; Ministerio de Minas y Energia: Bogotá D.C., Colombia, 2018.
  19. Gil-González, W.; Garces, A.; Montoya, O.D.; Hernández, J.C. A Mixed-Integer Convex Model for the Optimal Placement and Sizing of Distributed Generators in Power Distribution Networks. Appl. Sci. 2021, 11, 627. [Google Scholar] [CrossRef]
  20. Estrada Soria, G.; Tovar Hernández, J.H.; Gutiérrez Alcaraz, G. Metodology for Capacitor Placement in Distribution Systems using Linear Sensitivity Factors. IEEE Lat. Am. Trans. 2005, 3, 185–192. [Google Scholar] [CrossRef]
  21. Xu, Y.; Dong, Z.Y.; Wong, K.P.; Liu, E.; Yue, B. Optimal capacitor placement to distribution transformers for power loss reduction in radial distribution systems. IEEE Trans. Power Syst. 2013, 28, 4072–4079. [Google Scholar] [CrossRef]
  22. Joyal Isac, S.; Suresh Kumar, K. Optimal capacitor placement in radial distribution system to minimize the loss using fuzzy logic control and hybrid particle swarm optimization. Lect. Notes Electr. Eng. 2015, 326, 1319–1329. [Google Scholar] [CrossRef]
  23. Vuletić, J.; Todorovski, M. Optimal capacitor placement in distorted distribution networks with different load models using Penalty Free Genetic Algorithm. Int. J. Electr. Power Energy Syst. 2016, 78, 174–182. [Google Scholar] [CrossRef]
  24. Mohammedi, R.D.; Mosbah, M.; Hellal, A.; Arif, S. An efficient BBO algorithm for optimal allocation and sizing of shunt capacitors in radial distribution networks. In Proceedings of the 2015 4th International Conference on Electrical Engineering (ICEE), Boumerdes, Algeria, 13–15 December 2015. [Google Scholar] [CrossRef]
  25. Szultka, A.; Malkowski, R. Selection of optimal location and rated power of capacitor banks in distribution network using genetic algorithm. In Proceedings of the 2017 18th International Scientific Conference on Electric Power Engineering (EPE), Kouty nad Desnou, Czech Republic, 17–19 May 2017; pp. 1–6. [Google Scholar] [CrossRef]
  26. Tolba, M.A.; Tulsky, V.N.; Vanin, A.S.; Diab, A.A. Comprehensive analysis of optimal allocation of capacitor banks in various distribution networks using different hybrid optimization algorithms. In Proceedings of the 2017 17th IEEE International Conference on Environment and Electrical Engineering and 2017 1st IEEE Industrial and Commercial Power Systems Europe, EEEIC/I and CPS Europe 2017, Milan, Italy, 6–9 June 2017; pp. 16–22. [Google Scholar] [CrossRef]
  27. George, T.; Youssef, A.R.; Ebeed, M.; Kamel, S. Ant lion optimization technique for optimal capacitor placement based on total cost and power loss minimization. In Proceedings of the 2018 International Conference on Innovative Trends in Computer Engineering (ITCE), Aswan, Egypt, 19–21 February 2018; pp. 350–356. [Google Scholar] [CrossRef]
  28. Shwehdi, M.H.; Mohamed, S.R.; Devaraj, D. Optimal capacitor placement on West–East inter-tie in Saudi Arabia using genetic algorithm. Comput. Electr. Eng. 2018, 68, 156–169. [Google Scholar] [CrossRef]
  29. Abdelsalam, A.A.; Gabbar, H.A. Shunt Capacitors Optimal Placement in Distribution Networks Using Artificial Electric Field Algorithm. In Proceedings of the 2019 IEEE 7th International Conference on Smart Energy Grid Engineering (SEGE), Oshawa, ON, Canada, 12–14 August 2019; pp. 77–85. [Google Scholar] [CrossRef]
  30. Quezada, C.; Torres, J.; Quizhpi, F. Optimal Location of Capacitor Banks by Implementing Heuristic Methods in Distribution Networks. In Proceedings of the 2019 IEEE CHILEAN Conference on Electrical, Electronics Engineering, Information and Communication Technologies (CHILECON), Valparaiso, Chile, 13–27 November 2019; pp. 1–6. [Google Scholar] [CrossRef]
  31. Montoya, O.D.; Ramírez, C.A.; Grisales, L.F. Location and Optimal Sizing of Distributed Generators and Banks Capacitors in Distribution Systems. Sci. Tech. 2018, 23, 308–314. [Google Scholar] [CrossRef]
  32. Abul’Wafa, A.R. Optimal capacitor allocation in radial distribution systems for loss reduction: A two stage method. Electr. Power Syst. Res. 2013, 95, 168–174. [Google Scholar] [CrossRef]
  33. Wilson, J.M. A Genetic Algorithm for the Generalised Assignment Problem. J. Oper. Res. Soc. 1997, 48, 804. [Google Scholar] [CrossRef]
  34. Dunn, A.M.; Hofmann, O.S.; Waters, B.; Witchel, E. Cloaking Malware with the Trusted Platform Module. In Proceedings of the 20th USENIX Security Symposium, San Francisco, CA, USA, 8–12 August 2011. [Google Scholar]
  35. Gallego-Londoño, J.P.; Montoya-Giraldo, O.D.; Hincapié-Isaza, R.A.; Granada-Echeverri, M. Optimal location of reclosers and fuses in distribution systems. ITECKNE 2016, 13, 113. [Google Scholar] [CrossRef]
  36. Montoya, O.D.; Gil-González, W. On the numerical analysis based on successive approximations for power flow problems in AC distribution systems. Electr. Power Syst. Res. 2020, 187, 106454. [Google Scholar] [CrossRef]
  37. Montoya, O.D.; Grisales-Noreña, L.F.; Amin, W.T.; Rojas, L.A.; Campillo, J. Vortex Search Algorithm for Optimal Sizing of Distributed Generators in AC Distribution Networks with Radial Topology. Commun. Comput. Inf. Sci. 2019, 1052, 235–249. [Google Scholar] [CrossRef]
  38. Da Rosa, W.M.; Rossoni, P.; Teixeira, J.C.; Belati, E.A.; Asano, P.T.L. Optimal allocation of capacitor banks using genetic algorithm and sensitivity analysis. IEEE Lat. Am. Trans. 2016, 14, 3702–3707. [Google Scholar] [CrossRef]
  39. Osorio Cruz, F.A. Optimal Location of Electric Power Recharging Stations for Exchange of Batteries for Electric Vehicles; Universidad Tecnológica de Pereira: Pereira, Colombia, 2017; Available online: http://repositorio.utp.edu.co/dspace/handle/11059/8019 (accessed on 5 February 2021). (In Spanish)
  40. Serna, M.A.; Marín, J.L. Genetic Algorithms: An Alternative Solution to Optimize the Inventory Model (Q; r). Master’s Thesis, Universidad Eafit, Medellín, Colombia, 2009. Available online: https://repository.eafit.edu.co/handle/10784/125 (accessed on 5 February 2021). (In Spanish).
  41. Montoya, O.D.; Gil-González, W.; Orozco-Henao, C. On the convergence of the power flow methods for DC networks with mesh and radial structures. Electr. Power Syst. Res. 2021, 191, 106881. [Google Scholar] [CrossRef]
  42. Shen, T.; Li, Y.; Xiang, J. A graph-based power flow method for balanced distribution systems. Energies 2018, 11, 511. [Google Scholar] [CrossRef] [Green Version]
  43. Rao, R.S.; Narasimham, S.V.; Ramalingaraju, M. Optimal capacitor placement in a radial distribution system using Plant Growth Simulation Algorithm. Int. J. Electr. Power Energy Syst. 2011, 33, 1133–1139. [Google Scholar] [CrossRef] [Green Version]
  44. Vita, V. Development of a decision-making algorithm for the optimum size and placement of distributed generation units in distribution networks. Energies 2017, 10, 1433. [Google Scholar] [CrossRef] [Green Version]
  45. Taher, S.A.; Afsari, S.A. Optimal location and sizing of UPQC in distribution networks using differential evolution algorithm. Math. Probl. Eng. 2012, 2012, 838629. [Google Scholar] [CrossRef]
  46. Davoudi, M.; Cecchi, V.; Aguero, J.R. Investigating the ability of meshed distribution systems to increase penetration levels of Distributed Generation. In Proceedings of the Conference Proceedings—IEEE SOUTHEASTCON, Lexington, KY, USA, 13–16 March 2014. [Google Scholar] [CrossRef]
  47. Savier, J.S.; Das, D. Impact of network reconfiguration on loss allocation of radial distribution systems. IEEE Trans. Power Deliv. 2007, 22, 2473–2480. [Google Scholar] [CrossRef]
  48. Das, B.; Kumar, A. Cost optimization of a hybrid energy storage system using GAMS. In Proceedings of the 2017 International Conference on Power and Embedded Drive Control (ICPEDC), Chennai, India, 16–18 March 2017; pp. 89–92. [Google Scholar] [CrossRef]
  49. Montoya, O.D.; Garrido, V.M.; Grisales-Noreña, L.F.; Gil-González, W.; Garces, A.; Ramos-Paja, C.A. Optimal Location of DGs in DC Power Grids Using a MINLP Model Implemented in GAMS. In Proceedings of the 2018 IEEE 9th Power, Instrumentation and Measurement Meeting (EPIM), Salto, Uruguay, 14–16 November 2018; pp. 1–5. [Google Scholar] [CrossRef]
  50. Hijazi, H.; Thiébaux, S. Optimal distribution systems reconfiguration for radial and meshed grids. Int. J. Electr. Power Energy Syst. 2015, 72, 136–143. [Google Scholar] [CrossRef]
Figure 1. Codification proposed for each individual.
Electronics 10 00419 g001
Figure 2. Flow diagram of the proposed CBGA for the optimal location of fixed-step capacitors in distribution systems.
Electronics 10 00419 g002
Figure 3. Schematic interconnection in the 10-node test system.
Electronics 10 00419 g003
Figure 4. Schematic interconnection in the 33-node test system.
Electronics 10 00419 g004
Figure 5. Schematic interconnection of the 69-node test system.
Electronics 10 00419 g005
Figure 6. Schematic interconnection of the 69-node meshed test system.
Electronics 10 00419 g006
Figure 7. Discriminated costs for the 10-node test feeder.
Electronics 10 00419 g007
Figure 8. Behavior of the solutions in the 10-node test system after 100 repetitions.
Electronics 10 00419 g008
Figure 9. Voltage profiles in the 10-node system
Electronics 10 00419 g009
Figure 10. Behavior of the solutions in the 33-node system after 100 repetitions.
Electronics 10 00419 g010
Figure 11. Discriminated costs for the 33-node test feeder.
Electronics 10 00419 g011
Figure 12. Voltage profiles in the 33-node test system.
Electronics 10 00419 g012
Figure 13. Discriminated costs for the 69-node test feeder.
Electronics 10 00419 g013
Figure 14. Behavior of the solutions in the 69-node test system after 100 repetitions.
Electronics 10 00419 g014
Figure 15. Voltage profiles in the 69-node test system.
Electronics 10 00419 g015
Figure 16. Behavior of the solutions in the 69 nodes meshed test system after 100 repetitions.
Electronics 10 00419 g016
Figure 17. Voltage profiles in the 69-node meshed test system.
Electronics 10 00419 g017
Figure 18. Current magnitude at each line of the 69-node test feeder.
Electronics 10 00419 g018
Table 1. Summary of the main approaches reported in the literature regarding optimal placement and sizing of fixed-step capacitor banks.
Optimization MethodObjective FucntionReferenceYear
Linear sensitivies to reduce the set of nodesNPV (i.e., energy losses and investment costs)[20]2005
Mixed-integer linear programming formulationNPV[21]2013
Hybrid approach between fuzzy logic and particle swarm optimizationNPV[22]2014
Penalty-free genetic algorithmNPV[23]2016
Biogeography-based optimizationNPV[24]2015
Binary genetic algorithmImprove the grid voltage level[25]2017
Hybrid optimization algorithms based on heuristicsActive power losses, voltage profile improvements, and NPV[26]2017
Ant lion optimizerEnergy losses and investment costs[27]2018
Genetic algorithmVoltage profile improvement and power losses reduction[28]2018
Artificial electric field algorithmNPV and voltage profile improvement[29]2019
Heuristic method based on grid sensitivitiesPower factor and voltage profile improvement[30]2019
Mixed-integer nonlinear programming model solved in the GAMS optimization packagePower losses minimization[31]2018
Discrete vortex search algorithmNPV[11]2020
Table 2. Criteria used for Chu and Beasley genetic algorithm (CBGA) implementation.
Chu and Beasley genetic algorithm
Size of IP20
Number of iterations200
Successive approximations method
Number of iterations100
Tolerance1 × 10−10
Tests performed by system
Number of evaluations of the CBGA100
Table 3. Possible options of capacitors according to rate and cost.
Option Q c (kvar)Cost (US$/kvar-Year)Option Q c (kvar)Cost (US$/kvar-Year)
11500.500812000.170
23000.350913500.207
34500.2531015000.201
46000.2201116500.193
57500.2761218000.870
69000.1831319500.211
710500.2281421000.176
Table 4. Parameters of the 10-node system.
Node iNode j R ij ( Ω ) X ij ( Ω ) P j (kW) Q j (kvar)
120.12330.41271840460
230.01400.6051980340
340.74631.20501790446
450.69840.608415981840
561.98311.72761610600
670.90530.7886780110
782.05521.1640115060
894.79532.7160980130
9105.34343.02641640200
Table 5. Parameters of the 33-node system.
Node iNode j R ij ( Ω ) X ij ( Ω ) P j (kW) Q j (kvar)Node iNode j R ij ( Ω ) X ij ( Ω ) P j (kW) Q j (kvar)
120.09220.04771006017180.73200.57409040
230.49300.251190402190.16400.15659040
340.36600.18641208019201.50421.35549040
450.38110.1941603020210.40950.47849040
560.81900.7070602021220.70890.93739040
670.18720.61882001003230.45120.30839050
781.71141.235120010023240.89800.7091420200
891.03000.7400602024250.89600.7011420200
9101.04000.740060206260.20300.10346025
10110.19660.0650453026270.28420.14476025
11120.37440.1238603527281.05900.93376020
12131.46801.1550603528290.80420.700612070
13140.54160.71291208029300.50750.2585200600
14150.59100.5260601030310.97440.963015070
15160.74630.5450602031320.31050.3619210100
16171.28601.7210602032330.34100.53026040
Table 6. Parameters of the 69-node test system.
Node iNode j R ij ( Ω ) X ij ( Ω ) P j (kW) Q j (kvar)Node iNode j R ij ( Ω ) X ij ( Ω ) P j (kW) Q j (kvar)
120.00050.00120.000.003360.00440.010826.0018.55
230.00050.00120.000.0036370.06400.156526.0018.55
340.00150.00360.000.0037380.10530.12300.000.00
450.02510.02940.000.0038390.03040.035524.0017.00
560.36600.18642.602.2039400.00180.002124.0017.00
670.38100.194140.4030.0040410.72830.85091.201.00
780.09220.047075.0054.0041420.31000.36230.000.00
890.04930.025130.0022.0042430.04100.04786.004.30
9100.81900.270728.0019.0043440.00920.01160.000.00
10110.18720.0619145.00104.0044450.10890.137339.2226.30
11120.71140.2351145.00104.0045460.00090.001229.2226.30
12131.03000.34008.005.004470.00340.00840.000.00
13141.04400.34508.005.5047480.08510.208379.0056.40
14151.05800.34960.000.0048490.28980.7091384.70274.50
15160.19660.065045.5030.0049500.08220.2011384.70274.50
16170.37440.123860.0035.008510.09280.047340.5028.30
17180.00470.001660.0035.0051520.33190.11143.602.70
18190.32760.10830.000.009530.17400.08864.353.50
19200.21060.06901.000.6053540.20300.103426.4019.00
20210.34160.1129114.0081.0054550.28420.144724.0017.20
21220.01400.00465.003.5055560.28130.14330.000.00
22230.15910.05260.000.0056571.59000.53370.000.00
23240.34630.114528.0020.0057580.78370.26300.000.00
24250.74880.24750.000.0058590.30420.1006100.0072.00
25260.30890.102114.0010.0059600.38610.11720.000.00
26270.17320.057214.0010.0060610.50750.25851244.00888.00
3280.00440.010826.0018.6061620.09740.049632.0023.00
28290.06400.156526.0018.6062630.14500.07380.000.00
29300.39780.13150.000.0063640.71050.3619227.00162.00
30310.07020.02320.000.0064651.04100.530259.0042.00
31320.35100.11600.000.0011660.20120.061118.0013.00
32330.83900.281614.0010.0066670.04700.014018.0013.00
33341.70800.564619.5014.0012680.73940.244428.0020.00
34351.47400.48736.004.0068690.00470.001628.0020.00
Table 7. Parameters of the 69 nodes meshed test system.
Node iNode j R ij ( Ω ) X ij ( Ω )
11430.50.5
13210.50.5
15461.00.5
50592.01.0
27651.00.5
Table 8. Capacitors location in the 10-node test system.
MethodSize(Node) (MVAr)Losses (kW)
PGSA [43]{1.20(5),1.20(6),0.20(9),0.407(10)}694.93
GAMS{2.10(4),2.10(5),1.95(6),0.75(10)}692.93
CBGA{2.10(4),1.95(5),1.95(6),0.75(10)}691.99
MethodC. Caps. US$C. Total US$
PGSA [43]15,918118,340
GAMS13,576117,771
CBGA13,995117,655
Table 9. Location of capacitors in the 33-node test system
MethodSize(Node) (MVAr)Losses (kW)
FPA [13]{0.45(13),0.45(24),0.90(30)}139.075
GAMS{0.30(14),0.45(24),1.05(30)}138.799
DVSA [11]{0.45(12),0.45(24),1.05(30)}138.416
CBGA{0.45(12),0.45(24),1.05(30)}138.416
MethodC. Caps. US$C. Total US$
FPA [13]392.423,757.00
GAMS458.023,776.00
DVSA [11]467.1 23,720.99
CBGA467.123,720.99
Table 10. Location of capacitors in the 69-node test system.
MethodSize(Node) (MVAr)Losses (kW)
FPA [13]{0.45(11),0.15(22),1.35(61)}145.86
GAMS{0.45(11),0.15(27),1.20(61)}145.58
DVSA [11]{0.30(11),0.30(18),1.20(61)}145.39
CBGA{0.45(12),0.15(22),1.20(61)}145.37
MethodC. Caps. US$C. Total US$
FPA [13]468.3024,972.78
GAMS392.8524,851.27
DVSA [11]414.0024,841.65
CBGA392.8524,814.00
Table 11. Location of capacitors in the 69 nodes meshed test system.
MethodSize(Node) (MVAr)Losses (kW)
GAMS{0.45(11),0.60(49),1.2(61)}55.120
CBGA{0.45(21),0.45(50),1.2(61)}55.008
MethodC. Caps. US$C. Total US$
GAMS449.859710.2
CBGA431.669673.0
Table 12. Run time for the test systems (s).
SystemGAMSFPAPGSADVSACBGA
10 nodes3-11-0.20
33 nodes837.75-1.330.15
69 nodes (radial)807.2618.36-4.011.07
69 nodes (meshed)750.62---1.18
Table 13. Relation between population sizes, processing times, and objective functions.
SystemPopulation SizeLosses (kW)C. Total US$Run Time(s)
10 nodes20
50
100
150
691.99
693.55
692.42
693.66
117,655
117,720
117,773
117,817
0.20
0.21
0.21
0.46
33 nodes20
50
100
150
138.42
139.07
138.67
138.76
23,721
23,757
23,764
23,722
0.15
0.57
0.62
0.70
69 nodes (radial)20
50
100
150
145.37
145.46
145.30
145.49
24,814
24,830
24,834
24,836
1.07
1.69
1.70
1.95
69 nodes (meshed)20
50
100
150
55.008
55.209
55.206
55.131
9673.0
9706.9
9706.3
9711.9
1.19
1.32
1.41
1.76
Publisher’s Note: MDPI stays neutral with regard to jurisdictional claims in published maps and institutional affiliations.

