
Control of Photovoltaic Plants Interconnected via VSC to Improve Power Oscillations in a Power System

 , ,
, ,  ,
,  and
and 
Abstract
:1. Introduction
2. Proposed Methodology
3. Photovoltaic Power Plants
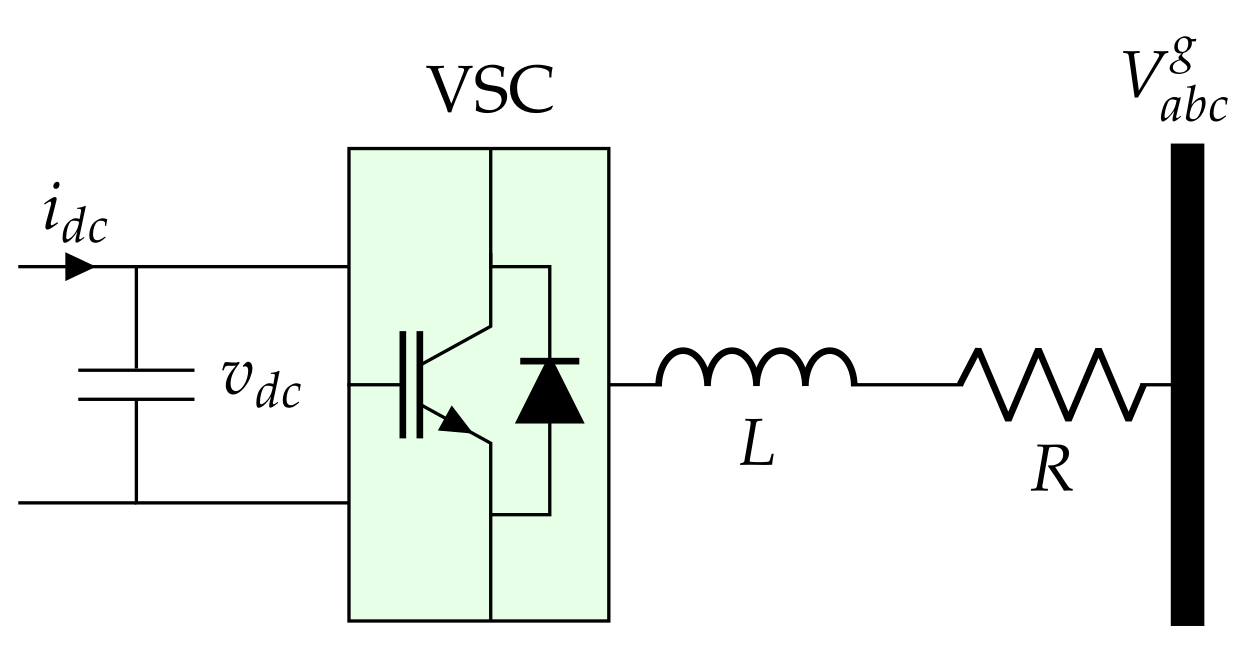
Dynamic Model of a VSC
4. IDA-PBC Method
4.1. Open-Loop Structure
- They are composed of two matrices that contain information on the interconnection between state variables and the energy dissipation properties of the system.
- They have an open-loop passive structure that can be utilized in a closed-loop design via passivity-based control theory.
- They are generally non-linear mathematical formulations that represent dynamical systems which can be derived from the Euler-Lagrange equations.
4.2. Desired Closed-Loop Structure
4.3. Controller Design
4.4. Stability Test of the Controller
5. Test System and Simulation Cases
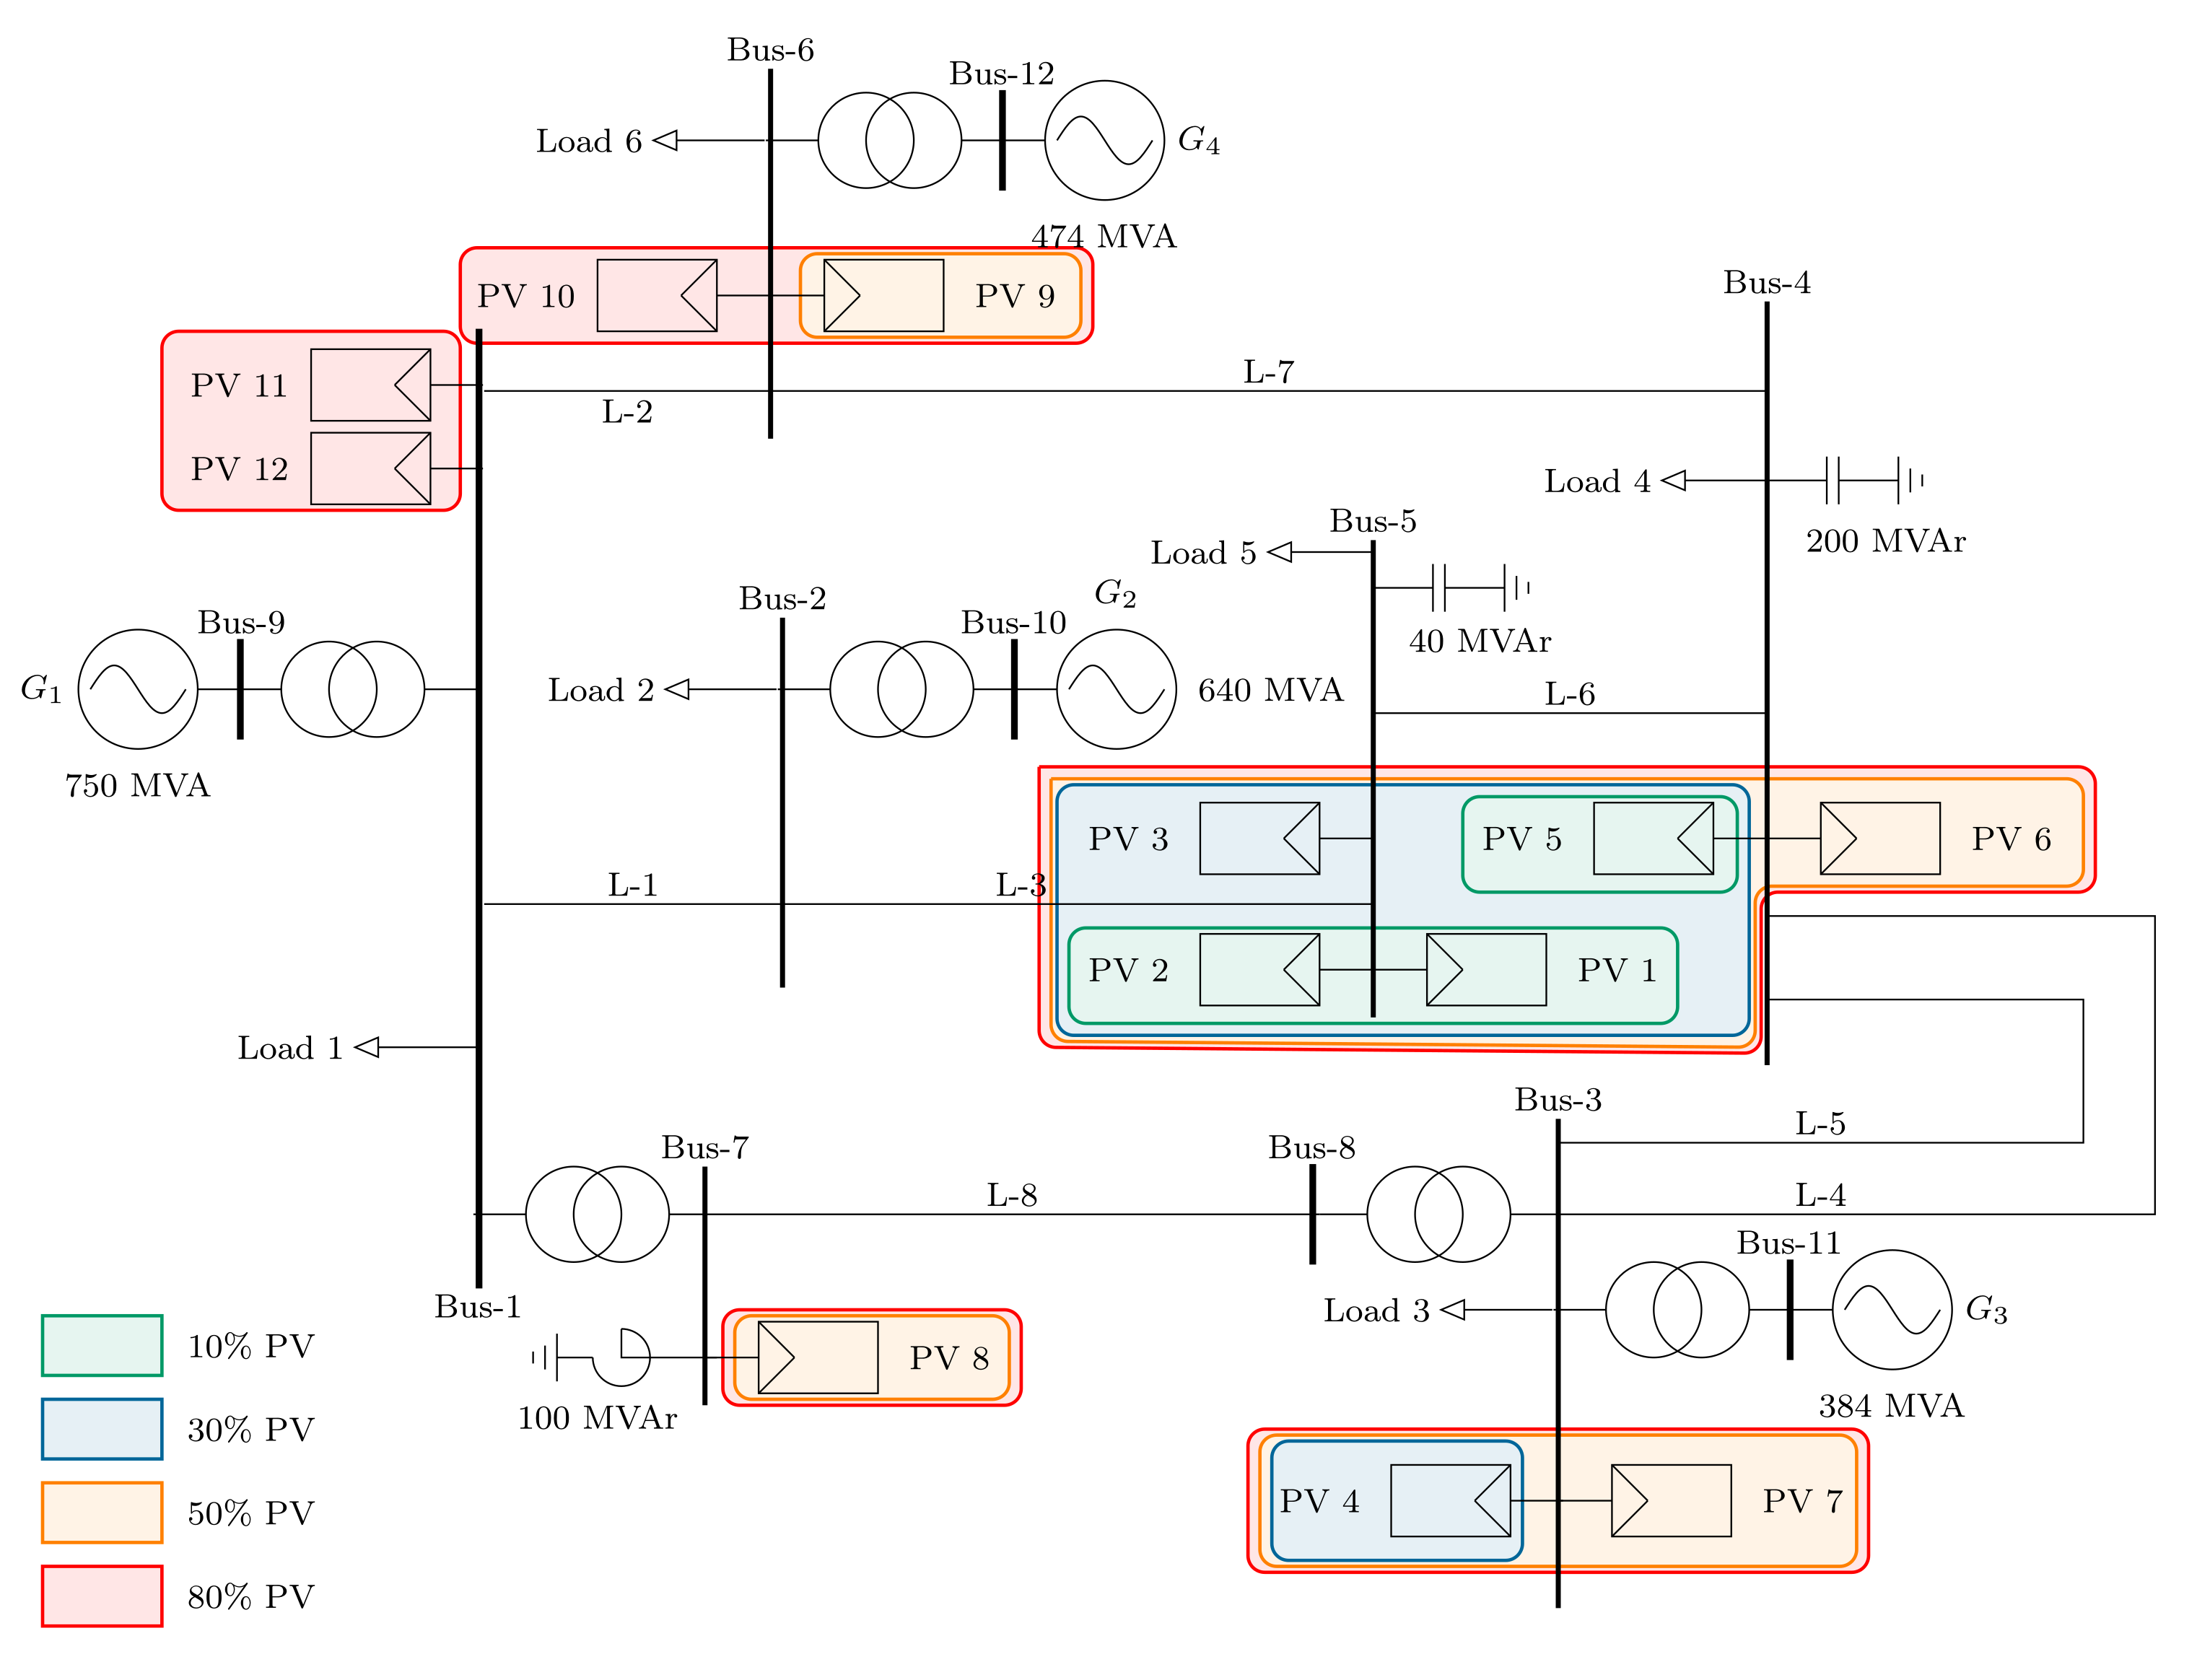
5.1. Test System
5.2. Simulation Cases
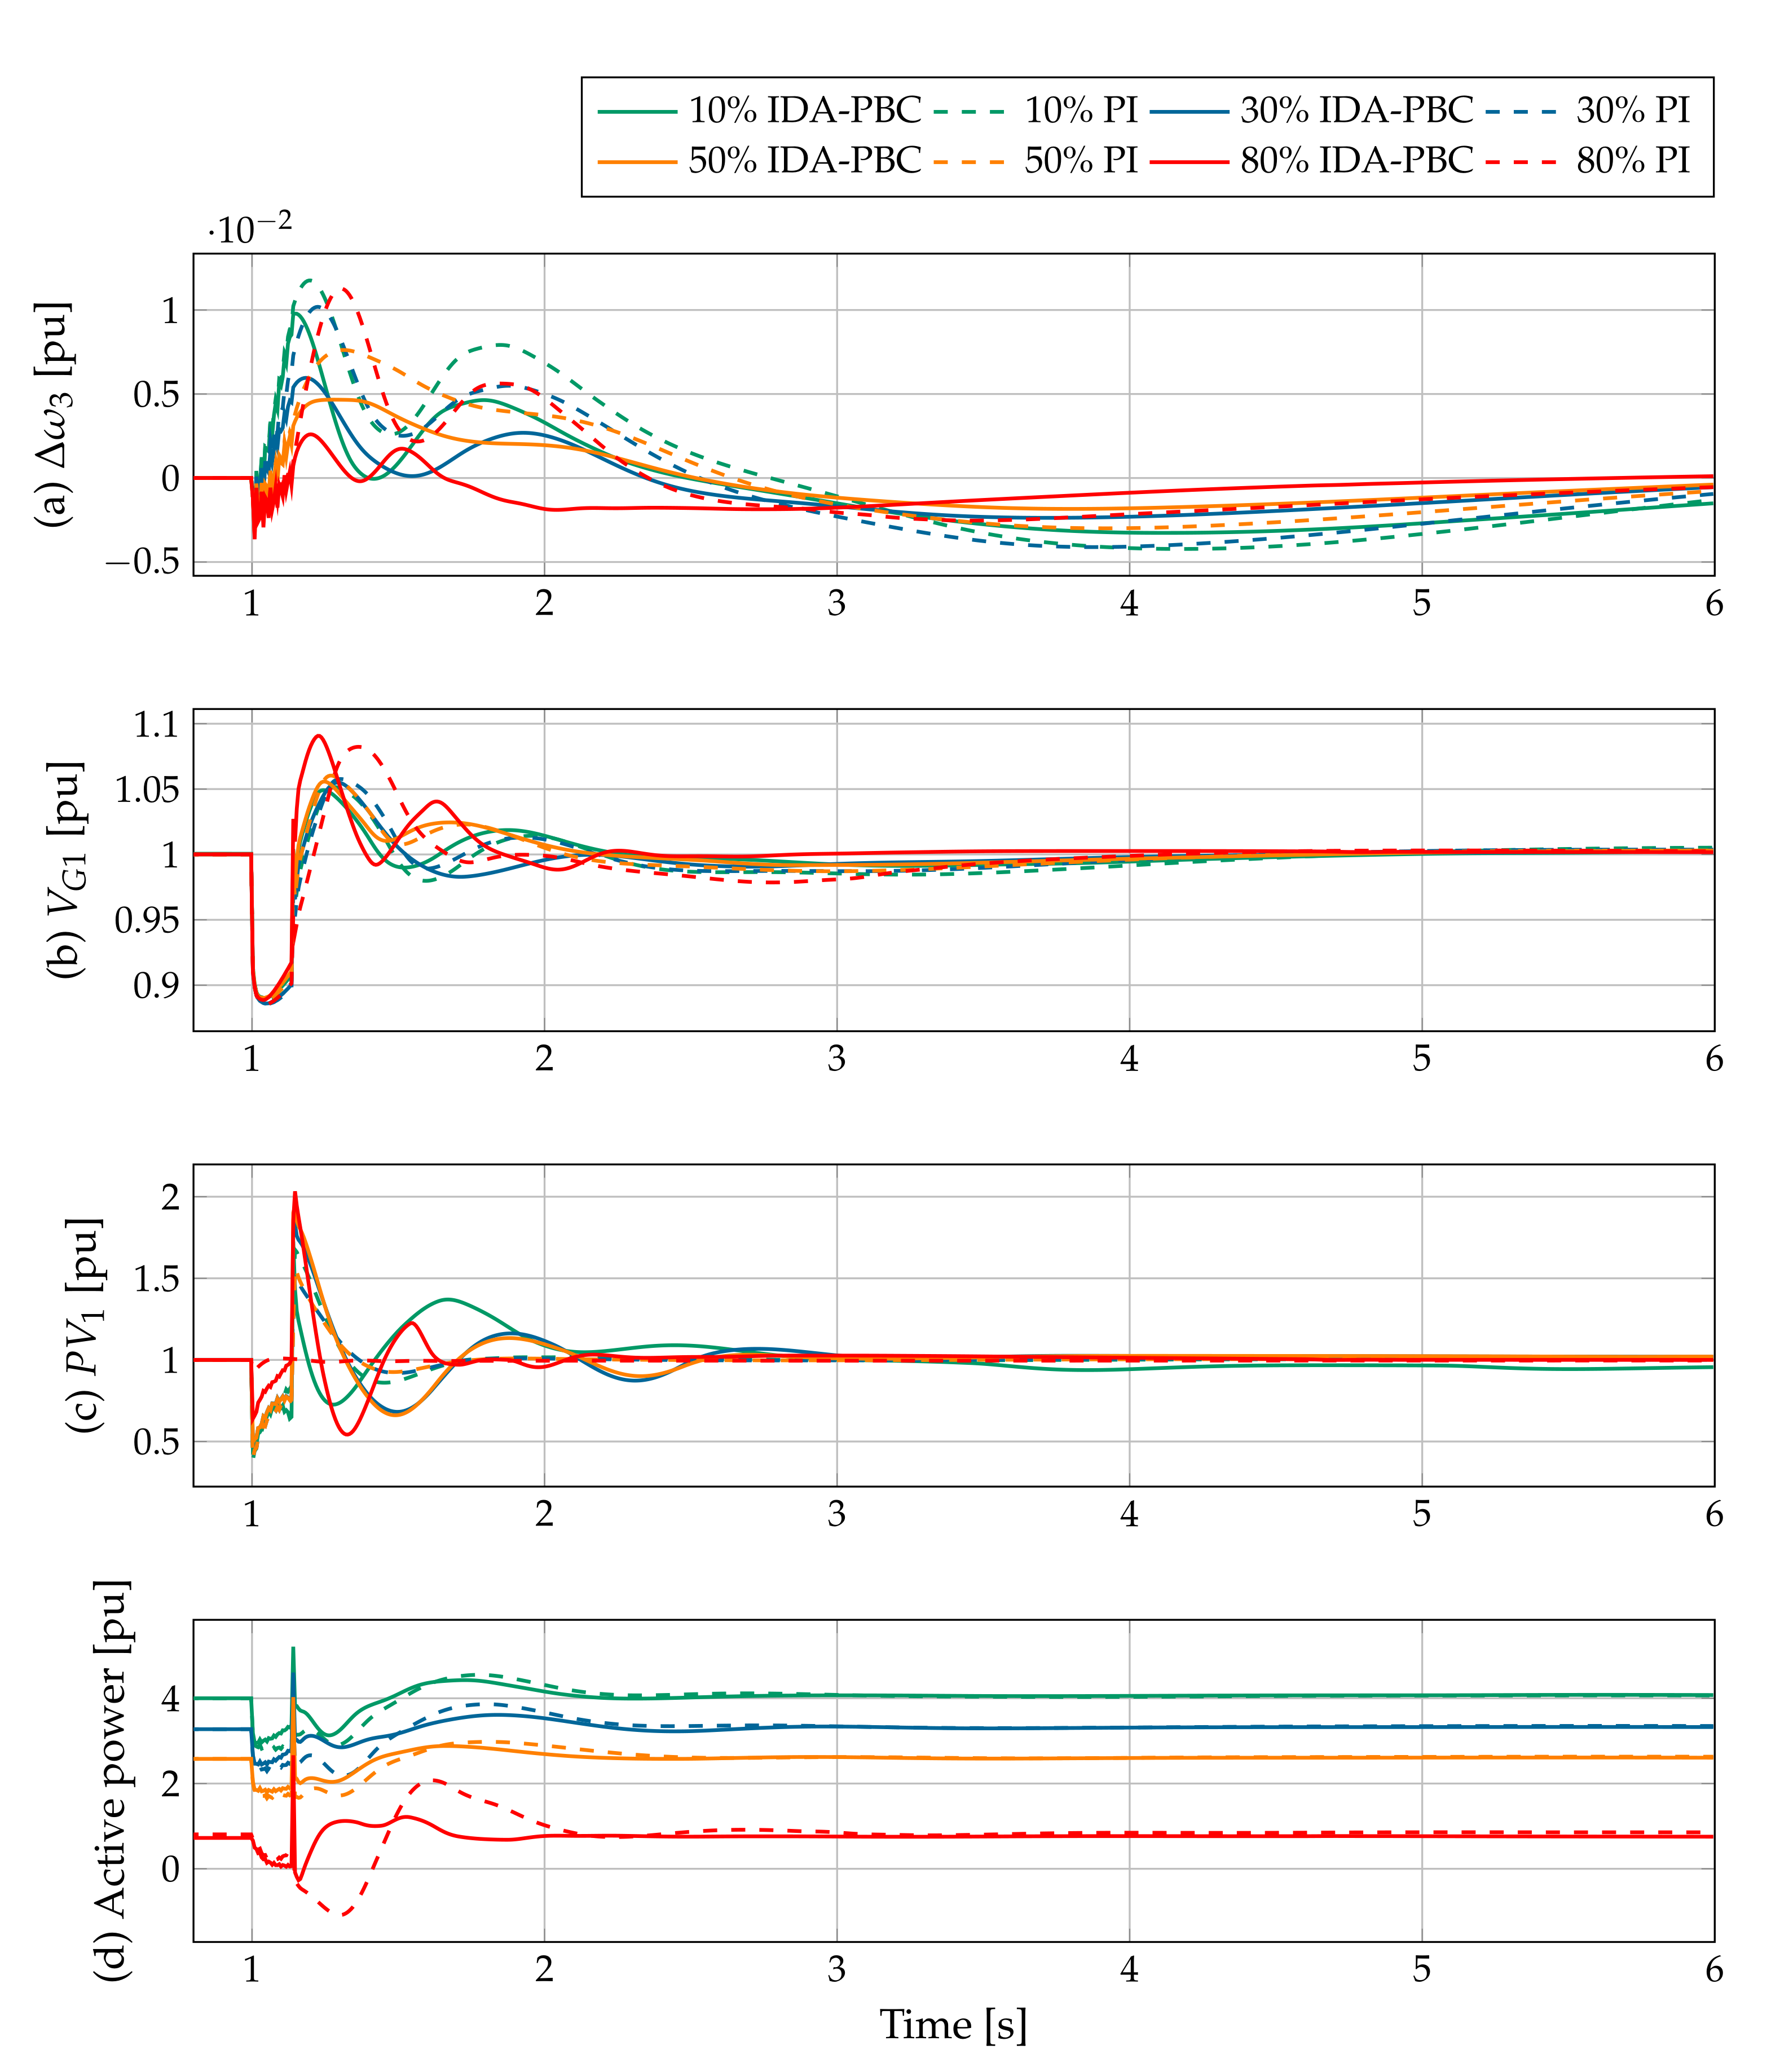
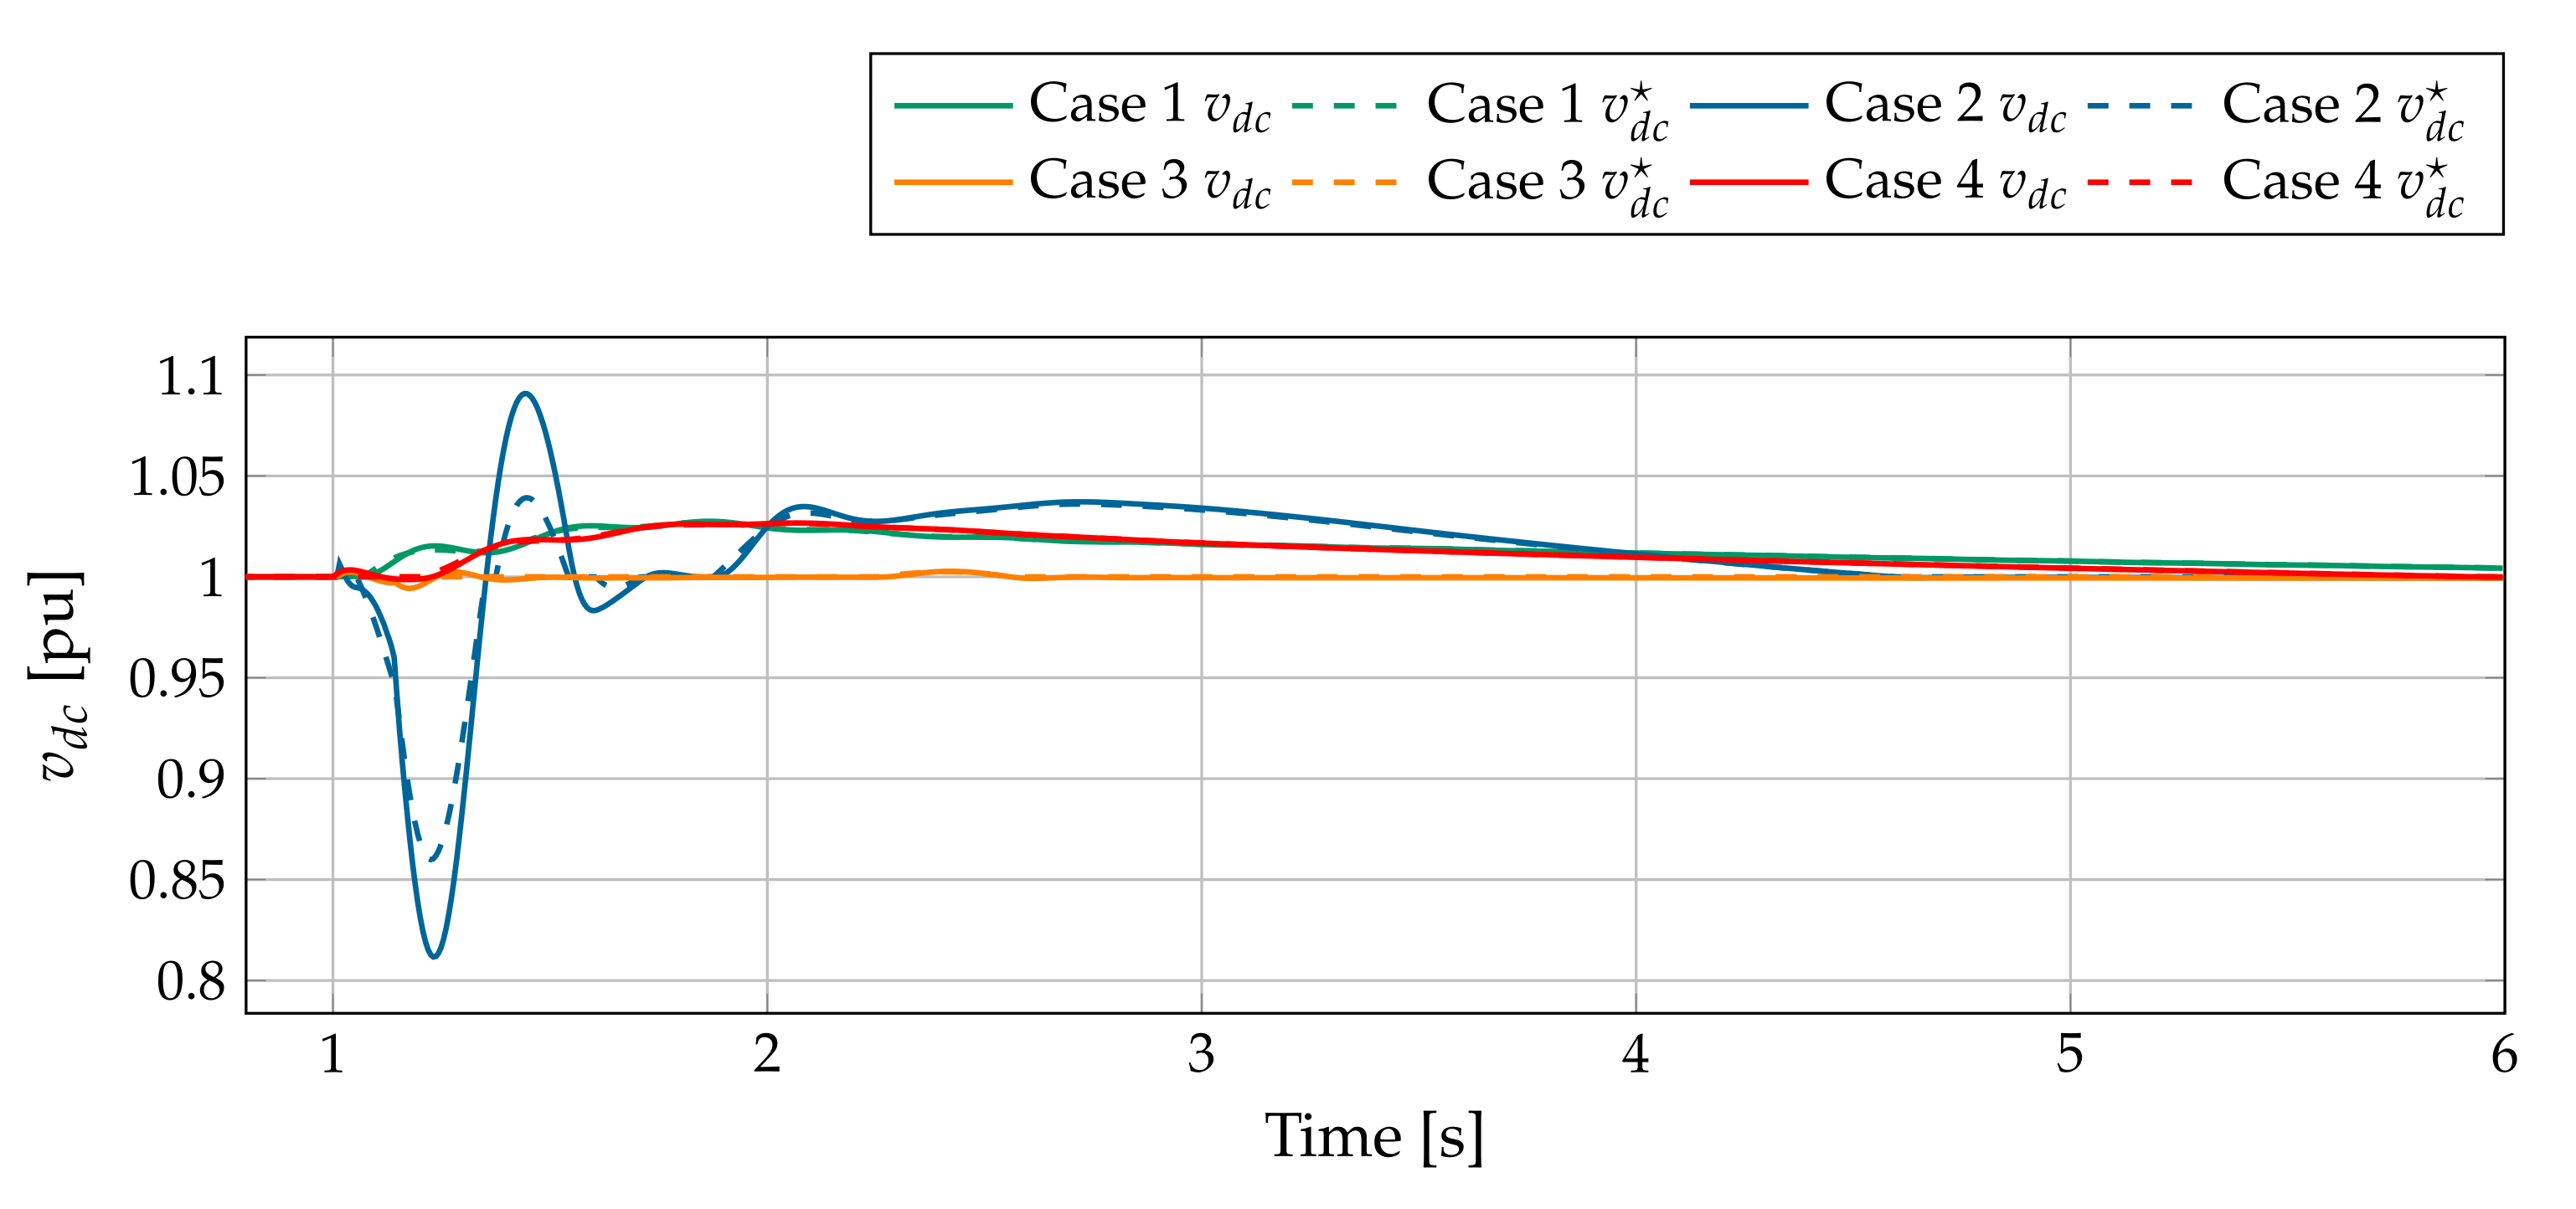
- First case: generator 4 is assumed to be disconnected abruptly.
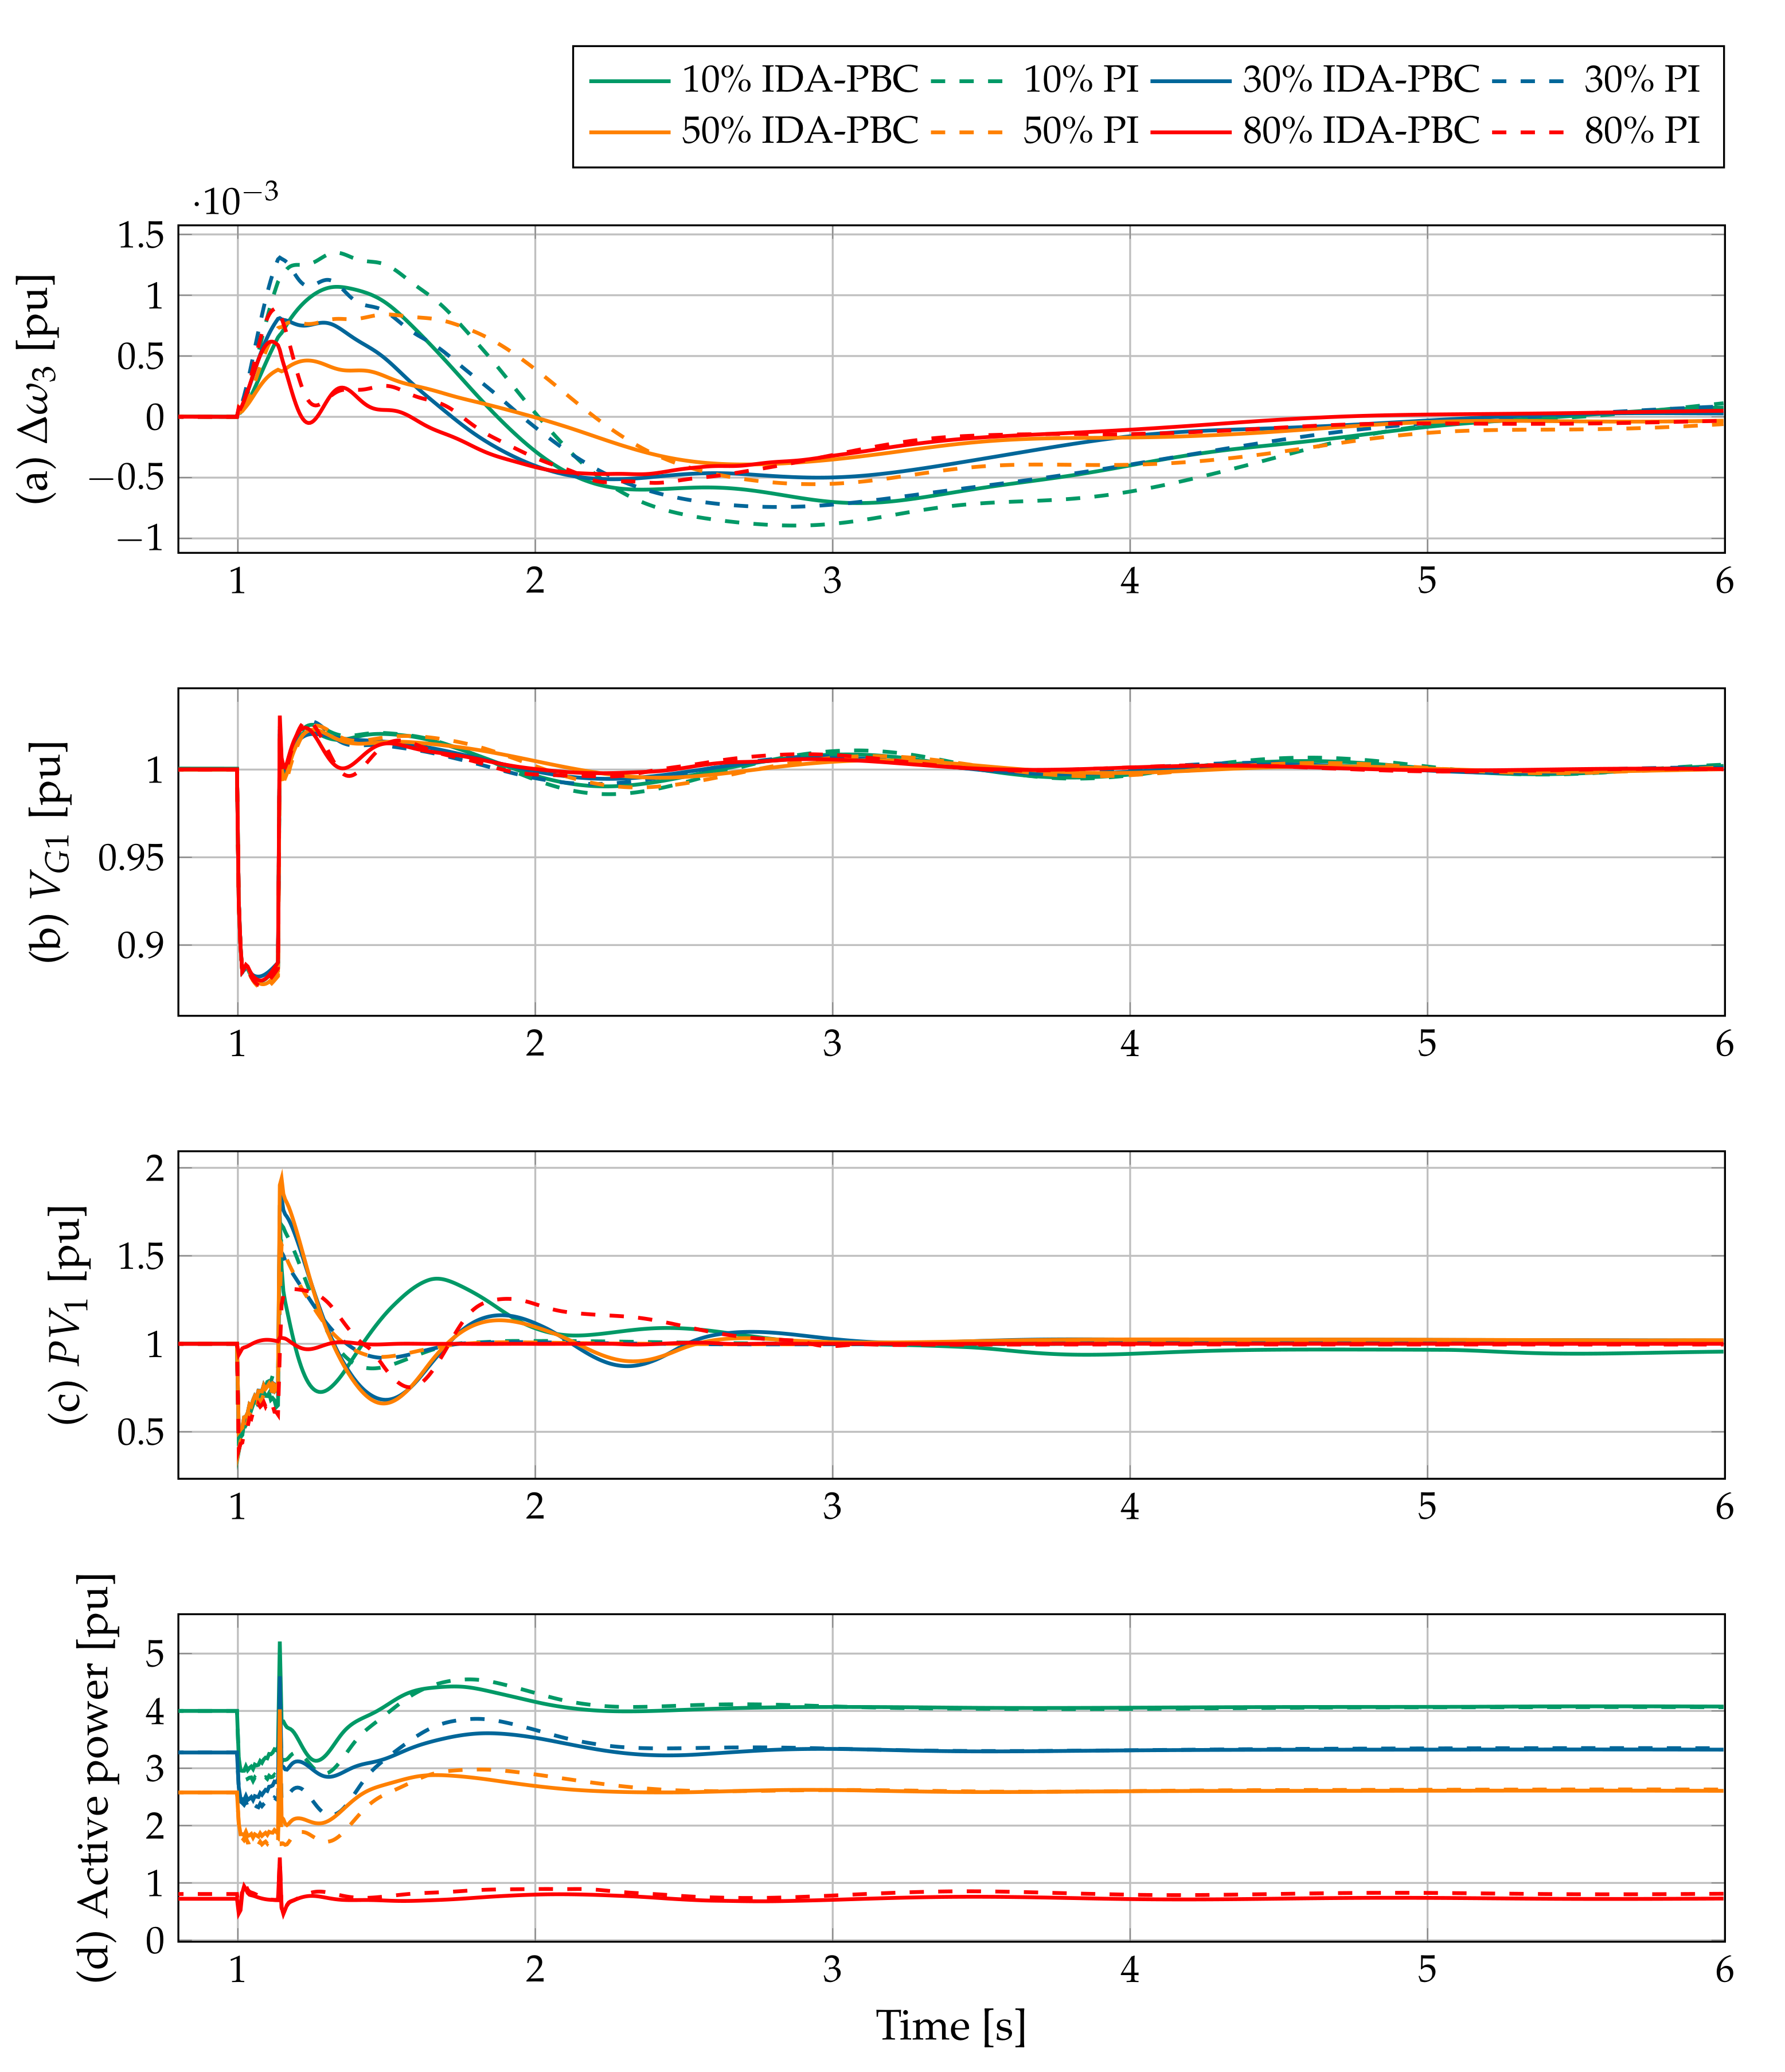
- Second case: a short circuit on bus 8 for a period of 140 ms is considered.
- Third case: a permanent short circuit three-phase to the ground in the middle of line L-2 is considered. It is also supposed that the protection system operates at 140 ms.
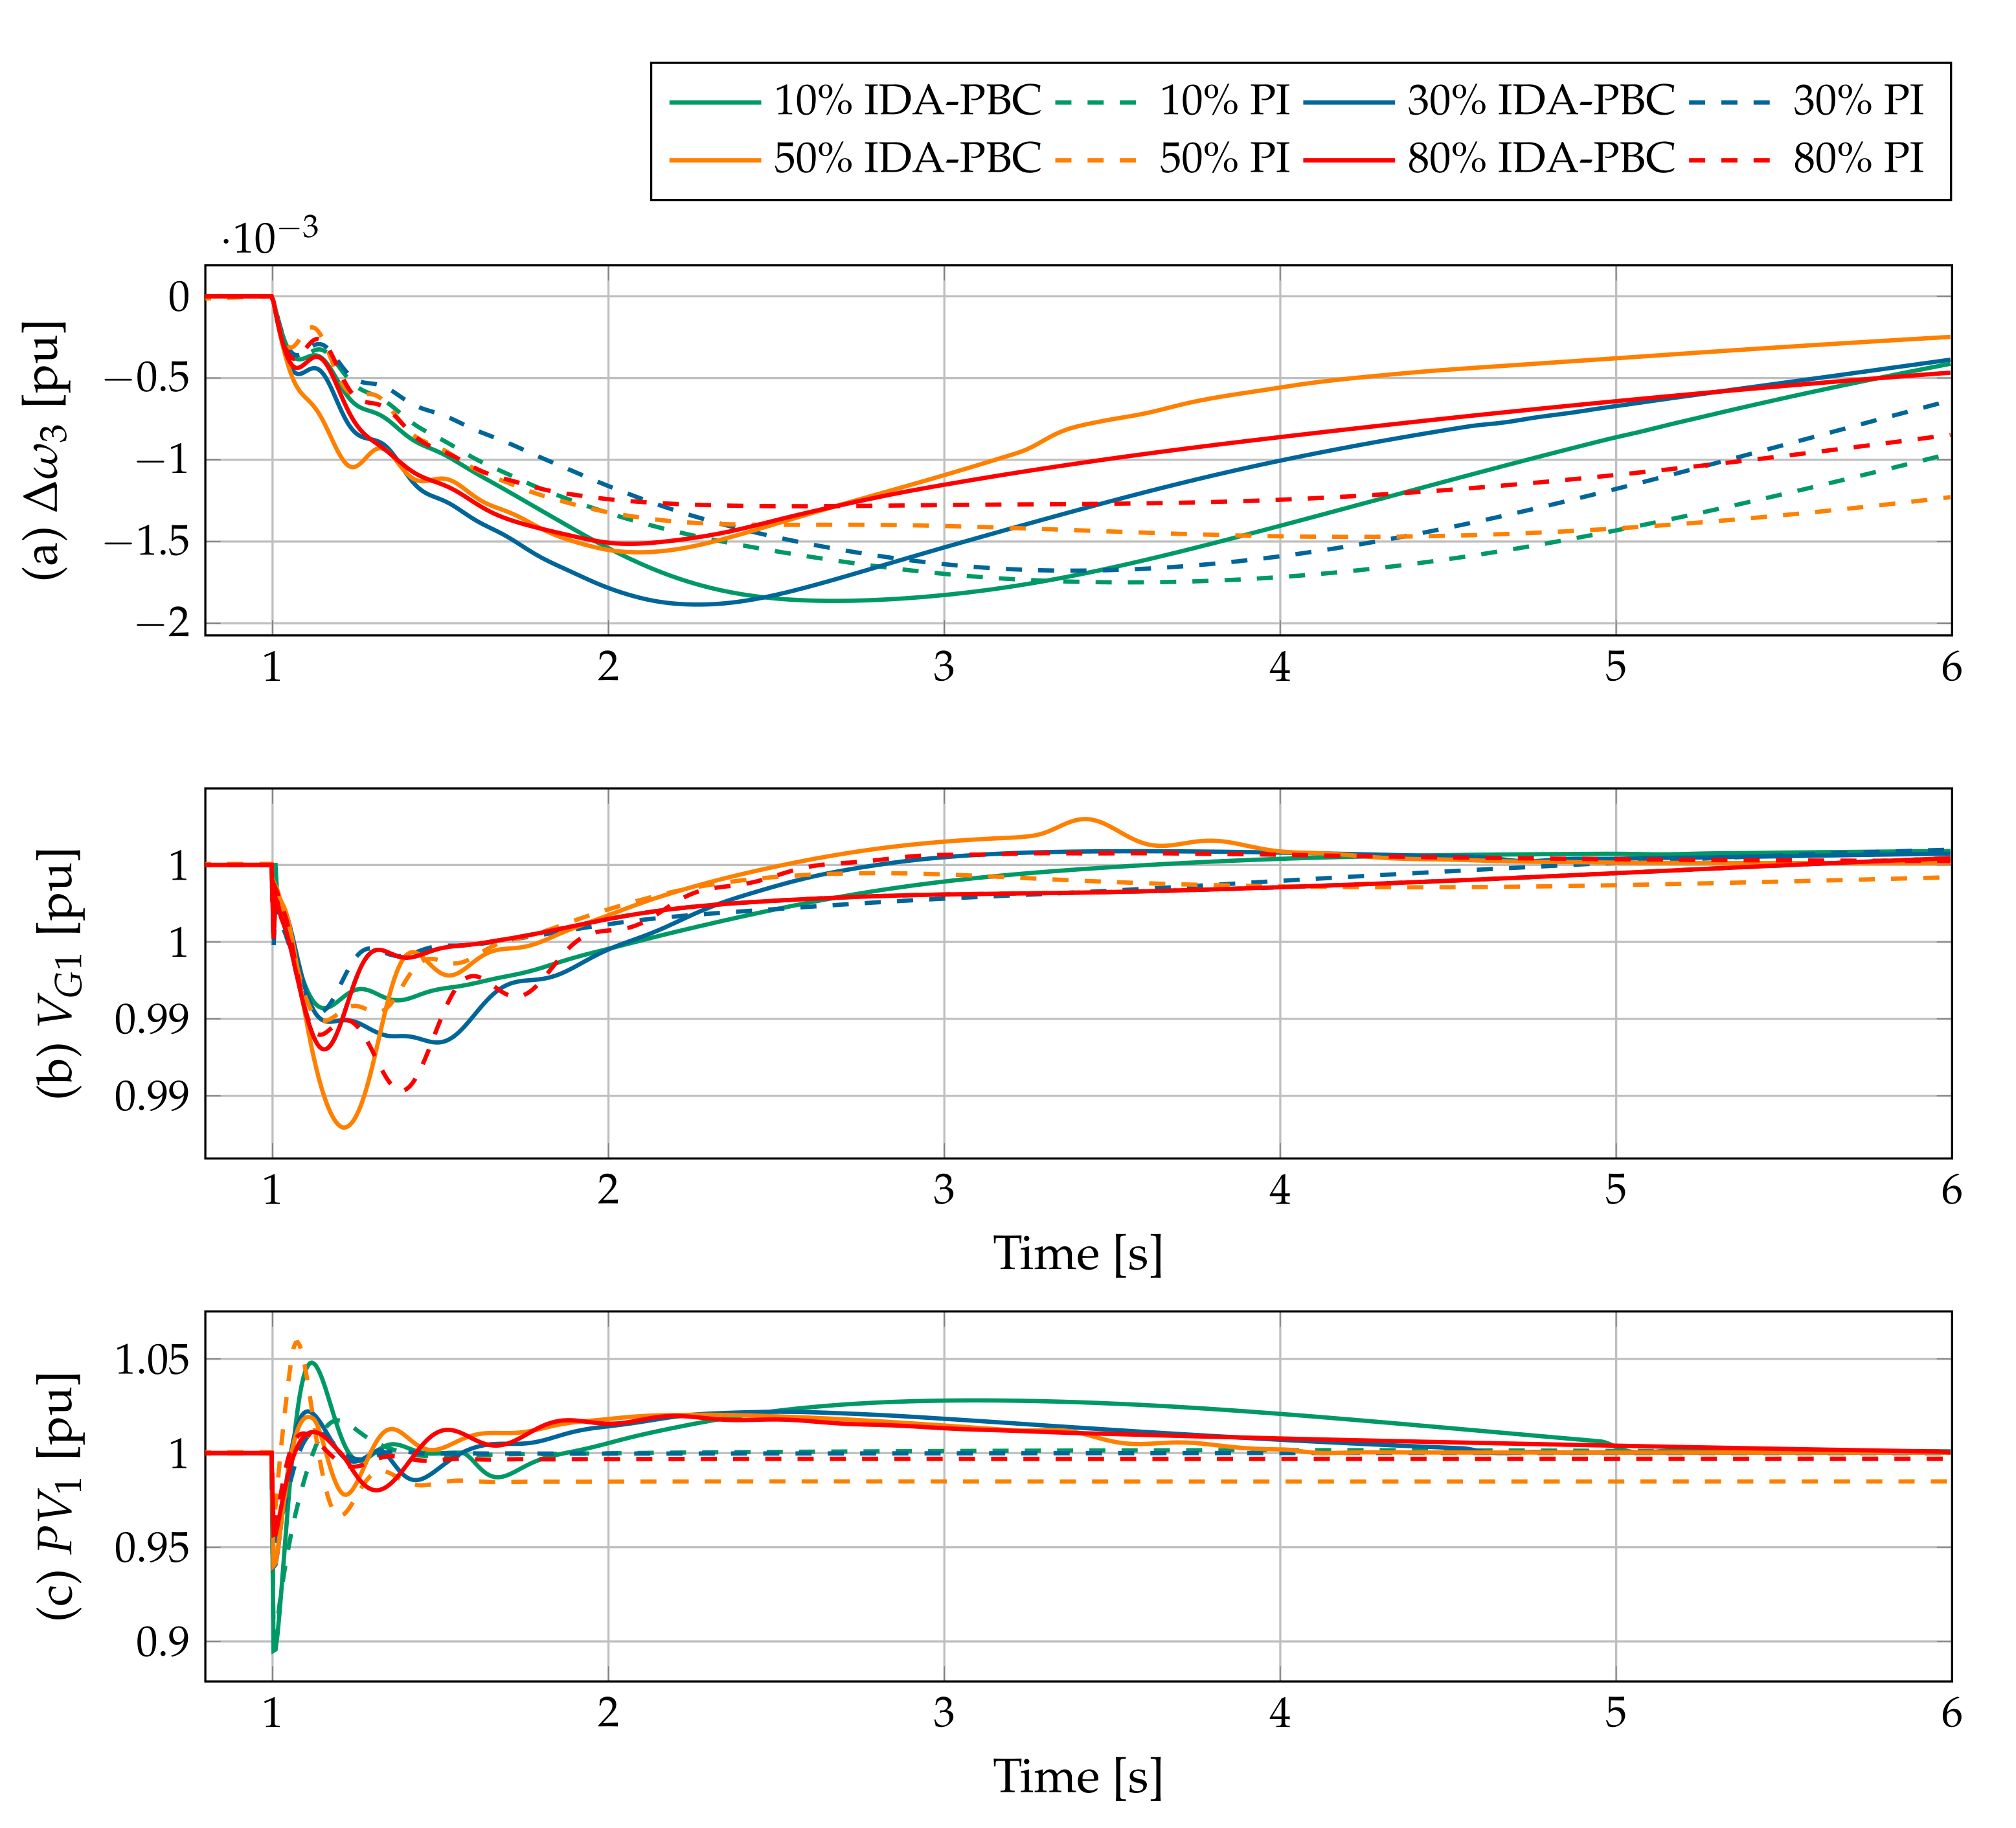
- Fourth case: a load (equivalent to load 5) is considered to be connected abruptly at bus 5.
- Scenario 1: three PV plants with a 10% penetration level are considered. These represent the current power systems that incorporate renewable energy.
- Scenario 2: five PV plants with a penetration level of 30% are assumed in this scenario. These represent an eventual power system with renewable energy inclusion in the short term.
- Scenario 3: nine PV plants with a 50% penetration level are considered. This denotes a feasible situation with a penetration that exceeds the current limits of renewable inclusion.
- Scenario 4: twelve PV plants with an 80% penetration level are considered.
6. Results
6.1. First Case
6.2. Second Case
6.3. Third Case
6.4. Fourth case
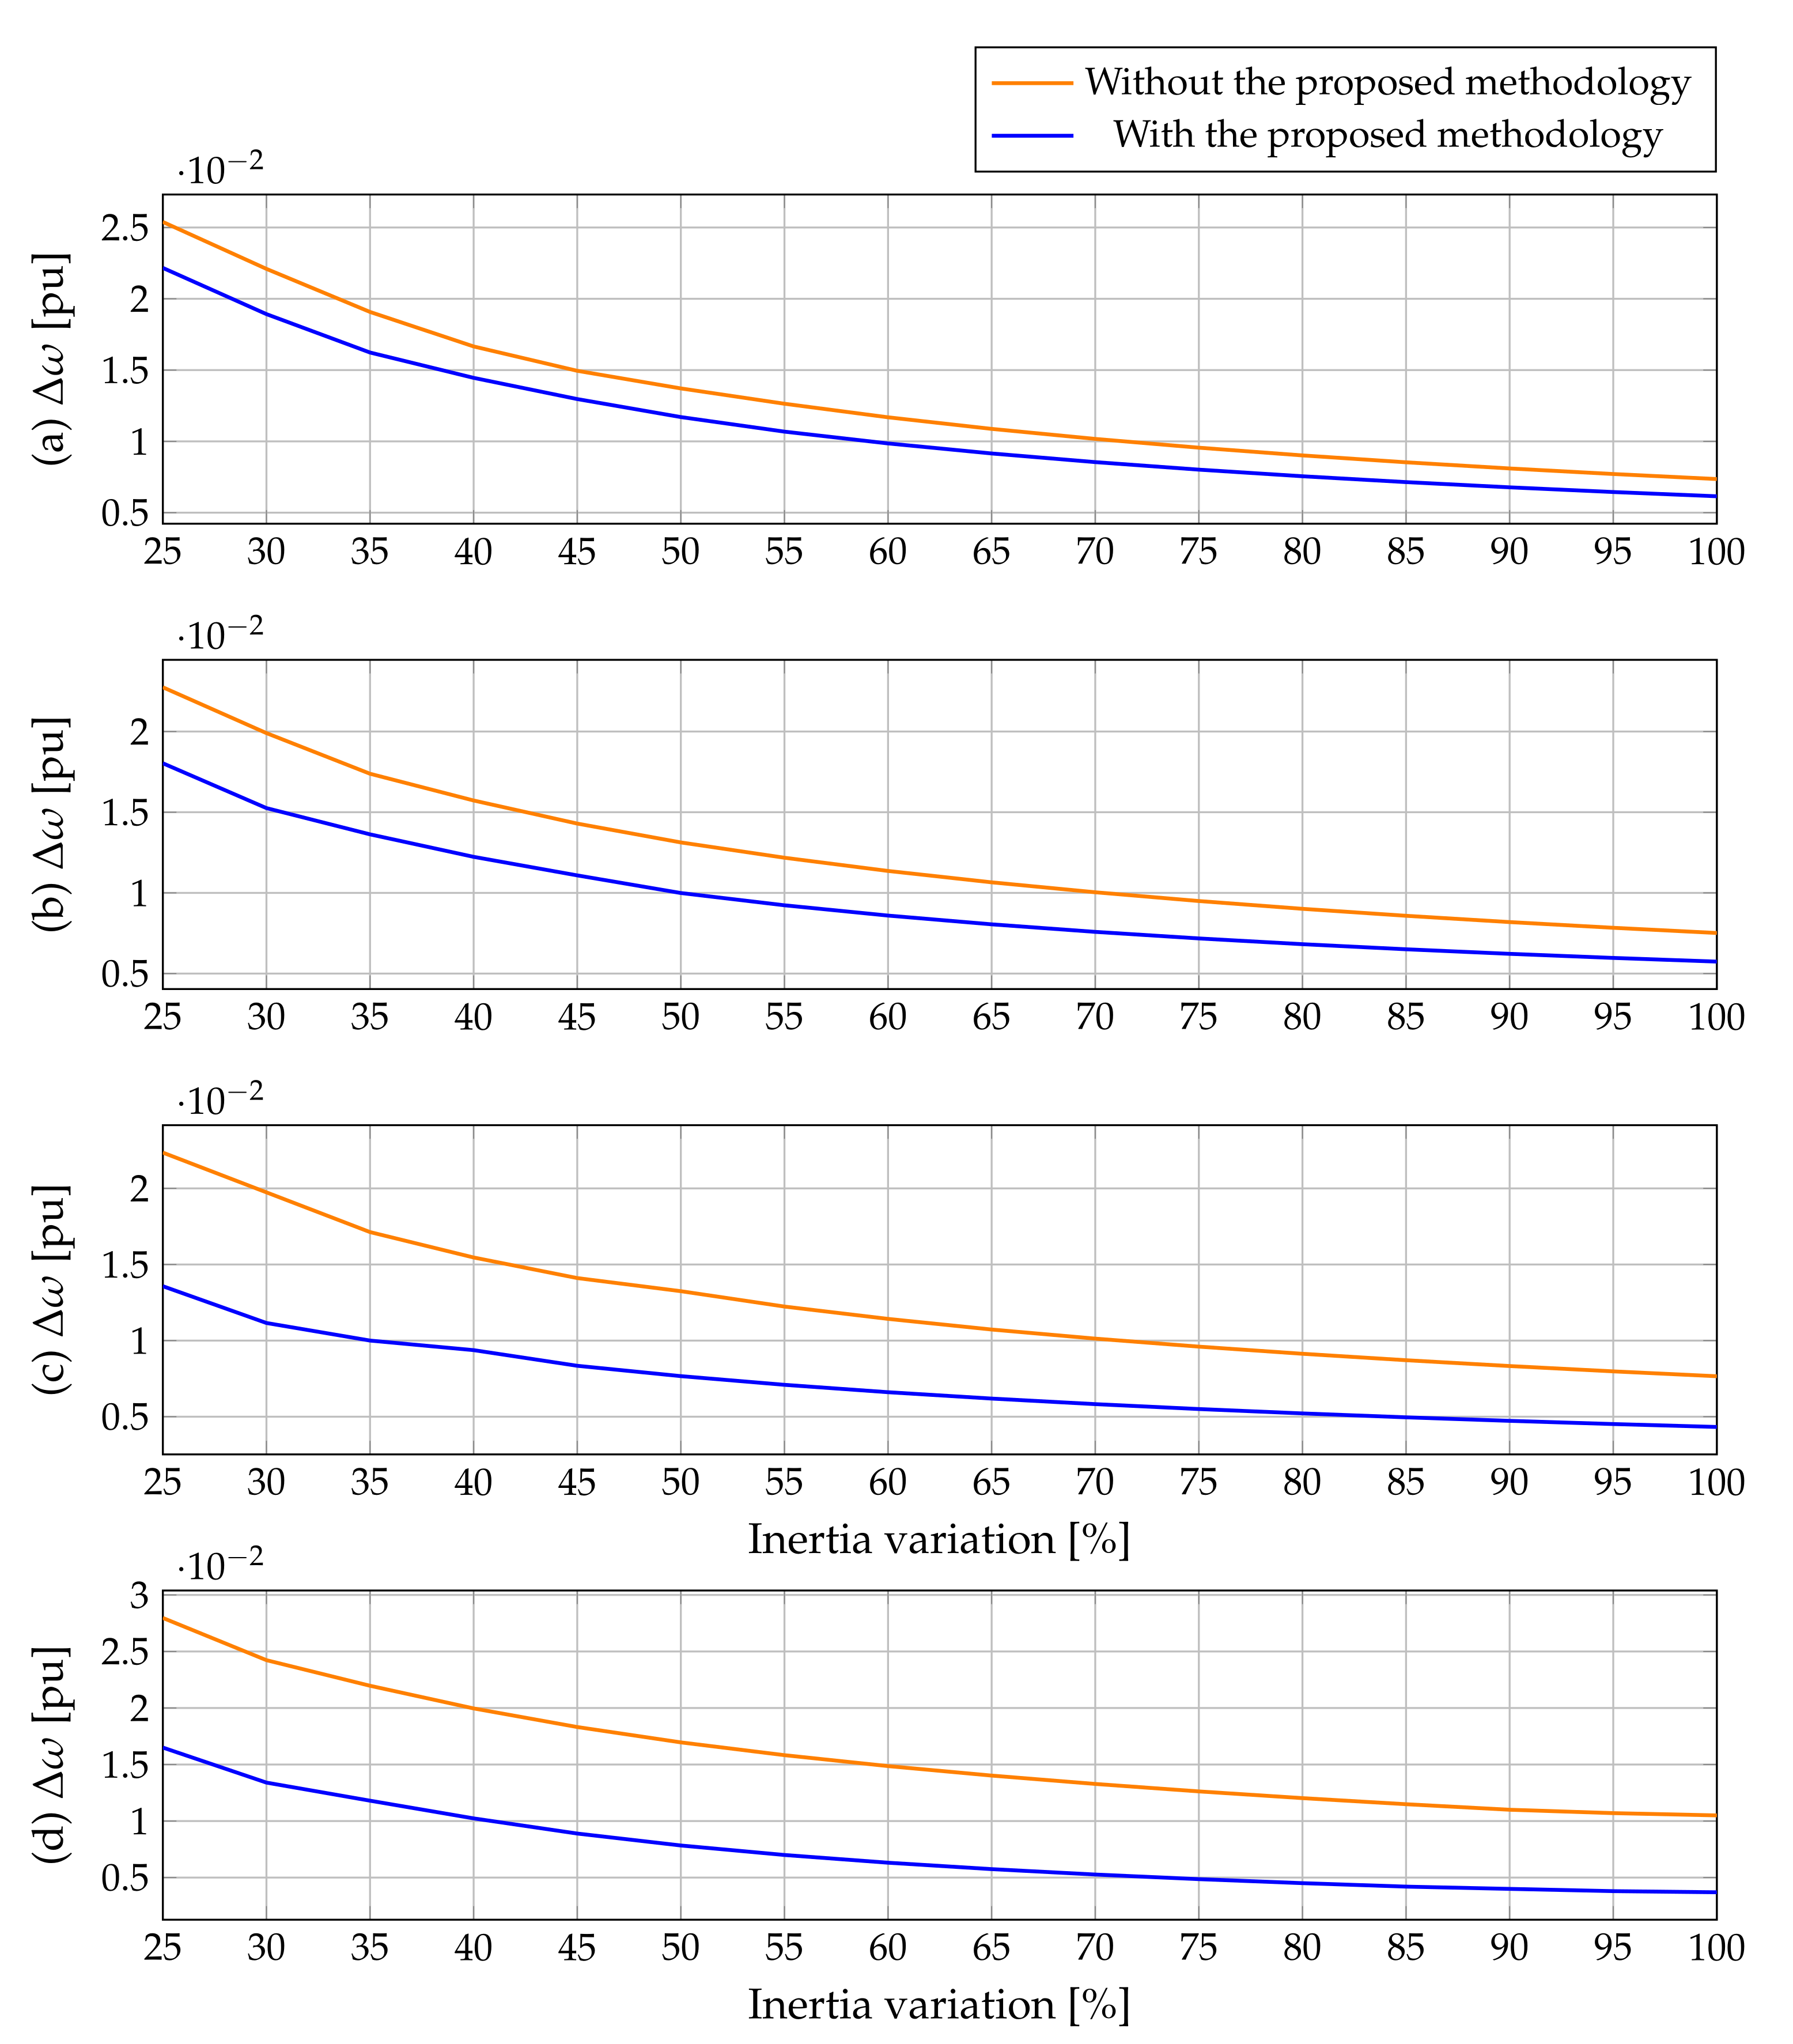
6.5. Analysis of the Decrease in Inertia
6.6. Complementary Analysis
7. Conclusions
Author Contributions
Funding
Data Availability Statement
Conflicts of Interest
References
- Gil-González, W.; Garces, A.; Fosso, O.B.; Escobar-Mejía, A. Passivity-based control of power systems considering hydro-turbine with surge tank. IEEE Trans. Power Syst. 2019, 35, 2002–2011. [Google Scholar] [CrossRef]
- Ruiz, X. Role of the european union in the climate change negotiations. In UNISCI Discussion Papers; Taylor & Francis: London, UK, 2015; pp. 105–129. [Google Scholar]
- Kabir, E.; Kumar, P.; Kumar, S.; Adelodun, A.A.; Kim, K.H. Solar energy: Potential and future prospects. Renew. Sustain. Energy Rev. 2018, 82, 894–900. [Google Scholar] [CrossRef]
- Jäger-Waldau, A.; Kougias, I.; Taylor, N.; Thiel, C. How photovoltaics can contribute to GHG emission reductions of 55% in the EU by 2030. Renew. Sustain. Energy Rev. 2020, 126, 109836. [Google Scholar] [CrossRef]
- Milano, F.; Manjavacas, A.O. Frequency Variations in Power Systems: Modeling, State Estimation, and Control; John Wiley & Sons: Hoboken, NJ, USA, 2020. [Google Scholar]
- Eftekharnejad, S.; Vittal, V.; Heydt, G.T.; Keel, B.; Loehr, J. Impact of increased penetration of photovoltaic generation on power systems. IEEE Trans. Power Syst. 2013, 28, 893–901. [Google Scholar] [CrossRef]
- Eftekharnejad, S.; Vittal, V.; Heydt, G.T.; Keel, B.; Loehr, J. Small signal stability assessment of power systems with increased penetration of photovoltaic generation: A case study. IEEE Trans. Sustain. Energy 2013, 4, 960–967. [Google Scholar] [CrossRef]
- Harnefors, L.; Yepes, A.G.; Vidal, A.; Doval-Gandoy, J. Passivity-Based Controller Design of Grid-Connected VSCs for Prevention of Electrical Resonance Instability. IEEE Trans. Ind. Electron. 2015, 62, 702–710. [Google Scholar] [CrossRef]
- Kazemi Golkhandan, R.; Aghaebrahimi, M.R.; Farshad, M. Control strategies for enhancing frequency stability by DFIGs in a power system with high percentage of wind power penetration. Appl. Sci. 2017, 7, 1140. [Google Scholar] [CrossRef] [Green Version]
- Delille, G.; Francois, B.; Malarange, G. Dynamic frequency control support by energy storage to reduce the impact of wind and solar generation on isolated power system’s inertia. IEEE Trans. Sustain. Energy 2012, 3, 931–939. [Google Scholar] [CrossRef]
- Tamimi, B.; Cañizares, C.; Bhattacharya, K. System stability impact of large-scale and distributed solar photovoltaic generation: The case of Ontario, Canada. IEEE Trans. Sustain. Energy 2013, 4, 680–688. [Google Scholar] [CrossRef]
- Wang, Y.; Silva, V.; Lopez-Botet-Zulueta, M. Impact of high penetration of variable renewable generation on frequency dynamics in the continental Europe interconnected system. IET Renew. Power Gener. 2016, 10, 10–16. [Google Scholar] [CrossRef]
- Edrah, M.; Lo, K.L.; Anaya-Lara, O. Impacts of high penetration of DFIG wind turbines on rotor angle stability of power systems. IEEE Trans. Sustain. Energy 2015, 6, 759–766. [Google Scholar] [CrossRef] [Green Version]
- Gevorgian, V.; Zhang, Y.; Ela, E. Investigating the impacts of wind generation participation in interconnection frequency response. IEEE Trans. Sustain. Energy 2014, 6, 1004–1012. [Google Scholar] [CrossRef]
- Korai, A.; Erlich, I. Frequency dependent voltage control by DER units to improve power system frequency stability. In Proceedings of the 2015 IEEE Eindhoven PowerTech, Eindhoven, The Netherlands, 29 June–2 July 2015; pp. 1–6. [Google Scholar]
- Silva-Saravia, H.D.; Pulgar, H.A.; Tolbert, L.M.; Schoenwald, D.A.; Ju, W. Enabling Utility-Scale Solar PV Plants for Electromechanical Oscillation Damping. IEEE Trans. Sustain. Energy 2020, 12, 138–147. [Google Scholar] [CrossRef]
- Jamsheed, F.; Iqbal, S.J. An Adaptive Neural Network-Based Controller to Stabilize Power Oscillations in Wind-integrated Power Systems. IFAC-PapersOnLine 2022, 55, 740–745. [Google Scholar] [CrossRef]
- Zenelis, I.; Wang, X. A model-free sparse wide-area damping controller for inter-area oscillations. Int. J. Electr. Power Energy Syst. 2022, 136, 107609. [Google Scholar] [CrossRef]
- Alsakati, A.A.; Vaithilingam, C.A.; Naidu, K.; Rajendran, G.; Alnasseir, J.; Jagadeeshwaran, A. Particle Swarm Optimization for Tuning Power System Stabilizer towards Transient Stability Improvement in Power System Network. In Proceedings of the 2021 IEEE International Conference on Artificial Intelligence in Engineering and Technology (IICAIET), Kota Kinabalu, Malaysia, 13–15 September 2021; pp. 1–6. [Google Scholar]
- Eladany, M.M.; Eldesouky, A.A.; Sallam, A.A. Power system transient stability: An algorithm for assessment and enhancement based on catastrophe theory and FACTS devices. IEEE Access 2018, 6, 26424–26437. [Google Scholar] [CrossRef]
- Penchalaiah, G.; Ramya, R. Investigation on Power System Stability Improvement Using Facts Controllers. In Proceedings of International Conference on Power Electronics and Renewable Energy Systems; Springer: Singapore, 2022; pp. 499–506. [Google Scholar]
- Naeem, A.; Atif, A. Transient Stability of Power System by Static VAR Compensator (SVC) and Power System Stabilizers (PSS) using MATLAB/Simulink. SSRG Int. J. Electr. Electron. Eng. (SSRG-IJEEE) 2018, 5, 16–20. [Google Scholar]
- He, P.; Fang, Q.; Jin, H.; Ji, Y.; Gong, Z.; Dong, J. Coordinated design of PSS and STATCOM-POD based on the GA-PSO algorithm to improve the stability of wind-PV-thermal-bundled power system. Int. J. Electr. Power Energy Syst. 2022, 141, 108208. [Google Scholar] [CrossRef]
- Suul, J.A.; D’Arco, S.; Guidi, G. Virtual synchronous machine-based control of a single-phase bi-directional battery charger for providing vehicle-to-grid services. IEEE Trans. Ind. Appl. 2016, 52, 3234–3244. [Google Scholar] [CrossRef]
- Mo, O.; D’Arco, S.; Suul, J.A. Evaluation of virtual synchronous machines with dynamic or quasi-stationary machine models. IEEE Trans. Ind. Electron. 2017, 64, 5952–5962. [Google Scholar] [CrossRef] [Green Version]
- Hou, X.; Sun, Y.; Zhang, X.; Lu, J.; Wang, P.; Guerrero, J.M. Improvement of frequency regulation in VSG-based AC microgrid via adaptive virtual inertia. IEEE Trans. Power Electron. 2020, 35, 1589–1602. [Google Scholar] [CrossRef]
- Remon, D.; Cantarellas, A.M.; Mauricio, J.M.; Rodriguez, P. Power system stability analysis under increasing penetration of photovoltaic power plants with synchronous power controllers. IET Renew. Power Gener. 2017, 11, 733–741. [Google Scholar] [CrossRef] [Green Version]
- Remon, D.; Cañizares, C.A.; Rodriguez, P. Impact of 100-MW-scale PV plants with synchronous power controllers on power system stability in northern Chile. IET Gener. Transm. Dis. 2017, 11, 2958–2964. [Google Scholar] [CrossRef] [Green Version]
- Markovic, U.; Chu, Z.; Aristidou, P.; Hug, G. LQR-based adaptive virtual synchronous machine for power systems with high inverter penetration. IEEE Trans. Sustain. Energy 2018, 10, 1501–1512. [Google Scholar] [CrossRef]
- Markovic, U.; Stanojev, O.; Aristidou, P.; Vrettos, E.; Callaway, D.; Hug, G. Understanding small-signal stability of low-inertia systems. IEEE Trans. Power Syst. 2021, 36, 3997–4017. [Google Scholar] [CrossRef]
- Milano, F.; Manjavacas, Á.O. Converter-Interfaced Energy Storage Systems: Context, Modelling and Dynamic Analysis; Cambridge University Press: Cambridge, UK, 2019. [Google Scholar]
- Gil-González, W.; Montoya, O.D.; Garces, A. Direct power control of electrical energy storage systems: A passivity-based PI approach. Electr. Power Syst. Res. 2019, 175, 105885. [Google Scholar] [CrossRef]
- Machowski, J.; Lubosny, Z.; Bialek, J.W.; Bumby, J.R. Power System Dynamics: Stability and Control, 3rd ed.; John Wily & Sons: Hoboken, NJ, USA, 2020. [Google Scholar]
- Ortega, A.; Milano, F. Generalized model of VSC-based energy storage systems for transient stability analysis. IEEE Trans. Power Syst. 2015, 31, 3369–3380. [Google Scholar] [CrossRef] [Green Version]
- Bhatt, G.; Affljulla, S. Analysis of large scale PV penetration impact on IEEE 39-Bus power system. In Proceedings of the 2017 IEEE 58th International Scientific Conference on Power and Electrical Engineering of Riga Technical University (RTUCON), Riga, Latvia, 12–13 October 2017; pp. 1–6. [Google Scholar]
- Montoya, O.D. Passivity-Based Analysis and Control of AC Microgrids: Integration, Operation and Control of Energy Storage Systems. Ph.D. Thesis, Universidad Tecnológica de Pereira, Pereira, Colombia, 2019. [Google Scholar]
- Serra, F.M.; De Angelo, C.H. IDA-PBC controller design for grid connected Front End Converters under non-ideal grid conditions. Electr. Power Syst. Res. 2017, 142, 12–19. [Google Scholar] [CrossRef]
- Gupta, Y.; Chatterjee, K.; Doolla, S. Controller design, analysis and testing of a three-phase VSI using IDA–PBC approach. IET Power Electron. 2020, 13, 346–355. [Google Scholar] [CrossRef]
- Ortega, R.; van der Schaft, A.; Maschke, B.; Escobar, G. Interconnection and damping assignment passivity-based control of port-controlled Hamiltonian systems. Automatica 2002, 38, 585–596. [Google Scholar] [CrossRef] [Green Version]
- Gil-González, W.; Serra, F.M.; Montoya, O.D.; Ramírez, C.A.; Orozco-Henao, C. Direct Power Compensation in AC Distribution Networks with SCES Systems via PI-PBC Approach. Symmetry 2020, 12, 666. [Google Scholar] [CrossRef] [Green Version]
- Cisneros, R.; Pirro, M.; Bergna, G.; Ortega, R.; Ippoliti, G.; Molinas, M. Global tracking passivity-based PI control of bilinear systems: Application to the interleaved boost and modular multilevel converters. Control Eng. Pract. 2015, 43, 109–119. [Google Scholar] [CrossRef]
- Perko, L. Differential Equations and Dynamical Systems; Springer Science & Business Media: Berlin/Heidelberg, Germany, 2013; Volume 7. [Google Scholar]
- Gil-González, W. Passivity–Based Control and Stability Analysis for Hydro–Solar Power Systems. Ph.D. Thesis, Universidad Tecnológica de Pereira, Pereira, Colombia, 2019. [Google Scholar]


| Description | Parameter | Value | Description | Parameter | Value |
|---|---|---|---|---|---|
| PV system | IDA-PBC | ||||
| Nominal power | 0.5 | Damping gain | 0.8 | ||
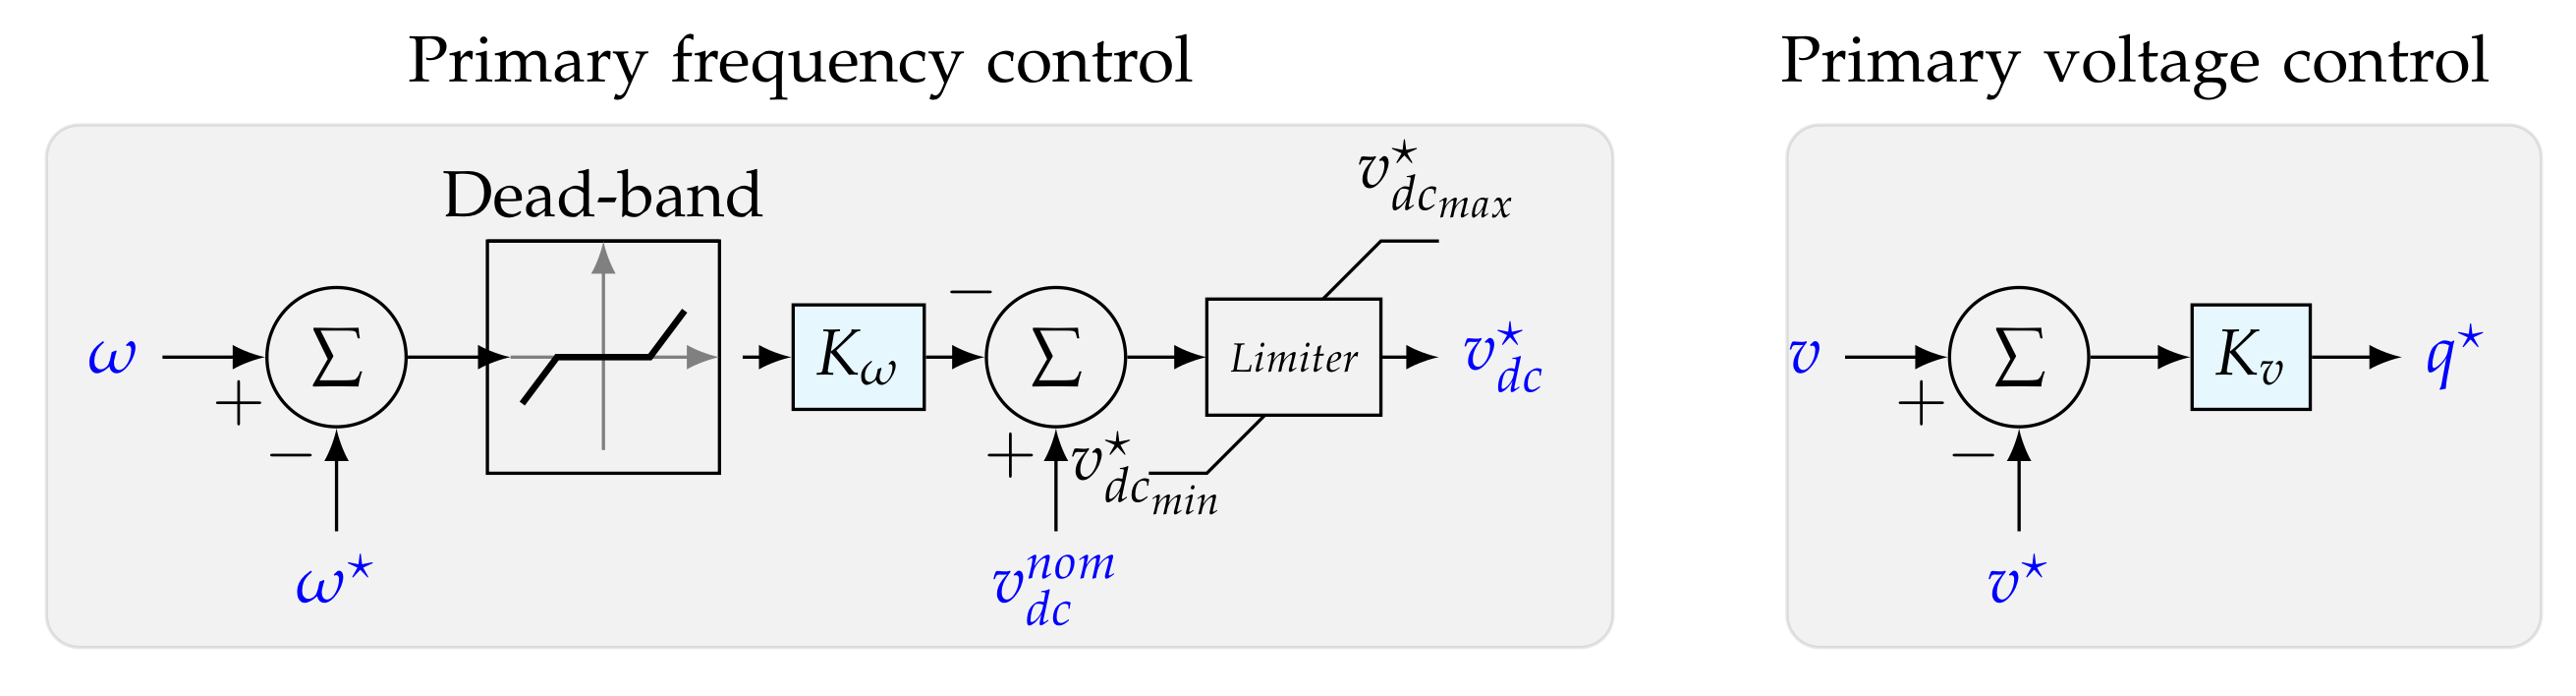
| Primary frequency control | 30 | Damping gain | 0.8 | ||
| Primary voltage control | 2 | Damping gain | 0.5 | ||
| VSC | Outer Control | ||||
| DC-link capacitance | C | 0.1 | Proportional gain | 2 | |
| Transformer inductance | L | 0.15 | Integral gain | 0.5 | |
| Transformer resistance | 0.015 | ||||
| Maximum DC-link voltage | 1.2 | Inner control | |||
| Minimum DC-link voltage | 0.8 | Proportional gain | 25 | ||
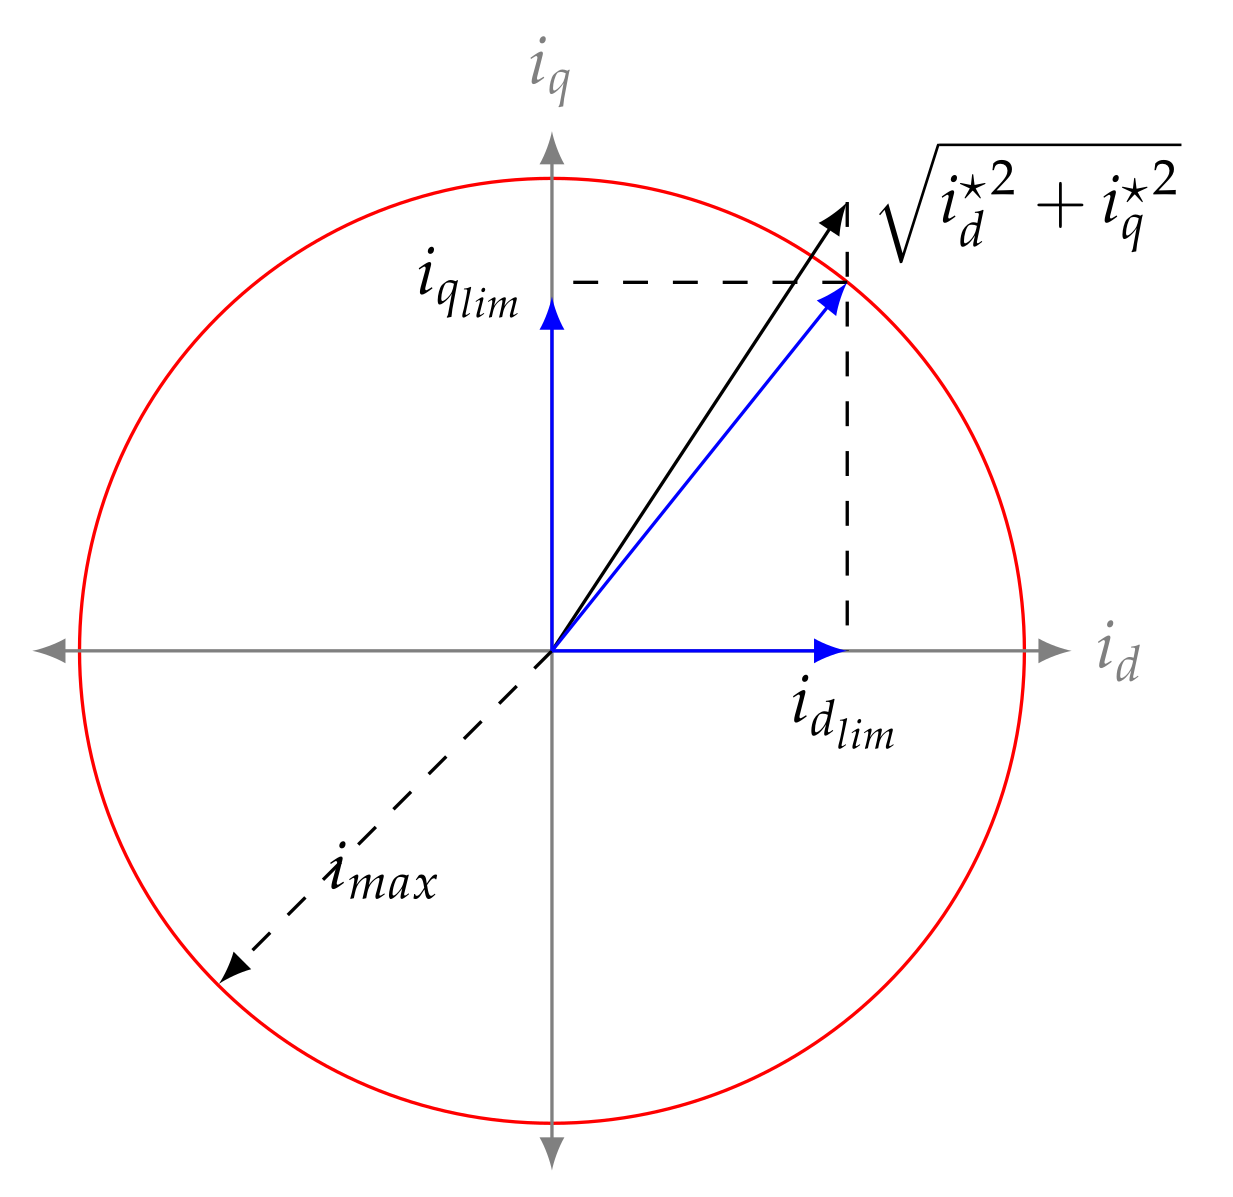
| Current limits | 1.1 | Integral gain | 1.5 | ||
| Generator | ||||||||
|---|---|---|---|---|---|---|---|---|
| G1 | G2 | G3 | G4 | |||||
| P | V | P | V | P | V | P | V | |
| Scenario 1 | 3.42 | 1.00 | 4.00 | 1.01 | 2.70 | 1.01 | 3.30 | 1.01 |
| Scenario 2 | 2.53 | 1.00 | 3.27 | 1.01 | 1.97 | 1.01 | 2.57 | 1.01 |
| Scenario 3 | 1.82 | 1.00 | 2.55 | 1.01 | 1.25 | 1.01 | 1.85 | 1.01 |
| Scenario 4 | 0.7 | 1.00 | 0.8 | 1.01 | 0.8 | 1.01 | 0.65 | 1.01 |
| First Case | Second Case | Third Case | Fourth Case | ||||||
|---|---|---|---|---|---|---|---|---|---|
| Scenario 1 | PI | 46.31 | 61.92 | 8.89 | 27.61 | 1.65 | 17.26 | 4.17 | 4.76 |
| PBC | 42.68 | 56.04 | 7.09 | 15.55 | 0.92 | 14.63 | 3.36 | 4.36 | |
| Scenario 2 | PI | 27.31 | 36.27 | 6.72 | 19.21 | 0.75 | 11.01 | 3.65 | 4.53 |
| PBC | 24.86 | 35.98 | 4.55 | 14.29 | 0.58 | 10.64 | 2.86 | 4.27 | |
| Scenario 3 | PI | 20.62 | 32.48 | 5.24 | 16.25 | 0.53 | 12.91 | 3.96 | 4.58 |
| PBC | 12.01 | 31.59 | 3.78 | 15.89 | 0.42 | 10.06 | 1.92 | 3.68 | |
| Scenario 4 | PI | 8.97 | 15.05 | 5.39 | 23.33 | 0.78 | 9.69 | 3.26 | 4.23 |
| PBC | 2.57 | 2.76 | 2.27 | 13.37 | 0.38 | 8.12 | 2.47 | 3.57 | |
Publisher’s Note: MDPI stays neutral with regard to jurisdictional claims in published maps and institutional affiliations. |
© 2022 by the authors. Licensee MDPI, Basel, Switzerland. This article is an open access article distributed under the terms and conditions of the Creative Commons Attribution (CC BY) license (https://creativecommons.org/licenses/by/4.0/).
Share and Cite
Medina-Quesada, Á.; Gil-González, W.; Montoya, O.D.; Molina-Cabrera, A.; Hernández, J.C. Control of Photovoltaic Plants Interconnected via VSC to Improve Power Oscillations in a Power System. Electronics 2022, 11, 1744. https://doi.org/10.3390/electronics11111744
Medina-Quesada Á, Gil-González W, Montoya OD, Molina-Cabrera A, Hernández JC. Control of Photovoltaic Plants Interconnected via VSC to Improve Power Oscillations in a Power System. Electronics. 2022; 11(11):1744. https://doi.org/10.3390/electronics11111744
Chicago/Turabian StyleMedina-Quesada, Ángeles, Walter Gil-González, Oscar Danilo Montoya, Alexander Molina-Cabrera, and Jesus C. Hernández. 2022. "Control of Photovoltaic Plants Interconnected via VSC to Improve Power Oscillations in a Power System" Electronics 11, no. 11: 1744. https://doi.org/10.3390/electronics11111744