
A New Methodological Framework for Project Design to Analyse and Prevent Students from Dropping Out of Higher Education

1
Professional School of Systems and Computer Engineering, National University of Moquegua (UNAM), Moquegua 18000, Peru
2
Valencian Research Institute for Artificial Intelligence (VRAIN), Universitat Politècnica de València (UPV), 46022 Valencia, Spain
*
Author to whom correspondence should be addressed.
Electronics 2022, 11(18), 2902; https://doi.org/10.3390/electronics11182902
Submission received: 27 July 2022
/
Revised: 2 September 2022
/
Accepted: 7 September 2022
/
Published: 13 September 2022
(This article belongs to the Special Issue Practical Usage of Artificial Intelligence within Online Educational Systems)
Abstract
:The problem of university dropout is a recurring issue in universities that affects students, especially in the first year of studies. The situation is aggravated by the COVID-19 pandemic, which has imposed a virtual education, generating a greater amount of data in addition to historical information, and thus, a greater demand for strategies to design projects based on Educational Data Mining (EDM). To deal with this situation, we present a framework for designing EDM projects based on the construction of a problem tree. The result is the proposal of a framework that merges the six phases of the CRISP-DM methodology with the first stage of the Logical Framework Methodology (LFM) to increase university retention. To illustrate this framework, we have considered the design of a project based on data mining to prevent students from dropping out of a Peruvian university.
1. Introduction
In a global context, dropout in university higher education is one of the effects of the pandemic [1,2,3,4,5]. According to reports from the International Institute for Higher Education in Latin America and the Caribbean of the United Nations Educational, Scientific and Cultural Organization (UNESCO IESALC), about 23.4 million students and 1.4 million teachers in Latin America and the Caribbean have been affected by the abrupt temporary closure of higher education institutions, representing 98% of the population of students and teachers in higher education in the region [6]. However, this problem has been studied for many years due to its negative effects on the social, economic, environmental, and scientific development of a country [7,8,9,10,11,12,13]. In a previous publication from UNESCO IESALC [1], the author stated that in the context of the global pandemic, “it is inevitable to note that the most immediate effects and future impacts are negative, sad and painful” [2]. Likewise, to address the effects of the pandemic, UNESCO recommends promoting inclusive, relevant, and quality initiatives to “leave no student behind” [6]. Among other aspects, this implies developing strategies to address pedagogical, economic, and socioemotional needs [6,14]. A university student retention model is an instrument that allows monitoring these factors and developing strategies to counteract desertion.
It is evident that university student dropout is a social problem [9] and not only a technological one, but technological developments can address this problem and other aspects related to higher education [6]. Therefore, it is necessary to merge methodologies that consider the social and technological aspects, which allows proposing a comprehensive solution framed in the factors associated with student dropout and retention, and in the contributions of the Educational Data Mining (EDM) technology.
One of the main methodologies for projects that address social problems is the Logical Framework Approach (LFA) [15,16], widely used in bilateral and multilateral cooperation agencies such as the agencies of the United States, Canada, Japan, Germany, Spain, United Kingdom, Belgium, Norway, Sweden, Denmark, Finland, Switzerland, Italy, France, Greece, Austria, the World Bank, FAO, IDB, and UNDP, among other organizations that require an adequate design of plans and programs [16,17,18]. In Latin America, the Logical Framework Methodology (LFM) is widely applied for planning, monitoring, and evaluating projects and programs [19], and is considered a working guide for implementing the LFA in investment projects [20,21].
A literature review was conducted to support the factors associated with university student dropout and retention, as presented in Section 2. In this section, we also introduce the Logical Framework and CRISP-DM methodologies, which we subsequently combine and adapt to provide our methodology in Section 3. Our study proposes a framework for the design of technological projects in the area of MDE, based on ML techniques, which merges the six phases of the CRISP-DM methodology with the first stage of the MLM. To illustrate the operation of this framework, it was applied to the specific case study of designing projects to prevent students from dropping out of higher education institutions. The contribution addresses this research question precisely: can these two methodologies be merged for a better analysis of the problem of university student desertion and the proposal of adequate solution alternatives aligned to the objective of student retention in the university ecosystem? The advantages of this fusion can be focused on two aspects, the first is to provide the problem tree as a tool to break down the dropout problem and structure it in its causes and effects supported by a comprehensive literature review, which additionally involves the factors associated with university student dropout, considering the levels of big data analysis (descriptive, diagnostic, predictive and prescriptive). The second is to provide a tool as an objective tree for the strategic analysis of student retention, where its means and ends are reflected. This is supported by our literature review which also considers the factors associated with university student retention. The means of intervention are also framed in the levels of big data analysis. In Section 4 we provide a discussion on our results and potential challenges to implementing a project following our methodology. Finally, in Section 5 we conclude the paper.
2. Related Work
The literature review performed for this work notes the use of the Logical Framework Methodology (LFM) for strengthening the management system [22]: analysis of national health programs [22]; information management for public policies [23]; integrated management in the environmental area [21]; competitiveness in the agro-industrial area [24]; evaluation of policies for complex educational systems [25]; the definition of problems and objectives in the field of software engineering; and organizational management [26].
The LFM, also known as Logical Framework (LF), is an objective-based planning tool [17,23] to structure the tasks of a project by aligning inputs, activities and expected results [27]. The Logical Framework Approach (LFA) was created in 1969 by the United States Agency for International Development (USAID), but became more prominent in 1980 with the adjustments made by the German Agency for Technical Cooperation (GTZ), the Inter-American Development Bank (IDB) and the World Bank (WB) [27].
The LFM is structured in two stages and ten steps. The first stage is called Identification of the problem and solution alternatives, where the stakeholder analysis, problem analysis, objective analysis, and strategy analysis comparing different alternatives are carried out. The second is the Logical Framework Matrix (LFM), where an operational plan for implementation is developed [19]. For this study, the first stage of the LFM is considered since it is more systematized and recommended for the project identification process [17], where the problem is better analyzed by breaking it down and determining its causes and effects, giving rise to the tree of objectives for the design of intervention actions. This framework of analysis begins with the understanding of the problem and is what is needed to strengthen the proposed methodology. The second stage of the LFM will not be considered as the steps for the operational plan are better implemented with the phases of the CRISP-DM methodology since it is a technological project. A brief description of each step is given in the following paragraphs:
2.1. Step 1: Stakeholder Analysis
This identifies stakeholders directly or indirectly involved with the project, to know the importance and involvement that the stakeholder has with the project.
2.2. Step 2: Problem Analysis
This seeks to define the central problem to identify the related effects and the causes that originate it. In this step, the problem tree is constructed.
2.3. Step 3: Objectives Analysis
This starts from the negative conditions of the problem tree for the generation of positive conditions that are desirable and feasible, and with which the objective tree is constructed containing the means and ends, aligned, in a positive sense, to the causes and effects of the problem tree.
2.4. Step 4: Analysis of Alternatives
This is the formulation of actions to solve the central problem identified. The actions are based on the fundamental means set out in the tree of objectives, aligned with the indirect causes that affect the central problem set out in the problem tree. The results obtained are recorded in the matrix of solution alternatives.
2.5. Step 5: Analytical Project Structure
An objective tree is prepared according to the alternative evaluated as the most appropriate for the project, presenting the levels of the end, purpose, components, and activities.
2.6. Step 6: Summary of Objectives and Activities
This synthesizes the project activities in the logical framework matrix, converting inputs into outputs and outcomes. The objectives with their respective activities are written and evaluated.
2.7. Step 7: Indicators
This is the implementation of what is referenced in the objectives column of the LFM and the description of the project goals aligned to each objective level. The LFM recommends defining the minimum number of indicators to measure the expected results.
2.8. Step 8: Means of Verification
This defines the methods and sources of data collection to evaluate and monitor the indicators and targets of the objectives included in the LFM.
2.9. Step 9: Assumptions or Hypotheses
The last column in the LFM contains the assumptions or hypotheses for each level of the stated objectives. The assumptions are important because they affect the success or failure of the project intervention.
2.10. Step 10: Intermediate Evaluation
This is not part of the LFM but it uses the matrix to monitor the mid-term evaluation during the project implementation stage. The purpose of this evaluation is to identify gaps in some areas of the project to establish corrective measures.
At the end of the ten steps, the LFM provides the stakeholder analysis, the problem analysis, the objective analysis, the strategy analysis, and the logical framework matrix [19].
However, some studies show difficulties in the process of evaluation of the LFM [25]. For the present analysis, the first stage of the LFM is considered, which is very necessary for the problem identification process and the proposal of technological solution alternatives in educational organizations [17,18,25].
A technological solution in this area can have several approaches [28], but considering the large volume of data handled by computer systems in universities and the advancement of machine learning techniques, our approach would be framed in educational data science (EDS) [29,30,31,32], specifically in EDM, a discipline widely used in the analysis of education and student learning [31,33,34,35,36,37,38,39,40,41].
One of the most employed strategies in EDM is Machine Learning (ML) [32,37,42] and its main objectives in this domain focus on prediction and recommendation. A technology project under this approach provides a powerful tool for education administrators to make the best decisions for student retention based on data [29,30,40,43,44]. One of the most widely used management methodologies for these projects is the CRIPS-DM methodology, a tool that covers all the stages for the implementation of a technology project using Data Mining (DM) [43,44,45,46,47,48], focusing its analysis on the technological part.
CRISP-DM (Cross Industry Standard Process for Data Mining) and SEMMA (Sample, Explore, Modify, Model, Assess) are the most prominent methodologies for DM projects. SEMMA focuses on the technical characteristics of the process development [46,49] and CRISP-DM focuses on the business objectives of the project [43,44,45,46,49,50]. Another advantage of CRISP-DM over SEMMA relies on its ability to be integrated with a project management methodology that complements the administrative and technical tasks [46], a recommendation that is precisely developed in the present work where CRISP-DM and the LFM will be integrated.
CRISP-DM is a hierarchical process model and presents six phases. The phases of the CRISP-DM methodology are structured in generic tasks, mapped into specific tasks with instances of the process. The way the phases and tasks interact is iterative. The description of each phase is briefly explained in the following paragraphs:
2.11. Phase 1: Understanding the Business
The objectives and requirements of the DM project are stated from the business approach.
2.12. Phase 2: Data Analysis
Analytical work process, the objective is to start the exploration of the data in the database.
2.13. Phase 3: Data Preparation
The data file provided in the previous phase is used and the selection of relevant data, aligned to the identified problem, is carried out, to be used later in phase 4, making use of DM techniques. The objective is to obtain a clean dataset that represents a subset of data extracted from the data file.
2.14. Phase 4: Modeling
For the modeling process, DM techniques are used, with the objective of performing an adequate predictive analysis and choosing the algorithm with the best accuracy for the proposed objective.
2.15. Phase 5: Evaluation of the Data Mining Techniques
In this penultimate phase of the CRISP-DM model, reports and visualizations of the generated models are developed to establish a comparison of the results and perform statistical analysis to determine the best predictive model.
2.16. Phase 6: Exploration or Implementation
Finally, in this phase, the results of the predictive model are analyzed, which is basically the predictive knowledge, which must be transformed into actions aligned to the business process and oriented to the problem objective. Likewise, the results must be disseminated, and the application must be maintained.
At the end of the six phases of the CRISP-DM methodology, a technological project based on DM is obtained, implemented, and supported with an implementation plan, monitoring and maintenance plan, final technical report, and project review report.
As a result of our review process, it became evident that there was a smaller amount of research related to university student retention compared to the number of research studies on student dropout in the university context, a situation already identified by Kerby [47].
Our methodological proposal differs from the LFM since it is adapted for technological projects in the area of EDM, and it differs from the CRISP-DM methodology since it determines the objectives of the DM processes based on an exhaustive analysis of the problem of university student dropout, focused as a social problem or situation poorly addressed, and not as a technological problem.
As a result of our methodology, the problem tree related to university student dropout, the tree of objectives focused on university student retention, and a tree of fundamental means and actions for university student retention framed in the LFM are presented. It is concluded that technology projects must be developed to address social problems or situations that are poorly addressed, and the proposal of a technological solution is based on the analysis of the original causes of desertion, aligned with the means oriented to the objective of university students retention.
3. Proposed Methodology
As mentioned above, it is possible to merge the CRISP-DM methodology with other methodologies for technology project design and management [27]. In this study, the merger with LFM is considered. This fusion poses a new methodological analysis for a technological project that seeks to address a negative situation in society. Considering that the CRISP-DM methodology focuses on the business objectives of the project, it becomes necessary to reinforce its six phases [44,45,46,50] with the first stage of the LFM, with the objective of focusing the problem and deploying actions aligned to the solution alternatives identified for a technological project. In this study, a framework is proposed for the process of identifying the problem of student dropout in a public university and proposing solution alternatives based on Machine Learning techniques. The integrated methodology is referenced in the following steps:
3.1. Step 1: Focus the CRISP-DM Tasks That Will Be Complemented with the First Stage of the LFM
Figure 1 shows that the analysis of stakeholders, analysis of problems, analysis of objectives and analysis of alternatives of the LFM strengthen in a transversal way the six phases of the CRISP-DM methodology, specifically in the generic tasks 1.3, 2.1, 3.1, 4.1, 4.2, 4.3, 4.4, 5.1 and 6.1.
3.2. Step 2: Develop Stakeholder Analysis
Stakeholders directly related to the project and those indirectly involved are identified. Both groups of stakeholders will allow us to better delimit the objectives of the DM (generic task 1.3). For our study, the most representative stakeholders are students, teachers, university authorities and administrators, who will be the beneficiaries of the project. They will also be considered in the implementation plan (generic task 6.1) to focus on the stakeholders to be consulted to evaluate the efficiency of the implemented model.
3.3. Step 3: Develop the Problem Analysis
This step involves four activities where the central problem is identified, the effects it produces, the causes that originate it, and the elaboration of the problem tree.
3.3.1. Activity 3.1: Identification of the Central Problem
For our topic of study, the problem posed is the deficient detection of university student dropout. In the theoretical review it has been evidenced that one of the main problems in the university ecosystem is student dropout [7,51,52,53,54,55,56], and its consequences have negative impacts on the individual, university and society [51,56,57].
3.3.2. Activity 3.2: Identification of the Effects of the Problem
The direct, indirect and final effects should be indicated. For this analysis, the effects were grouped according to the socioeconomic, institutional, academic and individual dimensions affected by university dropout. A literature review was carried out to support the four dimensions and the direct effects, as shown in Table 1. For example, for direct effect 1 (ED 1): Negative effect on the economy of a university dropout student; it presents an indirect effect that derives from the previous effect, so we propose indirect effect A.1 (EI A.1): Negative effect on the social poverty rate. The five direct effects with their respective indirect effects have an impact on the final effect (EF) called: Limited sustainable development of a country in the social, economic, environmental and scientific dimensions, as referred to by some authors [7,8,9,10,11,12,13]. Table 1 presents the effects identified for university student dropout.
3.3.3. Activity 3.3: Identification of the Causes of the Problem
Once the problem and its effects have been identified, the causes of the problem should be analyzed, starting from the premise that the solution should be based on an adequate analysis of the data stored in educational computer systems and taking as a reference the benefits provided by big data and data analytics techniques. It is convenient to group the set of direct and indirect causes according to the descriptive, diagnostic, predictive and prescriptive level of analysis of big data.
For the specific case of the descriptive and diagnostic level, the analysis of direct causes should be considered based on the four factors associated with student dropout: individual, academic, institutional, and socioeconomic, proposed by Castaño [57].
The direct causes are identified with their respective indirect causes that originate them, always considering the bid data analysis level approach. Likewise, for the analysis of the direct causes CD 1 and CD 2, four factors associated with student dropout are focused. The proposal is aligned with Castaño’s theoretical model [71], supported by authors of studies conducted from 1970 to 2002, as shown in Figure 2.
A literature review was conducted, from 2014 to 2021, of 17 articles proposing individual, academic, institutional and/or socioeconomic factors associated with college dropout. Many authors address the issue of college dropout as a predictive analysis.
Table 2 shows the studies reviewed to identify the factors associated with student dropout at the university level. For example, for the descriptive analysis, we ask the question, “What happens? The answer poses the direct cause 1 (CD 1): Limited information that determines the baseline of university student dropout; the indirect causes have to do with the factors associated with the problem posed, for which four are presented: indirect cause 1.1 (IC 1.1): Limited description of individual factors; indirect cause 1.2 (IC 1.2): Limited description of academic factors; indirect cause 1.3 (IC 1.3): Limited description of institutional factors; and indirect cause 1.4 (IC 1.4): Limited description of socioeconomic factors. Therefore, the set of direct and indirect causes affect the problem of deficient detection of university student desertion. Table 3 presents the causes of the problem of dropout, referencing the authors that support the levels of data analysis of big data and data analytics proposed for this study.
3.3.4. Activity 3.4: Elaboration of the Problem Tree
Based on Section 3.3.1, Section 3.3.2 and Section 3.3.3, the problem tree is elaborated. In Figure 3, the central problem of the project is established, fully identified as the deficient detection of university student dropout. In the upper part of the problem tree, the direct effects, indirect effects and the final effect of the project are defined. In the lower part, the direct and indirect causes that originate the central problem are identified. The problem tree is very useful for the design of the objectives tree that will be developed in step 4.
3.4. Step 4: Develop the Objective Análisis
This involves four activities to identify the central objective, the ends it produces, the means necessary to achieve the objective, and the elaboration of the objective tree.
3.4.1. Activity 4.1: Identification of the Central Objective
The definition of the central objective is derived from the central problem. The objective must be limited to the scope of the identified problem, and under this restriction, the central objective is defined as university student retention, one of the main concerns of university institutions [43,47,58,59,90,91].
3.4.2. Activity 4.2: Identification of the Central Objective’s Goals
The next step is to define the direct and indirect goals sought by the proposed objective, which together have an impact on the ultimate goal. In order to do so, it is necessary to consider the direct and indirect effects, the final effect, consigned in the problem tree aligned to a positive scenario that would originate once the central objective is achieved. For this study, the objective is defined as university student retention. Additionally, it should be kept in mind that the direct objectives should be focused on the socioeconomic, institutional, academic, and individual dimensions, as referred to in the problem tree. A bibliographic review was carried out in order to accredit the dimensions and direct goals associated with student retention; the results are shown in Table 4.
Likewise, the indirect effects of the problem tree must be considered for the indirect objectives, always focusing the objectives on a positive or favorable situation that is to be achieved. Finally, all the direct and indirect goals lead to the ultimate goal sought by the stated objective. For example, for direct end 1 (FD 1): Increase in the economic expectation of students who pass a university retention program, there is only one indirect end and it is aligned with indirect effect 1.1 (EI 1.1) of the problem tree, so indirect end A.1 (FI A.1) is proposed: Positive effect on the social poverty rate. In the same way, the approach for direct objectives 2, 3, 4 and 5 with their respective indirect objectives continues to be solved. The objectives as a whole lead to the ultimate goal (FU): Consolidate the sustainable development of a country in the social, economic, environmental and scientific dimensions [7,8,9,10,11,12,13]. Table 4 shows the goals proposed for the study.

Table 4.
Approach to direct and indirect purposes and ultimate purpose.
| Dimension | Authors | Direct End | Authors | Indirect End (First Level) | Authors | Indirect End (Second Level) | Indirect End (Third Level) | Last End |
|---|---|---|---|---|---|---|---|---|
| Socio- economic | [13,49,64,68,72,92,93] | Increase in the economic expectation of a student who passes a university retention program. (DE 1) | [64,65] | Not defined. | Not defined. | Positive effect on the social poverty rate. (IE A.1) | Strengthening the development of the educational service in a country. (IE B.1) | To consolidate the sustainable development of a country in the social, economic, environmental and scientific dimensions. (LE) |
| Efficient economic investment in universities. (DE 2) | [62,94] | Not defined. | Not defined. | Increase in the number of professionals graduating from a university. (IE A.2) | ||||
| Institutional | [13,49,72,93] | Decrease in the university student dropout rate. (DE 3) | [7,49,72,74,94,95,96] | Increase in the rate of graduates (bachelors and graduates) from a university. (IE 3.1) | [74,92] | |||
| Academic | [13,49,62,93] | High level of student satisfaction with the teaching process. (DE 4) | [62] | High level of quality perceived by the university student. (IE 4.1) | [96] | |||
| Individual | [13,62,93] | Increased level of self-esteem in students who pass a university retention program. (DE 5) | [62,72,97,98] | Decrease in the level of personal failure in the student who passes a university retention program. (IE 5.1) | [62,97,98] |
3.4.3. Activity 4.3: Identification of the Means of the Central Objective
In this activity, the means required to achieve the objective should be analyzed. The means may be first-order or fundamental, which together seek to achieve the central objective. The means should be stated by maintaining the big data approach, grouping them based on descriptive, diagnostic, predictive, and prescriptive analysis [60], similar to the procedure performed to determine the direct and indirect causes in the problem tree. First-order means, and their respective fundamental means are identified, and grouped according to the type of big data analysis. Also, for the first-order means MPO 1 and MPO 2, the analysis focuses on four factors associated with student retention.
A literature review was also conducted for the case of student retention. From 2013 to 2020, in four papers the authors propose individual, academic, institutional and/or socioeconomic factors associated with university retention. Table 5 shows a compilation of studies conducted to identify the factors involved in student retention. Certainly, little literature has been found to support the analysis of student retention in universities. For example, for the descriptive analysis, we ask ourselves the question What should happen? The answer poses the first order means (MPO 1): Sufficient information to determine the baseline of university student dropout: the fundamental means are aligned to the indirect causes defined in the problem tree and must be expressed in a positive sense that contributes to the achievement of the central objective, therefore four are presented: fundamental means 1. 1 (FM 1.1): Sufficient description of the individual factors; fundamental means 1.2 (FM 1.2): Sufficient description of the academic factors; fundamental means 1.3 (FM 1.3): Sufficient description of the institutional factors; fundamental means 1.4 (FM 1.4): Sufficient description of the socioeconomic factors. Table 6 details the first-order and fundamental means proposed for this study; in addition, authors who support the first-order means are referenced.
3.4.4. Activity 4.4: Elaboration of the Objectives Tree
At the end of step 4, and considering Section 3.4.1, Section 3.4.2 and Section 3.4.3, the objectives tree, also known as the means-ends tree, is elaborated. Figure 4 shows the central objective, which in our case is defined as university student retention. In the upper part, the direct and indirect goals and the ultimate goal are defined. The lower part identifies the first-order means and the fundamental means required for the fulfillment of the stated objective. The objective tree is elementary for creating the tree of primary means and actions from which the activities to be carried out to achieve the stated objective are outlined.
3.5. Step 5: Develop the Analysis of Alternatives
In this step, the actions to build the possible solution alternatives for the technological project are proposed.
3.5.1. Activity 5.1: Actions
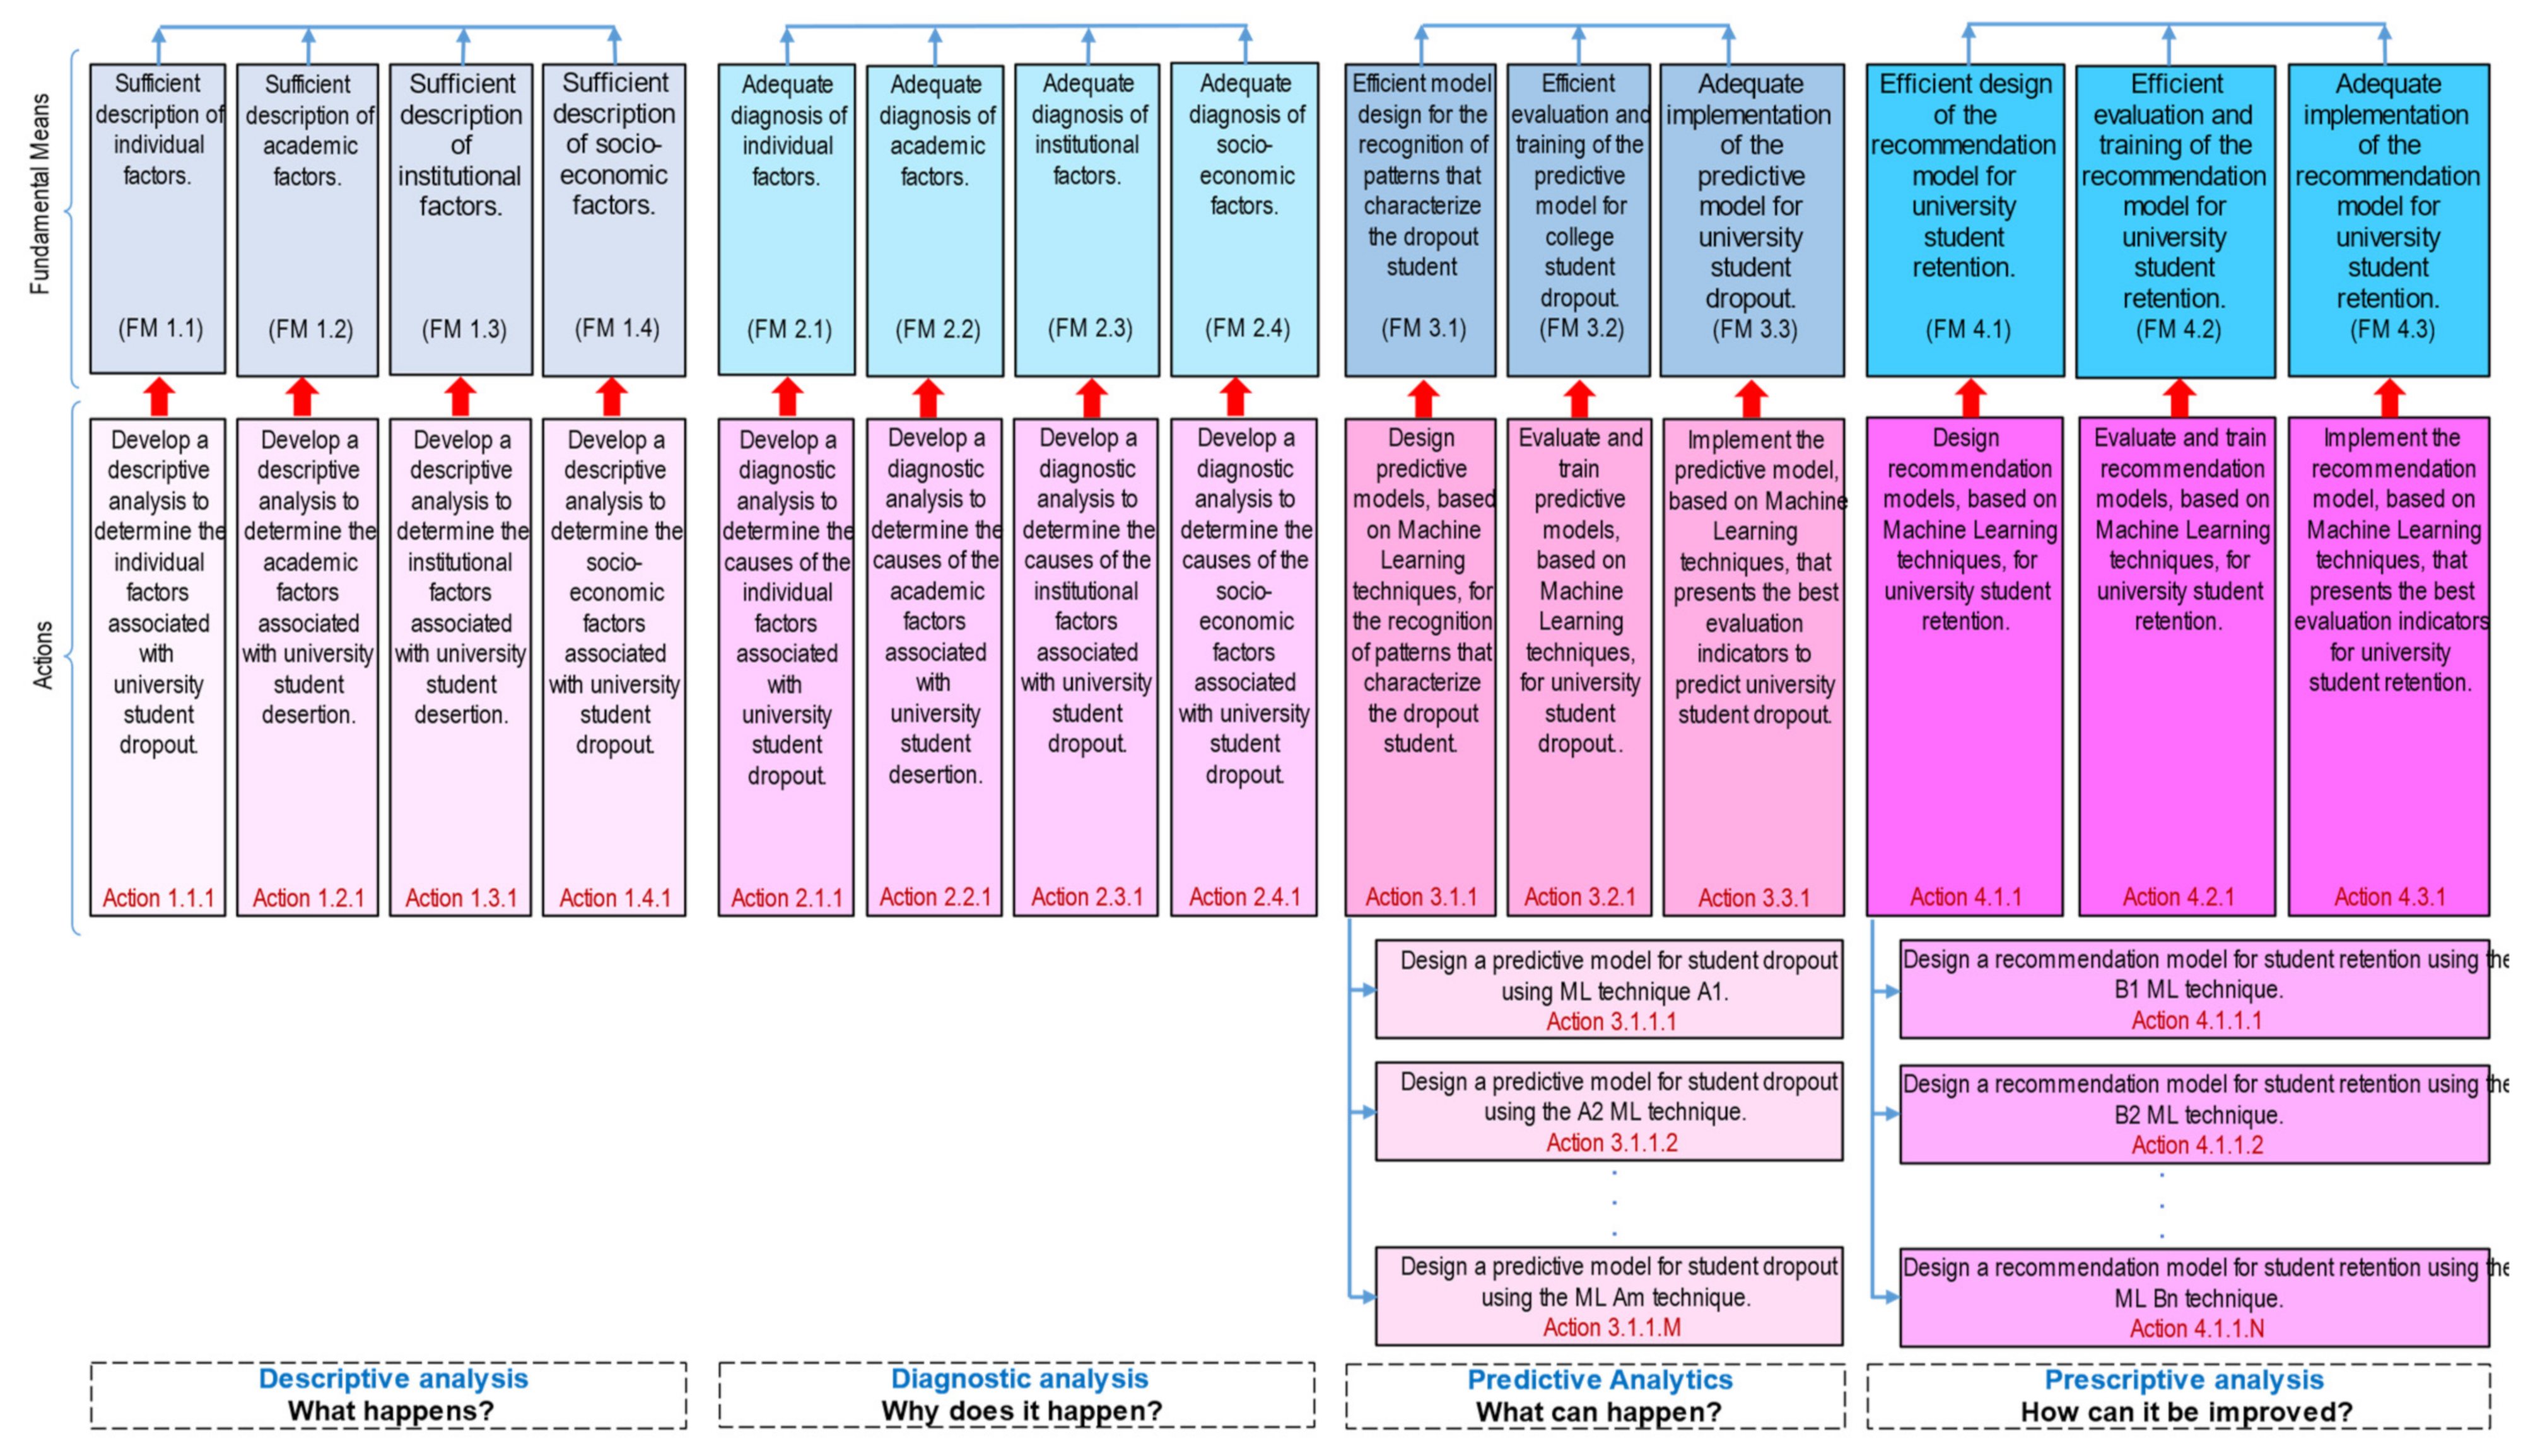
The actions for the technology project are aligned to the fundamental means. Figure 5 shows the tree of fundamental means and actions for university student retention. It can be seen that for each fundamental means, at least one action must be constructed, and an action may or may not contain further actions to solve or execute the means required to achieve the central objective. Technically feasible actions should be sought, taking into account the interests of the project beneficiaries. It is noted that for actions 3.1.1 and 4.1.1, other actions oriented to using techniques for the predictive model and recommendation model, respectively, were proposed.
3.5.2. Activity 5.2: Analysis of the Interrelationship between Actions
Based on the actions selected in activity 5.1, one or more solution alternatives are projected, aligned with the fundamental means that affect the first order means, which as a whole are oriented to the fulfillment of the central objective of the technological project. Previously, the analysis of the interrelation between the actions for each alternative is carried out, considering the following classification:
- –
- Mutually exclusive: actions that cannot be developed at the same time.
- –
- Complementary: actions that need to be developed jointly.
- –
- Independent: actions that can be performed independently in relation to other actions.
3.5.3. Activity 5.3: Proposal of Solution Alternatives
Based on activity 5.2, the solution alternatives for the technological project that seeks to retain university students are proposed, which will later go through an evaluation process to determine the best alternative to be implemented in the project.
4. Discussion
The academic community in universities is aware that the management of academic data, agglomerated in their digital repositories, must be treated to report substantial information that allows the design of appropriate strategies for problem-solving, where one of the most problematic points is student dropout. However, for the exploratory analysis of data and the construction of predictive models based on educational data mining, a framework is previously required. Thus, there are challenges that higher education institutions must assume to have a solid data set that allows them to generate consistent predictive models, for example, the fact of having many empty cells or not considering important variables in the design of its institutional database, which will reduce the possibility of obtaining a greater knowledge of the management of all its processes and, therefore, the approach of appropriate solutions. We will mention some of the challenges identified, which could pave limitations on the effectiveness of a project designed by using our proposed methodology:
- Data protection policy: the universities must safeguard the student’s personal data, being advisable that at the moment of extracting the dataframe from some institutional repository a codename can be assigned to each record and thus annul the exposure of its identification code, names and surnames.
- Record filling protocol: institutional computer systems must have not only a user manual but also a data filling protocol, which must be monitored by a monitoring mechanism.Otherwise, records may be filled with inconsistent data.
- Database updating: the information in the database must be updated periodically so that the predictive model has accurate and consistent information aligned to the time factor. Certainly, there will be information such as the student’s age that can be auto-generated with some programmed instruction, but there is information such as the student’s socioeconomic data that can change over time, and if they are not updated, the predictive model would not be able to report real results. It is therefore advisable to have a policy for updating data.
- Capacity to adapt to the change of teaching modality: with the abrupt experience that the pandemic brought us, the universities must have the necessary mechanisms to provide teaching in the non-presential modality, being advisable to implement a policy of hybrid education (face-to-face and remote). This brings us the challenge of having an adequate technological infrastructure (virtual classrooms) and the design of consistent and robust data repositories that store the data generated by the process of teaching (teacher) and learning (student).
- To have a system to follow up on students who drop out: there are universities that have technological infrastructure installed, with powerful and robust database management systems, committed tutors and academics, students sensitized to the issue of university dropouts, and other isolated mechanisms and policies. However, the use of our methodology in such systems would strengthen the early detection of possible dropout cases and, through a recommendation system, the possible actions to be taken to reduce dropout rates.
5. Conclusions
The fusion of the CRISP-DM and the LFM is complementary and strengthens the design of technological projects, specifically applied to address the problem of the deficient detection of university student dropout. The objective of this fusion is to propose the best solution alternatives to achieve student retention. This model will be used in the analysis of dropout in a Latin American university. Likewise, the implementation of the model built under the proposed methodology will allow reducing the university dropout rate thanks to the adequate design of preventive intervention strategies based on data.
In the literature review carried out to support the factors associated with university dropout and retention, it was observed that there is less research related to university student retention, showing that there is more attention to studies related to student dropout in the university context.
The proposal of a technological project based on Machine Learning techniques that seek to address student dropout and retention in the university ecosystem must have a solid synergy between the correct identification of the problem to be addressed and the actions to be taken with the support of technology. It is often difficult to select a methodology that addresses these two aspects because it is an extremely complex and multivariate phenomenon [61]. Therefore, a good alternative is to combine two or more methodologies that address the integrity of the requirements raised, as we have proposed in this paper.
Although in this work our methodology has been illustrated with the specific case study of designing projects to prevent student dropout from universities, it can be adapted and applied to any project in the area of EDM, based on ML techniques.
Author Contributions
Conceptualisation, V.F. and S.H.; methodology, V.F. and S.H.; formal analysis, V.F.; investigation, V.J. and V.F.; resources, V.F. writing—original draft preparation, V.F. and S.H.; writing—review and editing, S.H.; visualisation, V.F.; supervision, V.J.; project administration, V.J. All authors have read and agreed to the published version of the manuscript.
Funding
This work is partially supported by grant PID2021-123673OB-C31 funded by MCIN/AEI/10.13039/501100011033 and by “ERDF A way of making Europe”. The research was developed thanks to the support of the National University of Moquegua, which provided the information for the creation of the dataset.
Conflicts of Interest
The authors declare no conflict of interest. The funders had no role in the design of the study; in the collection, analyses, or interpretation of data; in the writing of the manuscript, or in the decision to publish the results.
References
- International Institute for Higher Education in Latin America and the Caribbean-UNESCO. The Role of Universities in Post-Pandemic Economic Recovery. 31 July 2020. Available online: https://www.iesalc.unesco.org/2020/07/31/el-rol-de-las-universidades-en-la-recuperacion-economica-post-pandemia/ (accessed on 30 June 2022).
- Leguizamon, J.F. Public university education in Colombia in the face of COVID-19. Ways Educ. Dialogues Cult. Divers. 2020, 2, 85–102. [Google Scholar]
- Figallo, F.; González, M.T.; Diestra, V. Peru: Higher education in the context of the COVID-19 pandemic. J. High. Educ. Lat. Am. 2020, 8, 20–28. [Google Scholar]
- Rivera, J.J. The Effect of COVID-19 on Economics and Education: Strategies for Colombia’s Virtual Education. Sci. J. 2020, 5, 280–291. [Google Scholar]
- Ordorika, I. Pandemic and Higher Education. J. High. Educ. 2020, 49, 1–8. [Google Scholar]
- Pedró, F. COVID-19 and higher education in Latin America and the Caribbean: Effects, impacts and policy recommendations. Carol. Anal. 2020, 36, 1–15. [Google Scholar]
- Tenpipat, W.; Akkarajitsakul, K. Student Dropout Prediction: A KMUTT Case Study. In Proceedings of the 2020 1st International Conference on Big Data Analytics and Practices (IBDAP), Bangkok, Thailand, 25–26 September 2020. [Google Scholar]
- Tinto, V. Dropout from Higher Education: A Theoretical Synthesis of Recent. Rev. Educ. Res. 1975, 45, 89–125. [Google Scholar] [CrossRef]
- Zárate, R.; Mantilla, E. UIS student desertion, a view from the university social responsibility. J. Inst. Stud. Educ. North. Univ. 2014, 21, 120–133. [Google Scholar]
- Barrero, F. Research on university student dropout: Education, culture and meanings. Educ. Soc. Dev. Mag. 2015, 9, 86–101. [Google Scholar]
- Albarrán Peña, J.M. Student desertion at the University of Los Andes (Venezuela). Educ. Humanism 2019, 21, 60–92. [Google Scholar] [CrossRef]
- Smulders Chaparro, M.E. Factors that influence the desertion of University Students. J. Res. Soc. Sci. Humanit. 2018, 5, 127–132. [Google Scholar]
- Narváez, Y.V.; Medina, M.A.G. Factors associated with the permanence of university students: Uamm-uat case. High Sch. Mag. 2017, 46, 117–138. [Google Scholar]
- Jiménez, Y.; Ruiz, M.A. Reflections on the Challenges Higher Education Faces in Times of COVID-19. Econ. Dev. 2021, 165, 1–16. Available online: http://scielo.sld.cu/scielo.php?script=sci_arttext&pid=S0252-85842021000200003 (accessed on 27 June 2022).
- Arenas, M. The marcological as an answer to three problems. Fides Ratio-J. Cult. Sci. Diffus. Salle Univ. Boliv. 2013, 6, 51–66. [Google Scholar]
- Gasper, D. Evaluating the ‘logical framework approach’towards learning-oriented development evaluation. Public Adm. Dev. 2000, 20, 17–28. [Google Scholar] [CrossRef]
- Camacho, H.; Cámara, L.; Cascante, R.; Sainz, H. The Logical Framework Approach: 10 Case Studies. Notebook for the Identification and Design of Development Projects; CIDEAL Foundation: Madrid, Spain, 2001; ISBN 84-87082-17/3. Available online: https://www.olacefs.com/wp-content/uploads/2014/07/DOC_27_8_2013_Enfoque_Marco_Logico_EML_10_casos.pdf (accessed on 27 June 2022).
- Pérez, M.M.; Maldonado, I.P.; Uzcátegui, S.B. The logical framework and educational organizations. Methodological contribution for the improvement of the school. Sapiens. Univ. Res. J. 2007, 8, 147–167. [Google Scholar]
- Ortegón, E.; Pacheco, J.F.; Prieto, A. Methodology of the Logical Framework for Planning, Monitoring and Evaluation of Projects and Programs; CEPAL: Santiago, Chile, 2005; p. 124. [Google Scholar]
- Vidal, R.A.; Palacios, F.S. The Evaluation of Investment Projects for Decision Making. Econ. Adm. 2005, 42, 91–100. Available online: https://www2.udec.cl/~rea/REVISTA%20PDF/Rev64/art5rea64.pdf (accessed on 27 June 2022).
- Carvajal, J.S.; Carmona, C.E. Integrated management of construction and demolition waste in Colombia: An approach based on the logical framework methodology. Prod. Clean. 2016, 11, 117–128. [Google Scholar]
- Lanza, S.; Sepúlveda, C.; Olate, M.; Espejo, C. Application of the logical framework methodology for the analysis of the national cervical cancer screening and control program in Chile. Chil. J. Obstet. Gynecol. 2010, 75, 294–299. [Google Scholar]
- Pereira, E.C.; da Conceição, R.J.; Caballero, B.E. A logical framework methodology and information management: A case study for Tunas-PR. Transformation 2009, 21, 63–75. [Google Scholar]
- Rodríguez, A.I.; del Moral, J.; Cortés, H.V.; Cárdenas, R.A. Methodological proposal to analyze the competitiveness of agroindustrial value networks. Mex. Agribus. Mag. 2013, 32, 231–244. [Google Scholar]
- Bracho González, T. The role of values in the evaluation of policies for complex educational systems. Mex. J. Educ. Res. 2011, 16, 853–883. [Google Scholar]
- Zapata, C.M.; Vargas, F.A. A Literature Review on Problem-Objective Consistency in Software Engineering and Organizational Management. EIA Mag. 2009, 6, 117–129. [Google Scholar]
- Crespo, M.A. Guide for the Design of Community Social Projects under the Logical Framework Approach; Crespo, M.A: Caracas, Venezuela, 2011. [Google Scholar]
- Serna, M.C. E-Learning for University Innovation; Narcea Editions: Madrid, Spain, 2003; 196p, ISBN 842771436x. Available online: https://dialnet.unirioja.es/servlet/libro?codigo=322247 (accessed on 27 June 2022).
- Kiss, B.; Nagy, M.; Molontay, R.; Csabay, B. Predicting Dropout Using High School and First-semester Academic Achievement Measures. In Proceedings of the 2019 17th International Conference on Emerging eLearning Technologies and Applications (ICETA), Starý Smokovec, Slovakia, 21–22 November 2019. [Google Scholar]
- Zaldumbide, J.P.; Párraga, V.C. Systematic Mapping Study of Literature on Educational Data Mining to Determine Factors That Affect School Performance. In Proceedings of the 2018 International Conference on Information Systems and Computer Science (INCISCOS), Quito, Ecuador, 13–15 November 2018. [Google Scholar]
- Asif, R.; Merceron, A.; Ali, S.A.; Haider, N.G. Analyzing undergraduate students’ performance using educational data mining. Comput. Educ. 2017, 113, 177–194. [Google Scholar] [CrossRef]
- Raju, R.; Kalaiselv, N.; Divya, I.; Selvarani, A. Educational Data Mining: A Comprehensive Study. In Proceedings of the 2020 International Conference on System, Computation, Automation and Networking (ICSCAN), Pondicherry, India, 3–4 July 2020. [Google Scholar]
- Mishra, A.; Bansal, R.; Singh, S.N. Educational data mining and learning analysis. In Proceedings of the 2017 7th International Conference on Cloud Computing, Data Science & Engineering-Confluence, Noida, India, 12–13 January 2017. [Google Scholar]
- Kurdi, M.M.; Al-Khafagi, H.; Elzein, I. Mining Educational Data to Analyze Students’ Behavior and Performance. In Proceedings of the 2018 JCCO Joint International Conference on ICT in Education and Training, International Conference on Computing in Arabic, and International Conference on Geocomputing (JCCO: TICET-ICCA-GECO), Tunisia/Hammamet, Tunisia, 9–11 November 2018. [Google Scholar]
- Bharara, S.; Sabitha, S.; Bansal, A. Application of learning analytics using clustering data Mining for Students’ disposition analysis. Educ. Inf. Technol. 2018, 2, 957–984. [Google Scholar] [CrossRef]
- Bogarín, A.; Cerezo, R.; Romero, C. A survey on educational process mining. Wiley Interdiscip. Rev. Data Min. Knowl. Discov. 2018, 8, e1230. [Google Scholar] [CrossRef]
- Abe, K. Data Mining and Machine Learning Applications for Educational Big Data in the University. In Proceedings of the 2019 IEEE Intl Conf on Dependable, Autonomic and Secure Computing, Intl Conf on Pervasive Intelligence and Computing, Intl Conf on Cloud and Big Data Computing, Intl Conf on Cyber Science and Technology Congress (DASC/PiCom/CBDCom/CyberSciTech), Fukuoka, Japan, 5–8 August 2019. [Google Scholar]
- Shrestha, S.; Pokharel, M. Machine Learning algorithm in educational data. In Proceedings of the 2019 Artificial Intelligence for Transforming Business and Society (AITB), Kathmandu, Nepal, 5 November 2019. [Google Scholar]
- Amrieh, E.A.; Hamtini, T.; Aljarah, I. Mining educational data to predict student’s academic performance using ensemble methods. Int. J. Database Theory Appl. 2016, 9, 119–136. [Google Scholar] [CrossRef]
- Da Silva, V.R.L.B.; Silva, F.d.; Burégio, V. Characterizing Educational Data Mining. In Proceedings of the 2019 14th Iberian Conference on Information Systems and Technologies (CISTI), Coimbra, Portugal, 19–22 June 2019. [Google Scholar]
- Hicham, A.; Jeghal, A.; Sabri, A.; Tairi, H. A Survey on Educational Data Mining [2014–2019]. In Proceedings of the 2020 International Conference on Intelligent Systems and Computer Vision (ISCV), Fez, Morocco, 9–11 June 2020. [Google Scholar]
- Al-kmal, M.; Mugahed, H.; Boulila, W.; Al-Sarem, M.; Abuhamdah, A. A Machine-Learning based Approach to Support Academic Decision-Making at Higher Educational Institutions. In Proceedings of the 2020 International Symposium on Net-works, Computers and Communications (ISNCC), Montreal, QC, Canada, 20–22 October 2020. [Google Scholar]
- Da Silva, P.M.; Lima, M.N.; Soares, W.L.; Silva, I.R.; Fagundes, R.A.; de Souza, F.F. Ensemble Regression Models Applied to Dropout in Higher Education. In Proceedings of the 2019 8th Brazilian Conference on Intelligent Systems (BRACIS), Salvador, Brazil, 15–18 October 2019. [Google Scholar]
- Chiheb, F.; Boumahdi, F.; Bouarfa, H.; Doulkifli, B.; Boukraa, D. Predicting Students Performance Using Decision Trees: Case of an Algerian University. In Proceedings of the 2017 International Conference on Mathematics and Information Technology (ICMIT), Adrar, Algeria, 4–5 December 2017. [Google Scholar]
- Cravioto, D.A.; Ramos, R.E.; Galaz, M.A.; Gress, N.H.; Cancino, H.G. Analysing Factors That Influence Alumni Graduate Studies Attainment with Decision Trees. In Proceedings of the 2020 International Conference on Computer Science and Software Engineering (CSASE), Duhok, Iraq, 16–18 April 2020. [Google Scholar]
- Cobos, C.; Zuñiga, J.; Guarin, J.; León, E.; Mendoza, M. CMIN-case tool based on CRISP-DM for the support of data mining projects. Eng. Res. 2010, 30, 45–56. [Google Scholar]
- Kerby, M.B. Toward a new predictive model of student retention in higher education: An application of classical sociological theory. J. Coll. Stud. Retent. Res. Theory Pract. 2015, 17, 138–161. [Google Scholar] [CrossRef]
- Jalota, C.; Agrawal, R. Analysis of Educational Data Mining using Classification. In Proceedings of the 2019 International Conference on Machine Learning, Big Data, Cloud and Parallel Computing (COMITCon), Faridabad, India, 14–16 February 2019. [Google Scholar]
- Azevedo, A.I.; Santos, M.F. KDD, SEMMA and CRISP-DM: A Parallel Overview. In Proceedings of the IADIS European Conference on Data Mining, Amsterdam, The Netherlands, 24–26 July 2008; pp. 182–185. Available online: https://core.ac.uk/download/pdf/47135941.pdf (accessed on 27 June 2022).
- Espinosa-Zúñiga, J.J. Application of CRISP-DM methodology for geographic segmentation of a public database. Eng. Res. Technol. 2020, 21, 1–17. [Google Scholar]
- Constate-Amores, A.; Martínez, E.F.; Navarro, E.; Fernández-Mellizo, M. Factors associated with college dropout. Education XX1 2021, 24, 17–44. [Google Scholar] [CrossRef]
- Esteban, M.; Bernardo, A.; Tuero, E.; Cervero, A.; Casanova, J. Influential variables in academic progress and permanence in college. Eur. J. Educ. Psychol. 2017, 10, 75–81. [Google Scholar] [CrossRef]
- Amaya-Amaya, A.; Huerta-Castro, F.; Flores-Rodríguez, C.O. Big Data, a strategy to prevent dropout in HEIs. Iberoam. J. High. Educ. 2020, 11, 166–178. [Google Scholar]
- Kim, D.; Kim, S. Sustainable Education: Analyzing the Determinants of University Student Dropout by Nonlinear Panel Data Models. Sustainability 2018, 10, 954. [Google Scholar] [CrossRef]
- Hernández-Jiménez, M.T.; Moreira-Mora, T.E.; Solís-Salazar, M.; Fernández-Martín, T. Descriptive study of sociodemographic and motivational variables associated with dropout: The perspective of first-time university students. Educ. Mag. 2020, 44, 210–229. [Google Scholar]
- Shaleena, K.P.; Paul, S. Data mining techniques for predicting student performance. In Proceedings of the 2015 IEEE international conference on engineering and technology (ICETECH), Coimbatore, TN, India, 20 March 2015. [Google Scholar]
- Castaño, E.; Gallón, S.; Gómez, K.; Vásquez, J. Analysis of factors associated with student dropout in Higher Education: A case study. J. Educ. 2008, 345, 255–280. [Google Scholar]
- Choi, Y. Student Employment and Persistence: Evidence of Effect Heterogeneity of Student Employment on College Dropout. Res. High. Educ. 2018, 59, 88–107. [Google Scholar] [CrossRef]
- Jorquera, Ó.; Farías, J.; González, P. What are the factors associated with student dropout from equity programs in Chile? The case of a traditional university. In Proceedings of the CLABES VIII Congress, Panama, Panama, 14–16 November 2018; Available online: https://revistas.utp.ac.pa/index.php/clabes/article/view/1941/2883 (accessed on 27 June 2022).
- Sheng, J.; Amankwah-Amoah, J.; Khan, Z.; Wang, X. COVID-19 Pandemic in the New Era of Big Data Analytics: Methodological Innovations and Future Research Directions. Br. J. Manag. 2020, 32, 1164–1183. [Google Scholar] [CrossRef]
- Fonseca, G.; García, F. Permanence and dropout in university students: An analysis from organizational theory. J. High. Educ. 2016, 45, 25–39. [Google Scholar]
- Rivera, D.A.; Carrillo, S.; Forgiony, J.O.; Bonilla, N.J.; Hernández, Y.; Silva, G.I. Strengthening the Occupational Safety and Health Management System in the Psychosocial Field from the Logical Framework Perspective. Rev. Espac. 2018, 39, 31. [Google Scholar]
- Kostopoulos, G.; Tsiakmaki, M.; Kotsiantis, S.; Ragos, O. Deep Dense Neural Network for Early Prediction of Failure-Prone Students. In Machine Learning Paradigms. Learning and Analytics in Intelligent Systems; Tsihrintzis, G., Jain, L., Eds.; Springer: Cham, Switzerland, 2020; Volume 18, pp. 291–306. [Google Scholar] [CrossRef]
- Chapman, P.; Clinton, J.; Kerber, R.; Khabaza, T.; Reinartz, T.; Shearer, C.; Wirth, R. CRISP-DM 1.0: Step-by-Step Data Mining Guide; SPSS Inc.: Chicago, IL, USA, 2000; pp. 1–78. Available online: https://www.kde.cs.uni-kassel.de/wp-content/uploads/lehre/ws2012-13/kdd/files/CRISPWP-0800.pdf (accessed on 27 June 2022).
- Valía, L.; Rostagno, J.; Moine, J.M.; Bigatti, C.; Riva, F.M.; Amar, E. Data mining applied to education: Model of university dropout at the Universidad Tecnológica Nacional, Facultad Regional Rosario. In Proceedings of the XIX Workshop of Researchers in Computer Science, Buenos Aires, Argentina, 27–28 April 2017; Available online: http://sedici.unlp.edu.ar/handle/10915/61720 (accessed on 27 June 2022).
- Gairín, J.; Triado, X.M.; Feixas, M.; Figuera, P.; Aparicio-Chueca, P.; Torrado, M. Student dropout rates in Catalan universities: Profile and motives for disengagement. Qual. High. Educ. 2014, 20, 165–182. [Google Scholar] [CrossRef]
- Fernández, O.M.; Martínez-Conde, M.; Melipillán, R. Learning strategies and self-esteem. Their relationship with university permanence and desertion. Pedagog. Stud. 2009, 35, 27–45. [Google Scholar]
- González-Castro, Y.; Manzano-Durán, O.; Torres-Zamudio, M. Attrition risks in the virtual universities of Colombia, facing retention strategies. Free. Enterp. 2017, 14, 177–197. [Google Scholar]
- Rodríguez, E. Higher education in Chile and the role of the market: Guilty or innocent? Chil. J. Eng. 2012, 20, 126–135. [Google Scholar]
- Castillo, M.B.; Giraldo, A.M. The challenges of higher education in Colombia: A reflection on the phenomenon of university desertion. Eng. Educ. J. 2010, 5, 85–98. [Google Scholar]
- Olsson, M.; Mozelius, P. On design of online learning environmentsfor programming education. In Academic Conferences and Publishing International ECEL; Academic Conferences and Publishing International Ltd.: Reading, UK, 2016; Available online: https://docplayer.net/54574654-15th-european-conference-on-e-learning-ecel-2016.html (accessed on 27 June 2022).
- Urbina-Nájera, A.B.; Camino-Hampshire, J.C.; Cruz, R. University dropout: Prevention patterns through the application of educational data mining. Electron. J. Educ. Res. Assess. Eval. 2020, 26, 1–19. [Google Scholar]
- Rodriguez, A.B.; Espinoza, J.; Ramirez, L.J.; Gang, A. University Dropout: A New Methodological Analysis. Univ. Educ. 2018, 11, 107–118. [Google Scholar]
- Marôco, J.; Assunção, H.; Harju-Luukkainen, H.; Lin, S.W.; Sit, P.S.; Cheung, K.C.; Maloa, B.; Ilic, I.S.; Smith, T.J.; Campos, J.A. Predictors of academic efficacy and dropout intention in university students: Can engagement suppress burnout? PLoS ONE 2020, 15, e0239816. [Google Scholar] [CrossRef]
- Guerra, L.; Rivero, D.; Díaz, E.; Arciniegas, S. Trends in informative models on college retention-attrition. Iber. J. Inf. Syst. Technol. 2020, 1, 55–68. [Google Scholar]
- Munizaga, F.; Cifuentes, M.B.; Beltrán, A. Student Retention and Dropout in University Higher Education in Latin America and the Caribbean: A Systematic Review. Educ. Policy Anal. Arch. 2018, 26, 1–32. [Google Scholar]
- Garcia, A.M. Academic performance and university dropout models, results and scopes of academic production in Argentina. Argent. J. High. Educ. 2014, 8, 9–38. [Google Scholar]
- Carvajal, P.; Trejos, Á. Review of studies on student desertion in higher education in Latin America under Pierre Bourdieu’s perspective. In Proceedings of the Congress CLABES VI, Quito, Ecuador, 9–11 September 2016. [Google Scholar]
- Casanova-Laudien, M.P.; Díaz-Mujica, A.; Soto-Vásquez, P. Unassumed dropout: A psychosocial phenomenon difficult to investigate. In Proceedings of the Congresses CLABES, Panama, Panama, 14–16 November 2018; Available online: https://revistas.utp.ac.pa/index.php/clabes/article/view/1893 (accessed on 27 June 2022).
- Aranzazu, D.G.; Rojas, M.D. Approximation to female attrition from the administrative engineering program at the Faculty of Mines of the National University of Colombia 2010–2017. In Proceedings of the Congress CLABES VIII, Panama, Panama, 14–16 November 2018; Available online: https://revistas.utp.ac.pa/index.php/clabes/article/view/1926/2869 (accessed on 27 June 2022).
- Idachaba, F.E. Outcome Based Engineering Curriculum Design: A System for Curriculum Streamlining and Graduate Quality Improvement in Engineering. In Proceedings of the INTED2018 Conference, Valencia, Spain, 5–7 March 2018; pp. 5888–5893. Available online: https://core.ac.uk/download/pdf/154230421.pdf (accessed on 27 June 2022).
- Hoyos, J.G.; Aponte-Novoa, F.A. Characterization of the students of a higher education institution through big data. Ing. Y Desarro. 2019, 37, 159–172. [Google Scholar]
- Sivakumar, S.; Venkataraman, S.; Selvaraj, R. Predictive modeling of student dropout indicators in educational data mining using improved decision tree. Indian J. Sci. Technol. 2016, 9, 1–5. [Google Scholar] [CrossRef]
- Rodríguez-Pineda, M.; Zamora-Araya, J.A. Early dropout in university students: A cohort study on its possible causes. Uniciencia 2021, 35, 19–37. [Google Scholar] [CrossRef]
- González-Ramírez, T.; Pedraza-Navarro, I. Sociofamilial variables associated with dropping out of university studies. Educatio Siglo XXI 2017, 35, 365–388. [Google Scholar] [CrossRef]
- Farhan, B.Y. Managerial Decisions to Enhance Student/Customer Retention: The Case of Ontario’s Academic Institutions. Interchange 2019, 50, 155–174. [Google Scholar] [CrossRef]
- Sarra, A.; Fontanella, L.; di Zio, S. Identifying Students at Risk of Academic Failure Within the Educational Data Mining Framework. Soc. Indic. Res. 2019, 146, 41–60. [Google Scholar] [CrossRef]
- Klein, C.; Lester, J.; Rangwala, H.; Johri, A. Technological barriers and incentives to learning analytics adoption in higher education: Insights from users. J. Comput. High. Educ. 2019, 31, 604–625. [Google Scholar] [CrossRef]
- Adekitan, A.I.; Noma-Osaghae, E. Data mining approach to predicting the performance of first year student in a university using the admission requirements. Educ. Inf. Technol. 2019, 24, 1527–1543. [Google Scholar] [CrossRef]
- Beaulac, C.; Rosenthal, J.S. Predicting university students’ academic success and major using random forests. Res. High. Educ. 2019, 60, 1048–1064. [Google Scholar] [CrossRef]
- Platt, A.J.; Fan-Osuala, O.; Herfel, N. Understanding and Predicting Student Retention and Attrition in IT Undergraduates. In Proceedings of the 2019 on Computers and People Research Conference, Nashville, TN, USA, 20–22 June 2019; pp. 135–138. [Google Scholar] [CrossRef]
- Raju, D.; Schumacker, R. Education Using Data Mining Models. J. Coll. Stud. Retent. Res. Theory Pract. 2015, 16, 563–591. [Google Scholar] [CrossRef]
- Navarrete, S.; Candia, R.; Puchi, R. Factors associated with the desertion/retention of Mapuche students at the University of La Frontera and the incidence of academic support programs. Qual. Educ. Version On-Line 2013, 44–80. [Google Scholar]
- Oviedo, A.I.; Jiménez, G.A. Study on Learning Styles through Data Mining as a Support to Academic Management in Educational Institutions. Rev. Ibérica Sist. Tecnol. Inf. 2018, 10, 1–13. Available online: http://www.risti.xyz/issues/risti29.pdf (accessed on 27 June 2022).
- Oviedo, E.A.; Oviedo, A.I.; Vélez, G.L. Iberian Journal of Systems and Data Mining: Contributions and trends in the health service of smart cities. Polytech. Mag. 2015, 11, 111–120. [Google Scholar]
- Sánchez-Mendiola, M.; Moreno-Salinas, J.G.; Bautista-Godínez, T.; Martínez-González, A. The learning analytics in medical education: A turning point? Med. Gaz. Mex. 2019, 155, 90–100. [Google Scholar] [CrossRef]
- Carrillo Zenteno, J.A. Big Data-Learning Analytics and Data Mining Applied in the University. Pro Sci. J. Prod. Sci. Res. 2018, 2, 39–54. [Google Scholar]
- Schab, E.A.; Piccoli, M.F.; Casanova, C.A. Prescriptive Analytics in Systems with Large Event Flows. In Proceedings of the V Conference for the Exchange and Dissemination of Research Results of Engineering Doctoral Students, Córdoba, Argentina, 5 October 2020. [Google Scholar] [CrossRef]
- Saggi, M.K.; Jain, S. A survey towards an integration of big data analytics to big insights for value-creation. Inf. Process. Manag. 2018, 54, 758–790. [Google Scholar] [CrossRef]
- Vergel-Ortega, M.; Martínez-Lozano, J.J.; Ibargüen-Mondragón, E. Estimated survival analysis models for student tenure at Universidad Francisco de Paula Santander. Answers 2016, 21, 24–36. [Google Scholar]
- Burgos, C.; Campanario, M.L.; de la Peña, D.; Lara, J.A.; Lizcano, D.; Martínez, M.A. Data mining for modeling students’ performance: A tutoring action plan to prevent academic dropout. Comput. Electr. Eng. 2018, 66, 541–556. [Google Scholar] [CrossRef]
- Ahmed, A.B.E.D.; Elaraby, I.S. Data mining: A prediction for Student’s performance using classification method. World J. Comput. Appl. Technol. 2014, 2, 43–47. [Google Scholar] [CrossRef]
- Espinosa, C.; Gómez, V.G.; Cañedo, C.M. Access to and Retention in Higher Education of Students with Disabilities in Ecuador. Univ. Form. 2012, 5, 27–38. [Google Scholar] [CrossRef]
- Suhlmann, M.; Sassenberg, K.; Nagengast, B.; Trautwein, U. Belonging Mediates Effects of Student-University Fit on Well-Being, Motivation, and Dropout Intention. Soc. Psychol. 2018, 49, 16–28. [Google Scholar] [CrossRef]
Figure 1.
Merger between CRISP-DM and LFM methodology.

Figure 2.
Determinants of student dropout, by Castaño [57].
Figure 2.
Determinants of student dropout, by Castaño [57].

Figure 3.
Problem tree for university student dropout.

Figure 4.
University student retention objective tree.

Figure 5.
Tree of fundamental means and actions for student retention.

Table 1.
Direct, indirect and final effect approach.
| Dimension | Authors | Direct Effect | Authors | Indirect Effect (First Level) | Indirect Effect (Second Level) | Indirect Effect (Third Level) | Final EFfect |
|---|---|---|---|---|---|---|---|
| Socio- economic | [43,49,58,59] | Negative economic impact of university student dropouts (DE 1) | [7,58,60,61,62,63,64,65] | Not defined. | Negative effect on the social poverty rate. (IE A.1) | Limited development of the education sector in a country. (IE B.1) | Limited sustainable development of a country in the social, economic, environmental and scientific dimensions. (FE) |
| Deficient economic investment in universities. (DE 2) | [12,66] | Not defined. | Decrease in the number of professionals graduating from a university. (IE A.2) | ||||
| Institutional | [43,49,55,59] | Negative effect on the university student dropout rate. (SD 3) | [49,59,60,67,68,69] | Negative effect on the rate of university graduates (bachelors and graduates). (IE 3.1) | |||
| Academic | [43,62] | Low level of student satisfaction due to inadequate teaching process. (DE 4) | [11,43,68] | Low level of quality perceived by the university student. (EI 4.1) | |||
| Individual | [43,49,55,59,62] | Increased level of frustration in the university student dropout. (DE 5) | [11,12,58,59,60,62,70] | Increased level of personal failure in the university student dropout. (EI 5.1) |
Table 2.
Factors associated with student dropout.
| Direct Cause | Factors Associated with Student Dropout Aligned to DC 1 and DC 2. | Proposing Authors |
|---|---|---|
| Limited information to determine the baseline of university student desertion. (DC 1) Deficient diagnosis to determine the causes/characteristics (patrons) that originate university student desertion. (DC 2) | Individual factors. | [45,49,55,60,72,73,74,75,76,77] |
| Academic factors. | [45,49,55,58,73,74,75,78,79,80,81] | |
| Institutional factors. | [49,60,72,73,74,75,76,77,78,79,80] | |
| Socioeconomic factors. | [45,49,55,58,68,72,73,74,75,76,77,79,80,81,82] |
Table 3.
Approach to direct and indirect causes.
| Levels of Data Analysis | Autores | Question | Direct Cause | Indirect Cause |
|---|---|---|---|---|
| Descriptive analysis | [54,83,84,85,86,87,88,89] | What is happening? | Limited information to determine the baseline of university student desertion. (DC 1) | Limited description of the individual factors. (IC 1.1) |
| Limited description of academic factors. (IC 1.2) | ||||
| Limited description of institutional factors. (IC 1.3) | ||||
| Limited description of socioeconomic factors. (IC 1.4) | ||||
| Diagnostic analysis | [85,86,87,88] | Why is it happening? | Deficient diagnosis to determine the causes/characteristics (patrons) that originate university student desertion. (DC 2) | Deficient diagnosis of individual factors. (IC 2.1) |
| Deficient diagnosis of academic factors. (IC 2.2) | ||||
| Deficient diagnosis of institutional factors. (IC 2.3) | ||||
| Deficient diagnosis of socioeconomic factors. (IC 2.4) | ||||
| Predictive analytics | [54,83,84,85,86,87,88,89] | What can happen? | Limited predictive model for university student dropout. (DC 3) | Inadequate design of the model for the recognition of patterns that characterize the dropout student. (CI 3.1) |
| Inadequate evaluation and training of the predictive model for university student desertion. (RQ 3.2) | ||||
| Inadequate implementation of the predictive model for university student dropout. (IC 3.3) | ||||
| Prescriptive analysis | [83,85,86,87,88,89] | How can it improve? | Limited recommendation model for student university retention. (DC 4) | Inadequate design of the recommendation model for student university retention. (IC 4.1) |
| Inadequate evaluation and training of the recommendation model for student university retention. (IC 4.2) | ||||
| Inadequate implementation of the recommendation model for student university retention. (IC 4.3) |
Table 5.
Factors associated with student retention.
| First-Order Means | Factors Associated with Student Retention Aligned to MPO 1 and MPO 2. | Proponent Authors |
|---|---|---|
| Sufficient information to determine the baseline of university student dropout. (MPO 1) Sufficient diagnosis to determine the causes/characteristics (patterns) that cause university student dropouts. (MPO 2) | Individual factors. | [72,92,98] |
| Academic factors. | [98] | |
| Institutional factors. | [72,92,98] | |
| Socioeconomic factors. | [12,72,98] |
Table 6.
First-order and fundamental means approach.
| Levels of Data Analysis | Authors | Question | First-Order Means | Fundamental Means |
|---|---|---|---|---|
| Descriptive analysis | [13,99,100,101] | What is happening? | Sufficient information to determine the baseline of university student dropout. (MPO 1) | Sufficient description of the individual factors. (FM 1.1) |
| Sufficient description of academic factors. (FM 1.2) | ||||
| Sufficient description of institutional factors. (FM 1.3) | ||||
| Sufficient description of socioeconomic factors. (FM 1.4) | ||||
| Diagnostic analysis | [99,100,101] | Why is it happening? | Sufficient diagnosis to determine the causes/characteristics (patterns) that cause university student dropouts. (MPO 2) | Adequate diagnosis of individual factors. (FM 2.1) |
| Adequate diagnosis of academic factors. (FM 2.2) | ||||
| Adequate diagnosis of institutional factors. (FM 2.3) | ||||
| Adequate diagnosis of socioeconomic factors. (FM 2.4) | ||||
| Predictive Analytics | [72,102,103,104] | Efficient predictive model for university student dropout. (MPO 3) | Efficient design of the model for the recognition of patterns that characterize the dropout student. (FM 3.1) | |
| Efficient evaluation and training of the predictive model for university student dropout. (FM 3.2) | ||||
| Adequate implementation of the predictive model for university student dropout. (FM 3.3) | ||||
| Prescriptive analysis | [72,102,103,104] | How can it improve? | Efficient recommendation model for student university retention. (MPO 4) | Efficient design of the recommendation model for student university retention. (FM 4.1) |
| Efficient evaluation and training of the recommendation model for student university retention. (FM 4.2) | ||||
| Adequate implementation of the university retention recommendation model. (FM 4.3) |
Publisher’s Note: MDPI stays neutral with regard to jurisdictional claims in published maps and institutional affiliations. |
© 2022 by the authors. Licensee MDPI, Basel, Switzerland. This article is an open access article distributed under the terms and conditions of the Creative Commons Attribution (CC BY) license (https://creativecommons.org/licenses/by/4.0/).
Share and Cite
MDPI and ACS Style
Flores, V.; Heras, S.; Julián, V. A New Methodological Framework for Project Design to Analyse and Prevent Students from Dropping Out of Higher Education. Electronics 2022, 11, 2902. https://doi.org/10.3390/electronics11182902
AMA Style
Flores V, Heras S, Julián V. A New Methodological Framework for Project Design to Analyse and Prevent Students from Dropping Out of Higher Education. Electronics. 2022; 11(18):2902. https://doi.org/10.3390/electronics11182902
Chicago/Turabian StyleFlores, Vaneza, Stella Heras, and Vicente Julián. 2022. "A New Methodological Framework for Project Design to Analyse and Prevent Students from Dropping Out of Higher Education" Electronics 11, no. 18: 2902. https://doi.org/10.3390/electronics11182902
Note that from the first issue of 2016, this journal uses article numbers instead of page numbers. See further details here.