Abstract
Online learning is gradually becoming popular with the continuous development of Internet technology and the rapid development of educational informatization. It plays a key role in predicting students’ course performance based on their online learning behavior. It can optimize the effects of teaching and improve teaching strategies. Student performance prediction models that are built with a single algorithm currently have limited prediction accuracy. Meanwhile, model fusion improvement technology can combine many algorithms into a single model, thereby enhancing the overall effect of the model and providing better performance. In this paper, a stacking fusion model based on RF-CART–XGBoost–LightGBM is proposed. The first layer of the model uses a decision tree (CART), random forest, XGBoost and LightGBM as the base models. The second layer uses the LightGBM model. We used the Kalboard360 student achievement dataset, and features related to online learning behavior were selected as the model’s input for model training. Finally, we employed five-fold cross-validation to assess the model’s performance. In comparison with the four single models, the two fusion models based on the four single models both show significantly better performance. The prediction accuracies of the bagging fusion model and stacking fusion model are 83% and 84%, respectively. This proves that the proposed stacking fusion model has better performance, which helps to improve the accuracy of the performance prediction model further. It also provides an effective basis for optimizing the effects of teaching.
1. Introduction
With the rapid development of education informatization, traditional education methods and concepts have changed greatly. Online learning is a kind of learning and teaching activity through the Internet in which users can acquire a large number of learning resources, and the time and place of learning are not as restricted as they are in traditional teaching modes [1]. Although online learning as a method is convenient for learners, it also has some problems. Unlike face-to-face communication in traditional teaching modes, online learning requires a high level of student engagement. Teachers cannot effectively understand students’ learning states and their studying behaviors [2]. The online learning system collects basic data about students and behavioral data are generated by them during their learning. Additionally, most of these raw data are unprocessed. At present, the online learning systems of many universities can only simply query the data. Therefore, it is necessary to dig deeper into online learning behavior data and turn them into useful information for educational administrators and teachers.
By analyzing students’ daily learning data, we can find the key factors affecting students’ performance and also predict the trend of students’ performance in advance and keep track of the effects on their learning [3]. For students, letting them know their predicted results will improve their self-monitoring ability, and students with unsatisfactory predicted results will strengthen their own crisis awareness, correct their learning state in time, and finally achieve more satisfactory results. For managers of online learning platforms, establishing learning achievement prediction models can help build course resources, design teaching processes, assess teachers’ teaching abilities, and improve the process management system of online teaching [4]. For schools, it can also promote the construction of education informatization and improve the quality of education, which has important social relevance to a certain extent.
2. Related Work
In the context of education informatization, it was inevitable that machine learning would be widely applied to the field of education. The learning behavior data of the students using online learning platforms can predict the students’ course performance by data mining methods, which plays a crucial role in improving the quality of education and teaching. In recent years, many scholars have explored various methods for predicting academic performance based on online learning behavior data. Puarungroj et al. applied a C4.5 decision tree to construct a classification model for the prediction of students’ English graduation test scores [5]. Batool S. et al. adopted a random forest classification model to predict students’ final exam scores by students’ demographic data [6]. Romero et al. used behavioral data from participation in an online learning forum to construct a clustering algorithm model to predict the final grade of students’ performance [7]. Zhong et al. proposed a model-bias matrix factorization approach to predict students’ grades in elective courses based on the grade prediction bias caused by the course selection rate [8]. Guang-yu L et al. used an XGBoost gradient upgrade decision tree algorithm to study the strong correlation between students’ learning behavior data and their scores, so they could predict student scores [9].
In order to explore the algorithms with better prediction performance, some studies have built multiple models with different algorithms and compared their performance. Baha et al. used C5 decision trees, support vector machines, artificial neural networks and logistic regression algorithms to construct separate predictive models for student placement test scores. The results showed that the C5 decision tree algorithm is the best predictor [10]. Kaur et al. applied the multilayer perceptron, naive Bayes, SMO and J48 classification algorithms to predict and analyze students’ performance. Among all the data mining classifiers, the multilayer perceptron performed the best [11]. Wang et al. used LightGBM to predict if a student would be able to pass a course. They compared their results with those of ten classical machine learning algorithms, and LightGBM outperformed them [12].
The prediction models above have superior prediction effects on the respective research objects. However, using a single algorithm to build the model will lead to a restriction on the improvement in prediction accuracy. Therefore, more and more researchers have adopted model fusion improvement technology to integrate multiple algorithms. It can incorporate the advantages of each model to reduce the prediction error, so as to enhance the effect of the overall model. This technique has better prediction performance compared with a single model. Fusion improvement technology is extensively applied in various fields. Wang et al. used the fusion model to significantly improve the performance of the base learner in mining the emotional classification of user-published content [13]. Xia et al. proposed the CSXGBoost model for personal risk assessments in the P2P field [14]. Demir N et al. proposed an improved stacking integration method to detect network traffic attacks [15]. Many studies on online learning also use model fusion technology. Han et al. proposed a model based on the ensemble algorithm AdaBoost to predict students’ performance [16]. Xing et al. used a stacking algorithm to integrate a generic Bayesian network and the decision tree model to predict whether mooc (massive open online courses) students have a dropout risk [17]. However, AdaBoost belongs to the integrated model of homogeneous algorithms. It integrates algorithms by the linearization technique. AdaBoost cannot combine differences and advantages of various algorithms, and its generalization ability needs to be strengthened [18]. The Bayesian classification model requires the calculation of prior probabilities and is sensitive to the form of expression of the input data. Due to the use of the sample attribute independence assumption, its effect is poor when the sample attributes have an association with each other.
Based on the above studies, this paper proposes a stacking fusion model based on RF-CART–XGBoost–LightGBM. The first layer of the model chooses four single models with good performance as the base models: decision tree (CART), random forest, XGBoost and LightGBM. The second layer uses the LightGBM model. When constructing the stacking model, we merge the predictive values of the first layer with the original training set and make it the input of the second layer. This will make the model work better and prevent over-fitting. We choose relevant online learning behavior data as the input of the model aimed at predicting student performance. We also compare the stacking fusion model with the four single models and the bagging fusion model.
3. Algorithm Theory
Many single machine learning models have achieved excellent results in online learning behavior performance prediction, such as the decision tree model, random forest model, XGBoost model and LightGBM model. The decision tree is a more classical machine learning algorithm and common in data mining algorithms. It has a high accuracy and fast operation. It also supports multiple types of data processing, and has a good performance in various domain applications [19,20]. The random forest classification model is an integrated tree model that uses the idea of bagging to combine multiple decision trees to make predictions. Lots of research has shown that the random forest classification model has few adaptable parameters, a strong anti-interference ability and strong adaptability [21,22]. The XGBoost model is an integrated tree model using the boosting method, and it performs well in classification modeling [23,24]. The LightGBM model has a much lower computation time and memory consumption than the XGBoost model, without affecting the accuracy of the model prediction classification. It excels in the performance of classification modeling and has wide applications in industry [25,26]. Therefore, these four single models are selected as the performance prediction classification base models.
3.1. CART Decision Tree
The decision tree classification model is a common machine learning classification model. The model recursively compares the characteristic value of the nodes in a decision tree in the existing training set, and select the best split point to branch down through the top–down approach. Then, it chooses the next split point in the same way until the training set is empty. The CART algorithm takes the Gini index as the criterion for selecting the split nodes. The formula for the Gini index of a given probability distribution is shown in Equation (1).
where represents the probability of the sample belonging to category k.
If expands at the first order and the infinitesimal of the higher order is ignored, it can be approximated as 0. So, the information entropy can be approximated by the Gini index. The deduction process is given in Equation (2).
where represents the probability of the sample belonging to category i.
The Gini index is available to measure the differences between features and labels, which is an approximation of the information entropy. The smaller the Gini index, the less the sample uncertainty. It is easier to calculate results [19,20]. Overall, the decision tree classification model is fast and effective, but the generalization performance for unknown test datasets is general. It may cause overfitting, and if so, we can use pruning or a random forest at that point [27].
3.2. Random Forest
A random forest is an integrated algorithmic model with the decision tree as the basic unit. The random forest classification model mainly uses multiple decision tree classification models to train and predict separately, then combines the prediction classification results by voting strategies to obtain the final prediction classification result [22]. We can see the construction process of the random forest from Figure 1.
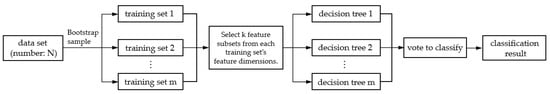
Figure 1.
Construction of random forest.
3.3. XGBoost Algorithm
The XGBoost (eXtreme Gradient Boosting) model is integrated by multiple classification regression trees (CART), mainly based on tree integration. It solves the minimum loss function through the second-order Taylor expansion, then determines the split nodes and builds the final model. The basic idea is that it combines multiple tree-based weak classifiers and constructs a model with a relatively higher accuracy. The model constantly improves iteratively. Each iteration generates a new tree to fit the residuals of the previous tree, which makes the gradient increase continuously [23,28].
According to the above principle of the algorithm, Equation (3) represents the XGBoost model.
where F is the set of all possible CART, is the total number of trees, is one tree function in the CART set, is the predictive value and is the ith sample of the input. The XGBoost algorithm uses a gradient lifting strategy. It adds a new tree at a time instead of obtaining all the trees, and constantly revises the previous test results [24]. The objective optimization function of the XGBoost algorithm consists of two parts: the first part is the loss function and the other part is a regularization item to control fitting deviation.
where is the training error of , is the actual value, is the predictive value, is the predictive value at the iteration in step t, and is the regularization item of the ith classification tree.
3.4. LightGBM Algorithm
The light gradient boosting machine (LightGBM) is an algorithmic framework based on the gradient boosting decision tree (GBDT) proposed by Microsoft, which supports parallel training and distributed processing. It can quickly process massive data with lower memory consumption and no effect on accuracy [25].
The LightGBM uses a modified histogram algorithm instead of XGBoost’s pre-sorting (pre-sorted) algorithm. It can reduce the number of split candidate points by discretizing continuous eigenvalues to a fixed number of the bin. The histogram algorithm applies the depth-limited leaf growth (leaf-wise) algorithm instead of the layer growth (level-wise) algorithm. It reduces the search for lower split leaves and the number of leaves. It diminishes the complexity of model training and lowers the memory consumption [26,29].
3.5. Model Performance Evaluation Index
Learning performance prediction research based on online learning behavior belongs to a multi-classification problem. If we choose appropriate model evaluation methods and indicators, we can more accurately evaluate the predictive ability of the model. If the total number of data samples is n, indicates the number of samples of the actual category i and the predicted category j. The following formula is for Accuracy:
In addition, the ROC curve and the area under it are also commonly used to evaluate the model performance. The ordinate of the ROC curve is the true positive rate (TPR), and the abscissa is the false positive rate (FPR). They are formulated as follows:
TP (True Positive) indicates the positive samples are predicted by the model as the positive class. FP (False Positive) indicates the negative samples are predicted by the model as the positive class. FN (False Negative) indicates the positive samples are predicted by the model as the negative class. TN (True Negative) indicates the negative samples are predicted by the model as the negative class.
In general, the lower the false positive rate and the bigger the true positive rate, the better the classification model. Additionally, the ROC curve is nearer to the upper left corner. The AUC is the area under the ROC curve. Throughout the analysis, the value of the AUC is generally no more than 1. If the AUC is nearer to 1, the accuracy of the model classification is higher [30].
4. Experiments Setups
4.1. Data Description
This study selects the Kalboard360 student performance dataset, which consists of 480 records of basic student information and online learning behavior data. The dataset attribute names and meanings are shown in Table 1.

Table 1.
Data set attribute name and meaning.
Through the relevant data analysis, five relevant features are found, including the number of days of absence per student, number of hands raised in class, number of times students visit online resources, number of times students view new announcements and number of times students participate in the discussion group. According to the five relevant characteristics, we find the correlation between online learning behavior characteristics and grades. The thermodynamic diagram is shown in Figure 2.
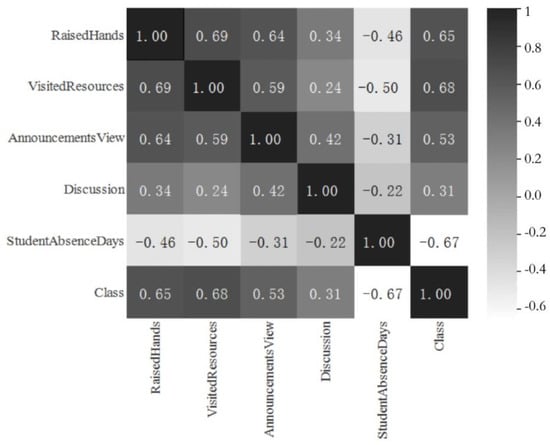
Figure 2.
Thermodynamic diagram of the correlation coefficient between online learning behavior characteristics and grades.
Generally, a correlation coefficient between 0 and 0.3 represents no correlation, between 0.3 and 0.5 represents a weak correlation, between 0.5 and 0.8 represents a medium correlation and between 0.8 and 1.0 represents a strong correlation [31]. Hence, the number of days of absence per student, number of hands raised in class, number of times students visit online resources and number of times students view new announcements have a medium correlation with the performance. The number of times students participate in the discussion group has a weak correlation with the performance. The number of times students visit online resources has the highest correlation with the performance, followed by the number of days of absence per student, number of hands raised in class, number of times students visit online resources, number of times students view new announcements and number of times students participate in the discussion group. The five features were selected as the input to the classification model.
4.2. Bagging Performance Prediction Fusion Model
The bagging algorithm uses bootstrap sampling to sample with a replacement randomly. Taking the original data set with a data amount of N as an example, we sample N pieces of data from the original data set each time to create a training set, and proceed with the same method m times to create training subsets. The differences in data between the training subsets lead to multiple different weak learners. The prediction results of these weak learners are combined to strengthen the model’s effect [32,33].
Before constructing the fusion model, we used the above datasets to construct the decision tree, random forest, XGBoost and LightGBM classification models. We also took advantage of the above datasets to train and test the four classification models. The dataset was divided in a 4:1 ratio with four copies as a training set and one copy as a testing set. We took the number of days of absence per student, number of hands raised in class, number of times students visit online resources, number of times students view new announcements and number of times students participate in the discussion group as the input, and the student grades as the target output. Table 2 shows the specific parameters and the accuracies.
Table 2.
Single model parameter setting and prediction accuracy.
The study improves on the original bagging algorithm, and the construction process is shown in Figure 3.
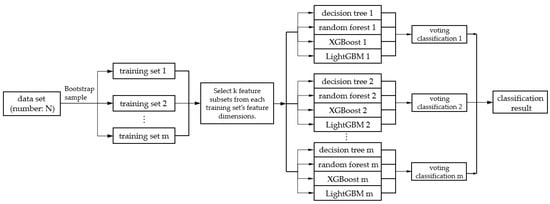
Figure 3.
The construction process of bagging fusion model for grade prediction.
We utilized bootstrap sampling to generate different training subsets, and set the proportion of bootstrap sampling to 0.8 times the entire data set. We set the number of bootstrap samples to five, and the number of different training subsets generated was five. We selected the number of times students visit online resources, days of absence per student, number of hands raised in class, number of times students visit online resources, number of times students view new announcements and number of times students as the input. The value of the feature attribute k was five.
Then, the resulting training subset 1 used the decision tree (CART) 1, random forest 1, XGBoost 1 and LightGBM 1 models as the base model groups 1 to train their respective performance prediction classification models. It obtained the performance prediction output results of the corresponding group, and the intermediate result voting classification 1 was formed by soft voting. Similarly, the generated training subset 2 adopted the above method, and used the decision tree 2, random forest 2, XGBoost 2 and LightGBM 2 models as the base model for group 2 to train the respective performance prediction classification models. It obtained the performance prediction output results of the corresponding group, and the intermediate result voting classification 2 was formed by soft voting. Furthermore, we continued until we obtained the predicted output intermediate voting classification 5 from the base model group 5. For the intermediate result voting classifications 1–5, we used soft voting to output the corresponding rank probability. We obtained the performance prediction results from the final output of the bagging fusion model. Part of the pseudocode for the training and testing process of the bagging fusion model is shown in Algorithm 1.
| Algorithm 1. Bagging Fusion Model Algorithm | |
| Input: | data set D |
| Output: | Bagging fusion model M |
| Step1: | Divide the data set D into K equal parts. Take K − 1 copies as training set and one copy as testing set. By five-fold cross-validation,, }, }; |
| Step2: | for i = 1 to K |
| for j = 1 to m //m is the number of different base models in the first layer, and m equals 4. | |
| Bootstrap sample the training set with the proportion of 0.8 times and obtain five training subsets; | |
| Adopt different base models to train every training subset, and; | |
| Use soft voting to process the results from different models to obtain the intermediate voting results; | |
| Use soft voting again to process the intermediate voting results and form the result of the final fusion model M; | |
| end | |
| end | |
| Step3: | for i = 1 to K |
| for j = 1 to m | |
| Call the from training when we test the testing T; | |
| Use soft voting to process the results from different models to obtain the intermediate voting results; | |
| Use soft voting again to process the intermediate voting results and form the result of the final fusion model M; | |
| end | |
| end | |
| Step4: | Count the prediction performance of each class of the models after K-fold cross-validation, and the output model performance is averaged. |
4.3. Stacking Performance Prediction Fusion Model
A stacking algorithm is a hierarchical model integration framework. For instance, if it has two layers, the first layer consists of multiple base learners, whose input is the original training set. The model in the second layer trains all the outputs of the first layer model as the training set to obtain a complete stacking model [34]. During the process of constructing stacking, we combine the predicted values of the first layer and the original features, then add them to the model training of the second layer. This can make the model work better and prevent overfitting [35].
The construction process of the stacking fusion model employed in this paper is shown in Figure 4. The first layer of the stacking method used a decision tree (CART), random forest, XGBoost and LightGBM as the base model. We employed a five-fold cross-validation for each base model. For example, the training set is divided into five equal parts: train1, train2, train3, train4 and train5. If train1, train2, train3 and train4 are taken as the training set, train5 is taken as the validation set, and so on. Five prediction outputs with train1–train5 as the validation set were obtained, respectively, and the above prediction results were superimposed.
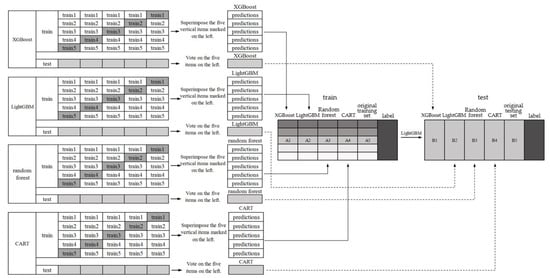
Figure 4.
Construction process of stacking fusion model for grade prediction.
The first layer of the model used a decision tree (CART), random forest, XGBoost and LightGBM as the base model. For the four base models in the first layer, we can obtain the predicted results of the train 1 to train 5 models and form them into a list of new features. The decision tree classification model, random forest classification model, XGBoost classification model and LightGBM classification model obtained features A1 to A4, respectively. We added them to the original training set A5 as a new feature column, and took them as the input of the second layer model. The second layer model selected the LightGBM model and used the new training set to train the LightGBM classification model. At last, we can obtain the performance prediction stacking fusion model. In addition, when we tested the above stacking model with the test set, it was also necessary to add the soft-voting prediction results of the prediction set on the four base models in the first layer to the original testing set B5 as the eigenvalues B1–B4. Then we tested the prediction set with the second layer model LightGBM to obtain the final result. Part of the pseudocode for the training and testing process of the stacking fusion model is shown in Algorithm 2.
| Algorithms 2. Stacking Fusion Model Algorithm | |
| Input: | data set D |
| Output: | Stacking fusion model M |
| Step 1: | Divide the data set D into K equal parts. Take K − 1 copies as the training set and one copy as the testing set. By five-fold cross-validation,, }, the , }; |
| Step 2: | for i = 1 to K |
| for j = 1 to m //m is the number of different base models in the first layer, and m equals 4. | |
| }; | |
| ) ); | |
| . Use the testing set to test and obtain the prediction results; | |
| ; | |
| end | |
| , , by training; | |
| end | |
| Step 3: | for i = 1 to K |
| for j = 1 to m | |
| of the first layer to obtain the five prediction results when we test the testing T; | |
| ; | |
| end | |
| , , of the second layer from training to obtain the prediction result of the final fusion model; | |
| end | |
| Step 4: | Count the prediction performance of each class of the models after K-fold cross-validation, and the output model performance is averaged. |
5. Analysis of the Results
The two fusion model parameters referred to the setting of the single model. Some key parameters were set by a grid search, and the remaining parameters trained the model with default values. The model test and the performance assessment used a five-fold cross-validation to output the prediction accuracy. We drew the ROC curve diagram and obtained the area AUC under the ROC curve. The ROC plots of the single models and the two fusion models are shown in Figure 5. The prediction accuracies of the six modeling methods are presented in Table 3.
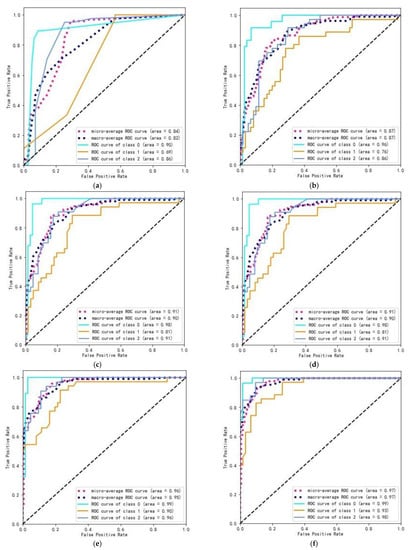
Figure 5.
ROC plot of (a) decision tree; (b) XGBoost; (c) random forest; (d) LightGBM; (e) bagging fusion model; (f) stacking fusion model.
Table 3.
Accuracy of fusion models and single models.
From the above experimental results, the proposed RF-CART–XGBoost–LightGBM stacking fusion model has a higher performance than the bagging fusion model. The single models will produce large errors and cause errors in data analysis compared to the stacking fusion model. It solves the problem of the accuracy and error rate of the single model. At the same time, both the fusion models perform significantly better than the single models, such as the decision tree (CART), random forest, XGBoost and LightGBM. The RF-CART–XGBoost–LightGBM stacking fusion model can effectively make up for the weak generalization ability of a single algorithm model. ThesStacking fusion model learns several different primary learners, and learns a secondary learner to combine the base learners. It outputs the final prediction result based on the prediction result of the primary learners. The main reason why the stacking fusion model is better than the single models is that it fully utilizes the advantages of each learner. There is always a risk of falling into the local minimum in the optimization process of the single model. The model generalization performance corresponding to the local minimum may be poor. Combining multiple primary models effectively reduces this risk. When a primary learner gets the wrong prediction result, the secondary learner can correct it. Therefore, the fusion model has a stronger generalization ability than the single algorithm models.
6. Conclusions
Based on the four single models with good performance, decision tree (CART), random forest, XGBoost and LightGBM, this paper proposes bagging and stacking student performance prediction models by model fusion improvement technology. The results of the experiment indicate that the proposed stacking fusion model based on RF-CART–XGBoost–LightGBM performs better than the bagging fusion model, and significantly outperforms the four single models. Further research will study the influence of different combination methods of single models on the time consumption and accuracy of the fusion models on a more comprehensive data set, and find the optimal single model combination method. The proposed stacking fusion model based on RF-CART–XGBoost–LightGBM improves the accuracy of performance predictions in educational data mining.
Author Contributions
Conceptualization, X.L.; methodology, F.Y.; software, F.Y.; validation, X.L.; formal analysis, X.L.; data curation, F.Y.; writing—original draft preparation, X.L. and F.Y.; writing—review and editing, X.L. and F.Y.; visualization, F.Y. All authors have read and agreed to the published version of the manuscript.
Funding
This research received no external funding.
Data Availability Statement
The dataset was downloaded from: http://www.Ibrahimaljarah.com (accessed on 5 July 2022).
Conflicts of Interest
The authors declare no conflict of interest.
References
- Hussain, M.; Zhu, W.; Zhang, W.; Abidi, S.M.R. Student engagement predictions in an e-learning system and their impact on student course assessment scores. Comput. Intell. Neurosci. 2018, 2018, 1–21. [Google Scholar] [CrossRef] [PubMed]
- Persico, D.; Pozzi, F. Informing learning design with learning analytics to improve teacher inquiry. Br. J. Educ. Technol. 2015, 46, 230–248. [Google Scholar] [CrossRef]
- Arcinas, M.M.; Sajja, G.S.; Asif, S.; Gour, S.; Okoronkwo, E.; Naved, M. Role Of Data Mining In Education For Improving Students Performance For Social Change. Turk. J. Physiother. Rehabil. 2021, 32, 6519–6526. [Google Scholar]
- Alhazzani, N. MOOC’s impact on higher education. Soc. Sci. Humanit. Open 2020, 2, 100030. [Google Scholar] [CrossRef]
- Puarungroj, W.; Boonsirisumpun, N.; Pongpatrakant, P.; Phromkhot, S. Application of data mining techniques for predicting student success in English exit exam. In Proceedings of the 12th International Conference on Ubiquitous Information Management and Communication, Langkawi, Malaysia, 5–7 January 2018; pp. 1–6. [Google Scholar]
- Batool, S.; Rashid, J.; Nisar, M.W.; Kim, J.; Mahmood, T.; Hussain, A. A random forest students’ performance prediction (rfspp) model based on students’ demographic features. In Proceedings of the 2021 Mohammad Ali Jinnah University International Conference on Computing (MAJICC), Karachi, Pakistan, 15–17 July 2021; IEEE, 2021; pp. 1–4. [Google Scholar]
- Romero, C.; López, M.I.; Luna, J.M.; Ventura, S. Predicting students’ final performance from participation in on-line discussion forums. Comput. Educ. 2013, 68, 458–472. [Google Scholar] [CrossRef]
- Zhong, S.T.; Huang, L.; Wang, C.D.; Lai, J.; Xie, G.; Li, Y. A Model-Bias Matrix Factorization Approach for Course Score Prediction. Neural Process. Lett. 2020, 1–18. [Google Scholar] [CrossRef]
- Guang-yu, L.; Geng, H. The behavior analysis and achievement prediction research of college students based on XGBoost gradient lifting decision tree algorithm. In Proceedings of the 2019 7th International Conference on Information and Education Technology, Aizu-Wakamatsu, Japan, 29–31 March 2019; pp. 289–294. [Google Scholar]
- Baha, S.; Emine, U.; Dursun, D. Predicting and analyzing secondary education placement-test scores: A data mining approach. Expert Syst. Appl. 2012, 39, 9468–9476. [Google Scholar]
- Kaur, P.; Singh, M.; Josan, G.S. Classification and prediction based data mining algorithms to predict slow learners in education sector. Procedia Comput. Sci. 2015, 57, 500–508. [Google Scholar] [CrossRef]
- Wang, C.; Chang, L.; Liu, T. Predicting Student Performance in Online Learning Using a Highly Efficient Gradient Boosting Decision Tree. In Proceedings of the International Conference on Intelligent Information Processing, Bucharest, Romania, 29–30 September 2022; Springer: Cham, Switzerland, 2022; pp. 508–521. [Google Scholar]
- Wang, G.; Sun, J.; Ma, J.; Xu, K.; Gu, J. Sentiment classification: The contribution of ensemble learning. Decis. Support Syst. 2014, 57, 77–93. [Google Scholar] [CrossRef]
- Xia, Y.; Liu, C.; Liu, N. Cost-sensitive boosted tree for loan evaluation in peer-to-peer lending. Electron. Commer. Res. Appl. 2017, 24, 30–49. [Google Scholar] [CrossRef]
- Demir, N.; Dalkiliç, G. Modi ed stacking ensemble approach to detect network intrusion. Turk. J. Electr. Eng. Comput. Sci. 2018, 26, 418–433. [Google Scholar] [CrossRef]
- Han, M.; Tong, M.; Chen, M.; Liu, J.; Liu, C. Application of ensemble algorithm in students’ performance prediction. In Proceedings of the 2017 6th IIAI International Congress on Advanced Applied Informatics (IIAI-AAI), Shizuoka, Japan, 9–13 July 2017; IEEE: Piscataway, NJ, USA, 2017; pp. 735–740. [Google Scholar]
- Xing, W.; Chen, X.; Stein, J.; Marcinkowski, M. Temporal predication of dropouts in MOOCs: Reaching the low hanging fruit through stacking generalization. Comput. Hum. Behav. 2016, 58, 119–129. [Google Scholar] [CrossRef]
- Santos, S.G.T.D.C.; de Barros, R.S.M. Online AdaBoost-based methods for multiclass problems. Artif. Intell. Rev. 2020, 53, 1293–1322. [Google Scholar] [CrossRef]
- Durica, M.; Podhorska, I.; Durana, P. Business failure prediction using cart-based model: A case of Slovak companies. Ekon. Manaz. Spektrum 2019, 13, 51–61. [Google Scholar] [CrossRef]
- Lewis, R.J. An introduction to classification and regression tree (CART) analysis. In Proceedings of the Annual Meeting of the Society for Academic Emergency Medicine in San Francisco, San Francisco, CA, USA, 22–25 May 2022; p. 14. [Google Scholar]
- Petkovic, D.; Sosnick-Pérez, M.; Okada, K.; Todtenhoefer, R.; Huang, S.; Miglani, N.; Vigil, A. Using the random forest classifier to assess and predict student learning of software engineering teamwork. In Proceedings of the 2016 IEEE frontiers in education conference (FIE), Eire, PA, USA, 12–15 October 2016; IEEE: Piscataway, NJ, USA, 2016; pp. 1–7. [Google Scholar]
- Speiser, J.L.; Miller, M.E.; Tooze, J.; Ip, E. A comparison of random forest variable selection methods for classification prediction modeling. Expert Syst. Appl. 2019, 134, 93–101. [Google Scholar] [CrossRef] [PubMed]
- Chen, T.; He, T.; Benesty, M.; Khotilovich, V.; Tang, Y.; Cho, H.; Chen, K. Xgboost: Extreme Gradient Boosting. R Package Version 0.4-2; 2015; Volume 1, pp. 1–4. Available online: https://cran.microsoft.com/snapshot/2017-12-11/web/packages/xgboost/vignettes/xgboost.pdf (accessed on 7 September 2022).
- Dong, W.; Huang, Y.; Lehane, B.; Ma, G. XGBoost algorithm-based prediction of concrete electrical resistivity for structural health monitoring. Autom. Constr. 2020, 114, 103155. [Google Scholar] [CrossRef]
- Liu, Y.; Yu, Z.; Chen, C.; Han, Y.; Yu, B. Prediction of protein crotonylation sites through LightGBM classifier based on SMOTE and elastic net. Anal. Biochem. 2020, 609, 113903. [Google Scholar] [CrossRef]
- Machado, M.R.; Karray, S.; de Sousa, I.T. LightGBM: An effective decision tree gradient boosting method to predict customer loyalty in the finance industry. In Proceedings of the 2019 14th International Conference on Computer Science & Education (ICCSE), Toronto, ON, Cananda, 19–21 August 2019; IEEE: Piscataway, NJ, USA, 2019; pp. 1111–1116. [Google Scholar]
- Mehta, M.; Rissanen, J.; Agrawal, R. MDL-Based Decision Tree Pruning. KDD 1995, 21, 216–221. [Google Scholar]
- Wu, Y.; Qi, S.; Hu, F.; Ma, S.; Mao, W.; Li, W. Recognizing activities of the elderly using wearable sensors: A comparison of ensemble algorithms based on boosting. Sens. Rev. 2019, 39, 743–751. [Google Scholar] [CrossRef]
- Ju, Y.; Sun, G.; Chen, Q.; Zhang, M.; Zhu, H.; Rehman, M.U. A model combining convolutional neural network and LightGBM algorithm for ultra-short-term wind power forecasting. IEEE Access 2019, 7, 28309–28318. [Google Scholar] [CrossRef]
- Bradley, A.P. The use of the area under the ROC curve in the evaluation of machine learning algorithms. Pattern Recognit. 1997, 30, 1145–1159. [Google Scholar] [CrossRef]
- Benesty, J.; Chen, J.; Huang, Y.; Cohen, I. Pearson correlation coefficient. In Noise Reduction in Speech Processing; Springer: Berlin/Heidelberg, Germany, 2009; pp. 1–4. [Google Scholar]
- Alam MS, B.; Patwary MJ, A.; Hassan, M. Birth mode prediction using bagging ensemble classifier: A case study of Bangladesh 2021. In Proceedings of the International Conference on Information and Communication Technology for Sustainable Development (ICICT4SD), Barcelona, Spain, 19–20 June 2022; IEEE: Piscataway, NJ, USA, 2021; pp. 95–99. [Google Scholar]
- Hegde, C.; Wallace, S.; Gray, K. Using trees, bagging, and random forests to predict rate of penetration during drilling. In Proceedings of the SPE Middle East Intelligent Oil and Gas Conference and Exhibition, Abu Dhabi, United Arab Emirates, 15–16 September 2015. [Google Scholar]
- Džeroski, S.; Ženko, B. Stacking with multi-response model trees. In Proceedings of the International Workshop on Multiple Classifier Systems, Cagliari, Italy, 24–26 June 2002; Springer: Berlin/Heidelberg, Germany, 2002; pp. 201–211. [Google Scholar]
- Wang, X.; Han, T. Transformer fault diagnosis based on stacking ensemble learning. IEEJ Trans. Electr. Electron. Eng. 2020, 15, 1734–1739. [Google Scholar] [CrossRef]
Publisher’s Note: MDPI stays neutral with regard to jurisdictional claims in published maps and institutional affiliations. |
© 2022 by the authors. Licensee MDPI, Basel, Switzerland. This article is an open access article distributed under the terms and conditions of the Creative Commons Attribution (CC BY) license (https://creativecommons.org/licenses/by/4.0/).