
C-V2X Centralized Resource Allocation with Spectrum Re-Partitioning in Highway Scenario


Institute of Radiocommunications, Poznan University of Technology, 60-965 Poznan, Poland
*
Author to whom correspondence should be addressed.
Electronics 2022, 11(2), 279; https://doi.org/10.3390/electronics11020279
Submission received: 1 December 2021
/
Revised: 6 January 2022
/
Accepted: 13 January 2022
/
Published: 16 January 2022
(This article belongs to the Special Issue Problems and Challenges of Physical Layer in 5G Systems)
Abstract
:Cellular Vehicle-to-Everything communication is an important scenario of 5G technologies. Modes 3 and 4 of the wireless systems introduced in Release 14 of 3GPP standards are intended to support vehicular communication with and without cellular infrastructure. In the case of Mode 3, dynamic resource selection and semi-persistent resource scheduling algorithms result in a signalling cost problem between vehicles and infrastructure, therefore, we propose a means to decrease it. This paper employs Re-selection Counter in centralized resource allocation as a decremental counter of new resource requests. Furthermore, two new spectrum re-partitioning and frequency reuse techniques in Roadside Units (RSUs) are considered to avoid resource collisions and diminish high interference impact via increasing the frequency reuse distance. The two techniques, full and partial frequency reuse, partition the bandwidth into two sub-bands. Two adjacent RSUs apply these sub-bands with the Full Frequency Reuse (FFR) technique. In the Partial Frequency Reuse (PFR) technique, the sub-bands are further re-partitioned among vehicles located in the central and edge parts of the RSU coverage. The sub-bands assignment in the nearest RSUs using the same sub-bands is inverted concerning the current RSU to increase the frequency reuse distance. The PFR technique shows promising results compared with the FFR technique. Both techniques are compared with the single band system for different vehicle densities.
1. Introduction
Cellular Vehicle-to-Everything (C-V2X) communication is a new technology that has been added to the LTE cellular system to support intelligent transportation systems [1]. 3GPP has introduced two modes of communication in Release 14 to exchange information between vehicles on the road, to increase self-driving car safety, to improve situational awareness and travel comfort, and to decrease traffic congestion [2]. Each vehicle should broadcast a Cooperative Awareness Message (CAM) periodically to inform the surrounding vehicles about its status [3].
C-V2X Mode 3 is a kind of communication in which the cellular infrastructure supports centralized resource allocation for vehicles located inside the cellular coverage area. The cellular infrastructure is responsible for selecting, re-selecting, scheduling, and managing the radio resources used for distribution of awareness messages transmitted by vehicles [4,5,6]. The C-V2X communication of vehicles operating in Mode 4 applies decentralized resource allocation and is mainly used outside the cellular coverage. The vehicles operating in Mode 4 are responsible for autonomous selection, re-selection, scheduling, and managing the resource allocation for broadcasting CAM messages [7].
Single-Carrier Frequency Division Multiple Access (SC-FDMA) has been selected as the C-V2X communication technique [8]. The resource blocks in SC-FDMA have been divided into groups to form sub-channels in the frequency domain, while two consecutive time slots form a subframe in the time domain (see Figure 1). Each vehicle can use one sub-channel to broadcast a CAM message periodically [9]. The transmitted packet consists of two parts in adjacent or non-adjacent configuration [10]. The first part, containing the physical sidelink control channel (PSCCH), is placed in two resource blocks in each sub-channel to help the receiver to decode the second part that consists of a variable number of resource blocks, constituting the physical sidelink shared channel (PSSCH). When transmitting CAM, these resource blocks carry data related to speed, acceleration, deceleration, vehicle type, and direction. The number of resource blocks in the second part depends on the Modulation and Coding Scheme (MCS) used to broadcast these data [11]. Because of high mobility and high density of vehicles, 3GPP has increased the number of DeModulation Reference Signals (DMRSs) in the sub-frame structure from two in conventional Device-to-Device (D2D) communication to four in C-V2X, to handle the Doppler effect, especially for those vehicles that move with high speed up to 250 kmph. The Tx-Rx turnaround symbol is added at the end of a sub-frame to better track the channel at high vehicle speeds [12].
In the case of Mode 4, 3GPP in Release 14 [6] proposed a Re-selection Counter (RC) mechanism to generate a random number defining the periodicity of resource re-selection. The range of RC is selected and related to the CAM interval as follows [13]: [5–15], when the CAM interval = 100 ms. [10–30], when the CAM interval = 50 ms. [25–75], when the CAM interval = 20 ms.
The RC value decreases by one with each CAM message broadcast by a vehicle. Moreover, when RC reaches zero, a re-selection mechanism is invoked to decide to keep the same resources with probability P or to re-select new resources with probability [14]. Moreover, the Sensing based Semi-Persistent Scheduling (S-SPS) method has been proposed for C-V2X Mode 4 as an autonomous scheduler, and resource selection method [15,16].
In C-V2X Mode 3, the infrastructure selects the resources for all vehicles in the network, and thus, high reliability in packet transmission is achieved [17,18]. The dedicated signals between cellular infrastructure and vehicles improve transmission reliability. Unlike for Mode 4, 3GPP did not specify a resource allocation algorithm for Mode 3. Each operator can implement its own one that should fall under one of two categories [10]: Dynamic Scheduling (DS) and Semi-Persistent Scheduling (SPS). In DS, vehicles request sub-channels from the cellular infrastructure before each transmission, which increases the control signalling cost and lengthens delay of CAM message broadcasting. On the other hand, the cellular infrastructure reserves resources for periodic broadcasting by vehicles in SPS. However, the cellular infrastructure is responsible for deciding how long the reservation should last (i.e., 3GPP did not define the RC in Mode 3). Moreover, only cellular infrastructure can activate, deactivate, or modify the resources or the reservation period of sub-channels. The vehicles in Mode 3 should notify the infrastructure about the type, size, and broadcasting cycle of CAMs to reserve the fitting sub-channels.
The probability of correct reception of messages with properly selected receiving parameters and the required C-V2X communication range ensuring communication with high reliability are 3GPP use cases [19] discussed in this paper. The main objective of the research reported in this paper is to avoid the drawbacks in C-V2X Mode 3 observed for such reasons as: overlapping in CAM’s broadcasts area, high signalling cost and signal latency between cellular infrastructure, and mitigating the interference signals that can negatively impact the packet reception ratio of vehicles in C-V2X Mode 3. In this paper, cooperation among Road Side Units (RSUs), a part of the cellular infrastructure, is proposed. We have investigated application of the RC in centralized re-selection resources of C-V2X Mode 3. The RC values generated in an RSU can provide the capability to advance knowledge when the vehicles need new resources. In this way, assuming stationary sub-channels and transmission power, vehicles do not need to send requests to RSU for new resources. Thus, reducing signalling costs can be achieved. Furthermore, we propose the fractional frequency reuse and soft frequency reuse concepts [20] to be used by an RSU to specify the vehicles’ broadcast resources. In other words, frequency partitioning is used to grant vehicles with resource allocations needed to broadcast CAM messages. The given bandwidth is divided into two bands used by two adjacent RSUs. In our proposal, the full frequency reuse technique (FFR) partitions the bandwidth into two separate bands for two adjacent RSUs to guarantee that the vehicle’s broadcast does not overlap. In this case, the frequency reuse distance means that another single RSU coverage area is located between two RSUs using the same band. Moreover, in the partial frequency reuse technique (PFR), further re-partitioning of the band into two sub-bands (inner and outer bands) takes place for central and edge users, respectively, and the sub-bands are distributed inversely with respect to the near RSUs that use the same band. As a result, the partial frequency reuse technique promises encouraging results as compared with the full frequency reuse technique. Moreover, both techniques provide performance advantages over the system in which a regular single band (SB) is applied for all RSUs.
1.1. Related Work
During the last few years, many research groups have investigated and evaluated the performance of C-V2X, focusing on what the packet reception ratio (PRR), packet collision ratio (PC), and resource allocation algorithms should be. In [16] the authors performed a comprehensive analytical investigation and analyzed the resource allocation and collision probability in Mode 4. Nabil et al. in [14] studied the S-SPS method and evaluated the impact of resource pool configuration and the Resource Reservation Interval (RRI) on the system performance in Mode 4. The authors in [15] proposed a “lookahead” technique to reduce resource collisions by identifying the next resource location. Different size and periodicity of packets with optimized parameters have been investigated in [21]. The authors of this paper have made some contributions related to this work. The authors proposed a novel algorithm of resource allocation named Estimation and Reservation of Resource Allocation (ERRA) in [22] as an alternative algorithm to the S-SPS scheduling method in C-V2X Mode 4. The authors have also extended this algorithm in [23] to be more practical for vehicles exiting or just entering the awareness range of a vehicle operating in Mode 4. In [24], the authors have proposed a novel technique for resource re-selection assisted by adaptive modulation and collision detection in C-V2X Mode 4. The novel technique is run and tested in different modulation and coding schemes and transmission powers. The authors of [25] introduced a comprehensive analysis related to the interaction between transmission power and the performance of scheduling radio resources in C-V2X Mode 4. Furthermore, they have proposed adaptive transmit power control to achieve a higher quality of service in different traffic scenarios. Based on the predefined positions of vehicles in the network, the network-controlled resource management and frequency reuse distances of vehicles being active in Mode 3 could be improved as shown in [26]. The fuzzy logic-based algorithm and OpenFlow algorithm have been proposed in [27] as an SDN-based multi-access edge computing for the vehicular networks. In [28], the interference signals and quality of service in a highway scenario have been investigated by a system-level simulator. A distributed estimation mechanism to improve the scalability and robustness of vehicle connectivity under an RSU coverage area has been proposed in [29]. PRR and latency are the terms used in [30] to evaluate the proposed solution to maximize reuse distance scheduling for C-V2X Mode 3.
1.2. Paper Organization
The rest of this paper is organized as follows. Section 2 describes the background, assumptions, and problem formulation. The system model and proposed techniques are described in Section 3. The system settings and performance evaluation are described in Section 4. In Section 5, the simulation results are shown. Finally, Section 6 concludes the paper.
2. Assumptions and Problem Formulation
2.1. C-V2X Assumptions
As already mentioned, SC-FDMA has been applied as the C-V2X communication technique to support high mobility in vehicular communication. The radio resources in SC-FDMA are represented in the time and frequency domains. In the time domain, a sub-frame (two time slots, 0.5 ms each) is the smallest time unit, and a resource block (12 sub-carriers, with 15 kHz distance among them) is the smallest frequency unit to be applied. The resource blocks have been grouped to form sub-channels. The number of resource blocks in each sub-channel can vary according to the applied MCS and the amount of data that are needed to be transmitted. The number of sub-channels in each sub-frame is computed as follows:
where and are the total number of resource blocks in a given bandwidth and the number of resource blocks in each sub-channel, respectively. The number of remaining resource blocks in a given bandwidth that can be used later can be obtained as follows:
where is the number of sub-frames in a CAM cycle that can be obtained by dividing the CAM duration cycle by the sub-frame duration according to the following expression:
The total number of sub-channels in one cycle of a CAM message that can service vehicles in the awareness area of a vehicle can be computed as follows:
A fixed number of resource blocks used in each sub-channel and the same power applied by broadcasting vehicles are assumed in this paper according to [6] Furthermore, the inter-vehicle distance is kept fixed in each simulation. Similarly as in [23,24], the Poisson distribution is applied to model the arrival rate parameter , where is the vehicle’s density in a fixed highway length within a given period. The number of vehicles in the given period with the mean value has been defined as a random variable for a lane with vehicles moving at a fixed speed [6]. The average inter-vehicle distance can be obtained by the following expression:
where and are the absolute vehicle speed in km per hour in each lane and a scalar coefficient added by the authors to control inter-vehicle distance in the network, respectively. Moreover, the Poisson distribution parameter for the fixed highway length can be found as [31]:
A random number that changes according to the Poisson distribution with parameter determines the number of vehicles randomly distributed along the lane. In order to calculate the received power of the broadcast signal by a vehicle with the transmitted power denoted by , one can use the following formula:
where , , D, and are the receiver antenna gain, reference path loss at the distance of 1 m, the distance between the broadcaster and the receiver, and the path-loss exponent, respectively. It is worth mentioning that this work focuses on improving the selection and re-selection of radio resources with fixed transmission power and avoiding the strong influence of interference in broadcast areas. Distance D is usually smaller than the maximum broadcast range [32] that can be calculated from the formula:
where and are the minimum signal-to-interference plus noise ratio, and the noise power of a sub-channel, respectively. can be obtained with the following calculations:
- Coding Rate in C-V2X can be obtained as:where is the number of bits that are carried by resource blocks, is the number of OFDM symbols carrying (equal to 9 [33]), is the number of sub-carriers in each resource block (equal to 12 [11]), is the number of bits in each data symbol. and are found from Table 7.l.7.2.1-1 in [11]. It is important to mention that the number of resource blocks in [11] is given for one time slot.
- Spectrum efficiency [b/s/Hz] is the second step in calculation, according to the following formula:where is total number of OFDM symbols in a sub-frame (equal to 14 [33]), the sub-frame duration is denoted by (1 ms), and is the bandwidth of a resource block, namely 180 kHz.
- The minimum signal-to-interference plus noise ratio can be obtained by inverting the Shannon equation taking into account the implementation loss. Finally, can be found by the following formula:where is the loss in implementation and is assumed to be equal to 0.6 according to [34].
2.2. Problem Formulation
In C-V2X, several packet sizes can be applied. In this work, the same packet size, the same number of resource blocks in each sub-channel, and the same broadcast power are assumed to be applied by all vehicles. However, the analysis shown below can be extended on other resource configurations as well. The sub-channel index set for the given resource sub-channels is denoted as , whereas is the set of indices denoting RSUs in the network. Let i be the index of a vehicle located inside the coverage area of RSU x, and is the number of all vehicles located inside RSU x area where . Furthermore, j is the index for users using the same resource r in RSU y where and . represents all vehicles located in RSU y. Thus, the signal-to-interference plus noise ratio that is experienced by vehicle i belonging to RSU x can be represented as follows:
where and are the distances between the receiver and vehicle i and vehicle j, respectively. The desired signal is the one transmitted by vehicle i using resources r and the signals transmitted by vehicle j are the interference signals. This work aims to reduce the interference experienced at the receiver by increasing the frequency reuse distance. In consequence, will increase. For that purpose, the minimum allowed frequency reuse distance should be determined as the minimum acceptable distance between two vehicles using the same frequency. The worst case of can be calculated by assuming the receiver to be located on the edge of two maximum broadcasting ranges of vehicles along a horizontal line. In other words, distances and in Equation (12) are equal to the maximum broadcasting range . According to this assumption, can be obtained by rewriting Equation (12) as follows:
Another case of occurs when and . If a single interfering vehicle is assumed, then in Formula (13) summation in the denominator can be omitted and then from this simplified version of (13) the minimum allowed frequency reuse distance can be derived as:
Let be denoted as the interference on sub-channel r used by a vehicle located in the coverage area of RSU x, and thus, the objective function can be written as follows:
where A is a set of possible strategies of band partitioning between the RSUs, with a particular strategy a referring to a split, e.g., according to FFR, PFR, or full reuse (however, other strategies can be also considered). By applying the interference component of (12) in (15) the objective function can be rewritten as follows:
where (16a) are the constraints that are set to achieve the required quality of broadcasting with minimum frequency reuse distance . The constraint (16) can be more precisely formulated as
The above conditions ensure that only one vehicle can occupy a non-collided sub-channel at its CAM broadcasting range.
2.3. Broadcast Collision Zone
The overlapping coverage of two broadcast signals using the same resource allocation in different RSUs can cause packet collision for the receivers in this zone. The broadcast collision zone (BCZ) can arise when the frequency reuse distance between two broadcasters is lower than the minimum frequency reuse distance, i.e., . Furthermore, BCZ can be decreased when the h distance increases, or vice-versa when it decreases, as shown in Figure 2. As shown in this figure, the two broadcasting vehicles A and B are located in the coverage areas of different RSUs. Both vehicles are broadcasting CAMs with the same resource location in time and frequency domains. Thus, vehicle C is located in BCZ of the overlapped coverage area of vehicles A and B. This area can be expressed as follows:
where and are the coverage areas of transmitters A and B, respectively. The vehicles in BCZ (e.g., vehicle C in Figure 2) receive signals with the signal-to-interference plus noise ratio lower than due to interference. Thus, the area of BCZ depends on the values of and h and it can be calculated as [35]:
where can easily be expressed in terms of and through the Carnot theorem as below:
In this work, we focused on the distribution of resources among vehicles in the network to reduce or eliminate the BCZ of broadcasting vehicles, assuming the broadcasting power is fixed and the same for all vehicles.
3. Bandwidth Re-Partitioning Techniques among RSUs
Bandwidth re-partitioning techniques are necessary to reduce or eliminate BCZ. Such a reduction or elimination can be obtained by increasing the frequency reuse distance for each transmitter pair. Therefore, two techniques are proposed in this section based on fractional and soft frequency reuse methods [20] from centralized vehicular communication perspective: Full Frequency Reuse (FFR) and Partial Frequency Reuse (PFR). The cooperating RSUs have been assumed in a highway scenario to support resource allocation for vehicular communication, focusing on increasing the minimum frequency reuse distances and selection and re-selection of radio resources for high reliability broadcasting. We assumed that the cooperating RSUs are connected through the X2 interface using a fibre-optic backhaul network to exchange information related to the busy and free resources, making RSUs ready when new vehicles just enter or exit their coverage area. Each vehicle in the network broadcasts CAM messages to the surrounding vehicles via radio resources selected by RSU by using the SPS method with some proposed modifications. The CAMs are transmitted periodically in current sub-channels until the RC value reaches zero in the RSU and the vehicle. When RC equals 0, the RSU generates a new RC value in a specific range, depending on the used CAM interval. When a new vehicle has just entered a new RSU coverage area, the new RSU should be waiting until this vehicle’s RC reaches zero to be notified about the new re-selected resource. Moreover, when a vehicle broadcasts the last packet (RC reaches zero) at the time instant T, RSU must know in advance when RC would reach zero and must prepare the new resources for broadcasting and generate the new RC value. At , the RSU needs to send one message that contains the new address of the resource and the new RC value that will be decremented by one in both the RSU and vehicle in each broadcast.
It is worth mentioning that the remaining resource blocks given in Equation (2) are assumed to facilitate the vehicles’ necessary signalling to RSUs. These signals are used to exchange control information when a vehicle enters a new RSU coverage area and in emergent situations.
3.1. Full Frequency Reuse Technique (FFR)
The FFR technique protects the packets broadcast in the network from interference signals. Each RSU deployed along the highway partially utilizes a given frequency band. In other words, the given band is divided into two sub-bands dedicated to vehicles located in the two adjacent RSU coverage areas. Each sub-band is applied again by the RSU, which is adjacent to the RSU neighboring to the current one. In this technique, the distance between the two nearest RSUs using the same sub-band is equal to the diameter of the coverage area of the center RSU.
The will be lower than h (see Figure 2) if the is higher than the broadcasting range of the vehicles. Otherwise, if two vehicles are using the same frequency resource and are located on the edge of their RSU coverage (i.e., RSUs X and Z in Figure 2) adjacent to their common RSU (i.e., RSU Y), BCZ will be observed in the middle of the RSU Y coverage area. The vehicles in this area will not be able to decode the packets from both transmitters A and B. The failure to increase the RSU coverage area is the limitation of resources in each for the number of vehicles. Decreasing the number of vehicles in an RSU area is disadvantageous and unacceptable. Therefore, to eliminate this possibility, the PFR technique has been proposed to solve this drawback.
3.2. Partial Frequency Reuse Technique (PFR)
In the PFR technique, a given band is partitioned between two adjacent RSUs (see Figure 3b) with each part denoted as . Further, the is re-partitioned into two adjacent bands, named the Center (inner) Frequency Band (CFB) with the maximum distance from RSU to vehicles equal to to serve Center Users (CUs), and the Edge (outer) Frequency Band (EFB) with the maximum distance from RSU to vehicles equal to to serve Edge Users (EUs) located in the distance between and . Let us call the RSUs that use the same twin-RSUs. The distribution and usage of these bands can be illustrated by the example in Figure 3. The CFB of an RSU is the EFB for the nearest twin-RSUs using the same and vice versa. The next resource location will be a free resource in the current and nearest twin-RSUs. For example, if we assume vehicle A (in Figure 3a) to be a central user in RSU X that needs a new resource to allocate, the RSU denoted by X will compare the resource grid of its CUs with the resource grid of edge users in the RSU denoted by Z (a twin-RSU with X) to identify unused resources in both RSUs in order to avoid high interference. Moreover, if the unused resources in both RSUs cannot be found, then the next allocated resource will be a free one in the CU resource grid of RSU X.
In this technique, the is undoubtedly increased. In the current case, the is calculated as follows:
As a result of increasing the distance between zones using the same resources, the signal-to-interference plus noise ratio is increased compared with the FFR technique.
As mentioned before, the radio resource partitioning in RSU has been divided into two sub-bands denoted as as follows:
where is the given system bandwidth.
Let us assume that resource partitioning between CUs and EUs in an RSU is proportional to the ratio of the inner radius and the RSU radius . Thus, the is divided into two sub-bands: CFB to be allocated to CUs, and the band adjacent to EFB reserved for EUs. The sub-bands received due to bandwidth re-partitioning are given by the formulas:
The main achievement of this method is that the is increased compared with the FFR technique. Consequently, the probability of existence of BCZ is decreased as compared with the FFR technique.
4. System Model and Settings
A system-level simulator has been developed by the authors in this work using the Matlab platform to run, test, and compare the system performance of FFR, PFR with centralized resource allocation of C-V2X, and the system with a conventional single band (SB) operation. Similar simulators were applied in the investigations reported in [23,24]. The bandwidth has been divided in the frequency domain between RSUs with the FFR technique and further between inner and outer vehicles as assumed in the PFR technique. The Poisson distribution has been proposed (see Equations (5) and (6)) to distribute the vehicles along the highway with three lanes in each direction, different vehicle speeds, and distances in each lane according to [6]. The total number of sub-channels in is given by Equation (4).
A 100 ms interval with the RC range [5, 15] is proposed as the simulation time step (CAM interval) and RC range according to standard [36], which is proposed for Mode 4 as the maximum allowed latency. Each vehicle in the network receives packets from all vehicles before specifying which of them are located inside its coverage area. Each vehicle transmits its packet to all vehicles. In other words, all vehicles transmit/receive packets to/from all vehicles in each CAM interval (i.e., if the number of vehicles is equal to 150 and the simulation step is equal to 100 ms, each vehicle will test 150 packets from all vehicles in the network in each simulation step). The vehicles’ positions are updated according to their direction and speed in each simulation time step. is obtained by Equation (11). Each technique has been tested with different vehicle densities in the network (determined by the varying scalar factor) to investigate the impact of the vehicles’ number on the performance of the called techniques. Each simulation run is equivalent to a 5-s time interval to test the packet reception ratio for all vehicles, minimum frequency reuse distance, average frequency reuse distance, and interference impact in the network in every period. Five connected RSUs have been placed within an equal distance of each other to cover five kilometers along the highway. The main parameters of simulations for both FFR and PFR are the same and described in Table 1. The WINNER+B1 model has been assumed as a propagation model [37]. To show the gains obtained thanks to the both bandwidth partitioning methods, we compare their performance with the system applying the conventional single band (SB) transmission.
System Performance
Simulations were executed for different vehicle densities. This comparison was made with the following metrics:
- Packet Reception Ratio (): The ratio of the number of successfully received packets to the total number of broadcast packets in a CAM message interval. Additional PRR values have been calculated as a reference PRR without interference impact for all vehicles with different vehicle densities and they have been denoted by . The purpose of is to analyze the performance with and without interference effects.
- Difference of Packet Reception Ratio (): The difference between the PFR and FFR packet reception ratios for each vehicle density.
- Minimum Frequency Reuse Distance : The smallest distance between two broadcasters using the same resources in coverage of different RSUs. can be described as follows:where is a vector of all frequency reused distances expressed in meters.
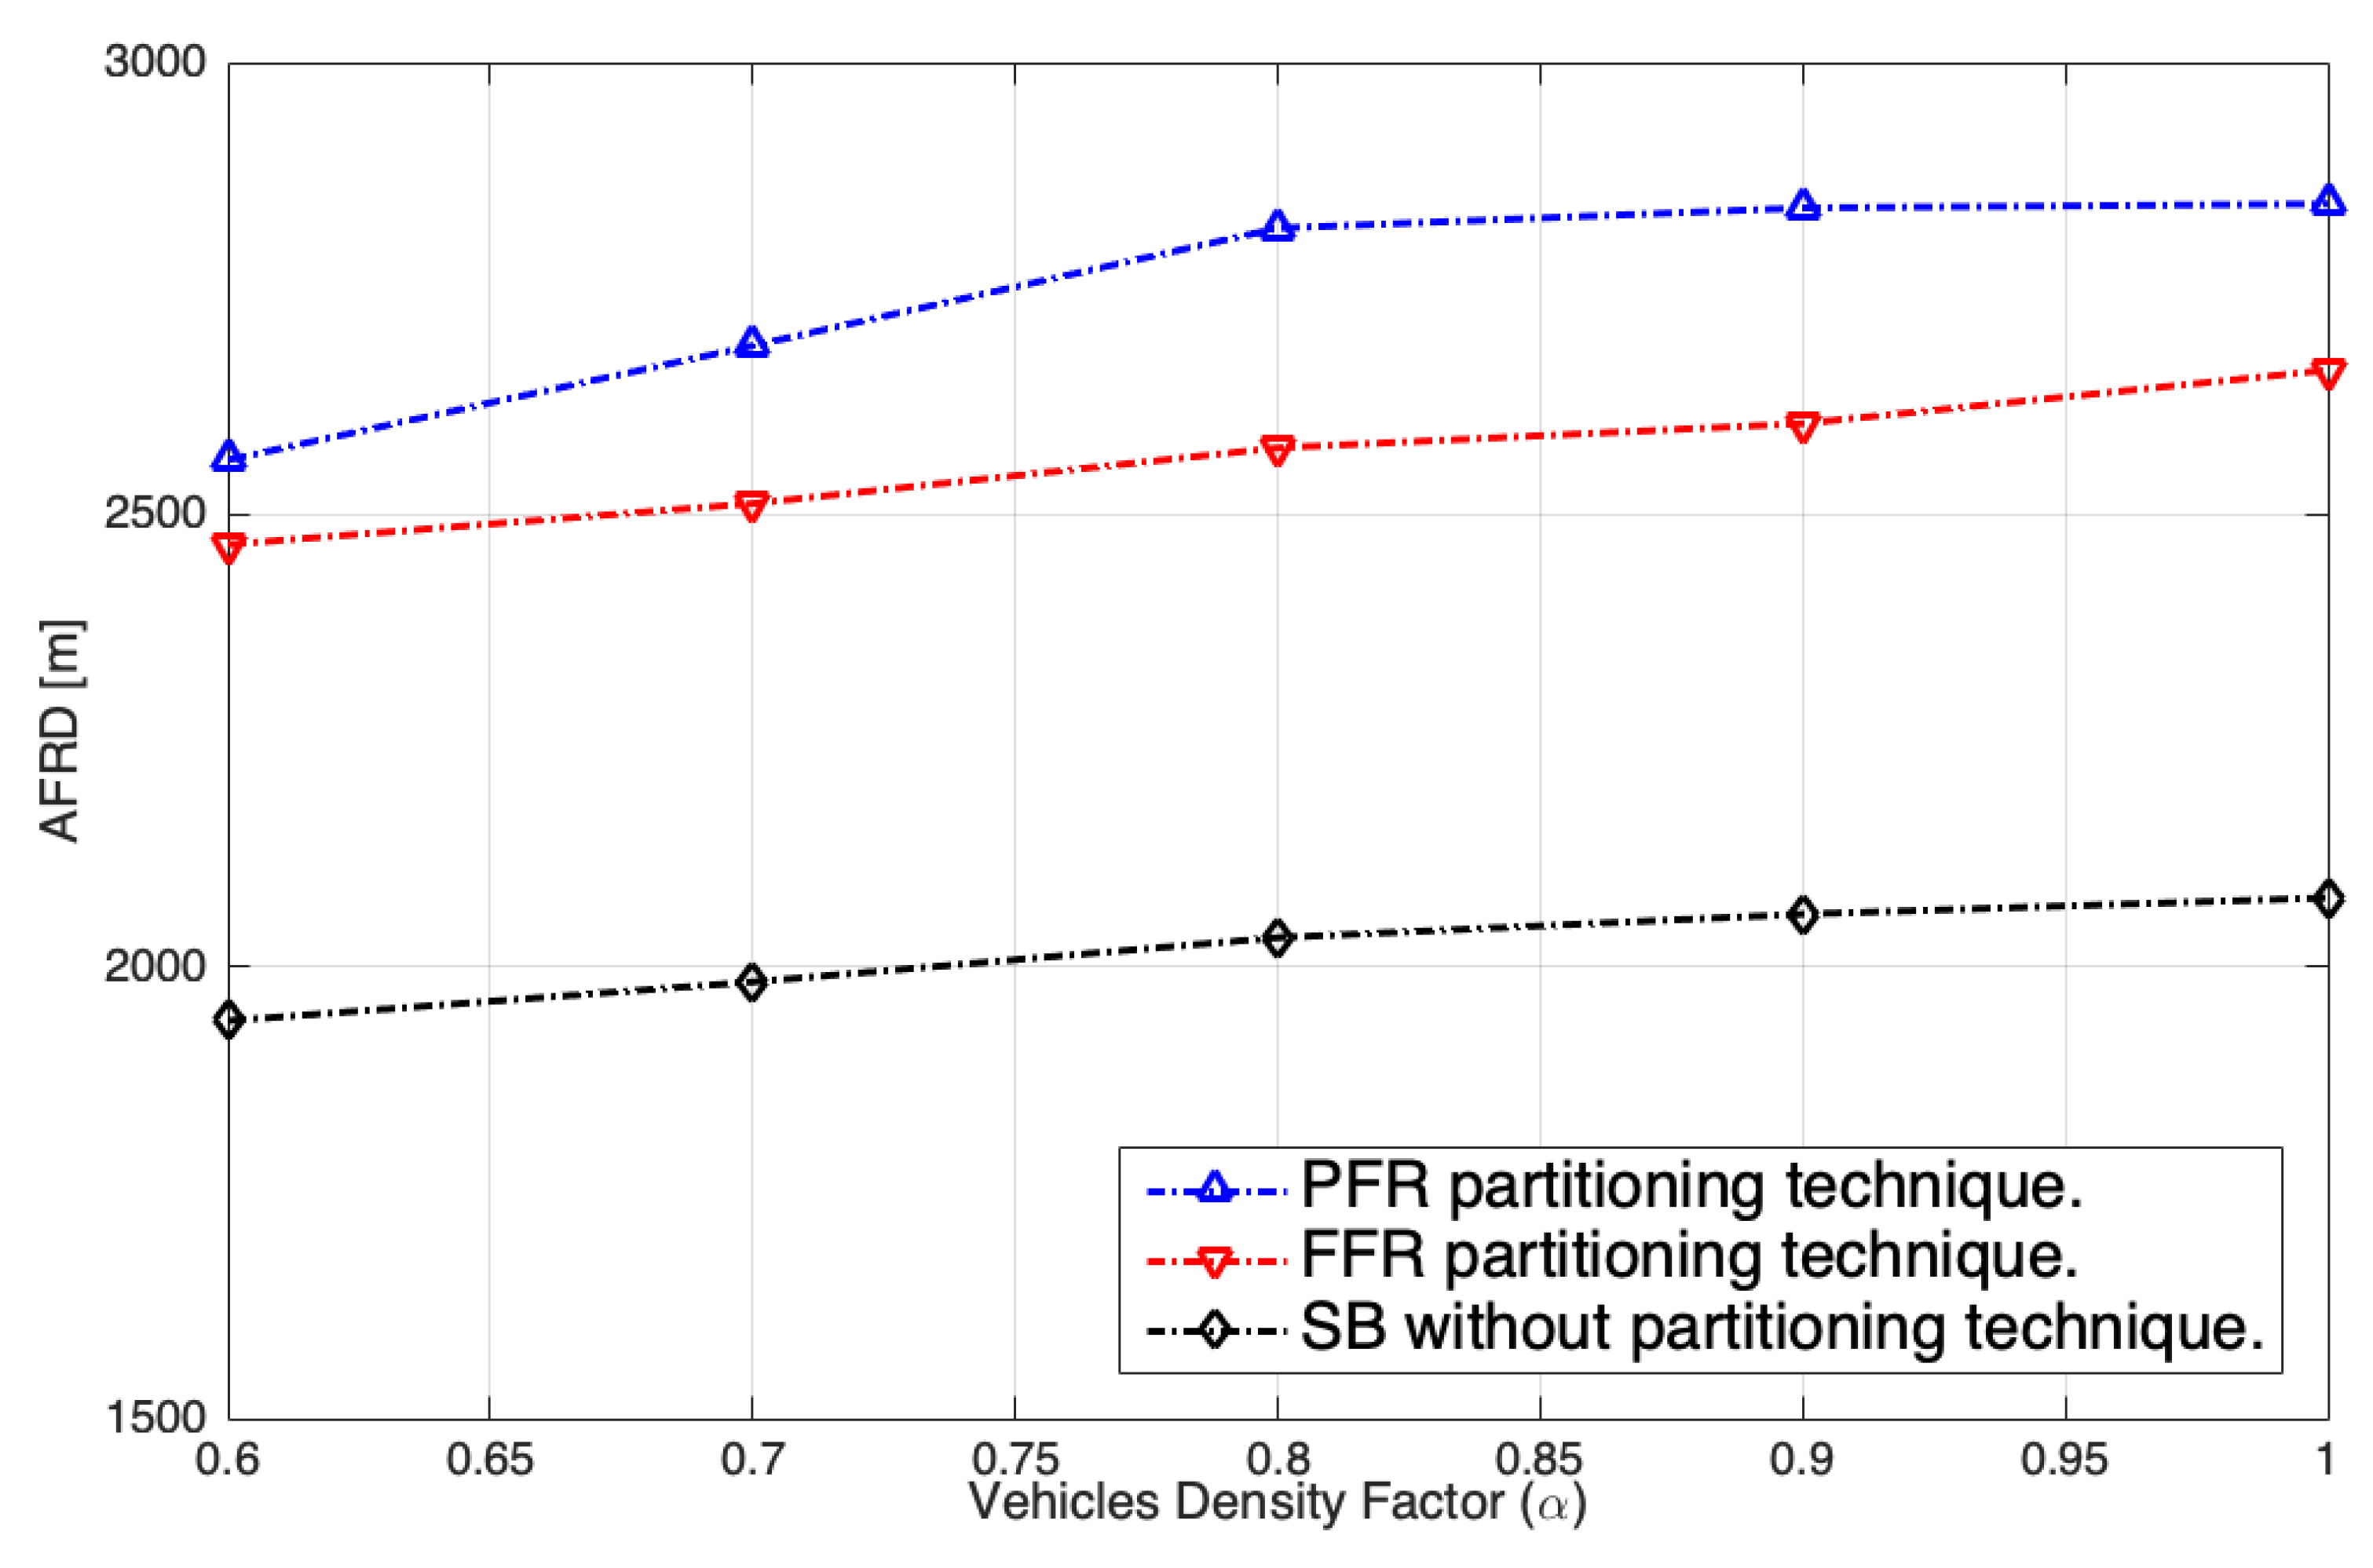
- Average Frequency Reuse Distance (AFRD): The average of all frequency reused distances applied for a specific scalar factor determining the number of vehicles in the modeled network. has been calculated by gathering all reused frequency distances throughout the simulation time for each vehicle density, and then dividing them by their number. The following formula expresses :
- The percentage of vehicles located inside BCZ areas to the total number of vehicles in the network is the percentage of the total number of receivers receiving two or more non-decodable packets from transmitters using the same resource allocation to the number of all broadcast packets . can be calculated as follows:Because in the PFR technique the distance h between two frequency reused bands is larger than , is equal to zero. Furthermore, in the FFR technique, some of the frequency reuse distances are lower than , creating BCZ. Table 2 shows the percentage of vehicles that are located inside the BCZ zone with the FFR technique whereras Table 3 shows the percentage of vehicles located inside the BCZ zone when the standard SB technique is applied.
- Interference Ratio (): The interference impact on the system has been defined as the difference between PRR system performance without interference effects (defined as the reference values ) and the observed PRR with interference impact.
5. Simulation Results
The system performance in terms of interference ratio IR and packet reception ratio PRR for the FFR technique for different vehicle densities are shown in Figure 4a and Figure 5, respectively. The reference curve in Figure 5 (and Figure 6) indicates the PRR for a system without interference effects—. We observe excellent performance with more than 95% of the packets delivered correctly for vehicles in the distance ranging from 100 to 300 m and good performance for those vehicles which are within 300 to 400 m range between the broadcasters and the receivers. Such a distance usually corresponds to the transmission carried out in the inner part of the RSU coverage area, so the impact of interference or collisions in BCZ is minimal, as it is also shown in Figure 4a.
According to the FFR technique, the repetition of has been defined for the distance equal to the doubled radius of the RSU coverage area (effectively specifying the frequency reuse factor of 2). Despite the excellent performance at low distances, when the spacing between the transmitter and the receiver increases above 400 m, the probability that BCZ appears is high when two or more vehicles are using the same resources, and the distances between them are smaller than the minimum allowed frequency reuse distance . We observed a fast degradation in PRR, with unacceptable values of around 65–73%, and fast slope in IR between 18% and 27% for all vehicles’ densities and for the distance of 600 m.
With the PFR technique, the possibility of a receiver being in the BCZ zone, which is a common case with FFR, does not exist, because the re-partitioning band distance is higher than . Furthermore, the interfering devices are located at a greater distance compared with the FFR technique. Thus, for the PRR of PFR, and IR shown in Figure 4b and Figure 6, we observed higher performance and lower interference impact with inter-vehicle distances below 400 m for all vehicles densities. Moreover, PRR and IR observed at 600 m vary between 72% and 89%, and between 3% and 18%, respectively. Hence, an improvement can be observed compared to the FFR case, especially with the lower number of served vehicles.
The gains resulting from using frequency-domain partitioning are clearly highlighted when we compare the PRR obtained with FFR and PFR, shown in Figure 5 and Figure 6, with the outcomes of the system performance evaluation with SB operation without any resources split, presented in Figure 7. One can clearly note that the successful reception ratio increases with partitioning, compared to the SB case, at the distance of 400 m is about 15%. Moreover, for the short-distance links we observe the successful reception probability of almost 1 with frequency partitioning, while for the SB configuration the impact of interference, presented in Figure 4c, significantly affects the transmission success rate.
In Figure 8, the differential PRR (D-PRR = PRR PRR) values obtained comparing PFR with FFR techniques are visualized, to show the difference between them for the considered vehicle densities. The results show almost the same system performance for all vehicle densities (D-PRR is equal or close to zero) when the distance between the transmitters and the receiver is about 100 to 300 m. Furthermore, the performance of PFR starts to be higher than for FFR D-PRRs by around 1% when the distance between the transmitter and the receiver is around 400 m for vehicle densities and . A fast increase is observed in PFR over FFR (rising D-PRR) with all vehicle densities when the distance is around 500 to 600 m.
MFRD has been obtained for two vehicles using the same frequency resources that were located within the smallest distance of each other. The MFRD relationship vs. the vehicle density factor, presented in Figure 9, shows a perfectly rational result, with the minimum frequency reuse distance being higher than the relevant (that equals 1200 m) for the PFR technique. With the FFR technique applied, the observed minimum frequency reuse distance is in all cases shorter than the specified , with the biggest difference observed especially when the number of vehicles in the network is high. One can also note the much lower MFRD level when SB without frequency-domain partitioning is considered. According to the above observation, one can conclude that BCZs appear in the networks without partitioning or when the FFR technique is applied. Furthermore, the percentages of vehicles (referenced to the total number of vehicles) that are located in BCZs are given in Table 2 for FFR and Table 3 for SB, with respect to different vehicle densities.
is calculated by averaging the distances between all vehicles that are using the same frequency resources in the nearest . vs. the vehicle density factor, presented in Figure 10, shows a significant enhancement of the average frequency reuse distance for PFR compared with FFR, especially when the number of vehicles in the network is high. The impact of increasing has a positive effect on the PRR (see Figure 6) due to the increase in the observed signal-to-interference plus noise ratio, and thus, higher probability of correct reception of broadcast packets.
In conclusion, the proposed frequency-domain partitioning of resources based on the geographical location of vehicles provides significant improvement in terms of reduced interference. Thus, it positively improves the likelihood of successful delivery of CAM packets broadcast to the neighbouring vehicles. Both proposed techniques yield significant gains compared with the conventional single-band configuration, where all vehicles share the same resources without any interference mitigation applied.
The main purpose of the FFR and PFR techniques is to mitigate the impact of interference for C-V2X communications with support of dedicated infrastructure, such as the RSUs. While the proposed techniques are unable to fully mitigate the impact of interference, which is possible with centralized resource allocation in Mode 3, they can be utilized to employ autonomous resource allocation of the RC features (Mode 4 operation) to reduce the need to control signalling between the RSUs and the vehicles. With the geographical areas specified based on RSUs coverage, especially in the case of PFR where the inner and outer zones are considered, communicating cars can use different resource pools with the aim to reduce the impact of interference. Such an approach allows for reducing the need for control signalling compared to Mode 3 operation, while maintaining a significantly higher likelihood of successful reception than the standard Mode 4 operation in dense traffic scenarios. Certainly, the effectiveness of these methods is dependent on the location estimation accuracy of vehicles, as significant errors (that are possible, e.g., with low-quality GPS receivers) may result in wrong association with a geographical area.
6. Conclusions
In this work, we have investigated the 3GPP C-V2X Mode 3 communications, employing the bandwidth partitioning in order to reduce the number of packet collisions in broadcast transmission. In order to reduce the need for signalling between the vehicles and RSUs, we have considered the use of Re-selection Counter to perform the resource allocation in infrastructure nodes. With the investigated scheme, the RSU can send the resource allocation grant without the need to receive a request from a vehicle, thus resulting in the decrease in signalling.
Two novel applications of bandwidth partitioning techniques have been suggested, namely, Full Frequency Reuse, and Partial Frequency Reuse with the aim to reduce the interference from simultaneously broadcasting vehicles. If the vehicles’ broadcast areas overlap, the use of bandwidth partitioning reduces the likelihood of using the same resources by these vehicles, which should avoid packet collisions experienced by some receivers. Moreover, a Broadcast Collision Zone has been formulated, which can arise when the frequency reuse distance is lower than the minimum required distance. Both techniques have been evaluated in system-level simulations for different densities of vehicles in terms of the Packet Reception Ratio, Minimum Frequency Reuse Distance, and Average Frequency Reuse Distance. The simulation results show promising performance for PFR, compared with FFR. It has turned out that the re-partitioning of the frequency band into two sub-bands for central and edge users performs better than a fixed split of the available band into two non-overlapping sub-bands for neighbouring RSUs. It is worth mentioning that both proposed band partitioning methods perform better than when no band partitioning is applied.
Author Contributions
Individual contributions of the authors to the paper are the following: conceptualization, S.S.; methodology, S.S. and K.W.; software, S.S.; validation, S.S., P.S. and K.W.; formal analysis, S.S., K.W. and P.S.; investigation, S.S.; writing—original draft preparation, S.S. and K.W.; writing—review and editing, S.S., K.W. and P.S.; visualization, S.S.; supervision, K.W.; project administration, K.W.; funding acquisition, K.W. All authors have read and agreed to the published version of the manuscript.
Funding
This work was funded by the Poznan University of Technology, grant number 0312/SBAD/ 8153.
Conflicts of Interest
The authors declare no conflict of interest.
Abbreviations
Notation used in mathematical derivations:
| Number of sub-channels in a sub-frame | |
| Total number of resource blocks in the given bandwidth | |
| Number of resource blocks in a sub-channel | |
| Number of remaining resource blocks | |
| Total number of sub-frames in a CAM interval | |
| CAM duration cycle | |
| Sub-frame duration | |
| Total number of sub-channels in a CAM interval | |
| Average inter-vehicle distance | |
| Absolute vehicle speed in kmph | |
| Scalar coefficient factor | |
| Poisson distribution parameter | |
| Coding rate | |
| Total number of data bits that need to be transmitted | |
| Number of RBs in a sub-channel | |
| Number of effective OFDM symbols carrying data in a sub-frame | |
| Number of sub-carriers in RB | |
| Number of bits per symbol | |
| Spectrum efficiency [b/s/Hz] | |
| Total number of OFDM symbols in a sub-frame | |
| Sub-frame duration | |
| Bandwidth of a resource block | |
| Minimum signal-to-interference plus noise ratio | |
| Actual signal-to-interference plus noise ratio | |
| Spectral efficiency loss in implementation | |
| Minimum frequency reuse distance | |
| Broadcasting collision zone | |
| Area of the broadcasting collision zone | |
| Angle of to the coverage area center. | |
| Distance between two coverage areas using the same sub-band | |
| Diameter of RSU coverage area | |
| Sub-band that is using by a RSU | |
| Center frequency band | |
| Edge frequency band |
References
- Chen, S.; Hu, J.; Shi, Y.; Peng, Y.; Fang, J.; Zhao, R.; Zhao, L. Vehicle-to-Everything (V2X) Services Supported by LTE-Based Systems and 5G. IEEE Comm. Stand. Mag. 2017, 1, 70–76. [Google Scholar] [CrossRef]
- 3GPP, TS 36.300. Evolved Universal Terrestrial Radio Access (EUTRA) and Evolved Universal Terrestrial Radio Access Network (EUTRAN); Overall Description; Stage 2. Rel-14, V14.0.0, 3GPP, Technical Specification; Sophia Antipolis: Nice, France, 2016. [Google Scholar]
- Lyamin, N.; Vinel, A.; Jonsson, M.; Bellalta, B. Cooperative Awareness in VANETs: On ETSI EN 302 637-2 Performance. IEEE Trans. Veh. Technol. 2018, 67, 17–28. [Google Scholar] [CrossRef]
- ETSI, TR 102.638 V1.1.1. Intelligent Transport Systems (ITS); Vehicular Communications; Basic Set of Applications; Definitions; ETSI, Technical Report; Sophia Antipolis: Nice, France, 2009. [Google Scholar]
- He, J.; Tang, Z.; Fan, Z. Zhang, J. Enhanced Collision Avoidance for Distributed LTE Vehicle to Vehicle Broadcast Communications. IEEE Commun. Lett. 2018, 22, 630–633. [Google Scholar] [CrossRef] [Green Version]
- 3GPP, TR 36.885. Study on LTE-Based V2X Services (v14.0.0, Release 14); 3GPP, Technical Report; Sophia Antipolis: Nice, France, 2016. [Google Scholar]
- ETSI, EN 302 637-2 V1.3.2. Intelligent Transport Systems (ITS); Vehicular Communications; Basic Set of Applications; Part 2: Specification of Cooperative Awareness Basic Service; ETSI, Technical Specification; Sophia Antipolis: Nice, France, 2014. [Google Scholar]
- 3GPP, TS 36.321. Evolved Universal Terrestrial Radio Access (EUTRA); Medium Access Control (MAC) Protocol Specification (v14.8.0, Release 14); 3GPP, Technical Specification; Sophia Antipolis: Nice, France, 2018. [Google Scholar]
- Abanto-Leon, L.F.; Koppelaar, A.; de Groot, S.H. Enhanced C-V2X Mode-4 Subchannel Selection. In Proceedings of the 2018 IEEE 88th Vehicular Technology Conference (VTC-Fall), Chicago, IL, USA, 27–30 August 2018; pp. 1–5. [Google Scholar]
- 3GPP, TS 36.331. Evolved Universal Terrestrial Radio Access (EUTRA); Radio Resource Control (RRC); Protocol Specification (v14.8.0, Release 14); 3GPP, Technical Specification; Sophia Antipolis: Nice, France, 2018. [Google Scholar]
- 3GPP, TS 36.213. Evolved Universal Terrestrial Radio Access (EUTRA); Physical Layer Procedures (v14.8.0, Release 14). 3GPP, Technical Specification; Sophia Antipolis: Nice, France, 2018. [Google Scholar]
- 3GPP, Initial Cellular V2X Standard Completed. Available online: http://www.3gpp.org/news-events/3gpp-news/1798-v2xr14 (accessed on 1 September 2018).
- Molina-Masegosa, R.; Gozalvez, J. LTE-V for sidelink 5G V2X vehicular communications: A new 5G technology for short-range vehicle-to-everything communications. IEEE Veh. Technol. Mag. 2017, 12, 30–39. [Google Scholar] [CrossRef]
- Nabil, A.; Kaur, K.; Dietrich, C.; Marojevic, V. Performance Analysis of Sensing-Based Semi-Persistent Scheduling in C-V2X Networks. In Proceedings of the 2018 IEEE 88th Vehicular Technology Conference (VTC-Fall), Chicago, IL, USA, 27–30 August 2018; pp. 1–5. [Google Scholar]
- Jeon, Y.; Kuk, S.; Kim, H. Reducing Message Collisions in Sensing-based Semi-persistent Scheduling (SPS) by Using Reselection Lookaheads in Cellular V2X. Sensors 2018, 18, 4388. [Google Scholar] [CrossRef] [PubMed] [Green Version]
- Gonzalez-Martín, M.; Sepulcre, M.; Molina-Masegosa, R.; Gozalvez, J. Analytical Models of the Performance of C-V2X Mode 4 Vehicular Communications. IEEE Trans. Veh. Technol. 2019, 68, 1155–1166. [Google Scholar] [CrossRef] [Green Version]
- Aslani, R.; Saberinia, E.; Rasti, M. Resource Allocation for Cellular V2X Networks Mode-3 with Underlay Approach in LTE-V Standard. IEEE Trans. Veh. Technol. 2020, 69, 8601–8612. [Google Scholar] [CrossRef]
- Masini, B.M.; Bazzi, A.; Zanella, A. A Survey on the Roadmap to Mandate on Board Connectivity and Enable V2V-based Vehicular Sensor Networks. Sensors 2018, 18, 2207. [Google Scholar] [CrossRef] [PubMed] [Green Version]
- 3GPP, TS 22.186. Service Requirements for Enhanced V2X Scenarios (v16.2.0, Release 16); 3GPP, Technical Specification; Sophia Antipolis: Nice, France, 2019. [Google Scholar]
- Doppler, K.; Wijting, C.; Valkealahti, K. Interference aware scheduling for soft frequency reuse. In Proceedings of the VTC Spring 2009—IEEE 69th Vehicular Technology Conference, Barcelona, Spain, 26–29 April 2009; pp. 1–5. [Google Scholar]
- Bazzi, A.; Zanella, A.; Masini, B.M. Optimizing the Resource Allocation of Periodic Messages with Different Sizes in LTE-V2V. IEEE Access 2019, 7, 43820–43830. [Google Scholar] [CrossRef]
- Sabeeh, S.; Sroka, P.; Wesołowski, K. Estimation and Reservation for Autonomous Resource Selection in C-V2X Mode 4. In Proceedings of the IEEE 30th Annual International Symposium on Personal, Indoor and Mobile Radio Communications (PIMRC), Istanbul, Turkey, 8–11 September 2019; pp. 1–6. [Google Scholar]
- Sabeeh, S.; Wesołowski, K. C-V2X Mode 4 Resource Allocation in High Mobility Vehicle Communication. In Proceedings of the IEEE 31st Annual International Symposium on Personal, Indoor and Mobile Radio Communications (PIMRC), London, UK, 31 August–3 September 2020; pp. 1–6. [Google Scholar]
- Sabeeh, S.; Wesołowski, K. Resource Re-Selection with Adaptive Modulation and Collision Detection in LTE V2X Mode 4. In Proceedings of the IEEE 32st Annual International Symposium on Personal, Indoor and Mobile Radio Communications (PIMRC), Helsinki, Finland, 13–16 September 2021; pp. 1–6. [Google Scholar]
- Haider, A.; Hwang, S.H. Adaptive transmit power control algorithm for sensing-based semi-persistent scheduling in C-V2X mode 4 communication. Electronics 2019, 8, 846. [Google Scholar] [CrossRef] [Green Version]
- Cecchini, G.; Bazzi, A.; Masini, B.M.; Zanella, A. Localization-based Resource Selection Schemes for Network-controlled LTE-V2V. In Proceedings of the 2017 International Symposium on Wireless Communication Systems (ISWCS), Bologna, Italy, 28–31 August 2017; pp. 396–401. [Google Scholar]
- Nkenyereye, L.; Islam, S.R.; Kerrache, C.A.; Abdullah-Al-Wadud, M.; Alamri, A. Software defined network-based multi-access edge framework for vehicular networks. IEEE Access 2019, 8, 4220–4234. [Google Scholar] [CrossRef]
- Wang, D.; Sattiraju, R.R.; Weinand, A.; Schotten, H.D. System-level Simulator of LTE Sidelink C-V2X Communication for 5G. In Proceedings of the 24. ITG-Symposium on Mobile Communication-Technologies and Applications, Osnabrueck, Germany, 15–16 May 2019; pp. 1–5. [Google Scholar]
- Yuan, W.; Li, S.; Xiang, L.; Ng, D.W.K. Distributed Estimation Framework for beyond 5G Intelligent Vehicular Networks. IEEE Open J. Veh. Technol. 2020, 1, 190–214. [Google Scholar] [CrossRef]
- Cecchini, G.; Bazzi, A.; Menarini, M.; Masini, B.M.; Zanella, A. Maximum Reuse Distance Scheduling for Cellular-V2X Sidelink Mode 3. In Proceedings of the 2018 IEEE Globecom Workshops, Abu Dhabi, United Arab Emirates, 9–13 December 2018; pp. 1–6. [Google Scholar]
- Gerlough, D.L.; Schuhl, A. Use of Poisson Distribution in Highway Traffic. The Probability Theory Applied to Distribution of Vehicles on Two-Lane Highways; The Eno Foundationfor Highway Traffic Control, Inc. Columbia University Press: New York, NY, USA, 1955; Reprint 2018. [Google Scholar]
- Bazzi, A.; Masini, B.M.; Zanella, A.; Thibault, I. On the Performance of IEEE 802.11p and LTE-V2V for the Cooperative Awareness of Connected Vehicles. IEEE Trans. Veh. Technol. 2017, 66, 10419–10432. [Google Scholar] [CrossRef]
- 3GPP, TS 36.211. Evolved Universal Terrestrial Radio Access (E-UTRA); Physical Channels and Modulation. Rel-14 V14.4.0, 3GPP, Technical Specification; Sophia Antipolis: Nice, France, 2017. [Google Scholar]
- 3GPP, TR 36.942. Evolved Universal Terrestrial Radio Access (E-UTRA); Radio Frequency (RF) System Scenarios. V14.0.0, 3GPP, Technical Report; Sophia Antipolis: Nice, France, 2017. [Google Scholar]
- Salbaroli, E.; Zanella, A. Interference Analysis in a Poisson Field of Nodes of Finite Area. IEEE Trans. Veh. Technol. 2008, 58, 1776–1783. [Google Scholar] [CrossRef]
- Garcia, M.H.C.; Molina-Galan, A.; Boban, M.; Gozalvez, J.; Coll-Perales, B.; Sahin, T.; Kousaridas, A. A Tutorial on 5G NR V2X Communications. IEEE Commun. Surv. Tutor. 2021, 23, 1972–2026. [Google Scholar] [CrossRef]
- Kyosti, P. IST-4-027756 WINNER II, Deliverable D1.1.2 V1.2. WINNER II Channel Models; Technical Report. 2007. Available online: http://signserv.signal.uu.se/Publications/WINNER/WIN2D112.pdf (accessed on 1 September 2018).
Figure 1.
C-V2X resource grid description in time and frequency domains.

Figure 2.
of two vehicles located in different RSUs coverage area.
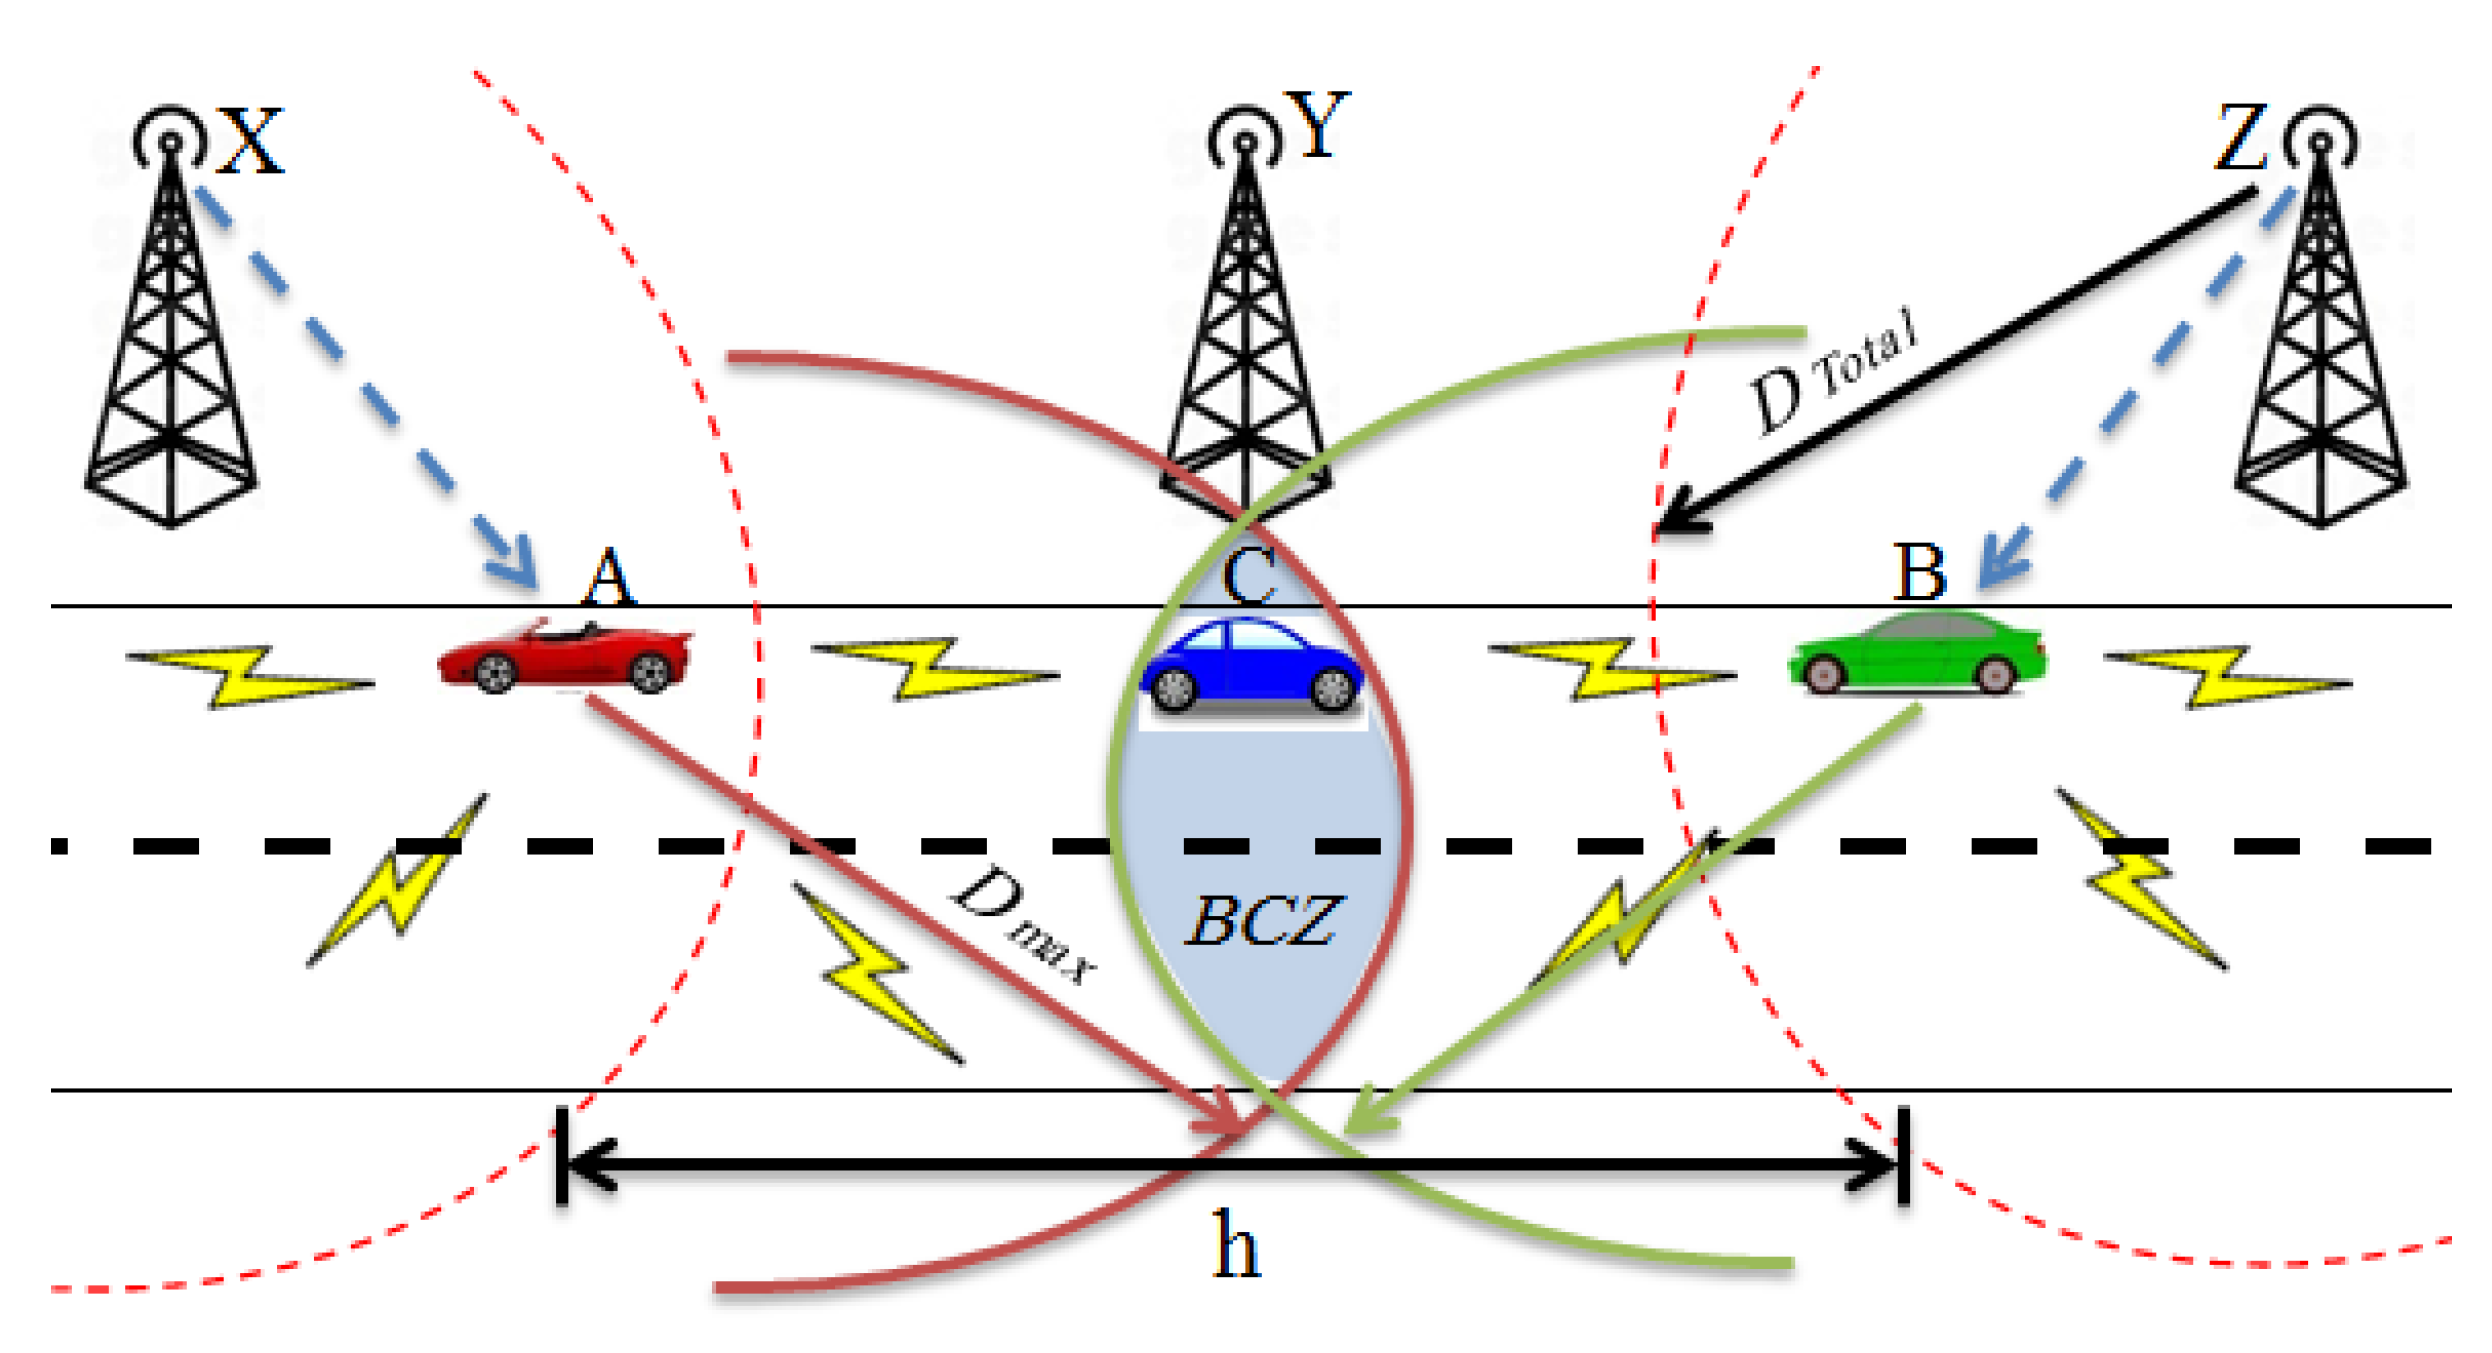
Figure 3.
Example of PFR for three RSUs.
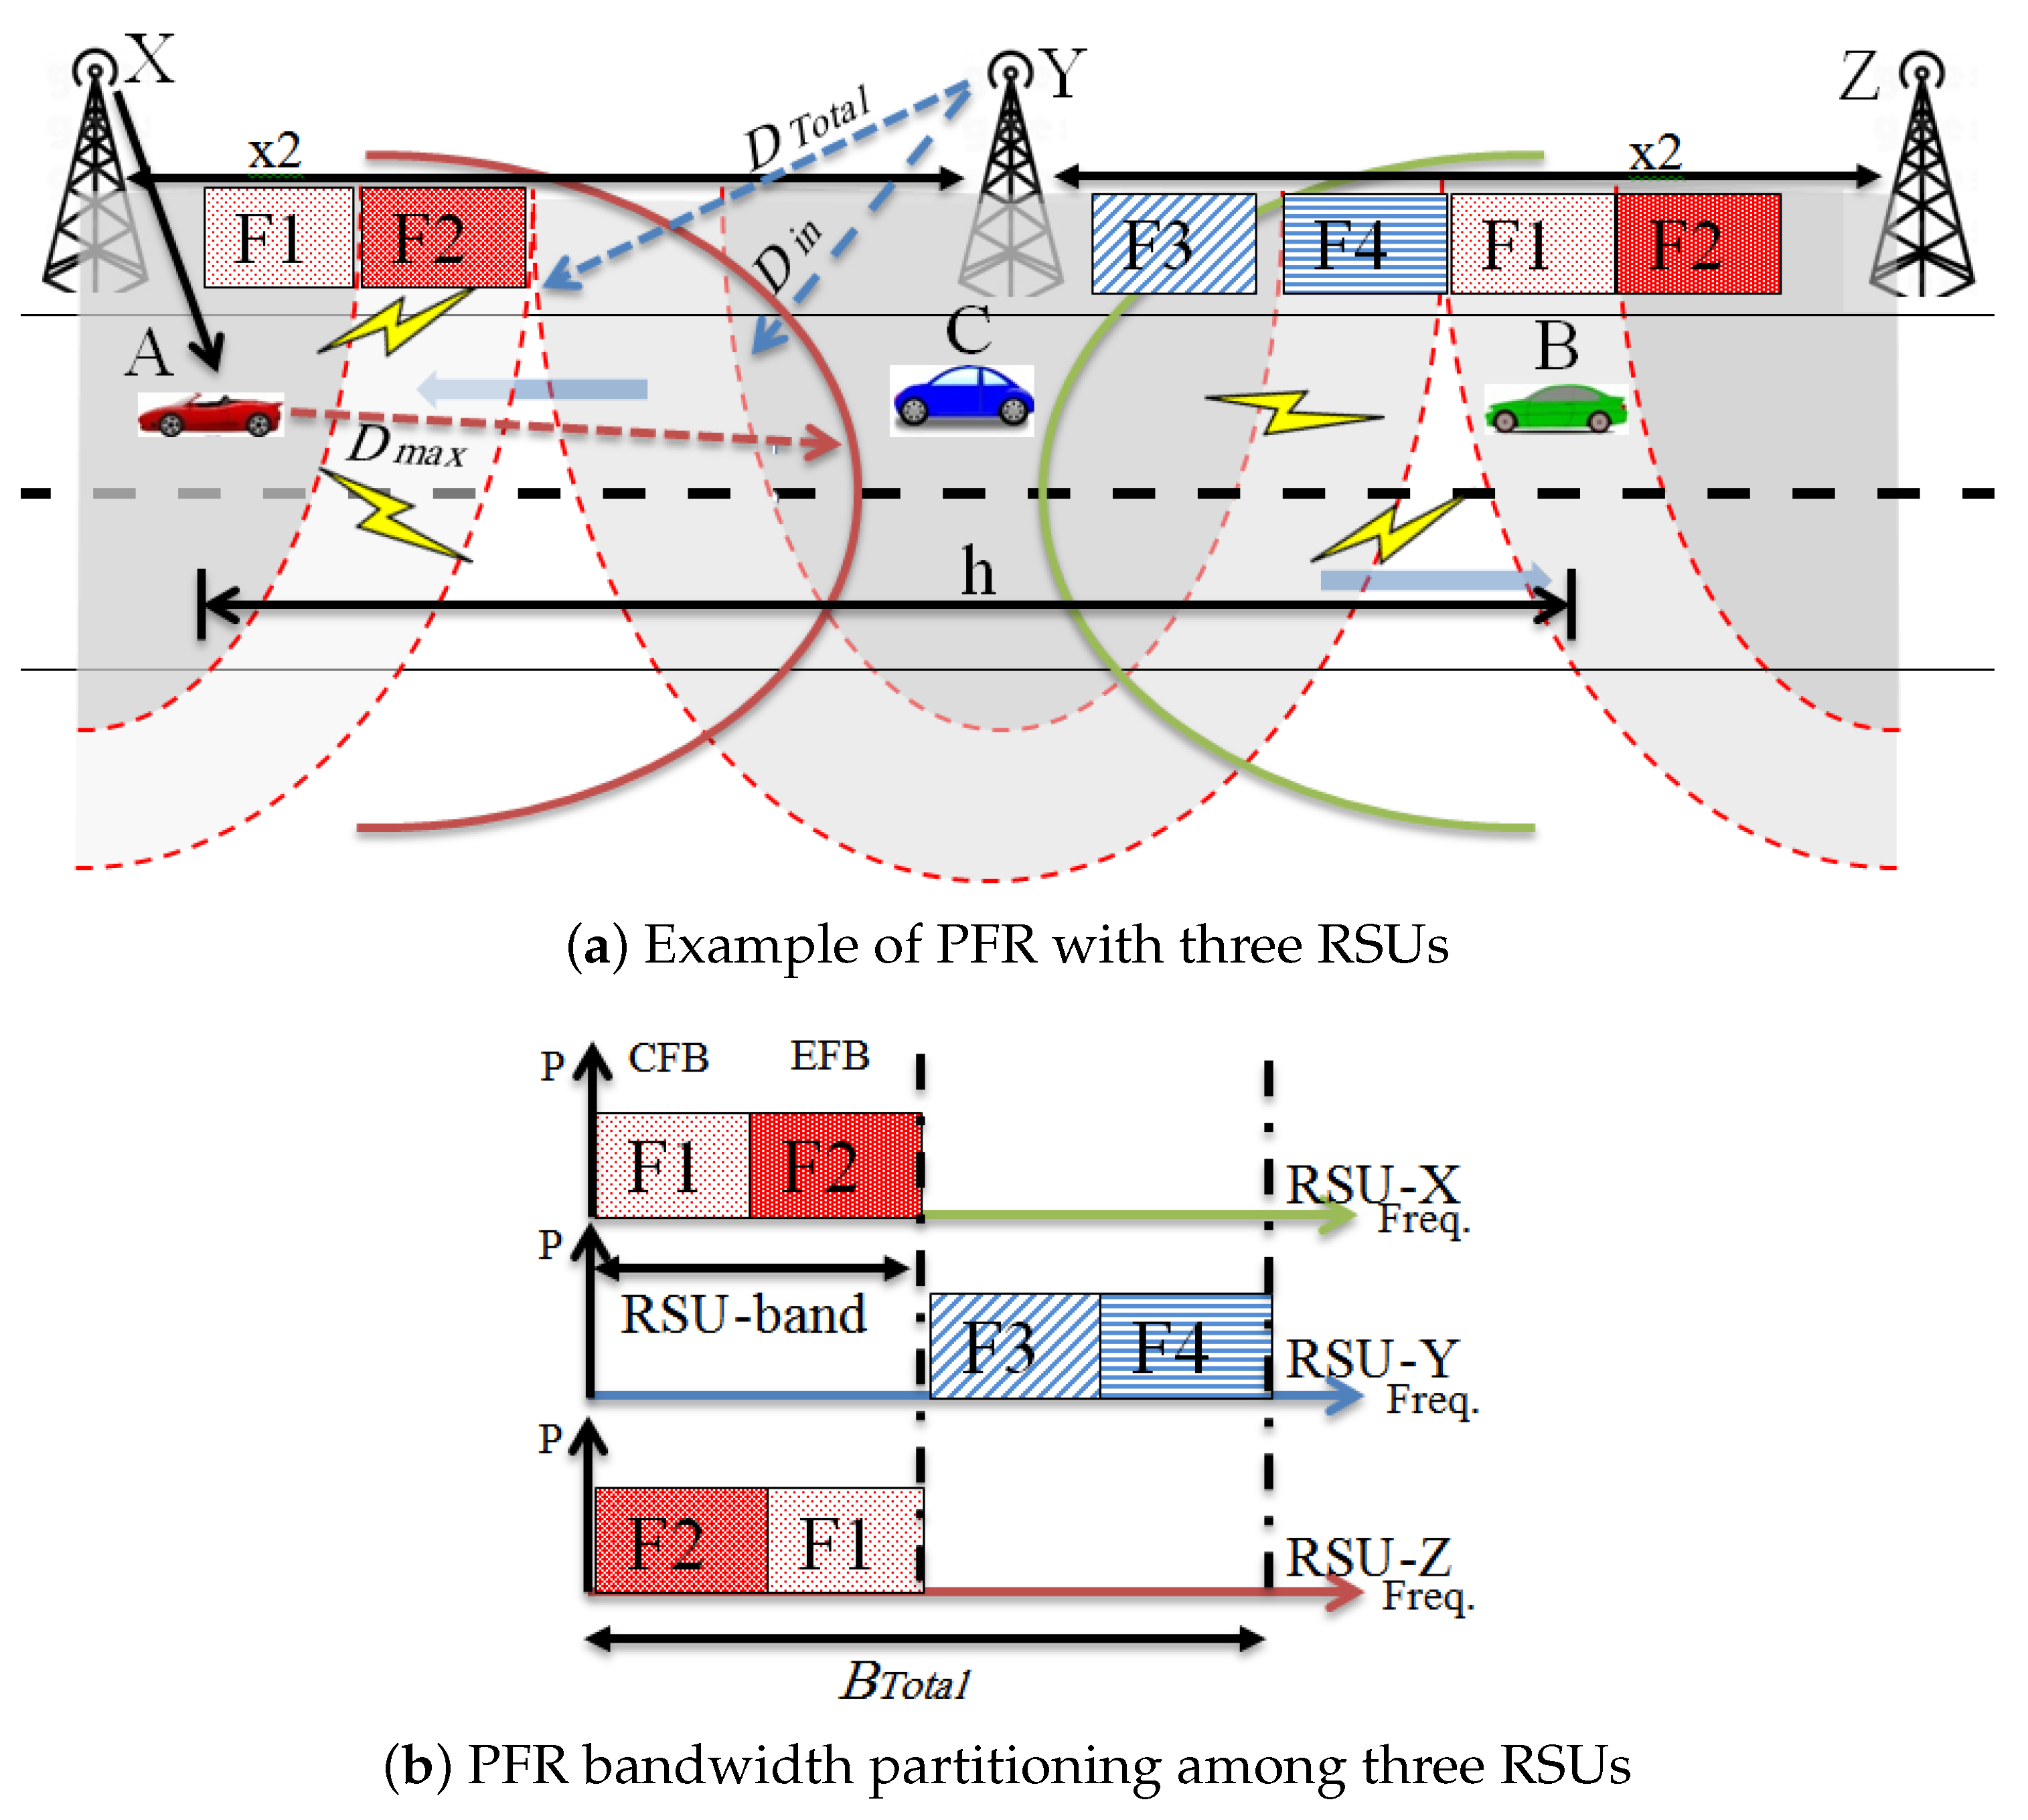
Figure 4.
The interference impact of the system in partitioning techniques: (a) FRR and (b) PRR. (c) is the interference impact of SB when the system is without any partitioning technique.
Figure 4.
The interference impact of the system in partitioning techniques: (a) FRR and (b) PRR. (c) is the interference impact of SB when the system is without any partitioning technique.

Figure 5.
The Packet Reception Ratio (PRR) of vehicles’ CAM messages broadcast for different vehicle density factors with bandwidth partitioning using the Full Frequency Reuse (FFR) technique.
Figure 5.
The Packet Reception Ratio (PRR) of vehicles’ CAM messages broadcast for different vehicle density factors with bandwidth partitioning using the Full Frequency Reuse (FFR) technique.
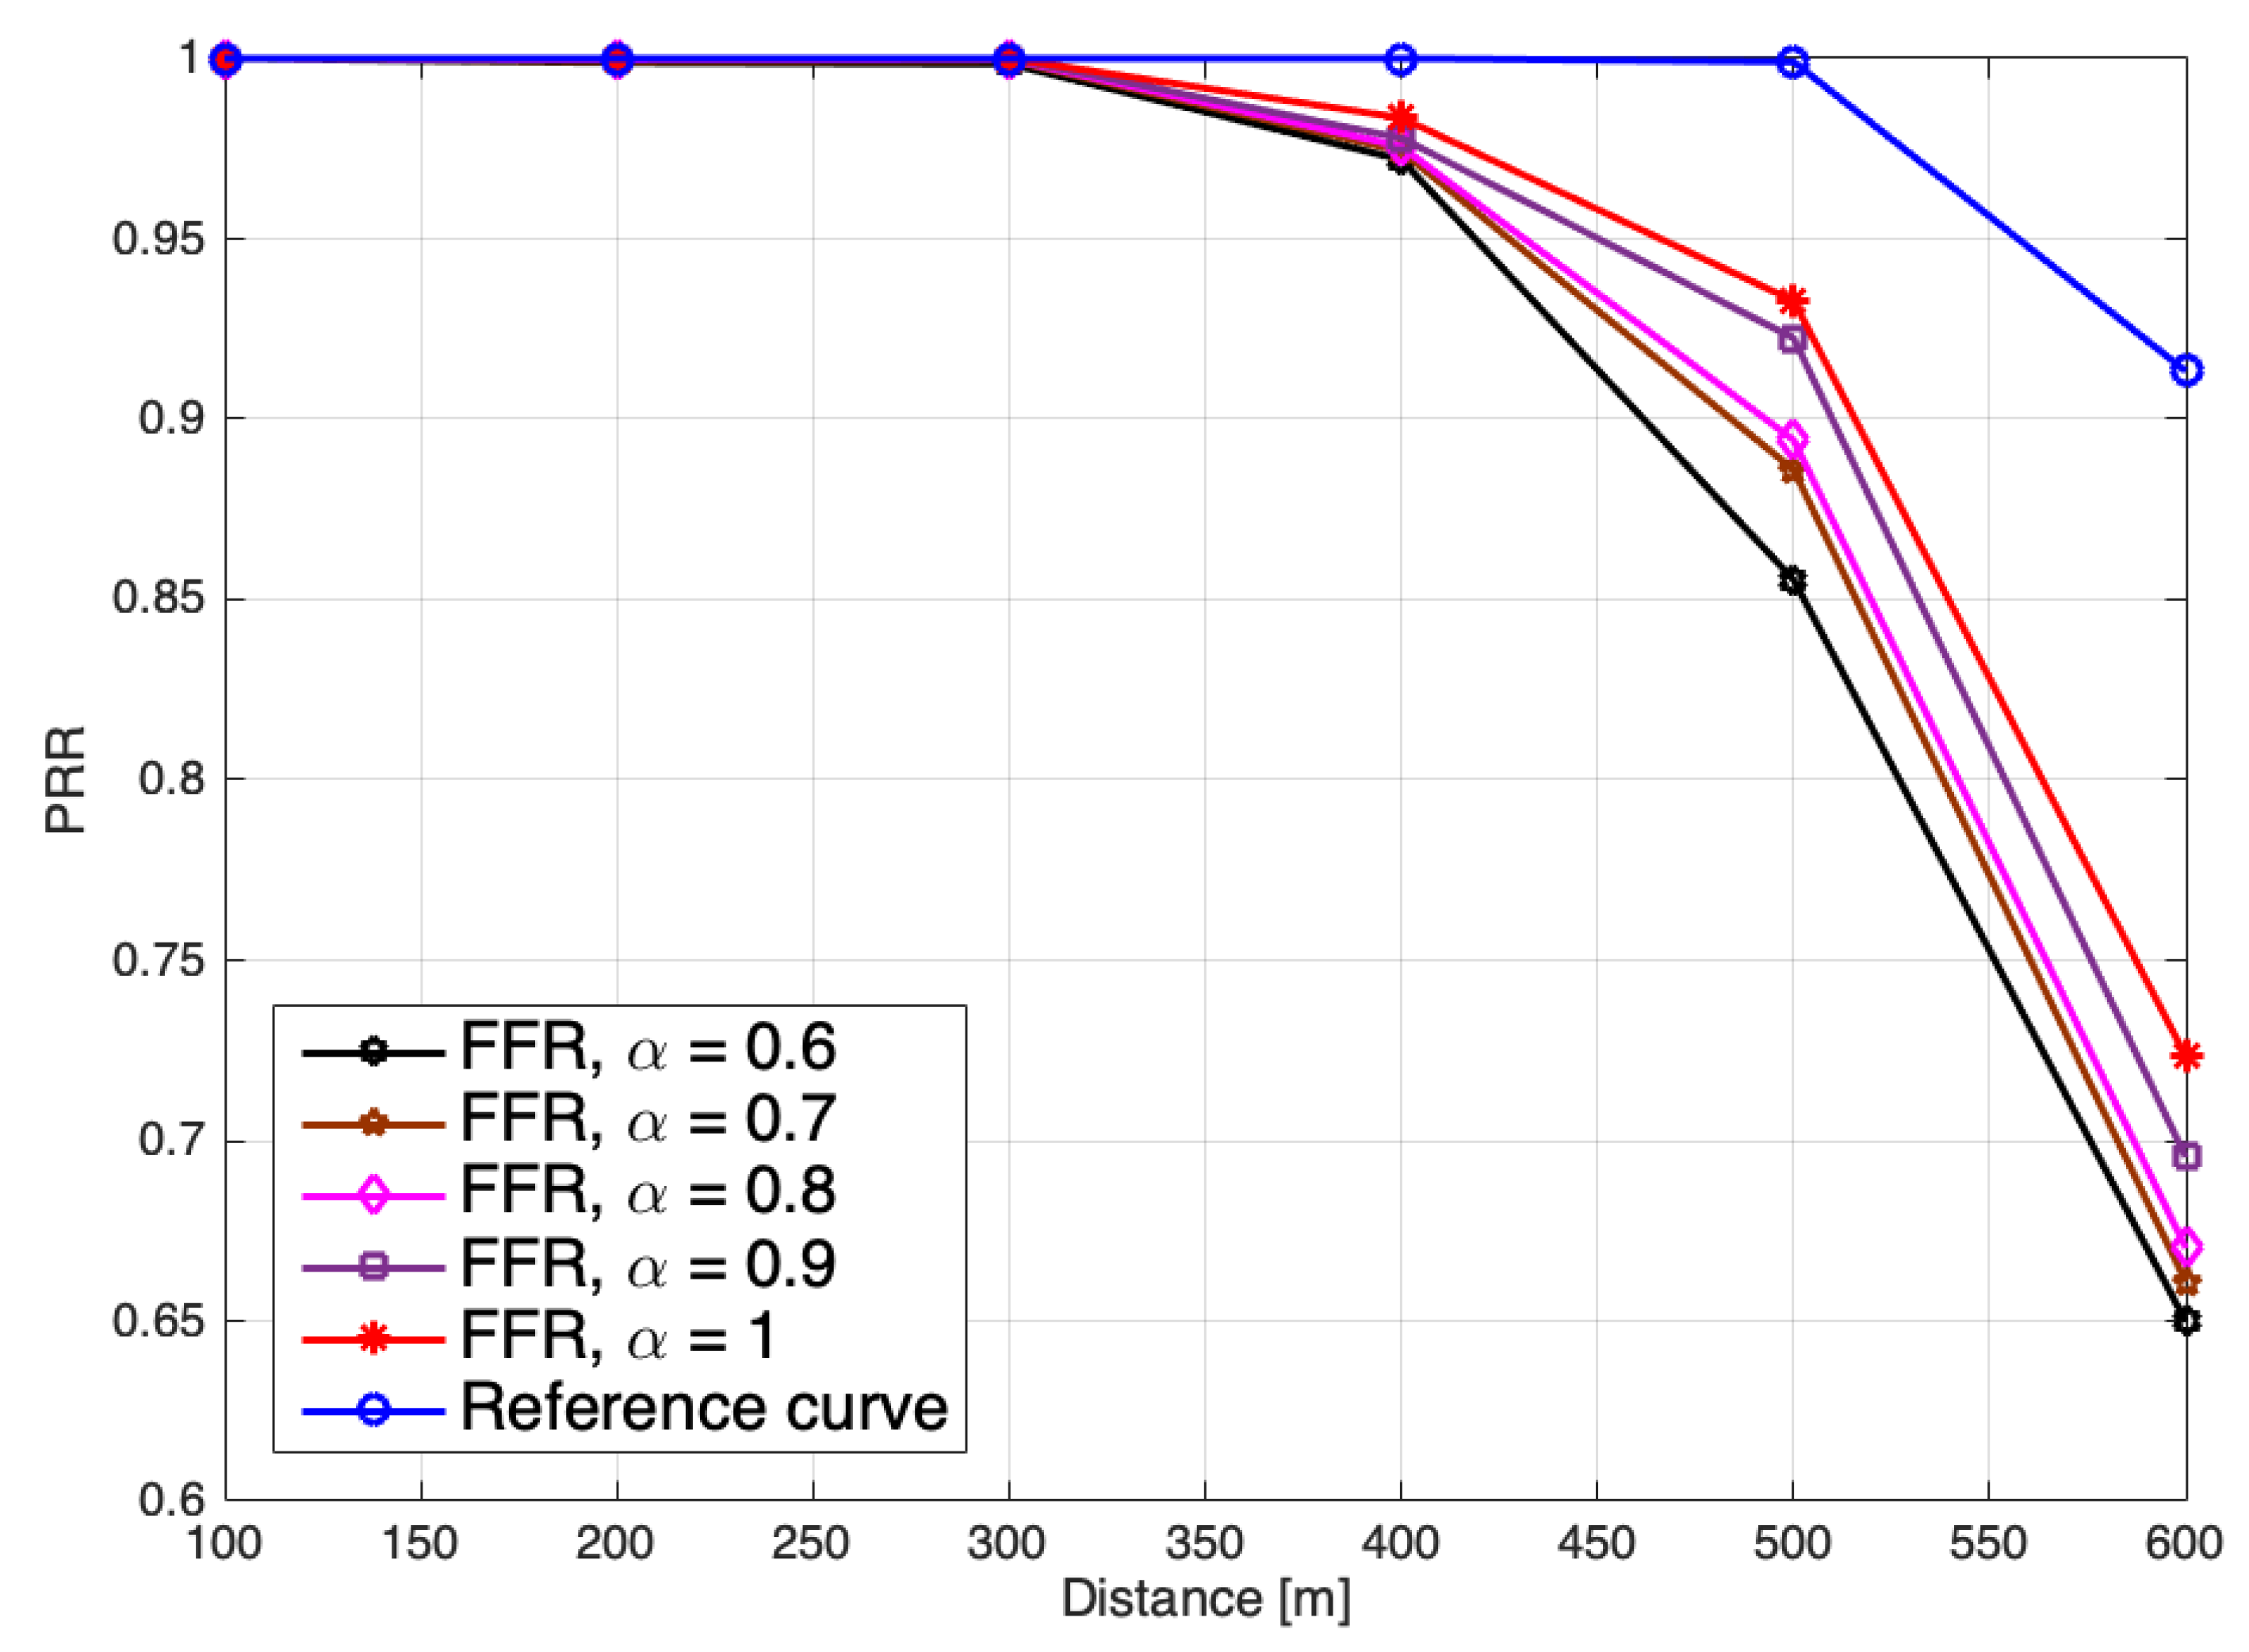
Figure 6.
The Packet Reception Ratio (PRR) of CAM messages broadcast for different vehicle density factors bandwidth partitioning using the Partial Frequency Reuse (PFR) technique.
Figure 6.
The Packet Reception Ratio (PRR) of CAM messages broadcast for different vehicle density factors bandwidth partitioning using the Partial Frequency Reuse (PFR) technique.
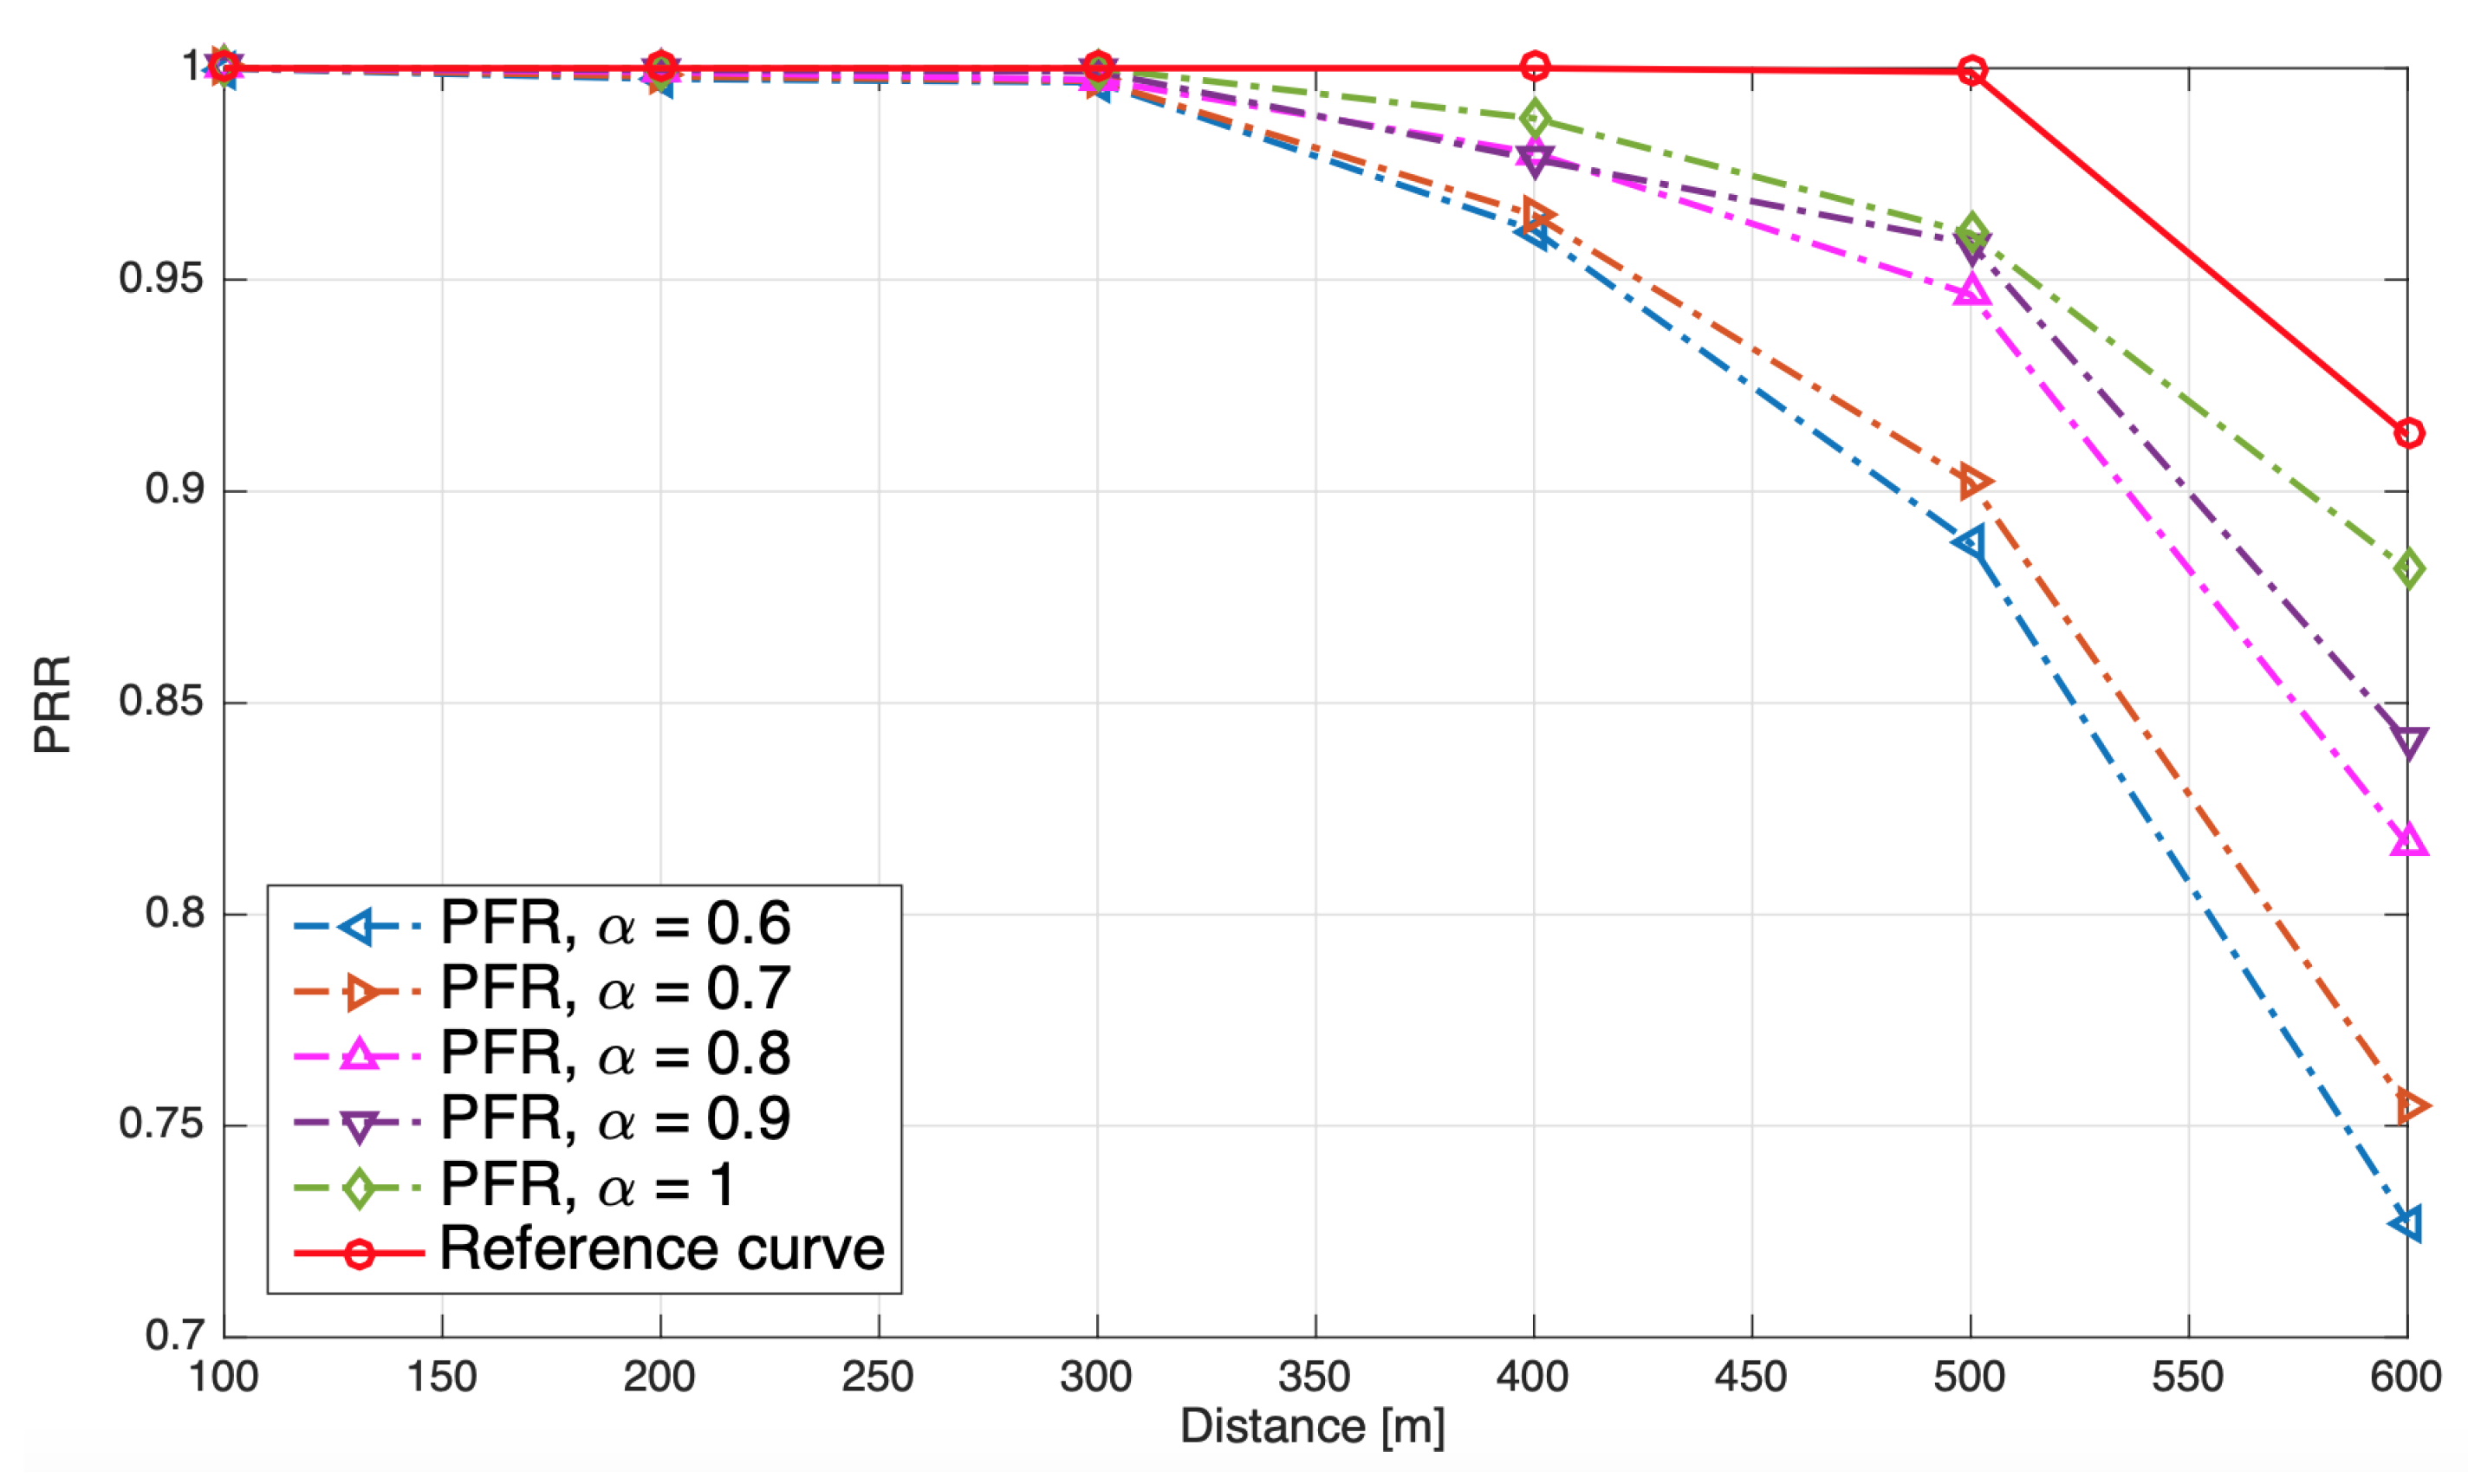
Figure 7.
The Packet Reception Ratio (PRR) of vehicles CAM messages broadcast for different vehicle density factors for the single band (SB) frequency reuse.
Figure 7.
The Packet Reception Ratio (PRR) of vehicles CAM messages broadcast for different vehicle density factors for the single band (SB) frequency reuse.
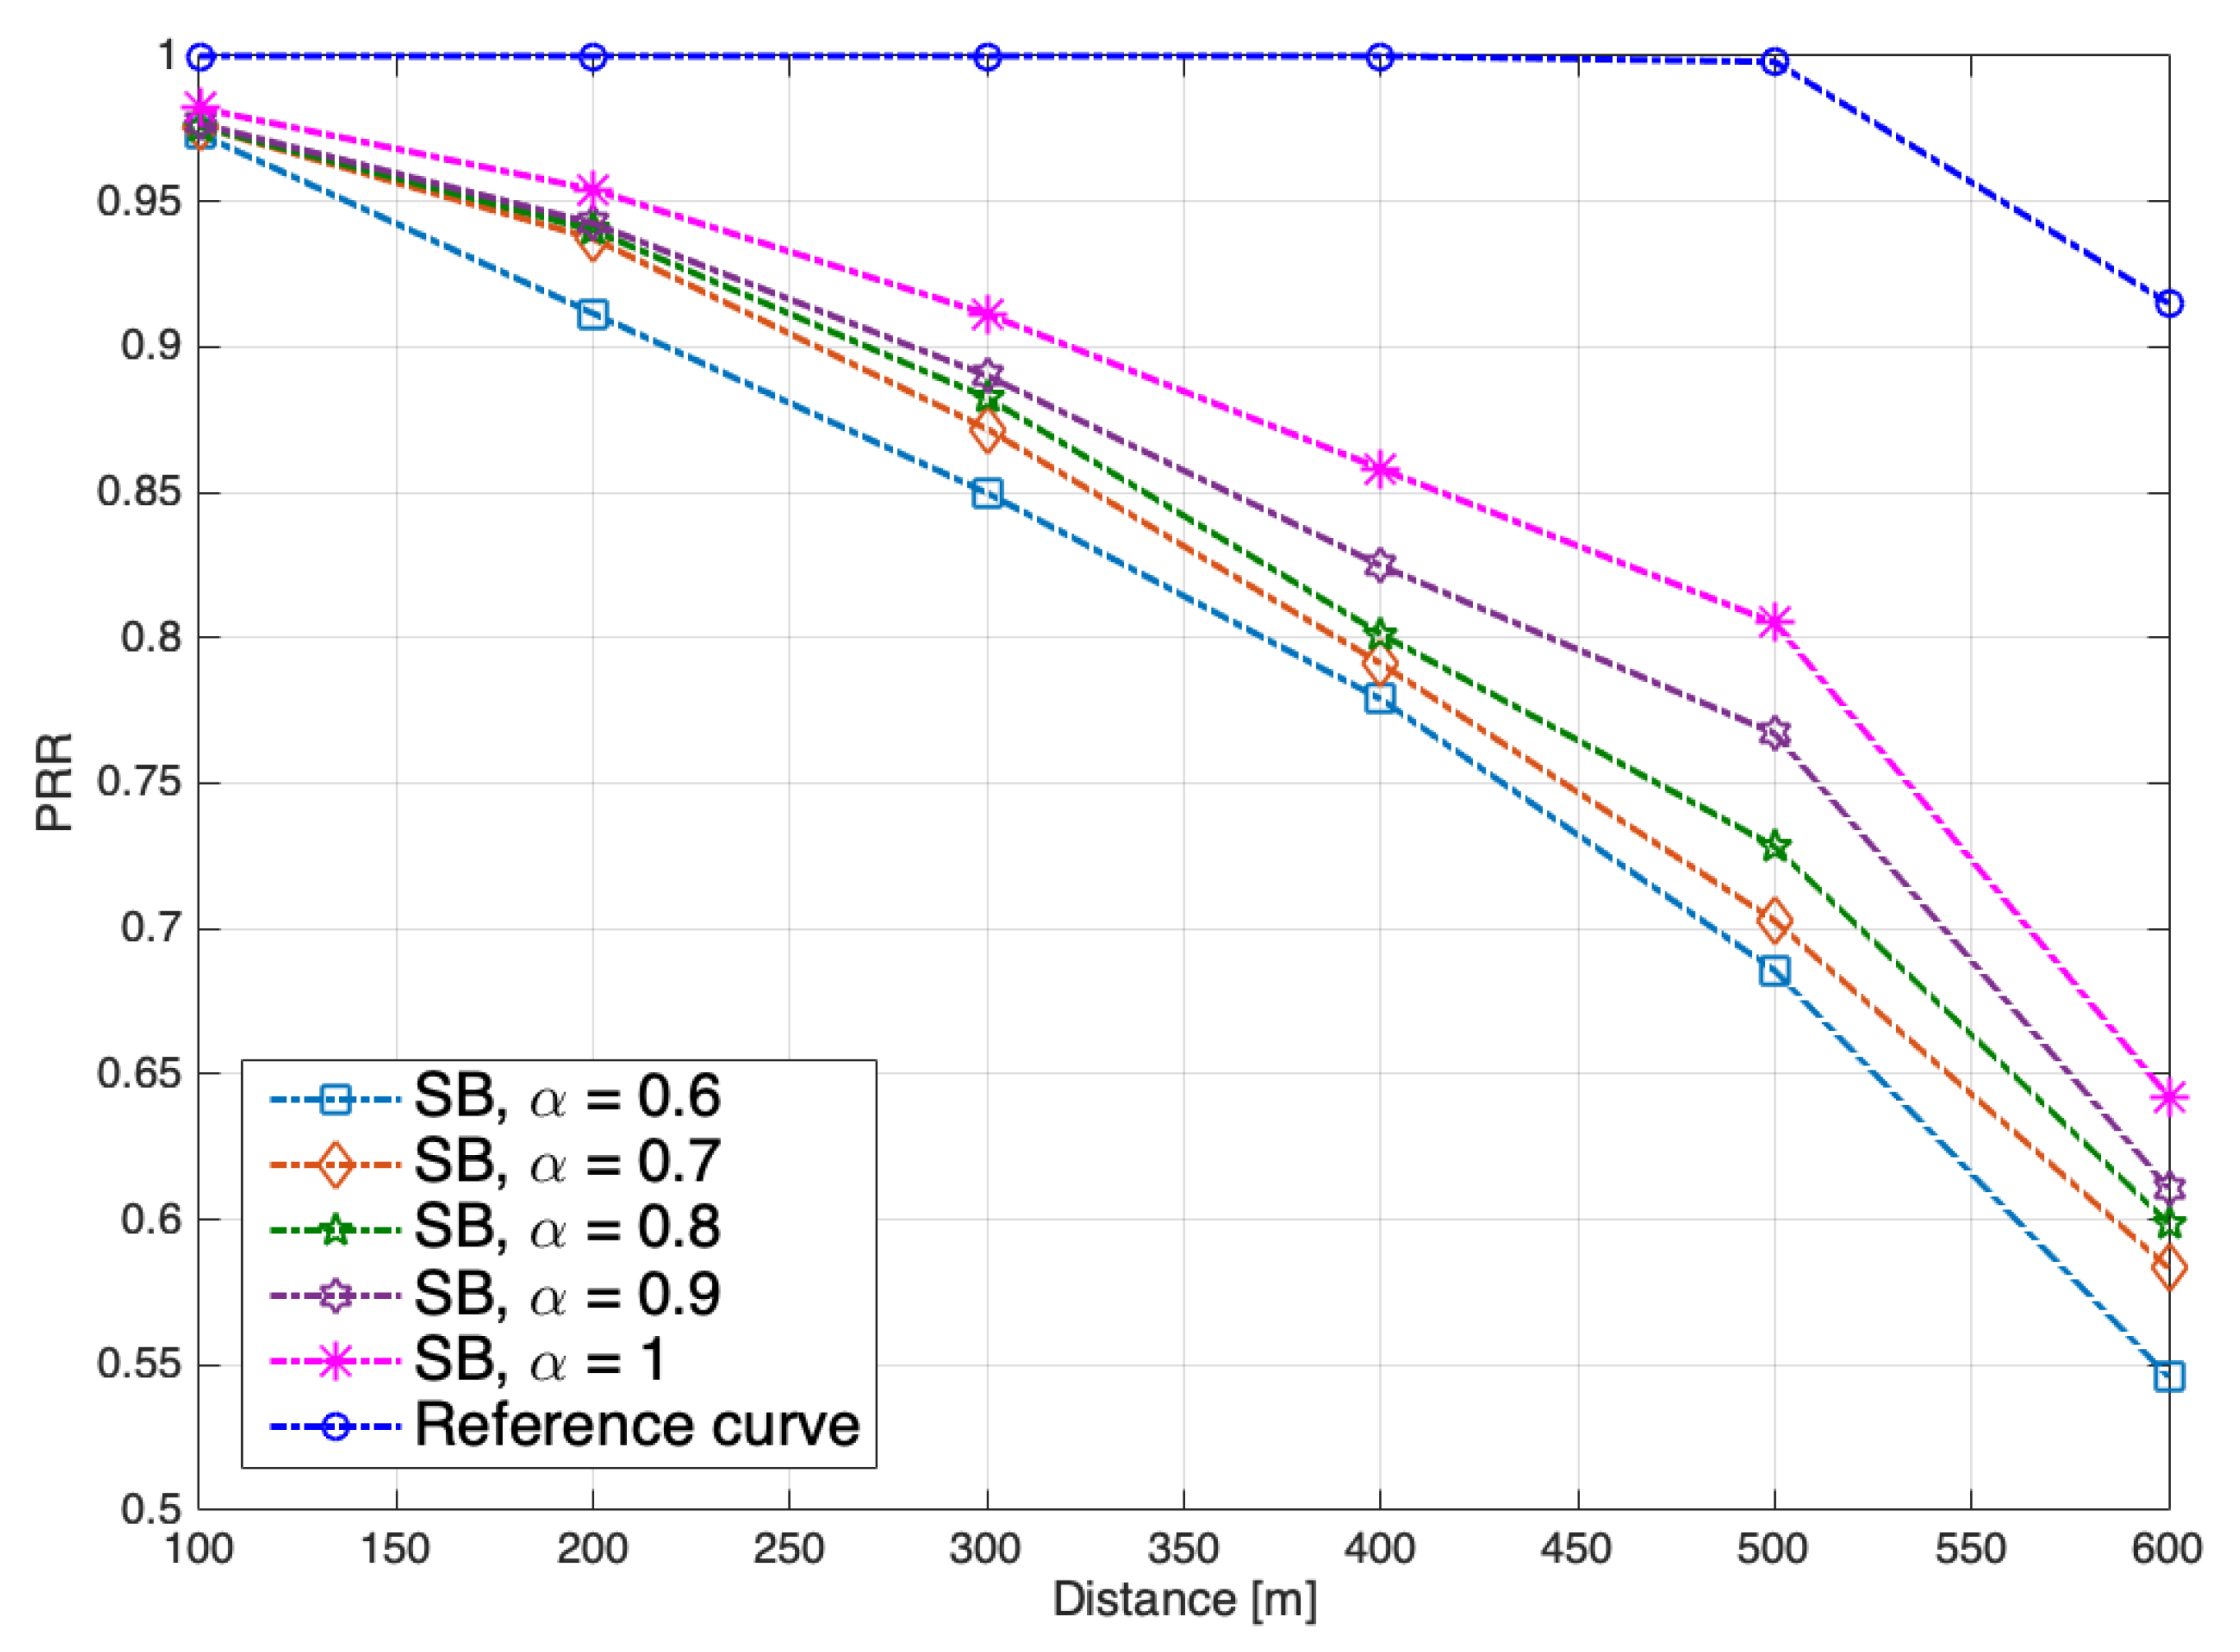
Figure 8.
Difference in Packet Reception Ratio (D-PRR = PRR PRR) between both FFR and PFR bandwidth partitioning techniques versus distance for different vehicle densities.
Figure 8.
Difference in Packet Reception Ratio (D-PRR = PRR PRR) between both FFR and PFR bandwidth partitioning techniques versus distance for different vehicle densities.
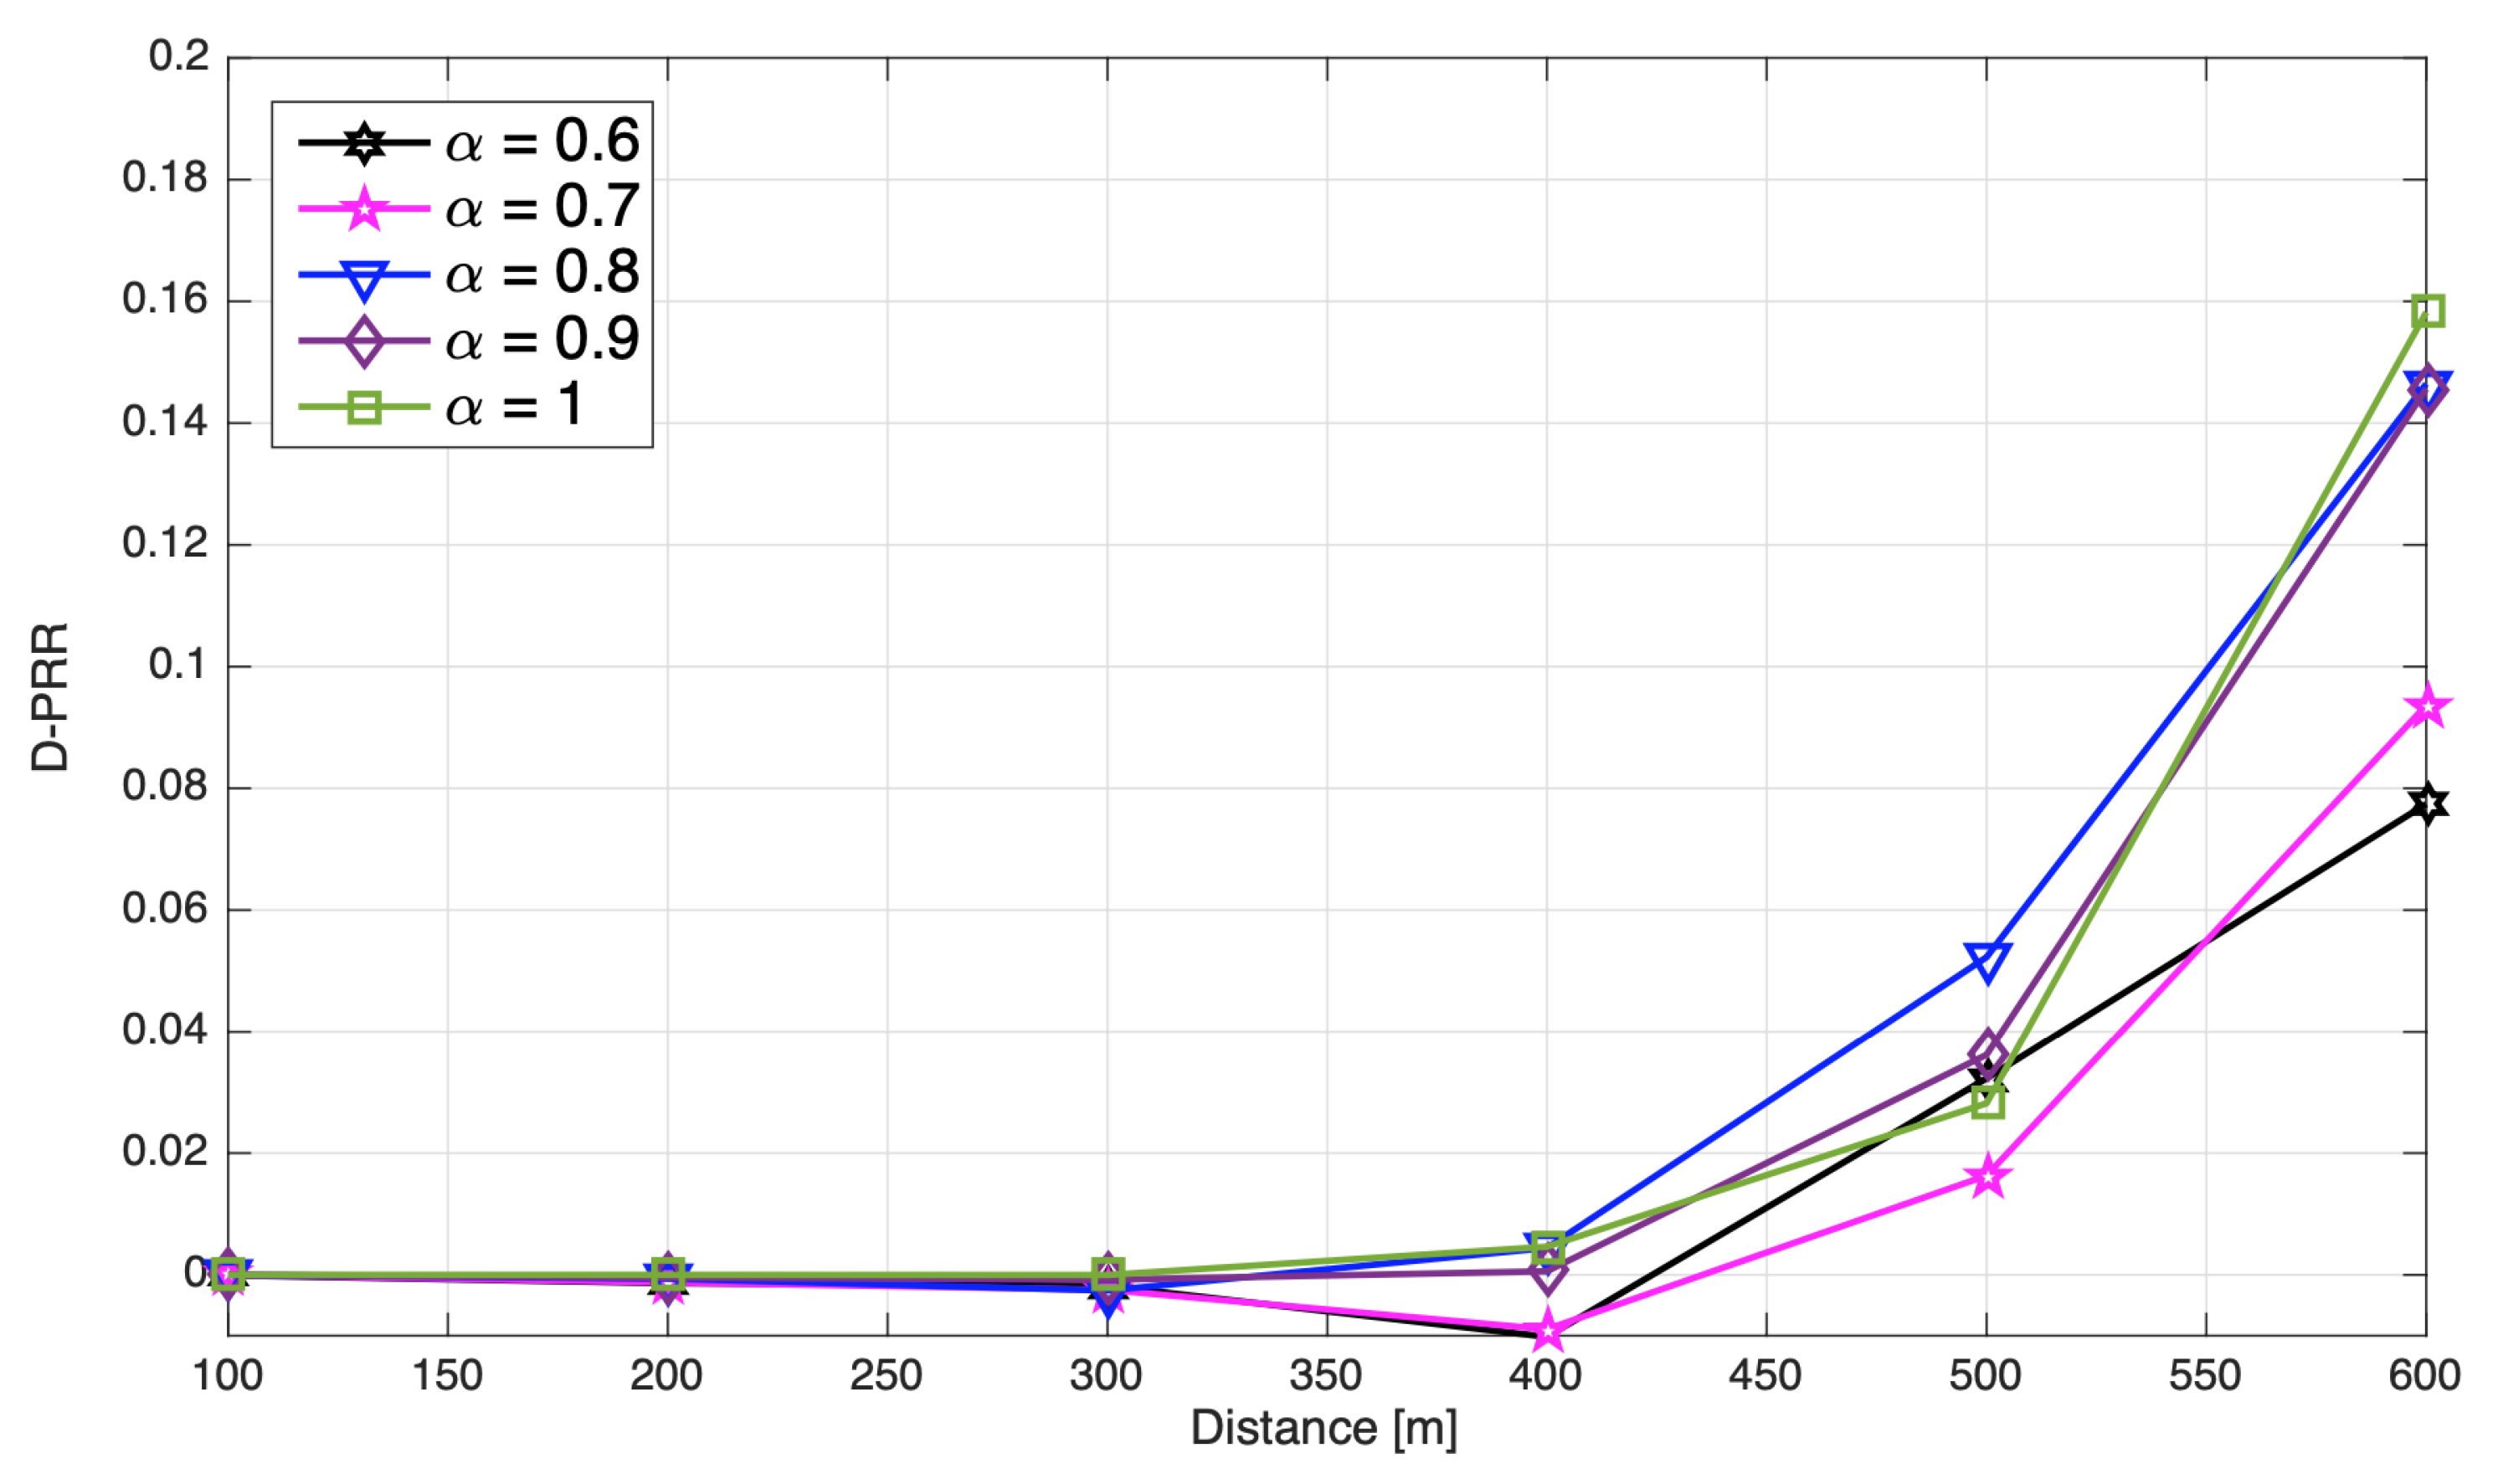
Figure 9.
The Minimum Frequency Reuse Distance of CAM broadcasting messages in different vehicle density factors for both Bandwidth partitioning techniques: Full Frequency Reuse (FFR) and Partial Frequency Reuse (PFR).
Figure 9.
The Minimum Frequency Reuse Distance of CAM broadcasting messages in different vehicle density factors for both Bandwidth partitioning techniques: Full Frequency Reuse (FFR) and Partial Frequency Reuse (PFR).

Figure 10.
The average frequency reuse distance of CAM broadcasting messages by vehicles for different vehicle density factors for both bandwidth partitioning techniques: Full Frequency Reuse (FFR) and Partial Frequency Reuse (PFR).
Figure 10.
The average frequency reuse distance of CAM broadcasting messages by vehicles for different vehicle density factors for both bandwidth partitioning techniques: Full Frequency Reuse (FFR) and Partial Frequency Reuse (PFR).

Table 1.
Common settings.
| Common Parameters and Settings | Values |
|---|---|
| Carrier frequency | 5.9 GHz |
| MCS | 8 |
| Broadcasting power by vehicles | 23 dBm |
| Bandwidth | 10 MHz |
| Shadowing | log-normal |
| Std. dev. | 3 dB |
| Road length × road width | 5000 m × 4 m |
| No. of lanes in each direction | 3 |
| Number of RSUs | 5 |
| Radius of RSU coverage | 500 m |
| Distance between RSUs | 1000 m |
| Radius of vehicle broadcasting coverage area | 600 m |
| Radius of inner RSU coverage | 250 m |
| Distance of RSUs to the highway | 3 m |
| Vehicles speed in each direction | 70, 100, 140 kmph |
| Antenna gain | 3 dBi |
| Path loss at 1 m | 37.02 dB |
| Loss exponent | 2.75 |
| Noise power over 10 MHz | −95 dBm |
| CAM interval | 100 ms |
| Packet size | 190 bytes |
| Simulation time | 5 s |
| Simulation time step | 100 ms |
| Vehicle density factor | [0.6–1] |
| Number of sub-channels in a sub-frame | 4 |
| Number of RBs in a sub-channel | 12 |
Table 2.
Percentage of the total vehicles that are located inside with FFR technique.
| 0.6 | 0.7 | 0.8 | 0.9 | 1 | |
|---|---|---|---|---|---|
| 1.32% | 1.02% | 0.80% | 0.78% | 0.72% |
Table 3.
Percentage of the total vehicles that are located inside with the SB technique.
| 0.6 | 0.7 | 0.8 | 0.9 | 1 | |
|---|---|---|---|---|---|
| 35.5% | 33.4% | 31.8% | 29.5% | 26.7% |
Publisher’s Note: MDPI stays neutral with regard to jurisdictional claims in published maps and institutional affiliations. |
© 2022 by the authors. Licensee MDPI, Basel, Switzerland. This article is an open access article distributed under the terms and conditions of the Creative Commons Attribution (CC BY) license (https://creativecommons.org/licenses/by/4.0/).
Share and Cite
MDPI and ACS Style
Sabeeh, S.; Wesołowski, K.; Sroka, P. C-V2X Centralized Resource Allocation with Spectrum Re-Partitioning in Highway Scenario. Electronics 2022, 11, 279. https://doi.org/10.3390/electronics11020279
AMA Style
Sabeeh S, Wesołowski K, Sroka P. C-V2X Centralized Resource Allocation with Spectrum Re-Partitioning in Highway Scenario. Electronics. 2022; 11(2):279. https://doi.org/10.3390/electronics11020279
Chicago/Turabian StyleSabeeh, Saif, Krzysztof Wesołowski, and Paweł Sroka. 2022. "C-V2X Centralized Resource Allocation with Spectrum Re-Partitioning in Highway Scenario" Electronics 11, no. 2: 279. https://doi.org/10.3390/electronics11020279
Note that from the first issue of 2016, this journal uses article numbers instead of page numbers. See further details here.