Article

Automatic Knee Injury Identification through Thermal Image Processing and Convolutional Neural Networks

by
Omar Trejo-Chavez
1,
Juan P. Amezquita-Sanchez
2,
Jose R. Huerta-Rosales
2,
Luis A. Morales-Hernandez
1,
Irving A. Cruz-Albarran
1,* and
Martin Valtierra-Rodriguez
2,*
1
Mecatrónica, Facultad de Ingeniería, Universidad Autónoma de Querétaro (UAQ), Campus San Juan del Río, Río Moctezuma 249, Col. San Cayetano, San Juan del Río 76807, Querétaro, Mexico
2
ENAP-Research Group, CA-Sistemas Dinámicos y Control, Universidad Autónoma de Querétaro (UAQ), Campus San Juan del Río, Río Moctezuma 249, Col. San Cayetano, San Juan del Río 76807, Querétaro, Mexico
*
Authors to whom correspondence should be addressed.
Electronics 2022, 11(23), 3987; https://doi.org/10.3390/electronics11233987
Submission received: 31 October 2022 / Revised: 26 November 2022 / Accepted: 29 November 2022 / Published: 1 December 2022
(This article belongs to the Special Issue Convolutional Neural Networks and Vision Applications, Volume II)

Abstract

:
Knee injury is a common health problem that affects both people who practice sports and those who do not do it. The high prevalence of knee injuries produces a considerable impact on the health-related life quality of patients. For this reason, it is essential to develop procedures for an early diagnosis, allowing patients to receive timely treatment for preventing and correcting knee injuries. In this regard, this paper presents, as main contribution, a methodology based on infrared thermography (IT) and convolutional neural networks (CNNs) to automatically differentiate between a healthy knee and an injured knee, being an alternative tool to help medical specialists. In general, the methodology consists of three steps: (1) database generation, (2) image processing, and (3) design and validation of a CNN for automatically identifying a patient with an injured knee. In the image-processing stage, grayscale images, equalized images, and thermal images are obtained as inputs for the CNN, where 98.72% of accuracy is obtained by the proposed method. To test its robustness, different infrared images with changes in rotation angle and different brightness levels (i.e., possible conditions at the time of imaging) are used, obtaining 97.44% accuracy. These results demonstrate the effectiveness and robustness of the proposal for differentiating between a patient with a healthy knee and an injured knee, having the advantages of using a fast, low-cost, innocuous, and non-invasive technology.

1. Introduction

The knee is the most complex joint in the human body. It is involved in a large number of activities in daily life, e.g., from walking to more demanding activities, as in the case of sports [1,2]. Specifically, in sports, there are sudden changes of direction or twisting movements, resulting in a high prevalence of knee injuries [3,4,5]. The meniscus [6], cartilage [7], ligaments [8,9], and patellofemoral [10] are among the main affected areas of the knee because of an injury. For detecting these lesions, Magnetic Resonance Imaging (MRI) has been stated to be the most widely used method [11,12]. Although promising results have already been obtained, a constant and growing need for research on different topics is still observed, e.g., the development and application of artificial-intelligence-based algorithms to assist in the opinion of a specialist and the use of new technologies to provide low-cost, low-complexity, and non-invasive tools that allow their use in a greater number of hospitals or medical centers.
In the last few years, new methods based on deep learning have been presented in the literature with the aim of improving diagnostic accuracy, expediting cases with urgent findings, reducing fatigue in specialists, and providing decision support where a specialist is not available for the evaluation of knee pathologies [13]. In particular, one of the artificial-intelligence-based methods that has been applied for image recognition by obtaining reliable results is the convolutional neural networks (CNNs) [14,15]. For the diagnosis of knee injuries, several research works have been developed; for example, Qiu et al. [16] proposed a method based on MRI and the fusion of two CNNs, one deep and the other superficial, for the diagnosis of meniscal injuries. On the other hand, Joshi and K. Suganthi [9] proposed a three-layer parallel deep neural network for the detection of anterior cruciate ligament (ACL) rupture, using a knee MRI. Likewise, Cueva et al. [17] proposed a semi-automatic CADx model based on deep neural networks and a ResNet-34 to detect osteoarthritis in both knees. Similarly, X-Ray and CNN-based systems have been proposed for the detection of osteoarthrosis severity [18,19,20,21].
Furthermore, speaking of physiological aspects, when an injury occurs, it produces a change in the blood flow, which can influence the skin temperature [22]. For this reason, the temperature is considered to be an indicator of some abnormality in the human body [23]. In that sense, thermography has been considered a tool that could be used for recording skin temperature in a non-invasive and low-cost manner [24]. Therefore, Infrared Thermography (IT) has positioned itself as a reliable tool in the diagnosis of musculoskeletal injuries [25]. For example, Fokam and Lehmann [26] mentioned that IRT is a reliable tool for pain assessment in inflammatory arthritis due to the correlation between skin temperature and arthritis pain. Likewise, other studies have found an association between the temperature of the patellar region (i.e., a sign of inflammation) and the severity of osteoarthrosis in the knee [27,28]. Based on this assumption, Jin et al. [29] proposed an automatic analysis method for thermographic images of the knee (specifically in the center of the patella) for osteoarthrosis screening based on a Support Vector Machine. As can be observed, there are several studies based on infrared thermography that relate temperature changes with a knee injury; however, it is necessary to explore these findings with intelligent systems, e.g., CNN-based methods that allow for the detection of knee alterations automatically.
The objective of this research was to develop an automatic system based on a CNN for detecting alterations in a knee by using thermographic images. Specifically, the proposal is based on thermographic image processing in order to improve and make more evident the features that allow us to differentiate between a control group (a healthy knee) and an experimental group (an injured knee). From the image processing, grayscale images, equalized images, and thermal images are obtained. Then the CNN configuration (i.e., input size, number and size of filters, pooling type, batch size, and the number of epochs) is enhanced in order to improve accuracy and reduce computational cost. The hypothesis proposed in this work is that, through a CNN, it is possible to identify knee alterations due to the changes in temperature and features of the thermographic images caused by these alterations. The results show that thermography, in combination with a CNN, can be positioned as a complementary tool in the diagnosis of knee injuries, highlighting its advantages over traditional methods; that is, it is a non-contact technology, innocuous, and does not generate radiation.

2. Theoretical Background

2.1. Thermography

Over the years, the temperature has shown to be a proficient indicator of health [30,31]. That is, any disease or body disorder with inflammatory consequences will generate changes in the temperature at the affected area [30,31,32]; therefore, these changes or heat signatures can be characterized to detect and diagnose a particular body condition [30]. In addition, for the detection of diseases or body disorders, temperature monitoring and its evolution to nominal values may confirm the adequacy of treatment or therapy effectiveness [32]. Thus, temperature monitoring has become of paramount importance in medical fields, with IT being the most promising solution because it is a fast, low-cost, non-contact, and non-invasive temperature monitoring technology [31,32,33]. IT refers to the acquisition and processing of thermal information through infrared-measuring cameras [34].
Despite the IT advantages, anomaly detection based on thermograms is not a straightforward process. Aspects such as the object temperature, surface properties, and environmental conditions at the time of imaging impact the information that could be extracted from them [32]; moreover, their range of intensity, which is typically much less than the one observed in visible images, leads to low contrast, poor resolution, and less texture information [32]. In this regard, the application of image-processing stages might improve the accuracy and simplify the complexity of the pattern-recognition algorithms if automatic anomaly detection systems based on IT are desired.

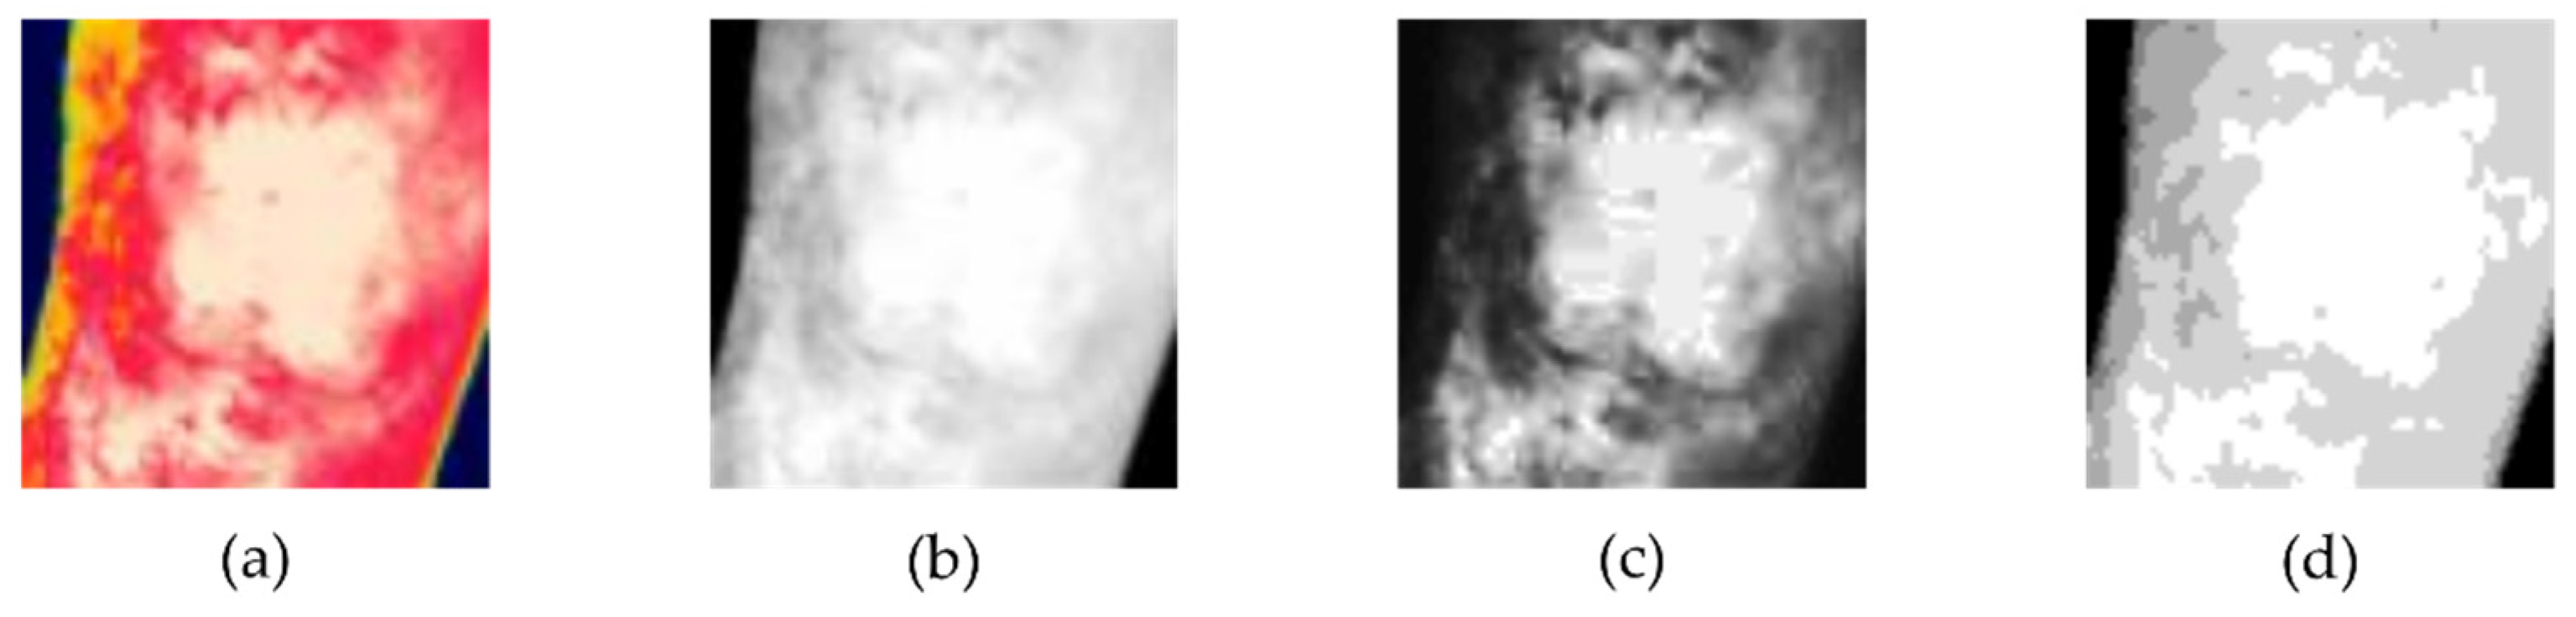
2.2. Image Processing

In general, image processing is focused on both the improvement of graphic information for human interpretation and the processing of data for storing, transmitting, and extracting information for applications of autonomous machine perception [35].
Infrared images can be provided in a color palette (e.g., red, green, and blue (RGB)) or in grayscale. Grayscale images might be preferred to reduce computational cost since only one channel, i.e., the monochromatic channel, unlike, for instance, the three channels of the RGB color model, has to be processed. Figure 1a,b show a color image and a grayscale image of a knee, respectively.
To improve the contrast of a greyscale image, histogram equalization can be carried out [35] (see Figure 1c). In order to do so, at first, the probability vector (i.e., normalized histogram) has to be computed by using the following equation:
p ( k ) = n k n k = 0 , 1 , 2 , , L 1
where n is the total number of pixels in the image, nk is the number of pixels that have intensity k, and L is the number of possible intensity levels in the images (e.g., 256 for an 8-bit image).
From the probability function, the cumulative distribution function can be defined as follows:
c d f ( k ) = j = 0 k p ( k )
Then the equalized histogram can be obtained as follows:
e h ( k ) = r o u n d ( c d f ( k ) ( L 1 ) )
where round(·) stands for the rounding operation. Thus, the equalized image is obtained through the following equation:
O ( x , y ) = e h ( f ( x , y ) )
where f is the input image.
On the other hand, in IT, a grayscale thermogram can be converted into a thermal image commonly known as a thermal matrix [36], i.e., an image where the grayscale values of its pixels correspond exactly to the real temperature value by considering only the integer part (see Figure 1d). Equation (6) shows the way to map an image, f, with gray levels between [ g 1 ,   g 2 ] and [ g 1 , g 2 ]. The input range, [ g 1 ,   g 2 ], corresponds to the possible levels of gray of an input image (e.g., from 0 to 255 for an 8-bit image), whereas the output range, [ g 1 , g 2 ], corresponds to the maximum and minimum temperature values, respectively.
g ( x , y ) = r o u n d ( g 2 g 1 g 2 g 1 ( f ( x , y ) g 1 ) + g 1 )

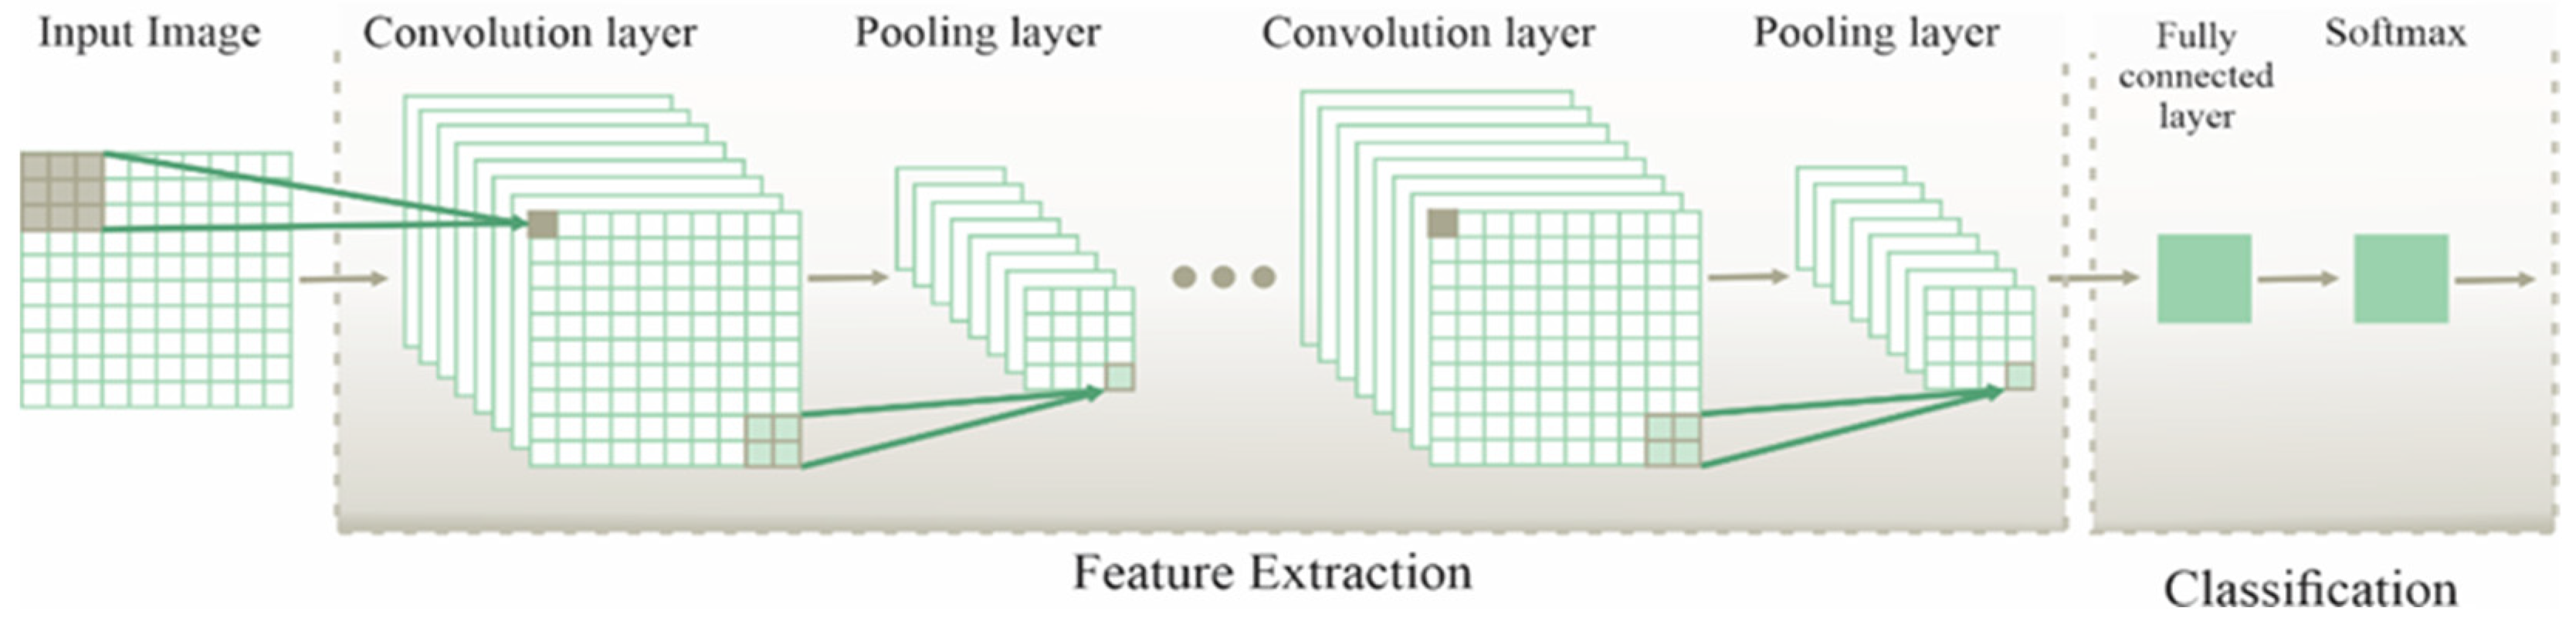
2.3. Convolutional Neural Network
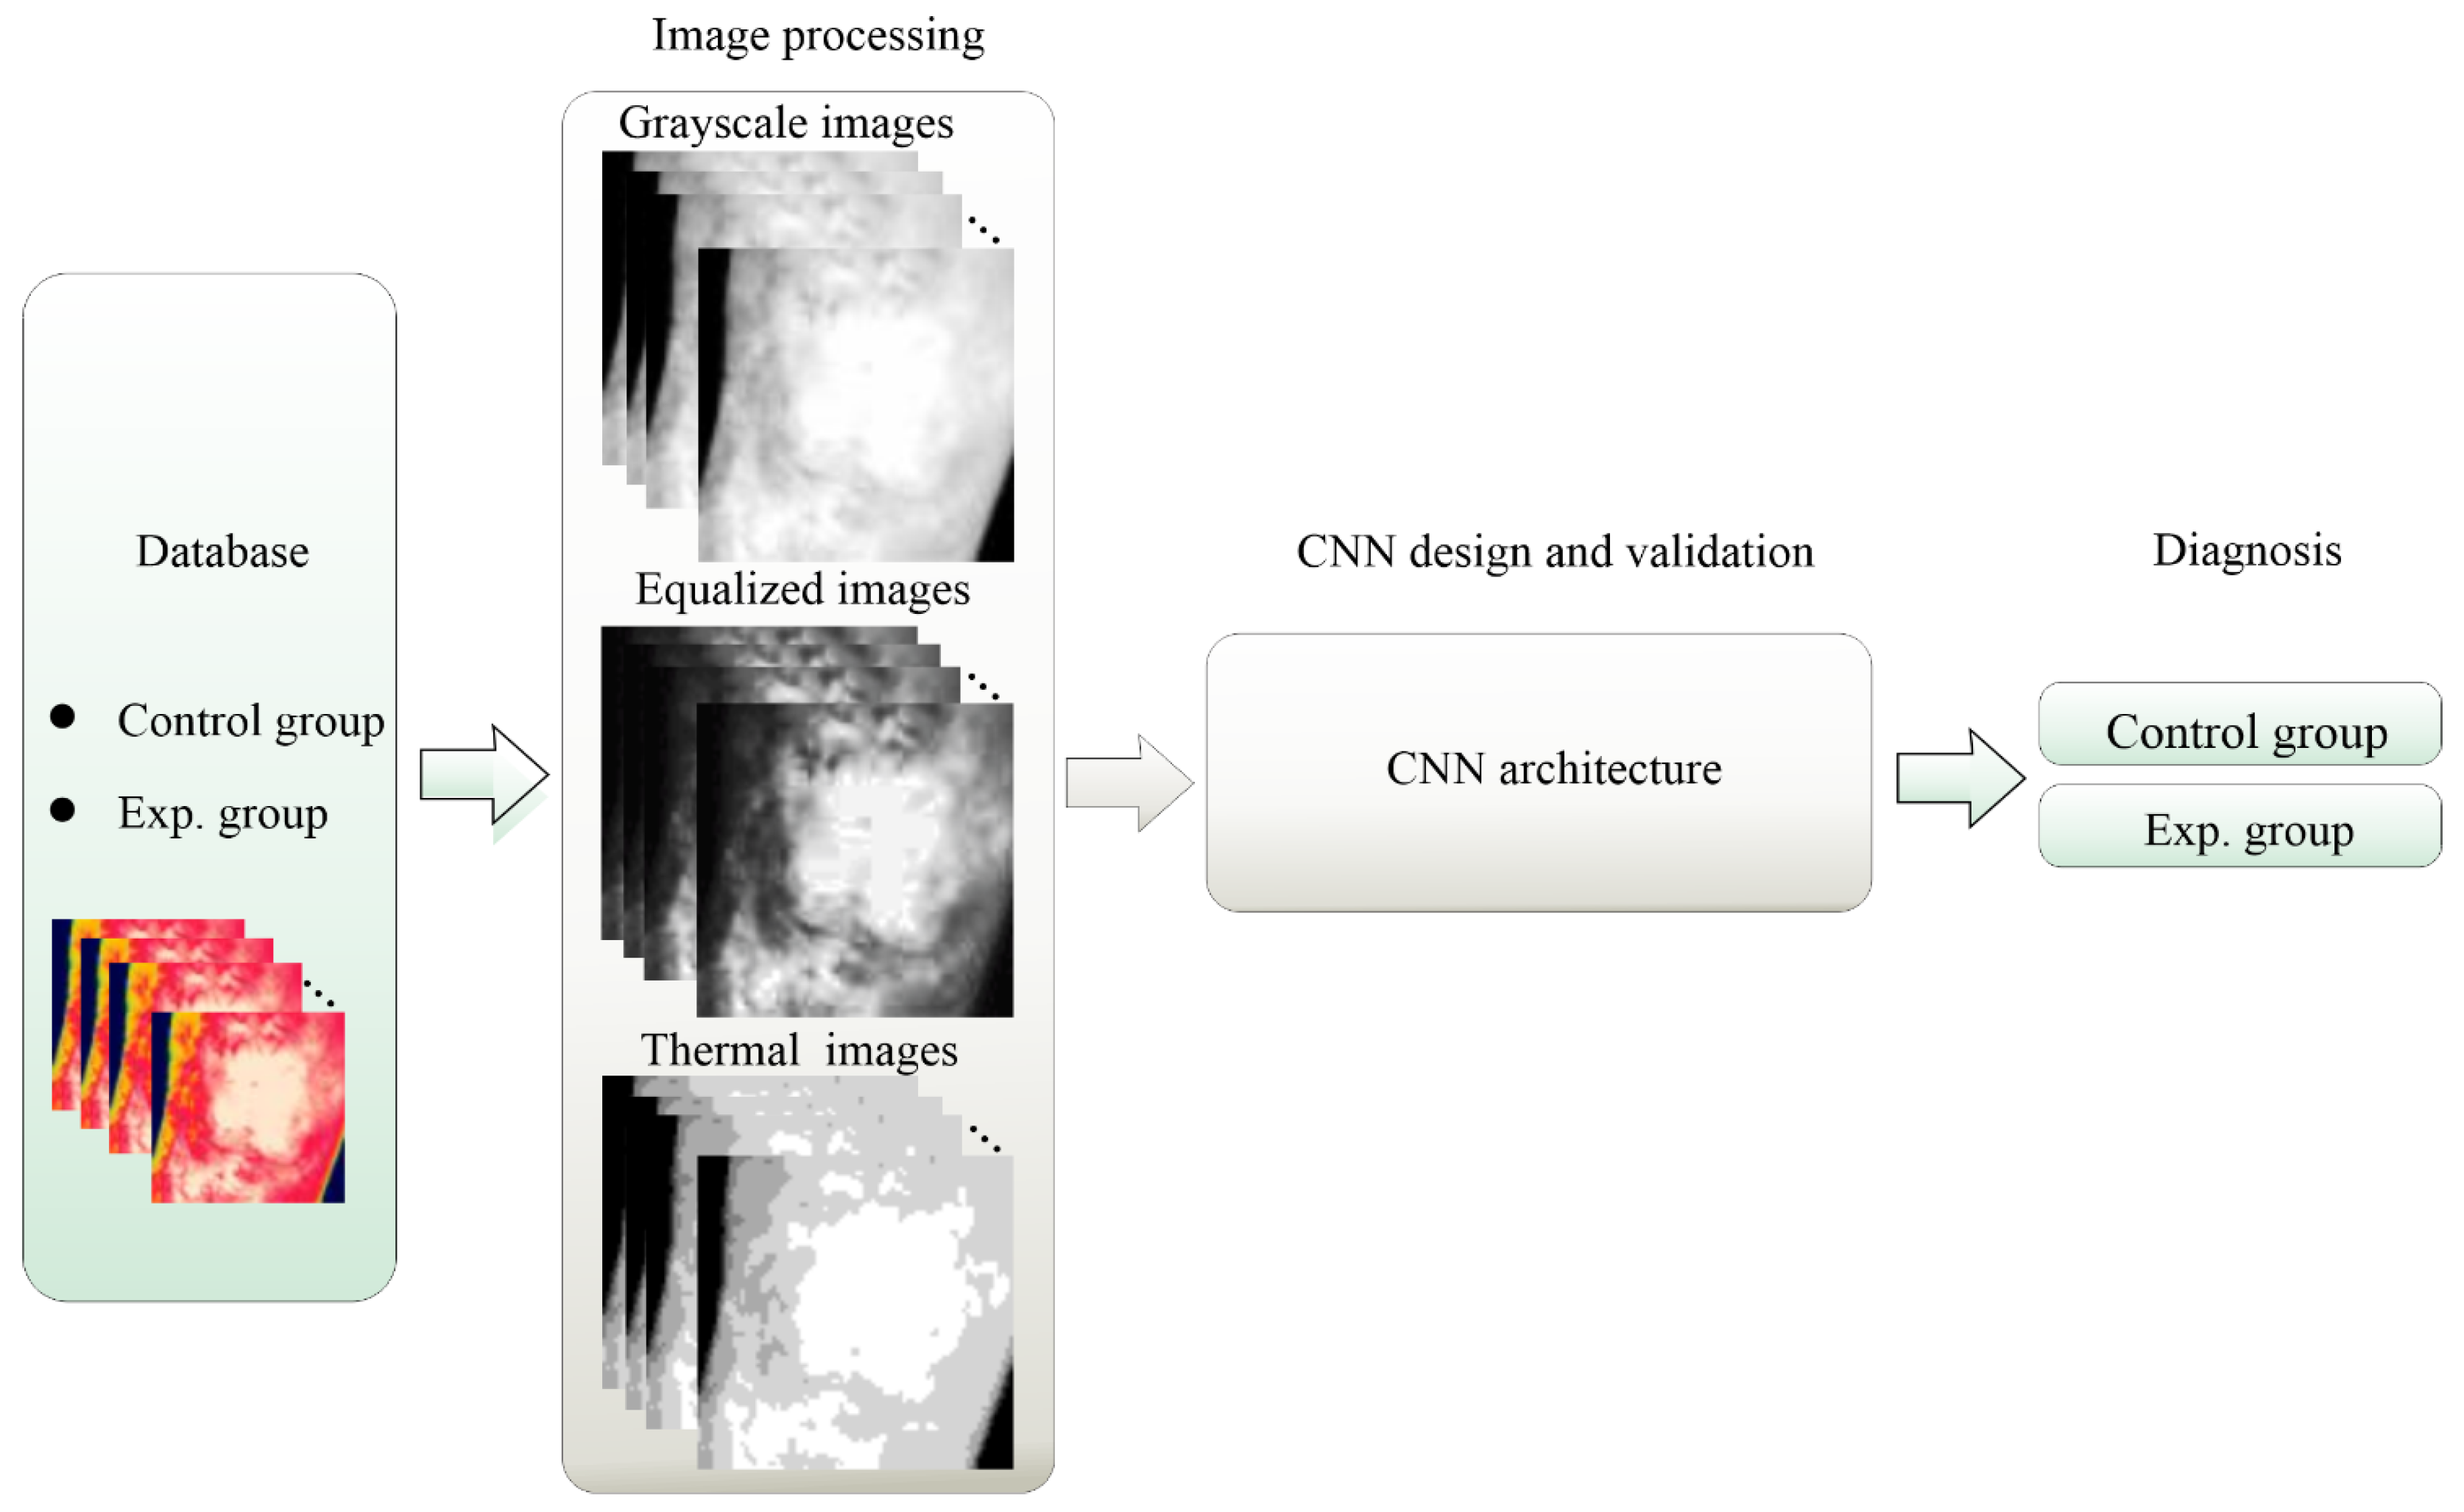
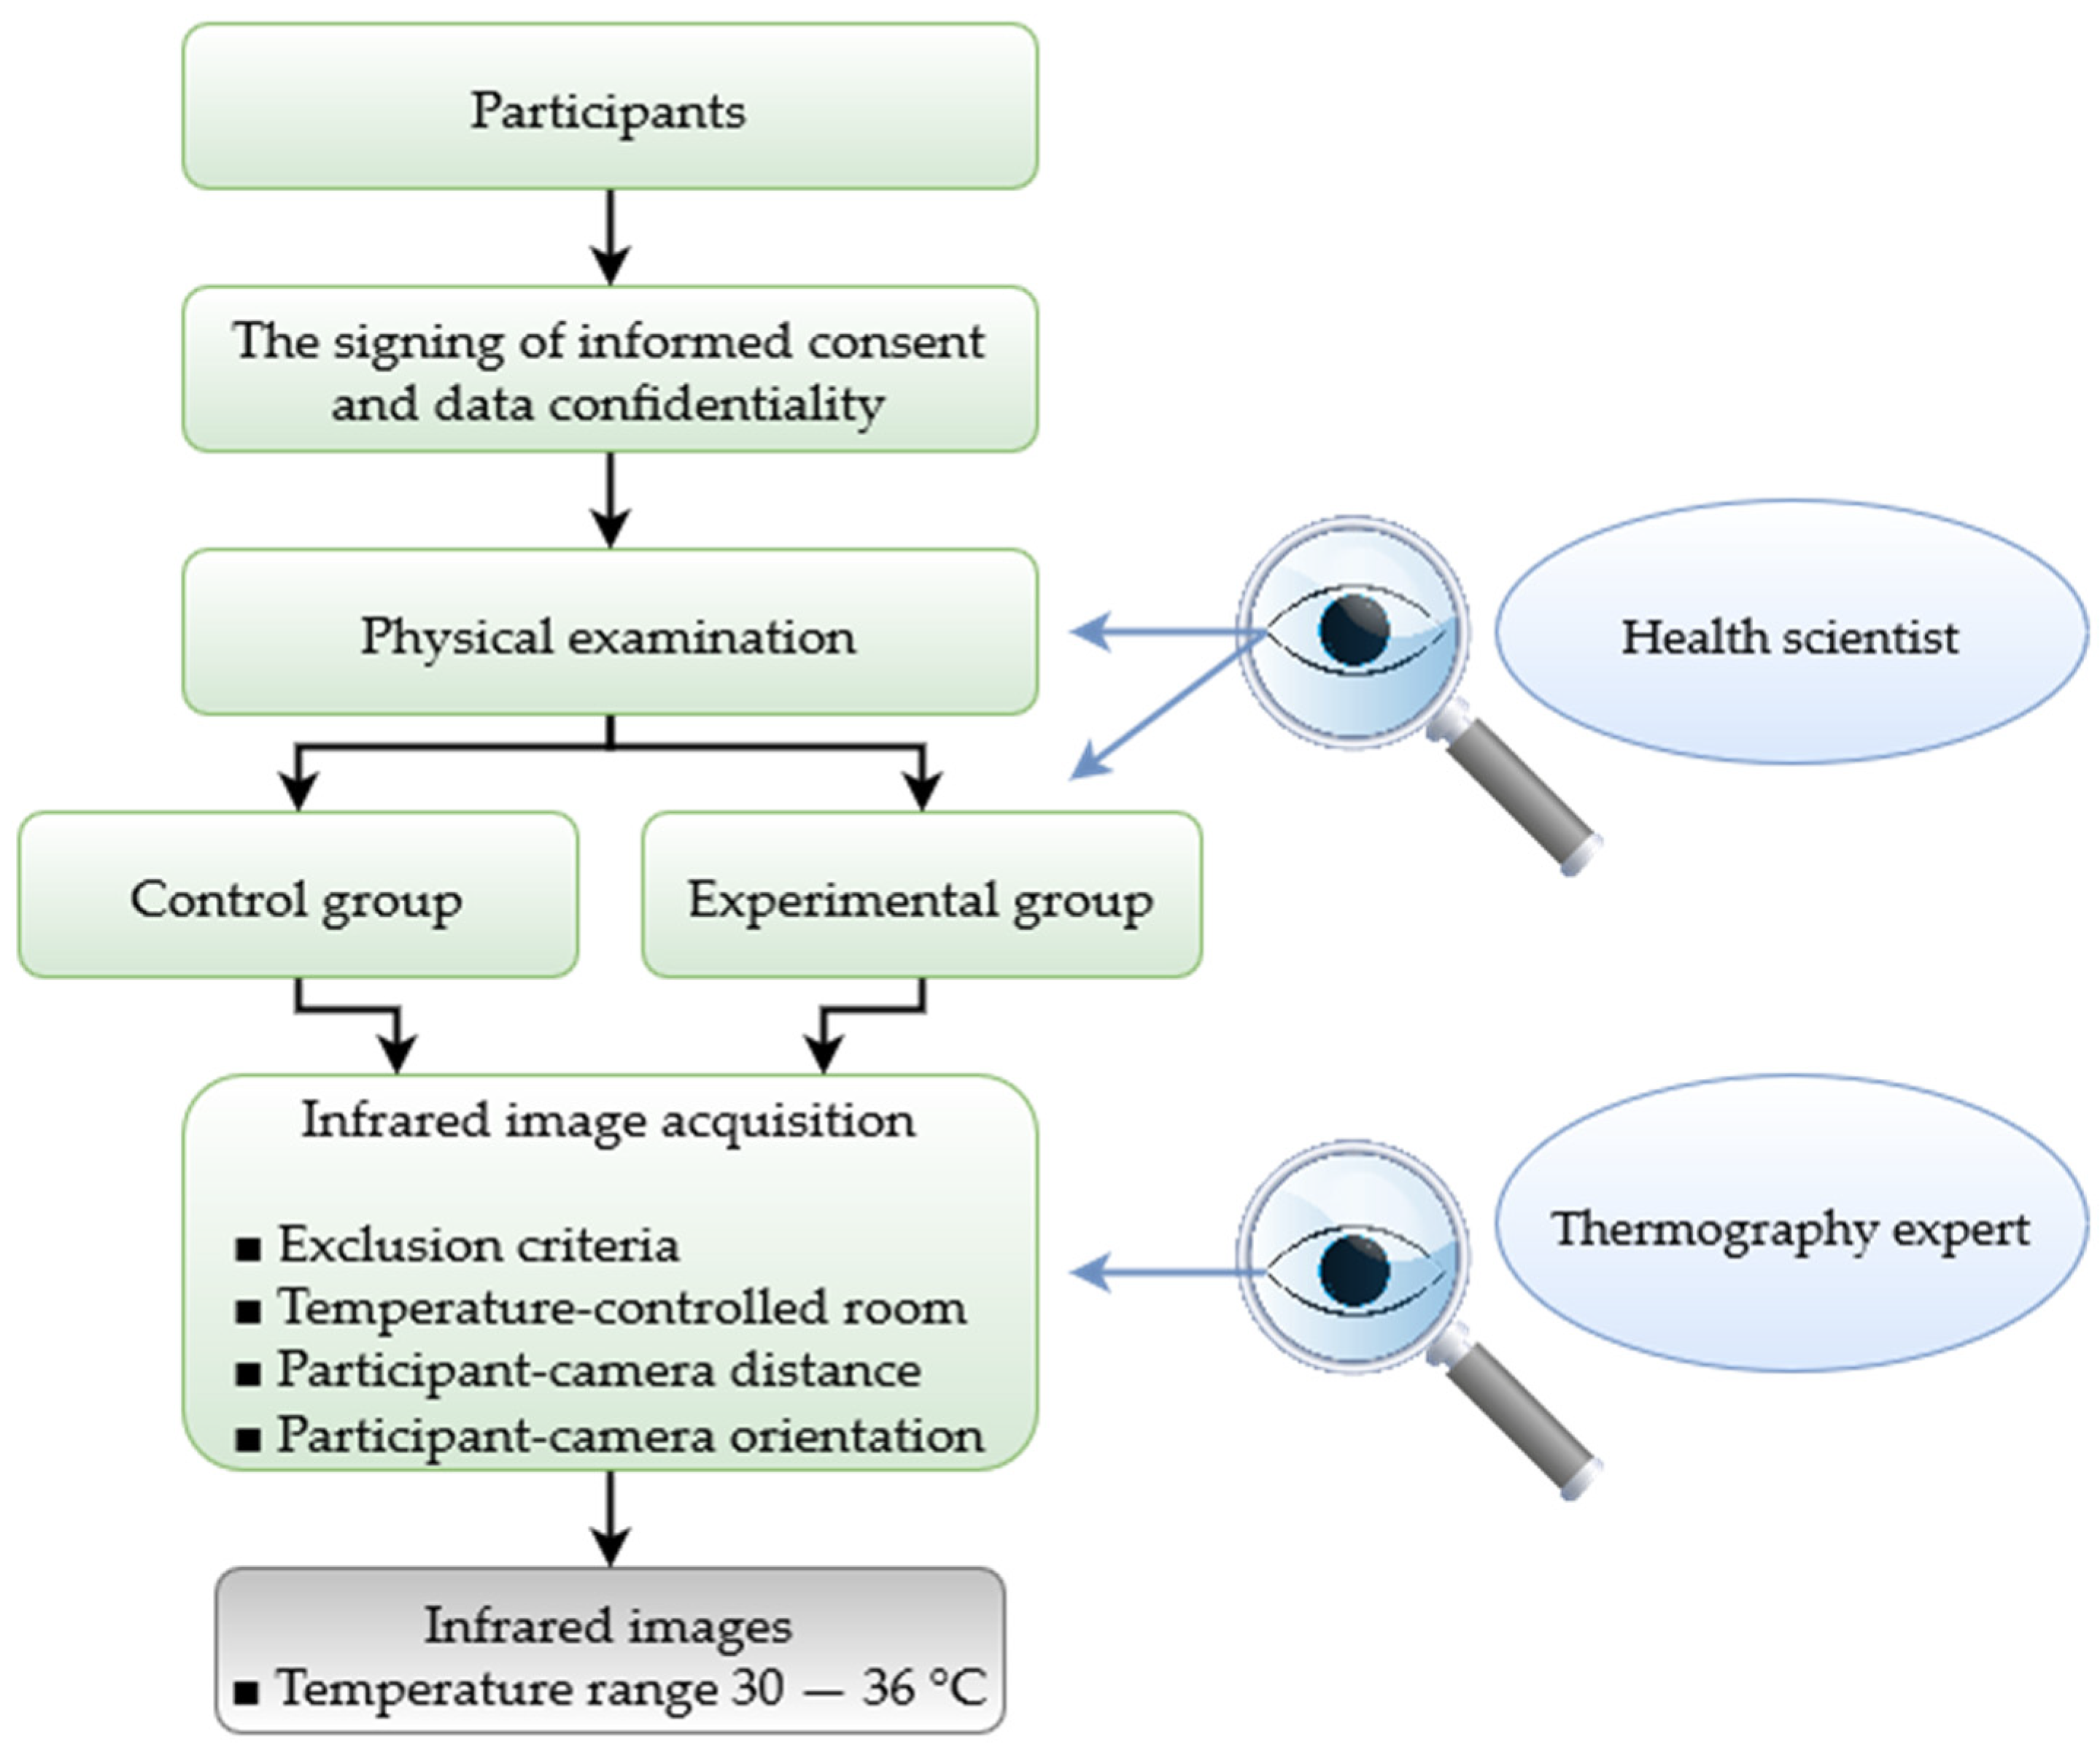
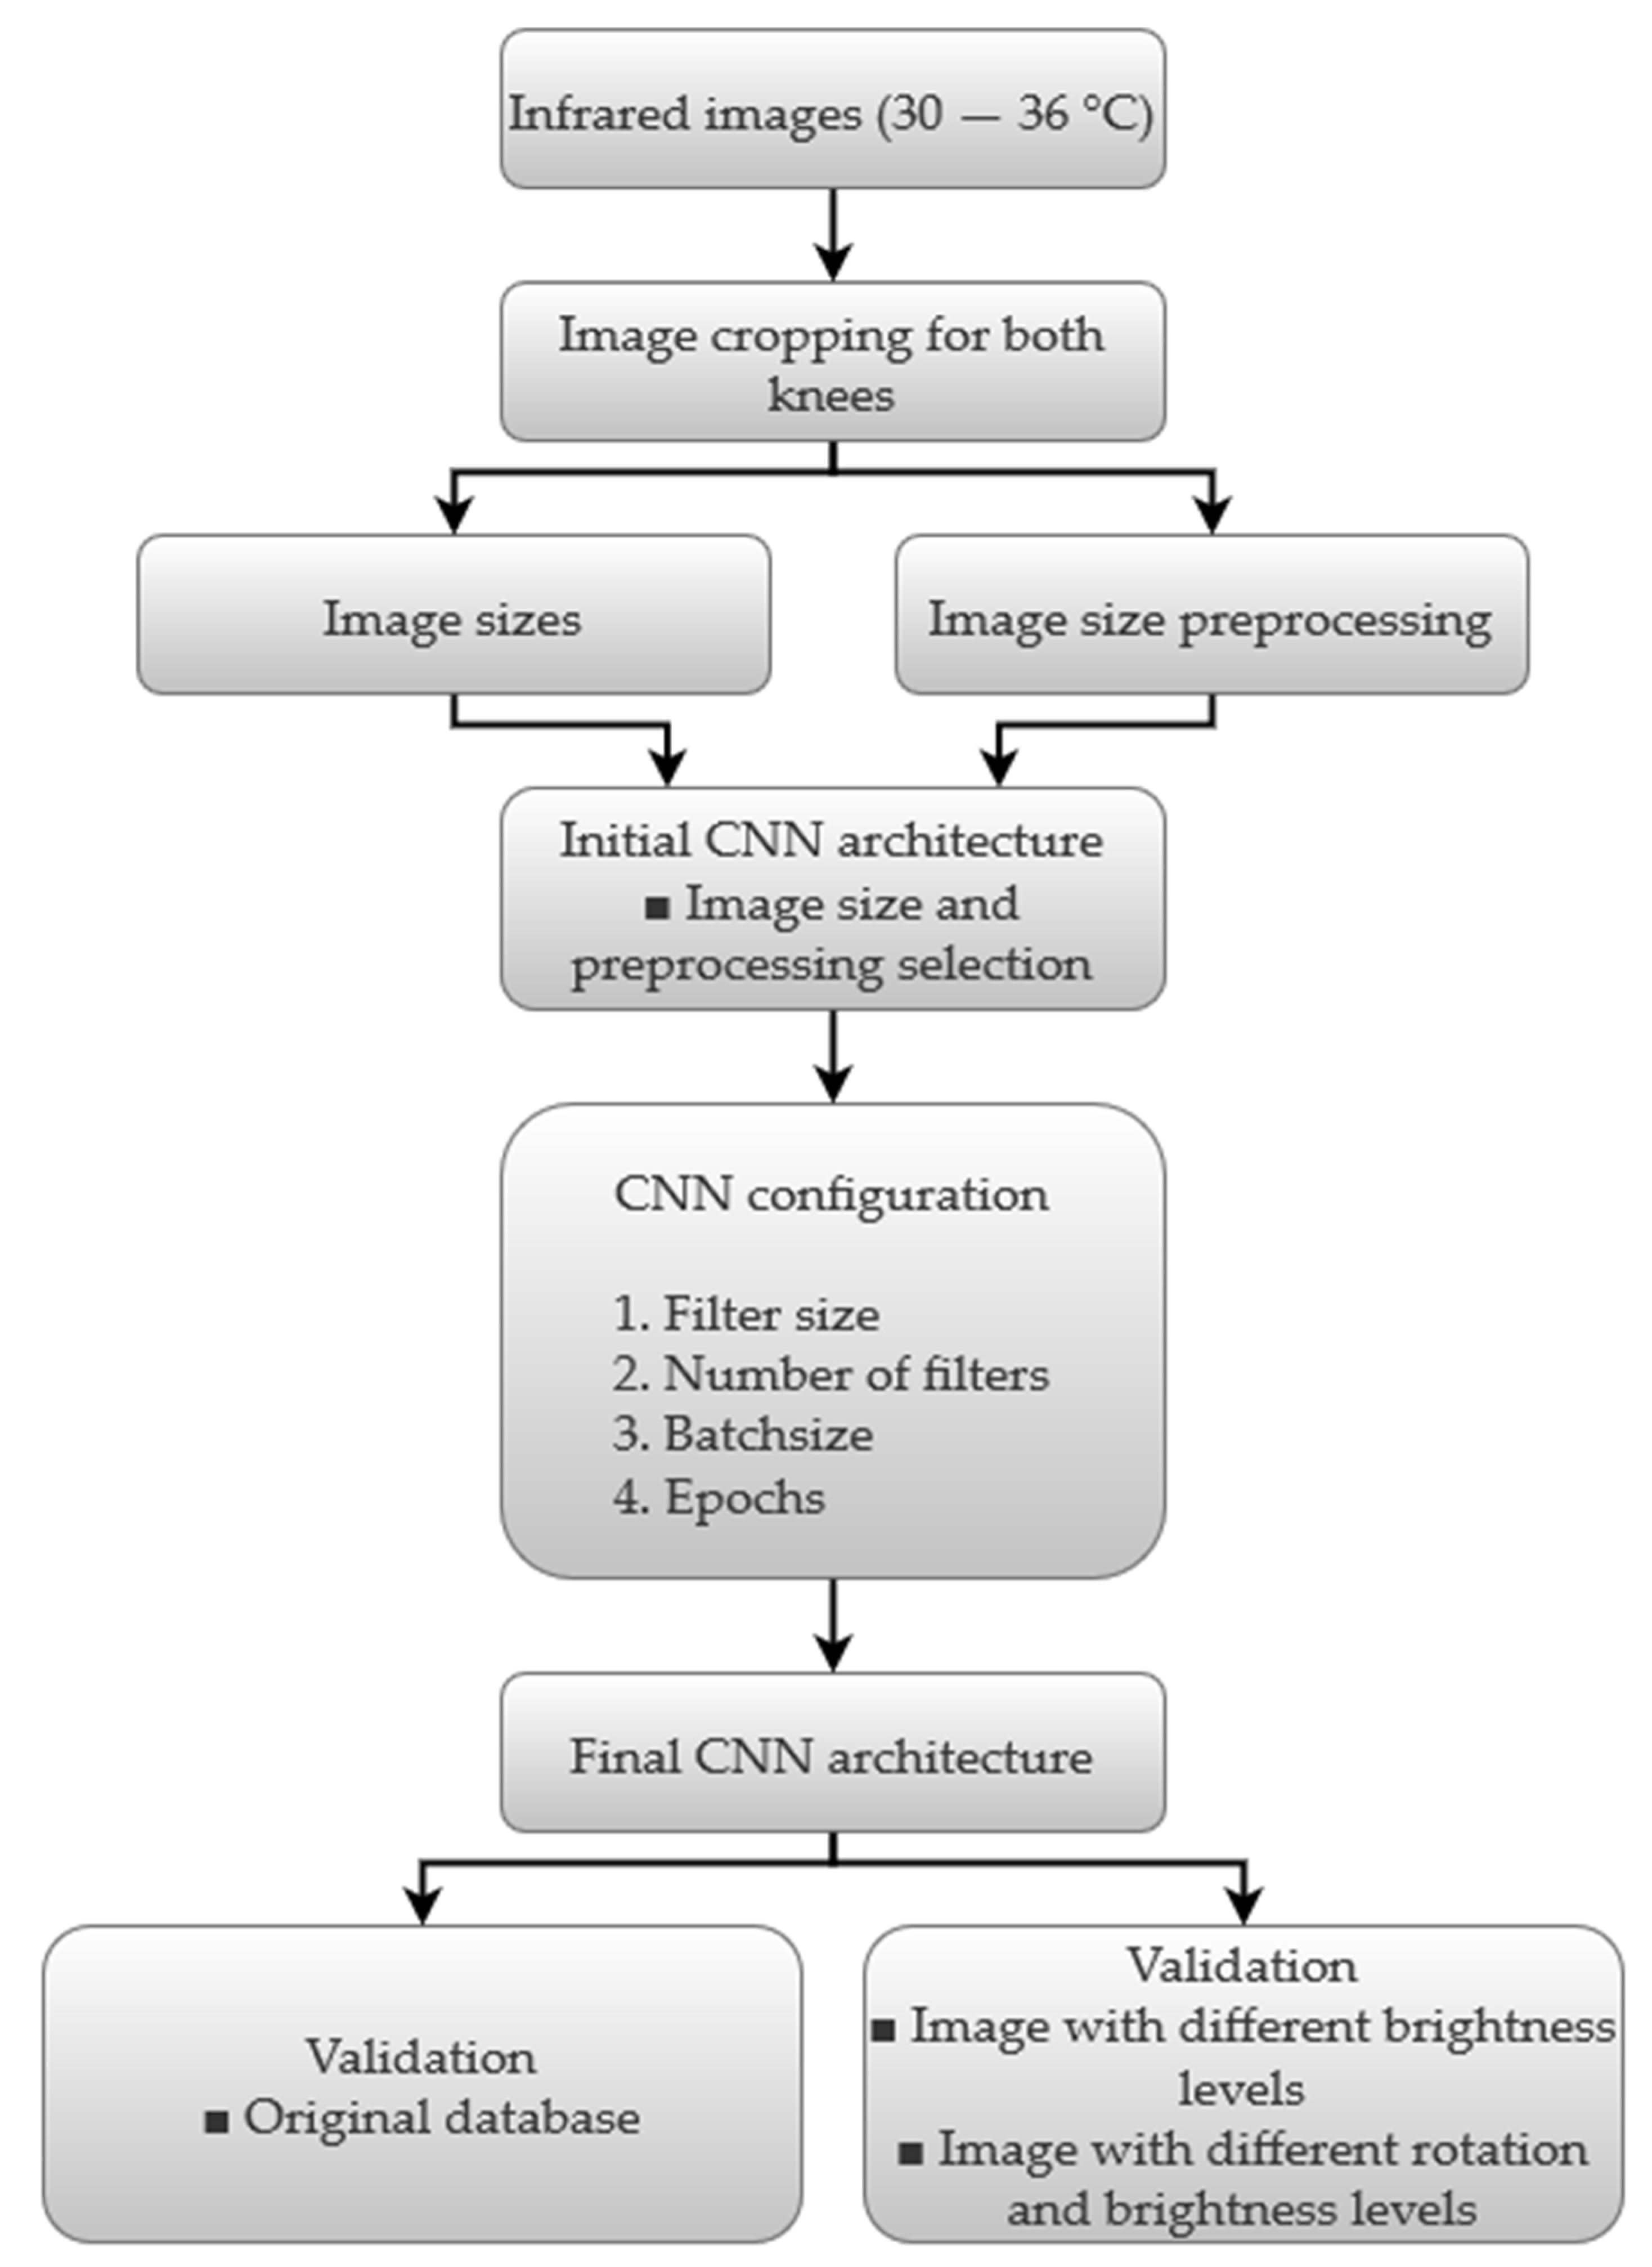
CNN, a novel deep learning method, is characterized by being an artificial neural networks (ANNs)-based method for the automatic recognition of images. To perform this task, it employs two stages (i.e., feature extraction stage and classification stage) for identifying the patterns encountered in the input images and classifying them according to the desired outputs in an automatic manner, eliminating hand engineering during the identification of patterns and testing [37,38]. In particular, a CNN is based mainly on four layers, namely the convolutional, pooling, fully connected, and softmax layer (see Figure 2).
Following the sequence of Figure 2, each input image, Ij, with a size h × ω, is convolved, ∗, with a set of filters, Fi, known as convolutional filters for extracting different patterns from the analyzed image. This process is determined by the following [38]:
y i = σ ( F i I j + B i )
where σ(·) is a non-linear activation function, and Bi represents the bias terms. Here, each filter, Fi, with a size k1 × k2, is convolved with a local region of the analyzed image with a stride, s1. The obtained outputs are the maps of features or patterns, yi, for each filter. They present a size of z1 × z2 and are calculated by the following [39]:
z 1 = h k 1 + 2 p s 1 + 1
z 2 = ω k 2 + 2 p s 1 + 1  
where p indicates a zero-padding parameter, which is generally selected with a value of 1 in order to maintain the same spatial resolution for the input and output [39]. The rectified linear unit, a nonlinear activation function, known as ReLu, f ( y i ) = m a x ( 0 , y i ) , is one of the most adequate and fastest function to learn and identify the nonlinear characteristics of each pattern map in a CNN [40].
Once the pattern maps have been obtained, they are employed as inputs to the next layer, known as the pooling layer, which is in charge of subsampling the dimensionality of the pattern maps in order to reduce the number of patterns to be processed in the next sub-CNN [41]. In particular, this layer passes a filter of dimension K1 × K2 with a stride (s2) through the pattern maps by obtaining either the maximum (max pooling) or average (average pooling) of the neighbor values selected by the proposed filter. Consequently, a reduced map, yi, is obtained, where its dimension, Z1 × Z2, is given by the following [40]:
Z 1 = z 1 K 1 s 2 + 1
Z 2 = z 2 K 2 s 2 + 1  
It should be noted that both approximations (max and average pooling) allow both for capturing invariant patterns and improving the generalization performance [42]. Hence, both approximations are investigated in this work in order to identify the most suitable for the studied phenomenon.
On the other hand, the patterns obtained by the previous sub-CNNs are linked to the layer known as the fully connected layer, a multilayer perceptron, for performing the feature recognition/classification. Finally, the desired outputs are generated by means of the SoftMax layer through a softmax transfer function. In this work, this layer is employed to determine the knee condition. A detailed description of CNN can be found in [39].
In order to provide a low-complex CNN architecture, two aspects are investigated in this work: (1) the number and size of filters in the convolution and pooling layers and (2) the batch size and the number of epochs.

3. Methodology

Figure 3 shows the general flowchart for the proposed methodology. In general, it consists of the following three stages: (i) database generation, (ii) image processing, and (iii) CNN design and validation. In the first stage, two sets of 48 images are acquired to conform the database, where the first set corresponds to the control group (i.e., a reference knee condition) and the second set corresponds to the experimental group (i.e., an injured knee condition). On the other hand, in the second stage, image processing is carried out, where the grayscale images, equalized images, and thermal images are obtained. Here, image augmentation by considering random rotation, salt-and-pepper noise, and different brightness levels is also considered. The goal is to increase the CNN robustness by training, validating, and testing the effectiveness of the CNN under these different and common real-life conditions. It is worth noting that the different brightness levels can somehow represent the conditions when the infrared camera is adjusted automatically; that is, the measurement temperature range can be slightly different by affecting the colorfulness of the image. Finally, in the third stage, different settings, such as the size of the input image, number and size of filters, subsampling methods, and the batch size for the CNN, are analyzed in order to assess and select a better CNN structure in terms of accuracy and computational cost.

4. Experimental Setup and Results

The experimental setup and the results obtained by the proposed method are described in the following subsections.

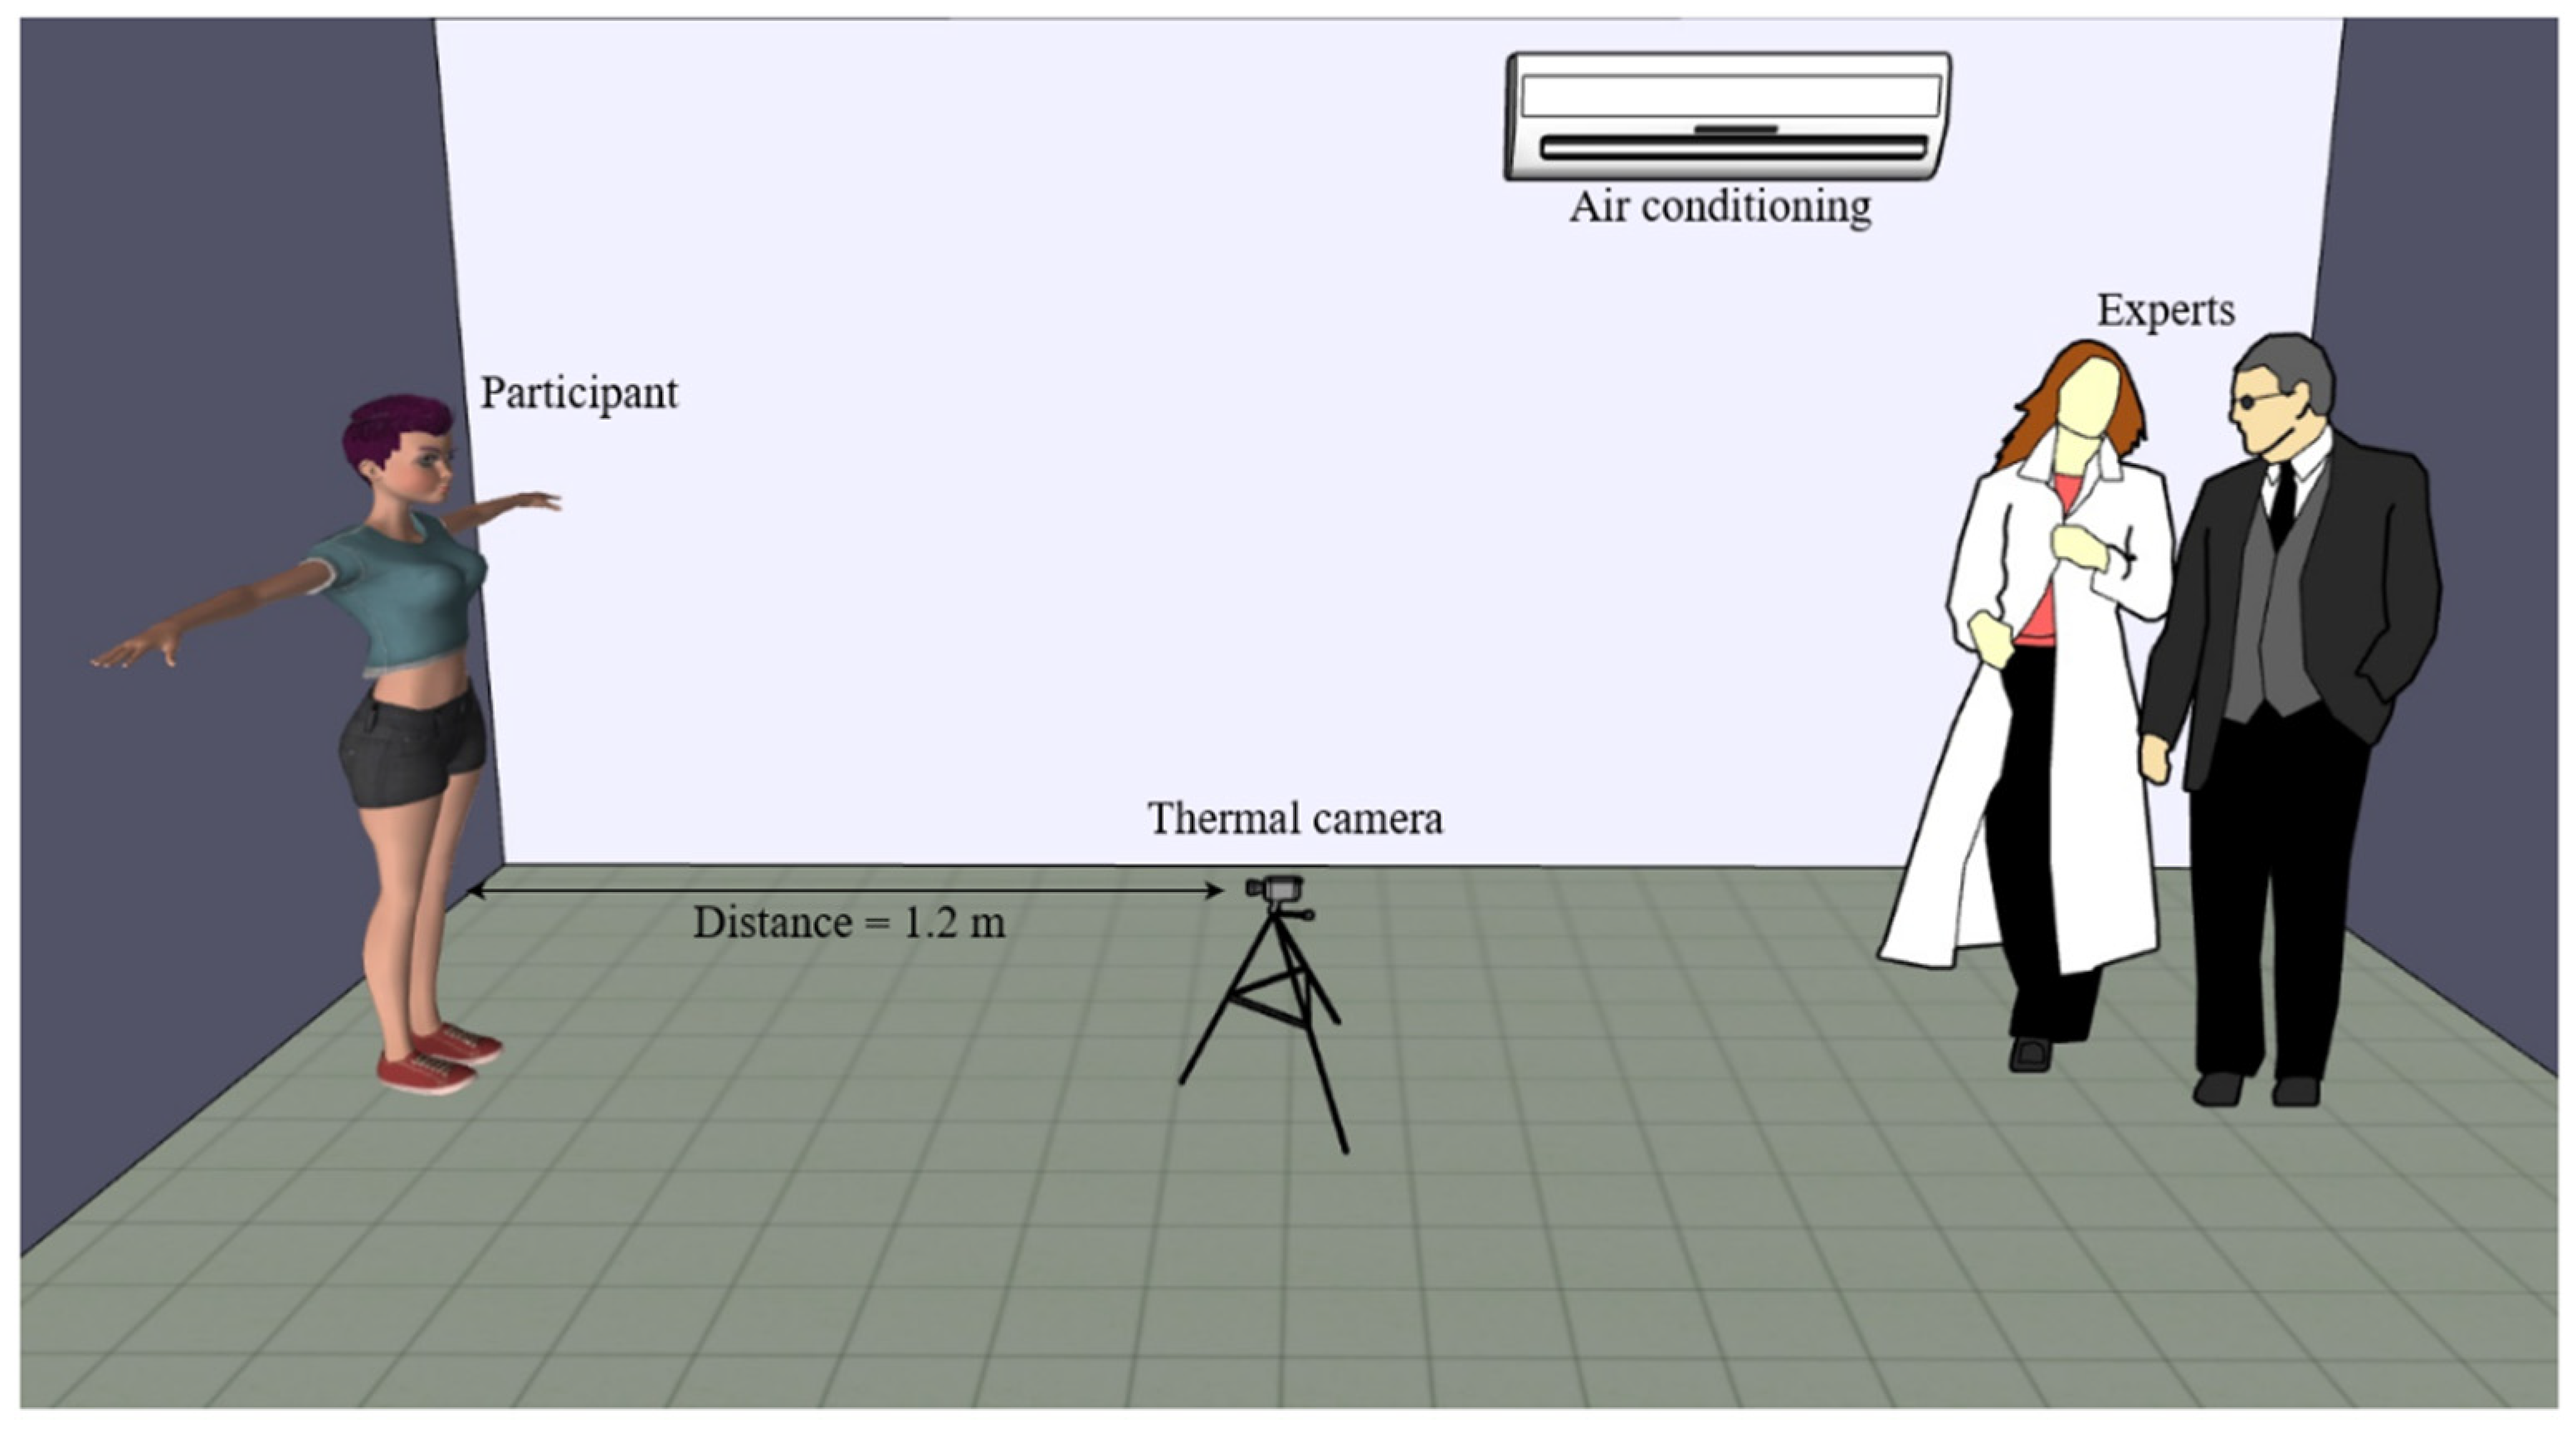
4.1. Experimental Setup

A group of 48 participants, i.e., 25 men and 23 women with an age range of 22.5 ± 4.5 years, was analyzed in this study. It is worth mentioning that most of the participants are young people involved in sports activities, with an average body mass index of 23.68 ± 2.71. The participants were selected by experts in the subject (i.e., personnel of the nursing faculty from the Autonomous University of Queretaro) who confirmed the knee condition of each participant. In this sense, two groups of 24 participants were generated: (1) the control group, where the participants present a healthy knee, and (2) the experimental group, where the participants present a certain type of alteration in the patella area. It is important to mention that all participants agreed and signed the letters of informed consent and data confidentiality; in addition, this research was approved by the ethics committee of the Autonomous University of Queretaro, under registration number CEAIFI-084-2020-TP.
During the experimental setup (see Figure 4) two instruments were used: (1) a thermal imaging camera manufactured by FLIR model GF320 with a resolution range of 320 × 240 pixels, a temperature range of −20 to 350 °C, and thermal sensitivity of 10 mK at 30 °C with ±1 °C of accuracy; and (2) an air-conditioning system model MAPS1211C with R410A refrigerant, which is used in order to maintain the space at a controlled temperature. The image preprocessing and CNN experimentation were implemented in MATLAB on a computer with an INTEL (R) Core i7-6500U ×64 processor at 2.50 GHz, 12.0 GB RAM.
For each participant, two thermographic images were acquired from the anterior region of the knees, resulting in a total of 96 thermographic images (48 from the control group and 48 from the experimental group). All the measured images were adjusted to a temperature range of 30–36 °C. In addition, it should be pointed out that the experimental setup follows the criteria for the use of thermography in humans [43]. In order not to affect the surface temperature of the skin, each participant must satisfy the following criteria: (i) not engaging in physical activity for at least 12 h before the test; (ii) avoiding the use of cosmetics; (iii) no consumption of alcoholic beverages or stimulants; (iv) no smoking; and (v) no taking medication, caffeine, or any other substance that might affect the test. The images were acquired in a room with a controlled temperature of 21 ± 2 °C, the distance established between the participant and the thermographic camera was 1.2 m, and the orientation of the participant toward the camera was frontal. A thermography expert and a health scientist evaluated, at any time, whether the acquisition protocol was accomplished (see Figure 4). Figure 5 shows the flowchart for the experimental setup, which includes from the selection of the participants to the acquisition of the infrared images.
Table 1 summarizes the settings of the experiment carried out.

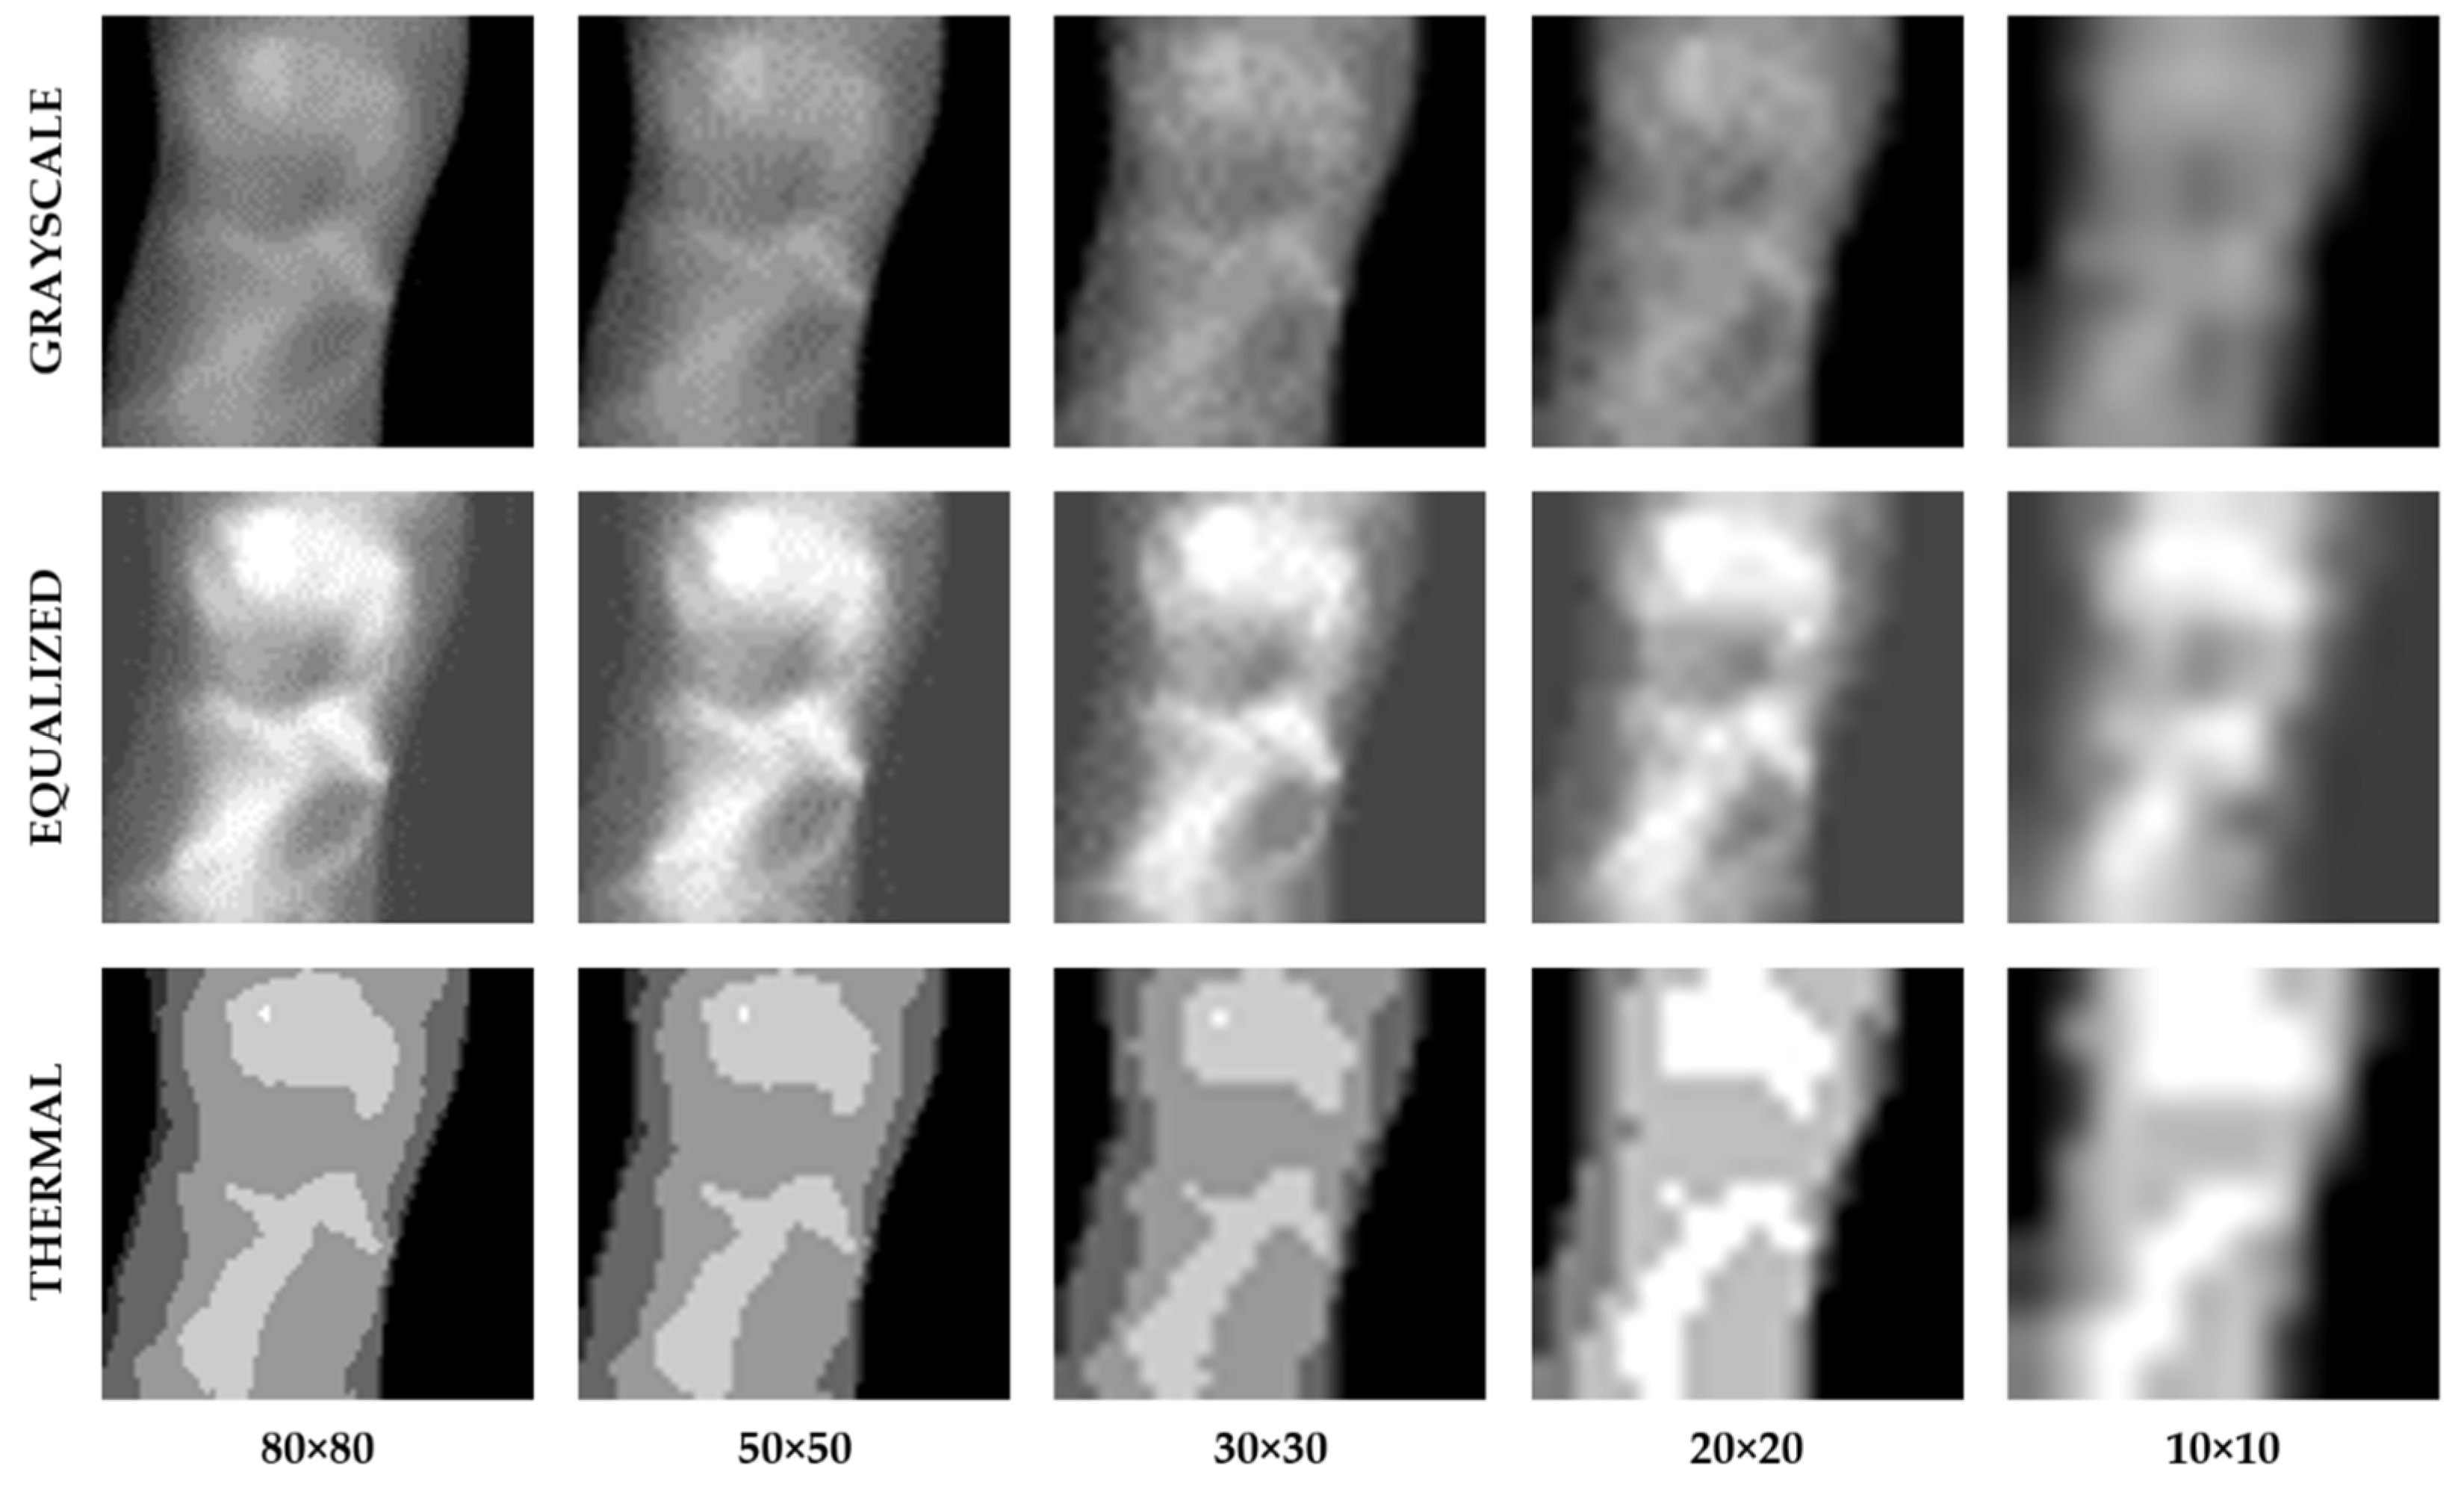
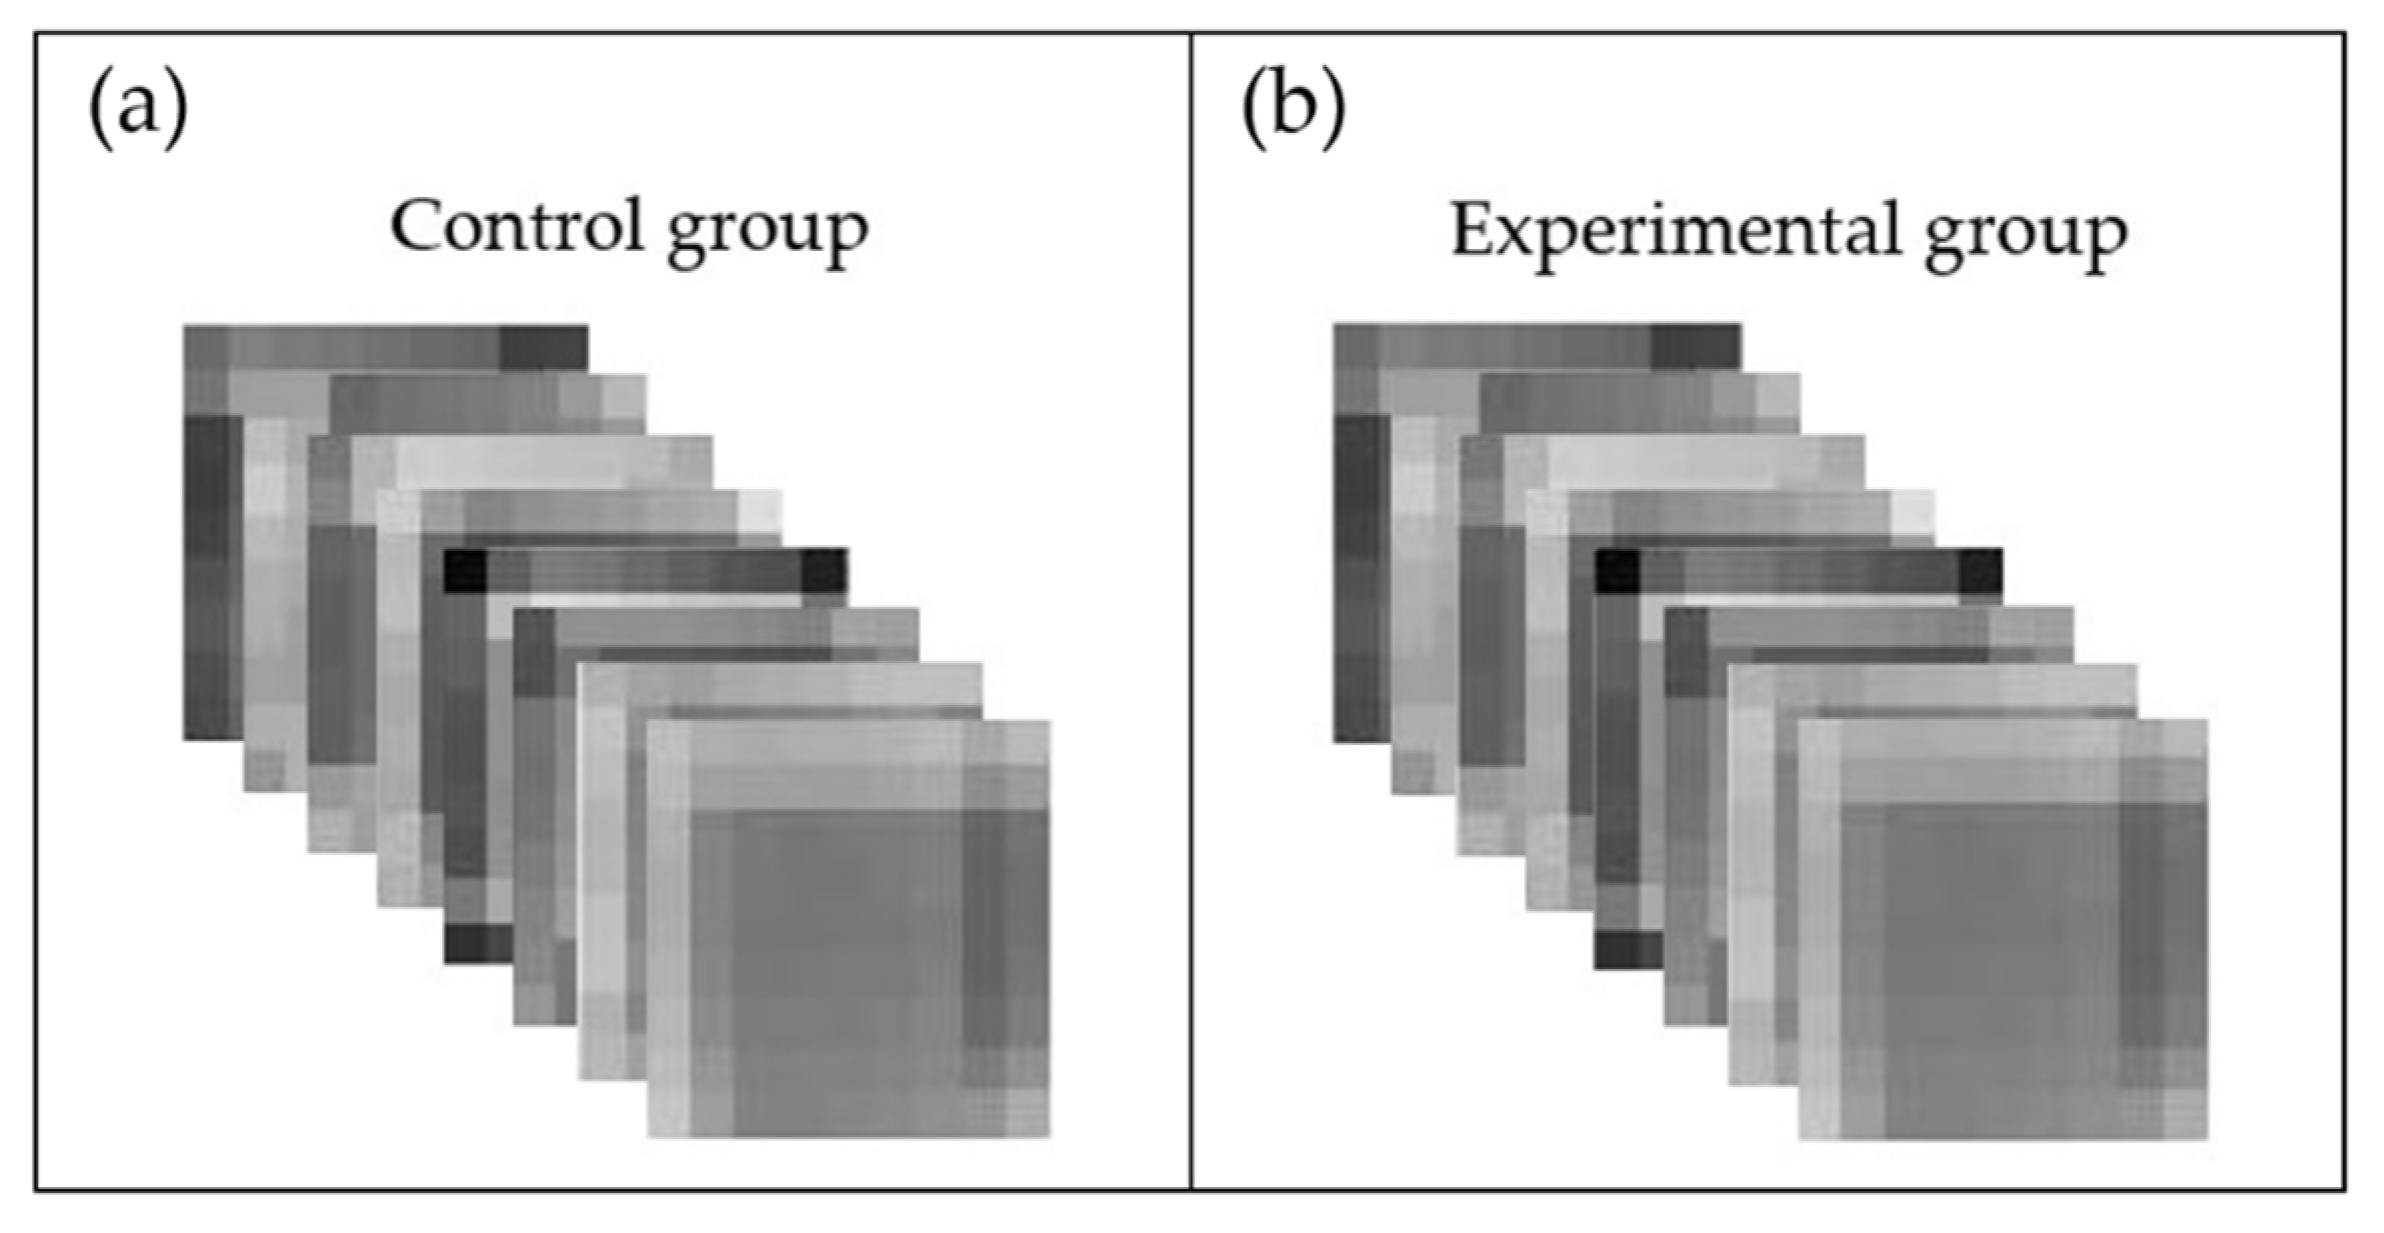
4.2. Image Size Preprocessing
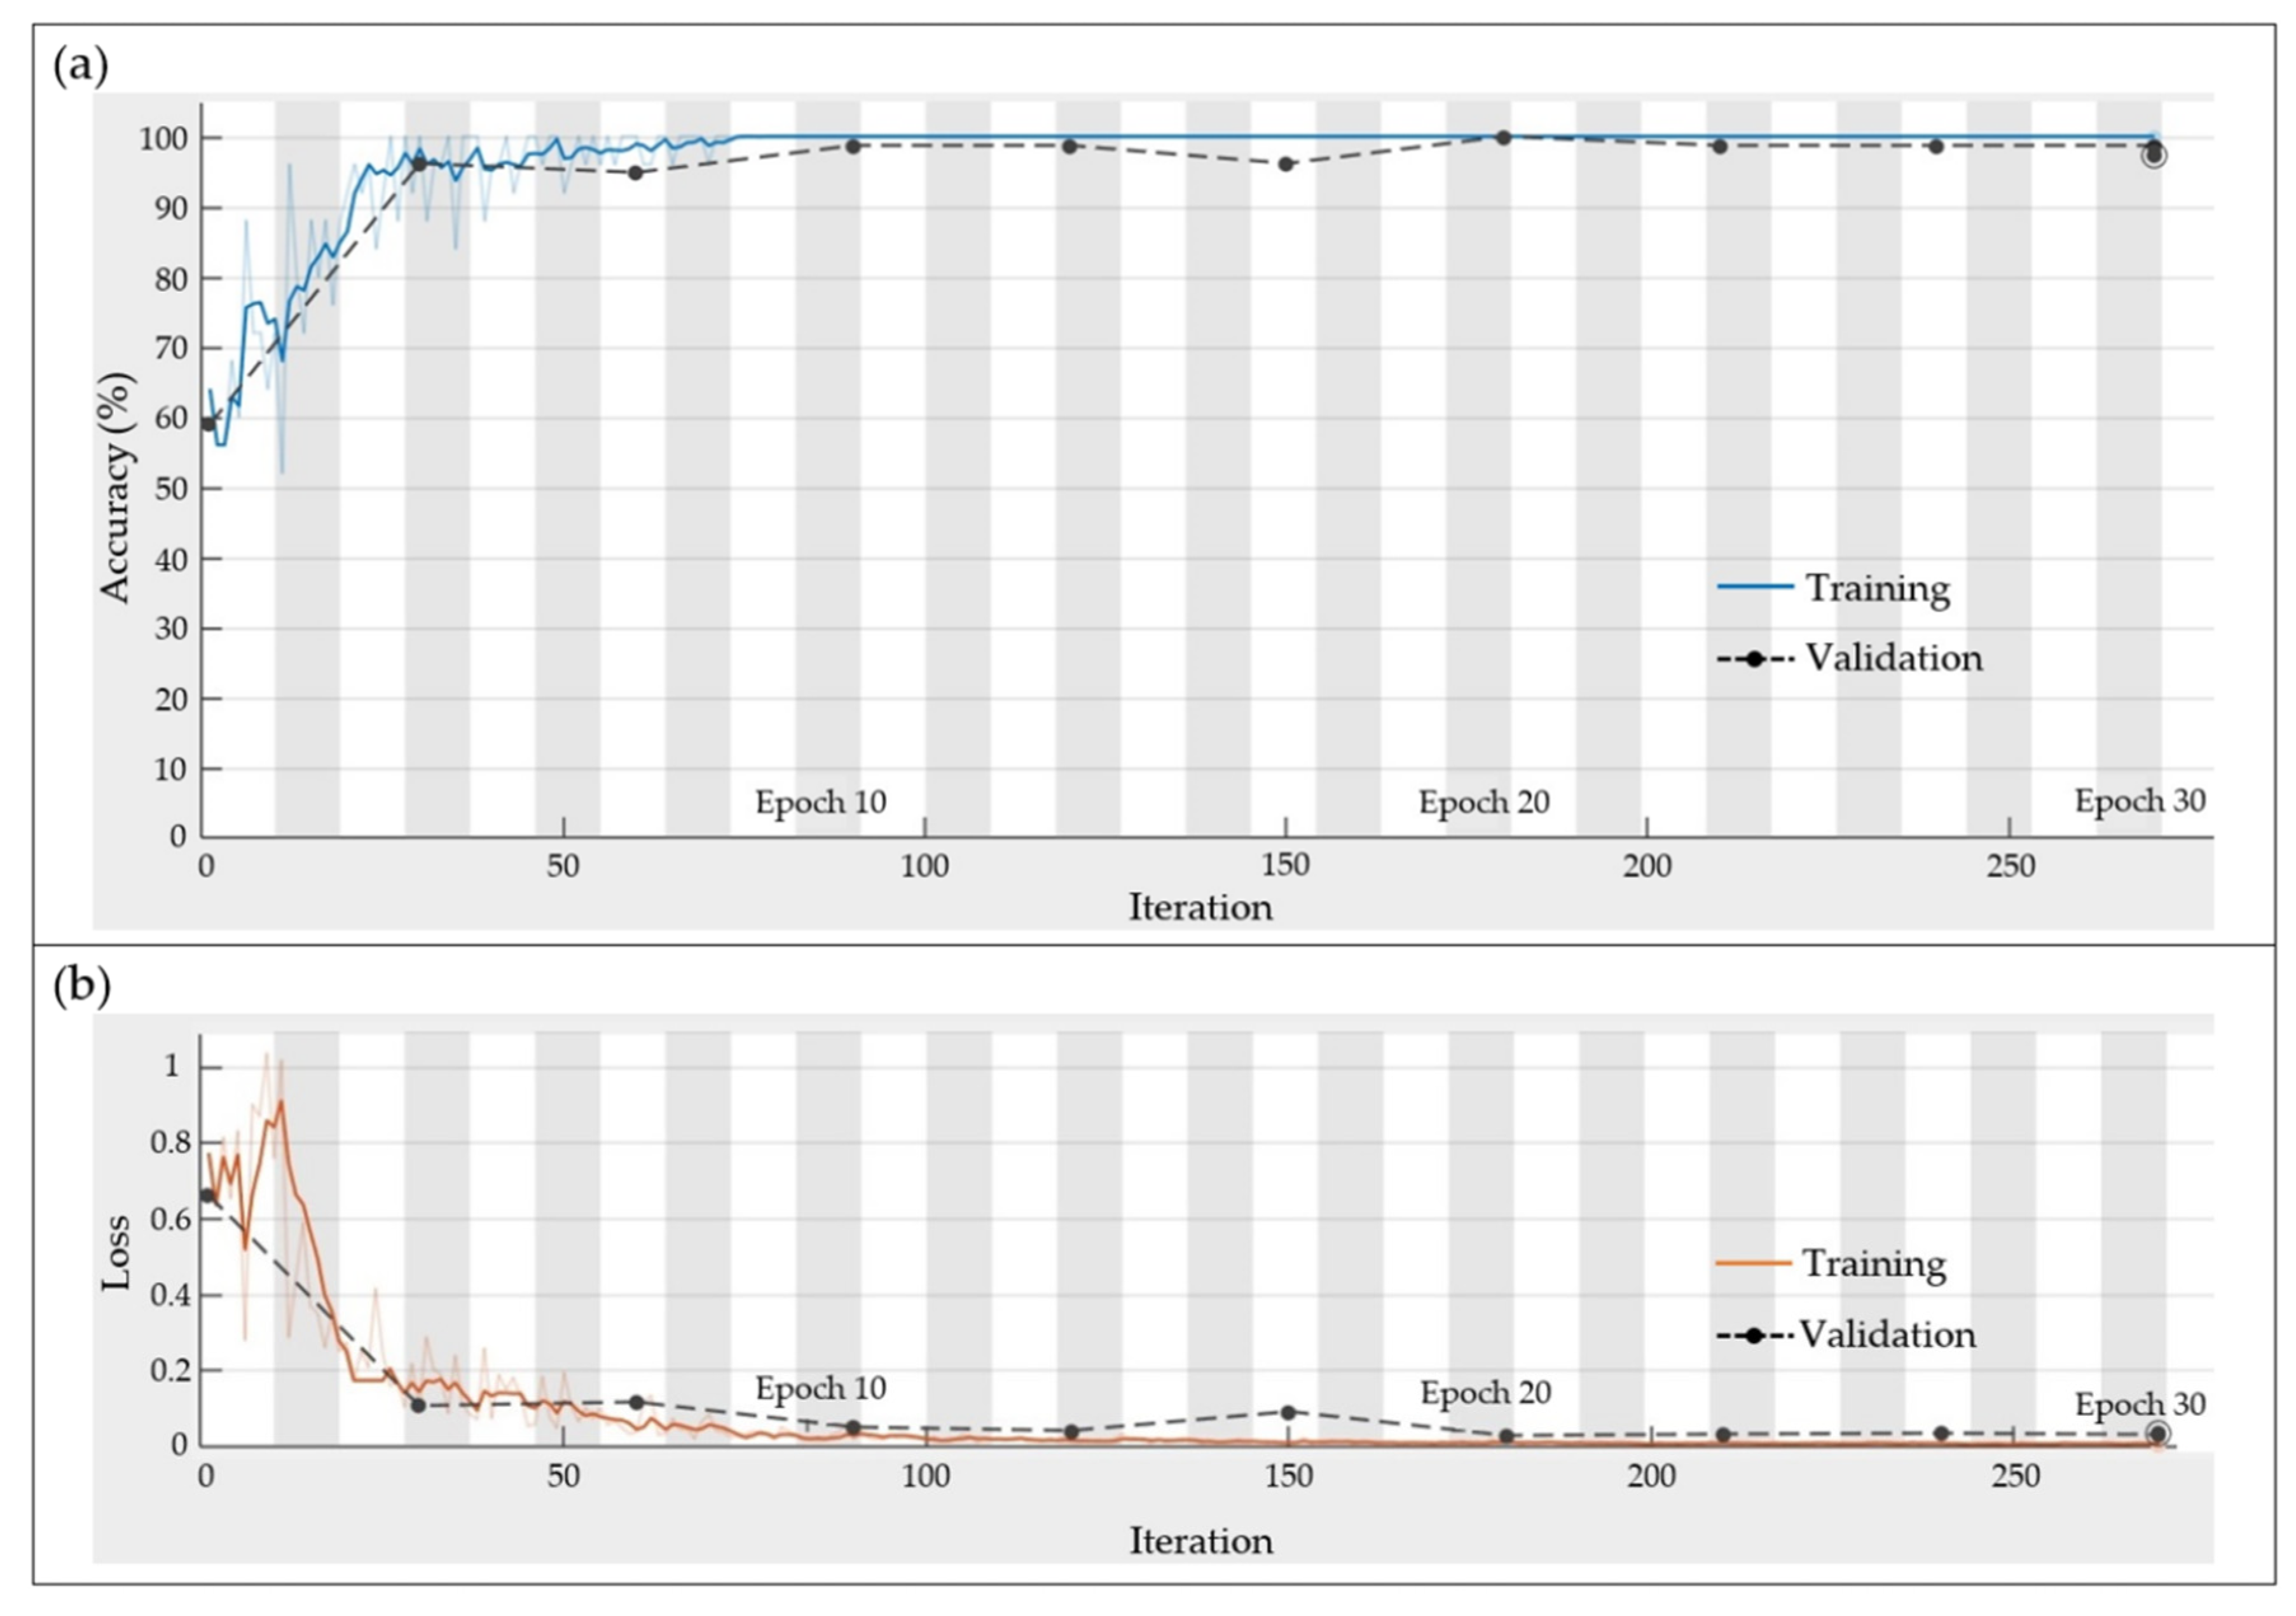
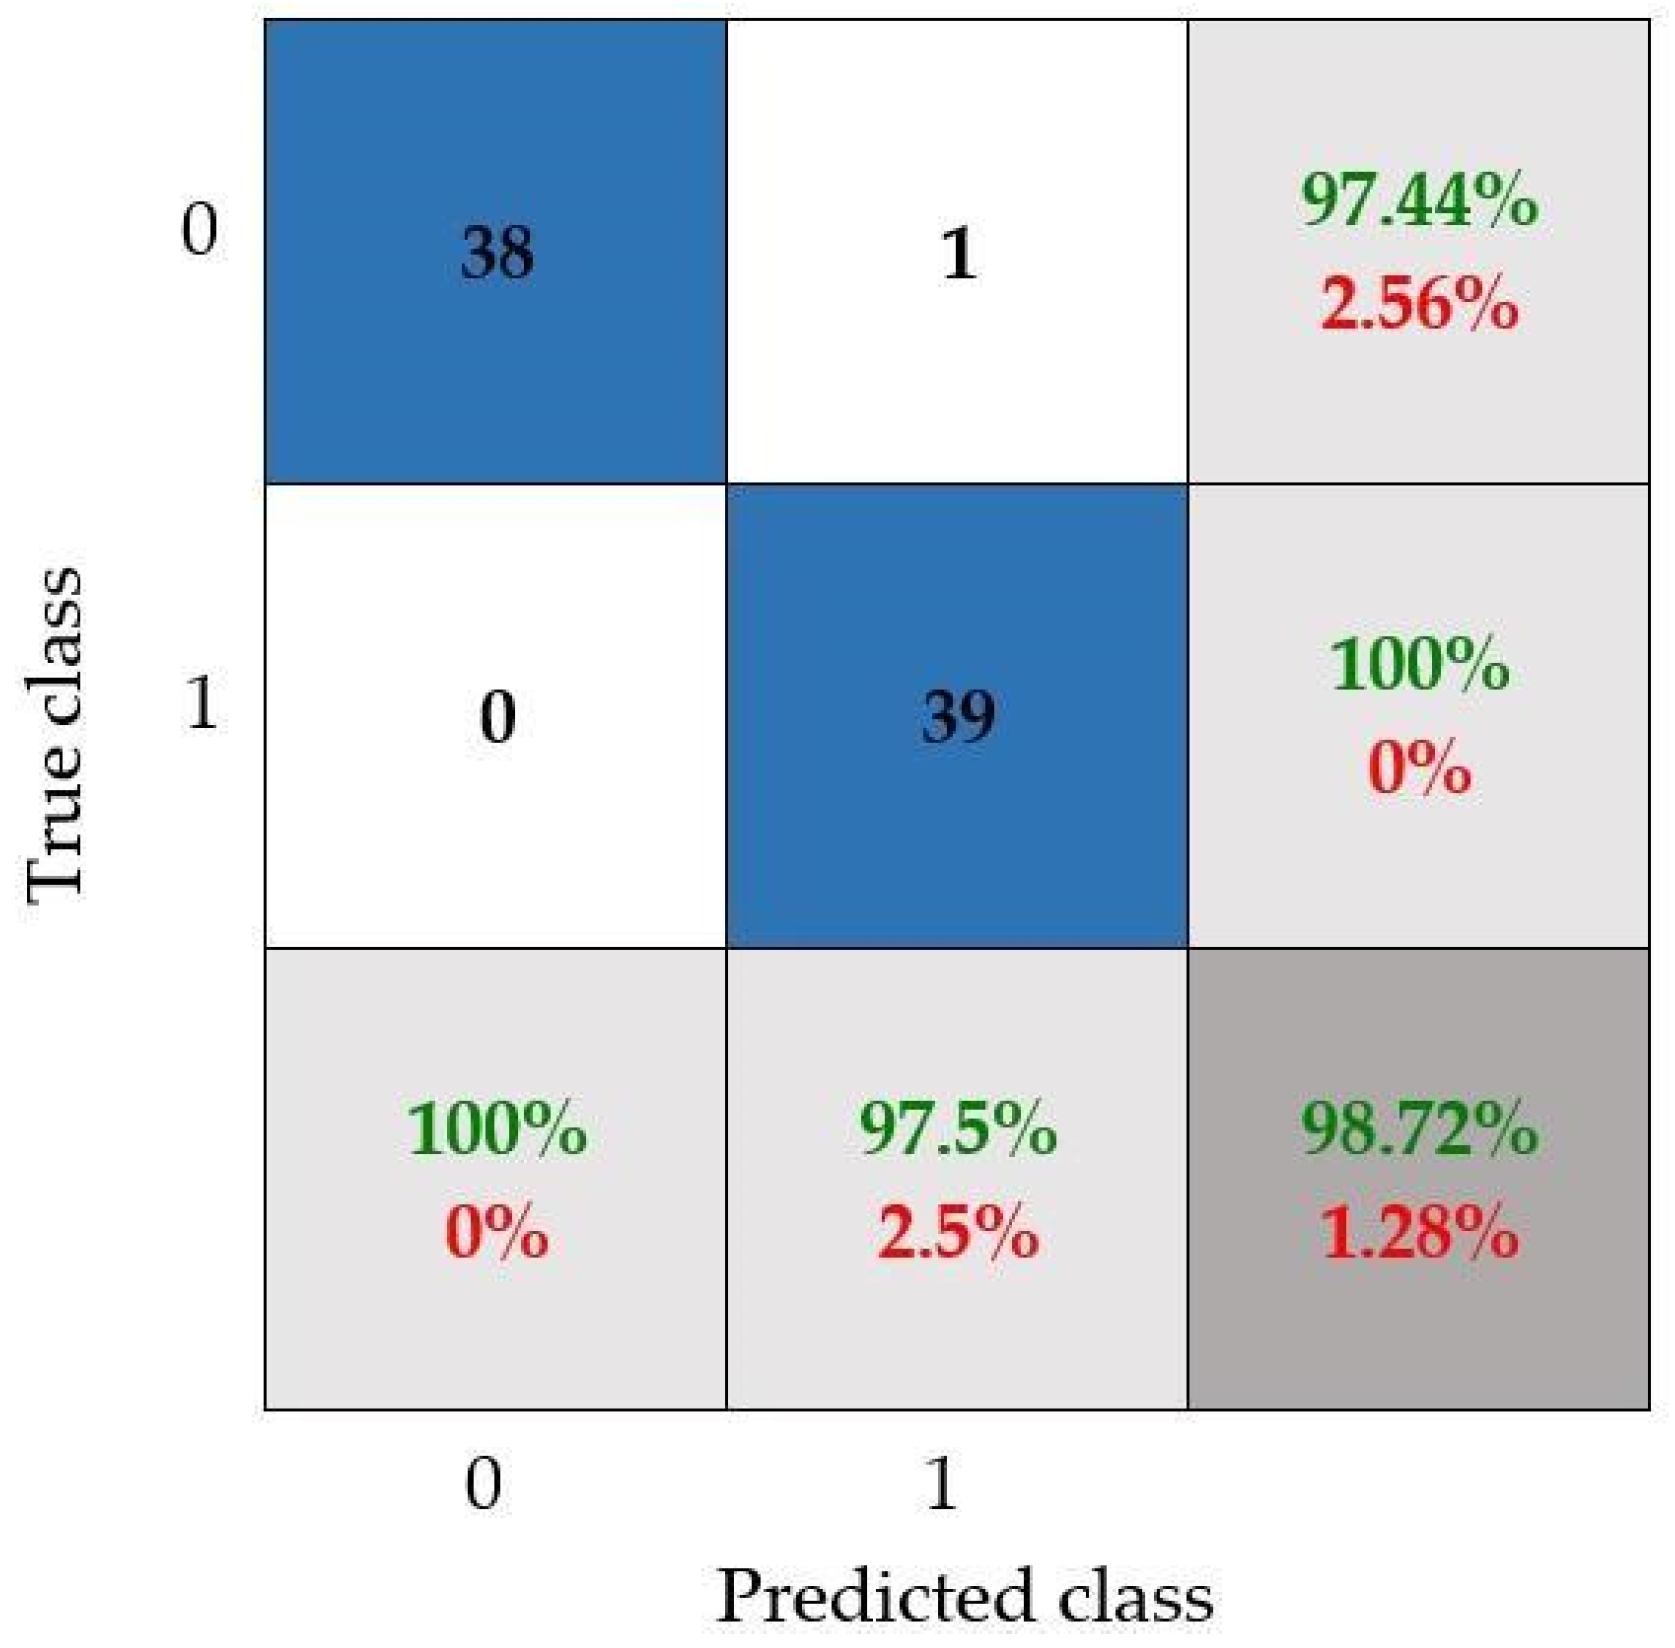
Because the injury presented by the participants is bilateral (i.e., in both knees), all the images were cropped in the region of interest (i.e., left knee and right knee), thus obtaining for each group 96 images with a size of 80 × 80 pixels. In order to investigate the impact of the image size on a CNN structure, each image was modified to 50 × 50, 30 × 30, 20 × 20, and 10 × 10 pixels, where the goal was to establish a trade-off between accuracy and computational cost. Image preprocessing was also applied to each image according to Section 2.2, obtaining grayscale images, equalized images, and thermal images, where the goal was to help CNN in highlighting relevant features in the input images and, consequently, reduce the CNN’s complexity. Figure 6 shows the results obtained by each preprocessing. The thermal matrix values were normalized and multiplied by 255 to change the grayscale range of the thermal image, making it clearer for the reader. In addition, the smaller images were enlarged in order to obtain a better visualization.

4.3. CNN Results

In order to observe the impact of the image size on the CNN, an initial CNN architecture was selected with the following configuration: a number of inputs according to the image size, 3 × 3 as filter size, 8 filters, a pooling stage of 2 × 2, and 10 epochs with a batch size of n/5 for the training. The preliminary size of the database is n = 192. The results obtained by the proposed CNN for the different image configurations are summarized in Table 2.
According to the results presented in Table 2, the grayscale and thermal images with sizes 30 × 30 and 20 × 20 were selected for the next stages of experimentation and improvement of the CNN configuration, since they gave a better performance in terms of accuracy and training time. It is worth noting that the lower values of accuracy for the larger images (80 × 80 and 50 × 50) are due to the underfitting or poor training of the CNN because of the limited number of epochs that is initially selected; on the other hand, the smallest image (10 × 10) generates a low accuracy because of its poor image resolution.
With the selected images, different parameters of the CNN were fine-tuned in the stage (recounted in the next subsection) in order to improve accuracy and reduce computational cost.

CNN Configuration

To have an efficient CNN configuration, different tests shown in the flowchart of Figure 7 were carried out.
The grayscale and thermal images conform a database with n = 384 images, i.e.,192 images for the control group and 192 images for the experimental group. The number of images established for the training of each group was 114, i.e., 59.37% of the database. The remaining images were used for validation.
As previously mentioned, CNN experimentation was performed with different configurations: (1) filter size (3 × 3, 4 × 4, and 5 × 5), (2) number of filters (4, 8, 12, and 16), (3) batch size (25, 50, 80, 128, 192, and 384), and (4) number of epochs (5, 10, 20, and 30). The experimentation was carried out step by step, extracting the best characteristic in each step and modifying only the remaining parameters. Figure 8a shows the results for the initial CNN configuration, for which three different filter sizes were tested. The results are grouped according to the image size. From the obtained results, the 4 × 4 and 5 × 5 filter sizes were chosen. In Figure 8b, the results for different numbers of filters are presented. According to the obtained results, the use of 8 filters was selected as the best number. In the next step, the batch size (BS) was modified at different levels, as shown in Figure 8c, obtaining the highest accuracy (96.67%) for a BS of 25. Finally, the number of epochs was also changed, as shown in Figure 8d, leading to the final configuration of the CNN, i.e., an image size of 30 × 30, a filter size of 5 × 5, 8 filters, a size of 25 as BS, and 30 as the number of epochs. Figure 9 shows the final CNN architecture. In addition, Table 3 summarizes the parameters of the enhanced or final CNN architecture.
After obtaining the final structure of the CNN, the training and validation were completed. Figure 10 shows the extracted patterns by the CNN for each group. Figure 11 shows the results obtained for accuracy and loss, where it is observed that the graph converges after the iteration 80. The validation was performed with 20.31% of the database, i.e., 78 images. Figure 12 shows the accuracy obtained between the true class and the predicted class through the confusion matrix. These results correspond to 98.72% of accuracy, 97.5% of precision, 100% of recall, and 98.70% of F1-score, demonstrating the effectiveness of the CNN for identifying the control and experimental groups.
Finally, to test the effectiveness of the CNN under more demanding scenarios, two different conditions in the input images were considered. The first one consisted of three different brightness levels, i.e., increments of 10%, 20%, and 30%, in order to consider a slight change in the color palette range of the original thermographic images because of the automatic adjustment of the thermal camera. The second scenario consisted of three brightness levels with a random rotation in a range from −20° to 20° in order to consider that the posture of the participants may vary during the acquisition stage. The obtained results for accuracy, precision, recall, and F1-score are shown in Table 4 for both scenarios. Figure 13a shows some resulting images. The best obtained results are presented in the confusion matrix in Figure 13b, with 97.44% for accuracy, 100.00% for precision, 95.12% for recall, and 97.50% for F1-score, which are highlighted in Table 4 with a gray color. These indicators show that, despite the adjustment of the rotation and brightness of the input images, the groups can be identified with high accuracy.

5. Discussion

The results obtained in different works for automatic knee-injury identification based on image analysis are shown in Table 5. In particular, this table describes the method used, the input image type, and the accuracy obtained in each investigation. It can be observed that the proposed method, based on thermographic images, presents the best accuracy results, i.e., 97.44%. In addition, it is important to mention that thermography is a tool that is easy to use, innocuous, non-contact, and does not emit radiation; therefore, the proposed work can be considered a better solution than the one provided for other works from a technological viewpoint. Another advantage of this proposal that should be emphasized is that it is based only on both a preprocessing of the thermographic images and a basic CNN configuration, resulting in a lower computational load than the one required by other methods that consist of complex configurations.
Despite the good results provided by proposed method, two limitations are found: (1) The number of patients is limited; hence, it is necessary to increase the number of participants, including a wider age range. (2) Only one alteration into the knee (patellar pain) was taken into account, so it is important to have participants with other alterations in order to calibrate the proposal under these new circumstances.
Finally, it is important to point out, as was mentioned before, that the use of thermography in humans requires specific criteria, such as the distance between the knee and camera, age, body composition, prevalence of smoking, alcoholic beverages, and caffeine consumption. On the other hand, one of the most important factors for the repeatability of the experiment is to take care of the exclusion criteria at the time of acquiring the thermographic images, so it is necessary to have similar conditions for further comparisons with another type of alteration in the knee.

6. Conclusions

In this work, as a main contribution, a methodology based on infrared thermography and convolutional neural networks for differentiating between a healthy knee and an injured knee is proposed. The methodology consists of (i) the use of thermographic images that are preprocessed to obtain and analyze different types of images, i.e., grayscale images, equalized images, and thermal images; and (ii) the development of a basic CNN structure for automatic classification.
In this regard, the main findings are as follows:
  • The proposed CNN architecture is one of the most basic architectures; consequently, the computational burden is lower than the one required by others works. Therefore, the proposal becomes an attractive and suitable solution if low-end processors are used.
  • The CNN model that has been configured by following the proposed methodology reached 98.72% accuracy, allowing us to adequately differentiate between both knee conditions.
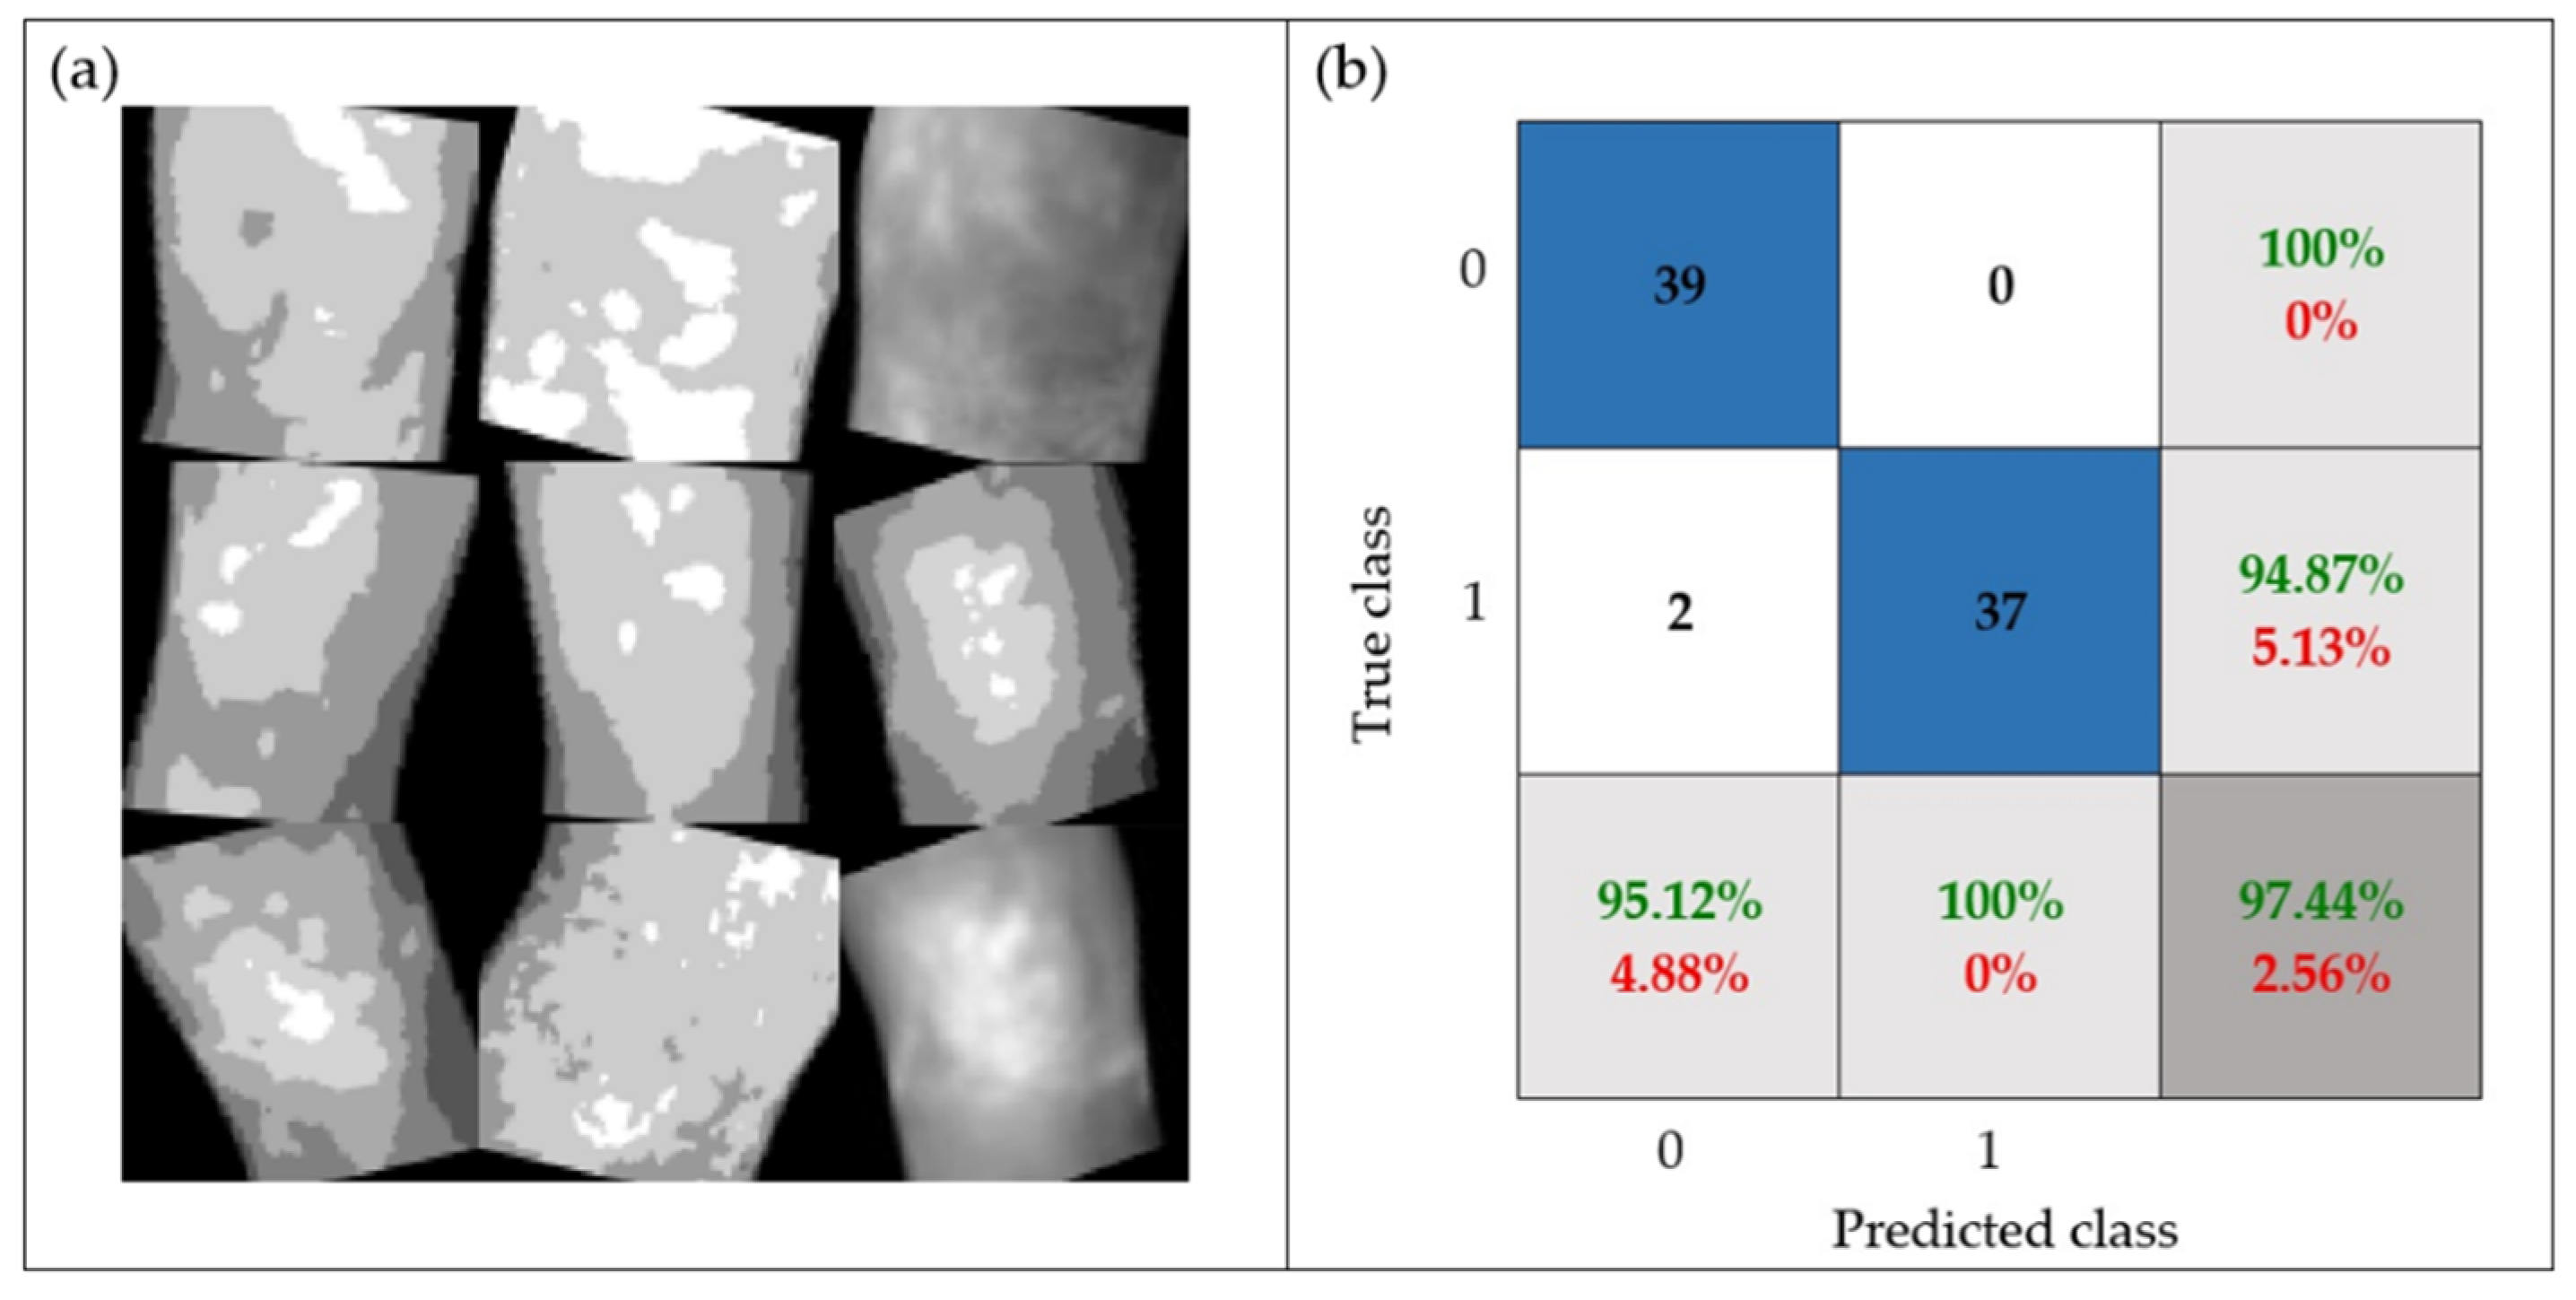
  • The robustness of the proposal was tested through a set of images with random rotation angles and different levels of brightness (i.e., possible real conditions in practice), achieving 97.44% accuracy.
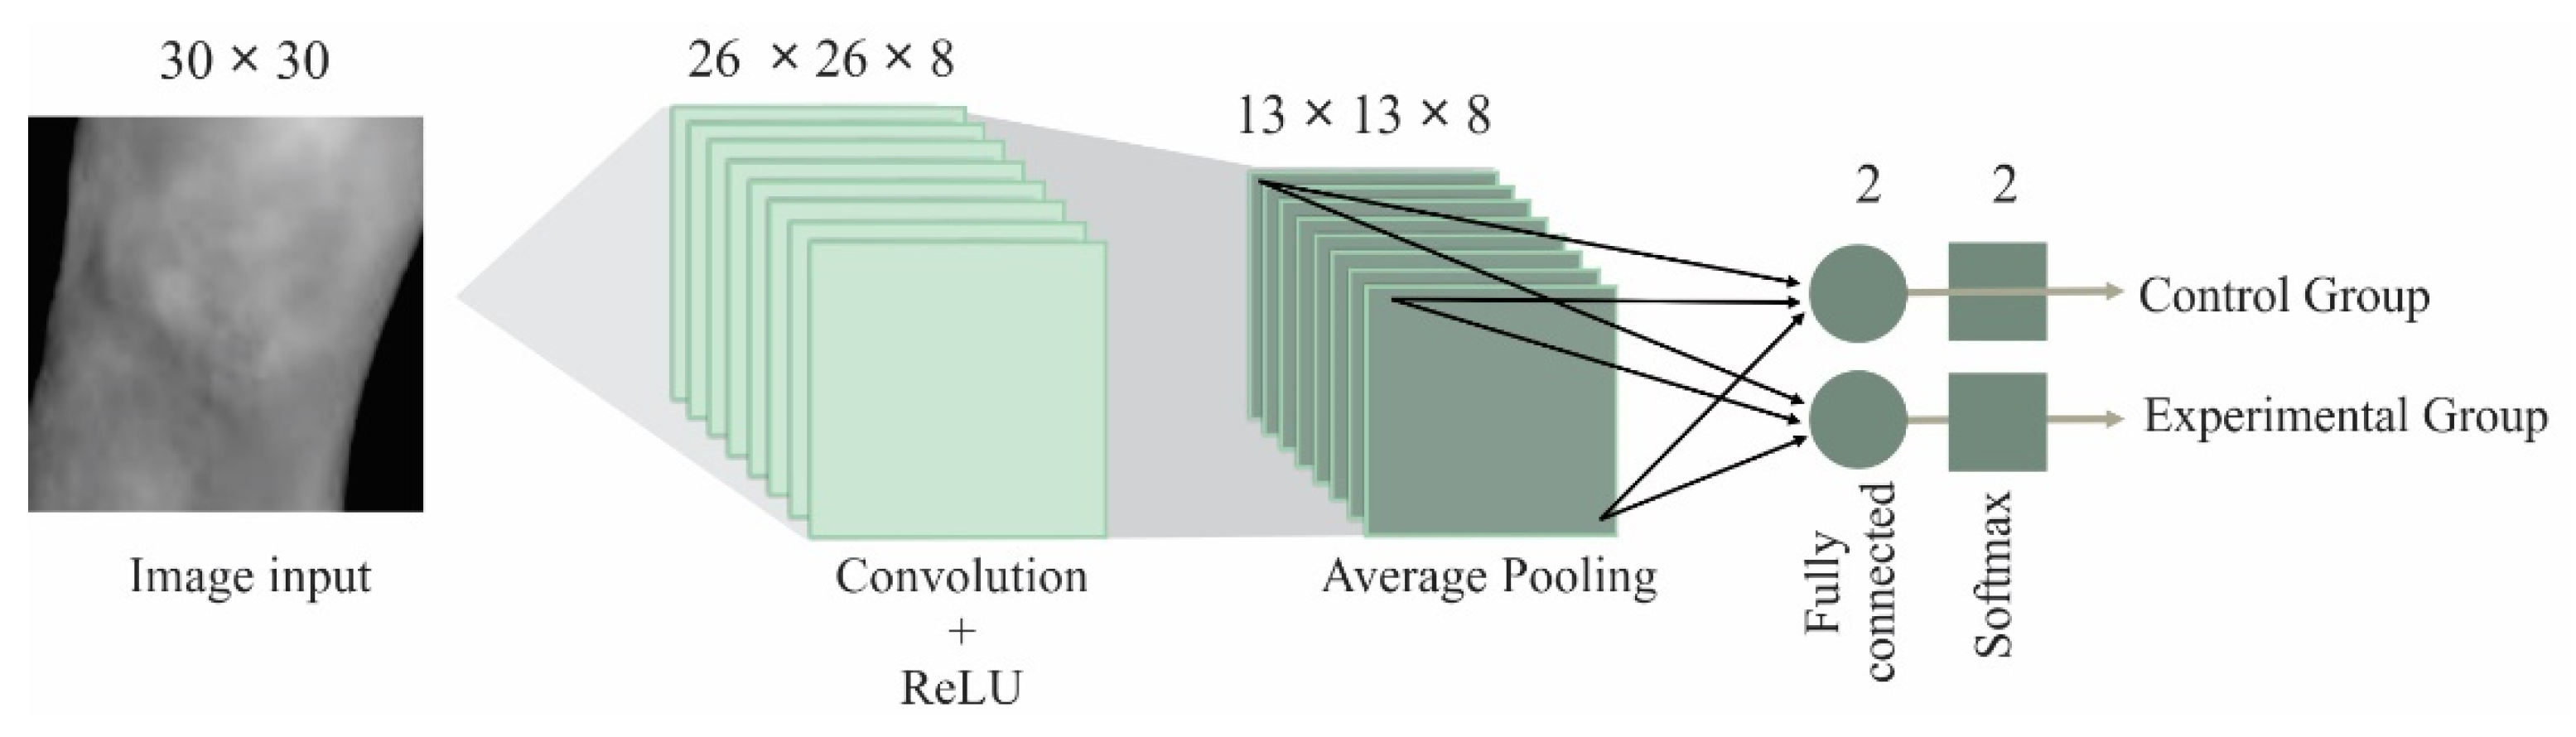
  • The best results were obtained by using a CNN with the following configuration: input image size = 30 × 30, filter size = 5 × 5, number of filters = 8, batch size = 25, and epochs = 30), where the thermal images provided the best results. This architecture is an efficient CNN in terms of computational time and accuracy; this configuration allows us to obtain a low computational burden.
Finally, compared with traditional medical techniques, the principal advantage of the developed methodology is its capability to carry out an injured-knee identification by means of the temperature monitoring and a simple CNN architecture, having the advantages of using a fast, low-cost, innocuous, and non-invasive technology. Hence, the proposal represents an alternative in the decision-making process of injured-knee identification. Despite the advantages that provide the proposal, the obtained results are considered preliminary since it is required to continue investigating and evaluating the performance of the proposal with a larger IT database that includes images acquired at diverse stages of the injured knee and other injuries, as well as participants with a larger range of ages and different physical conditions for calibrating or modifying the proposed model according to these new circumstances in order to provide a more robust and generalized method.

Author Contributions

Conceptualization, O.T.-C., M.V.-R., and I.A.C.-A.; methodology, O.T.-C. and J.P.A.-S.; software, O.T.-C.; validation, O.T.-C., I.A.C.-A., and M.V.-R.; formal analysis, O.T.-C.; investigation, O.T.-C., I.A.C.-A., and L.A.M.-H.; resources, J.P.A.-S. and L.A.M.-H.; data curation, O.T.-C.; writing—original draft preparation, all authors; writing—review and editing, all authors.,; visualization, J.R.H.-R. and M.V.-R.; supervision, M.V.-R., I.A.C.-A., and J.P.A.-S.; project administration, I.A.C.-A. and M.V.-R. All authors have read and agreed to the published version of the manuscript.

Funding

This research received no external funding.

Institutional Review Board Statement

All subjects gave their informed consent for inclusion before they participated in the study. The study was conducted in accordance with the Declaration of Helsinki, and the protocol was approved by the Ethics Committee of the “Universidad Autónoma de Querétaro” with the identification code CEAIFI-084-2020-TP.

Informed Consent Statement

Informed consent was obtained from all subjects involved in the study.

Data Availability Statement

Not applicable.

Acknowledgments

The first author is grateful to the Mexican Council of Science and Technology (CONACyT) by the scholarship 763065.

Conflicts of Interest

The authors declare no conflict of interest.

References

  1. Davenport, M.; Oczypok, M.P. Knee and Leg Injuries. Emerg. Med. Clin. N. Am. 2020, 38, 143–165. [Google Scholar] [CrossRef] [PubMed]
  2. Scandurra, G.; Cardillo, E.; Giusi, G.; Ciofi, C.; Alonso, E.; Giannetti, R. Portable Knee Health Monitoring System by Impedance Spectroscopy Based on Audio-Board. Electronics 2021, 10, 460. [Google Scholar] [CrossRef]
  3. Roth, T.S.; Osbahr, D.C. Knee Injuries in Elite Level Soccer Players. Am. J. Orthop. 2018, 47, 1–16. [Google Scholar] [CrossRef] [PubMed]
  4. Hopper, M.A.; Grainger, A.J. Knee Injuries. In Essential Radiology for Sports Medicine; Robinson, P., Ed.; Springer: New York, NY, USA, 2010; pp. 1–28. ISBN 978-1-4419-5972-0. [Google Scholar]
  5. Rothenberg, P.; Grau, L.; Kaplan, L.; Baraga, M.G. Knee Injuries in American Football: An Epidemiological Review. Am. J. Orthop. 2016, 45, 368–373. [Google Scholar] [PubMed]
  6. Blake, M.H.; Johnson, D.L. Knee Meniscus Injuries: Common Problems and Solutions. Clin. Sports Med. 2018, 37, 293–306. [Google Scholar] [CrossRef]
  7. Strickland, C.D.; Ho, C.K.; Merkle, A.N.; Vidal, A.F. MR Imaging of Knee Cartilage Injury and Repair Surgeries. Magn. Reson. Imaging Clin. N. Am. 2022, 30, 227–239. [Google Scholar] [CrossRef]
  8. Cimino, F.; Volk, B.S.; Setter, D. Anterior Cruciate Ligament Injury: Diagnosis, Management, and Prevention. Am. Fam. Physician 2010, 82, 917–922. [Google Scholar]
  9. Joshi, K.; Suganthi, K. Anterior Cruciate Ligament Tear Detection Based on Deep Convolutional Neural Network. Diagnostics 2022, 12, 2314. [Google Scholar] [CrossRef]
  10. Morelli, V.; Braxton, T.M. Meniscal, Plica, Patellar, and Patellofemoral Injuries of the Knee; Updates, Controversies and Advancements. Prim. Care Clin. Off. Pract. 2013, 40, 357–382. [Google Scholar] [CrossRef]
  11. Hetta, W.; Niazi, G. MRI in Assessment of Sports Related Knee Injuries. Egypt. J. Radiol. Nucl. Med. 2014, 45, 1153–1161. [Google Scholar] [CrossRef] [Green Version]
  12. Siouras, A.; Moustakidis, S.; Giannakidis, A.; Chalatsis, G.; Liampas, I.; Vlychou, M.; Hantes, M.; Tasoulis, S.; Tsaopoulos, D. Knee Injury Detection Using Deep Learning on MRI Studies: A Systematic Review. Diagnostics 2022, 12, 537. [Google Scholar] [CrossRef] [PubMed]
  13. Garwood, E.R.; Tai, R.; Joshi, G.; Watts, V.G.J. The Use of Artificial Intelligence in the Evaluation of Knee Pathology. Semin. Musculoskelet Radiol. 2020, 24, 21–29. [Google Scholar] [CrossRef] [Green Version]
  14. Holzinger, A.; Langs, G.; Denk, H.; Zatloukal, K.; Müller, H. Causability and Explainability of Artificial Intelligence in Medicine. Wiley Interdiscip. Rev. Data Min. Knowl. Discov. 2019, 9, 1–13. [Google Scholar] [CrossRef] [Green Version]
  15. Rguibi, Z.; Hajami, A.; Zitouni, D.; Elqaraoui, A.; Bedraoui, A. CXAI: Explaining Convolutional Neural Networks for Medical Imaging Diagnostic. Electronics 2022, 11, 1775. [Google Scholar] [CrossRef]
  16. Qiu, X.; Liu, Z.; Zhuang, M.; Cheng, D.; Zhu, C.; Zhang, X. Fusion of CNN1 and CNN2-Based Magnetic Resonance Image Diagnosis of Knee Meniscus Injury and a Comparative Analysis with Computed Tomography. Comput. Methods Programs Biomed. 2021, 211, 106297. [Google Scholar] [CrossRef] [PubMed]
  17. Cueva, J.H.; Castillo, D.; Espinós-Morató, H.; Durán, D.; Díaz, P.; Lakshminarayanan, V. Detection and Classification of Knee Osteoarthritis. Diagnostics 2022, 12, 2362. [Google Scholar] [CrossRef] [PubMed]
  18. Antony, J.; McGuinness, K.; O’Connor, N.E.; Moran, K. Quantifying Radiographic Knee Osteoarthritis Severity Using Deep Convolutional Neural Networks. In Proceedings of the International Conference on Pattern Recognition, Cancun, Mexico, 4–8 December 2016; pp. 1195–1200. [Google Scholar] [CrossRef] [Green Version]
  19. Raj, A.; Vishwanathan, S.; Ajani, B.; Krishnan, K.; Agarwal, H. Automatic Knee Cartilage Segmentation Using Fully Volumetric Convolutional Neural Networks for Evaluation of Osteoarthritis. In Proceedings of the 2018 IEEE 15th International Symposium on Biomedical Imaging (ISBI 2018), Washington, DC, USA, 4–7 April 2018; IEEE: Piscataway, NJ, USA, 2018; pp. 851–854. [Google Scholar]
  20. Chen, P.; Gao, L.; Shi, X.; Allen, K.; Yang, L. Fully Automatic Knee Osteoarthritis Severity Grading Using Deep Neural Networks with a Novel Ordinal Loss. Comput. Med. Imaging Graph. 2019, 75, 84–92. [Google Scholar] [CrossRef] [PubMed]
  21. Tiulpin, A.; Saarakkala, S. Automatic Grading of Individual Knee Osteoarthritis Features in Plain Radiographs Using Deep Convolutional Neural Networks. Diagnostics 2020, 10, 932. [Google Scholar] [CrossRef]
  22. Menezes, P.; Rhea, M.; Herdy, C.; Simão, R. Effects of Strength Training Program and Infrared Thermography in Soccer Athletes Injuries. Sports 2018, 6, 148. [Google Scholar] [CrossRef] [Green Version]
  23. Fernández-Cuevas, I.; Bouzas Marins, J.C.; Arnáiz Lastras, J.; Gómez Carmona, P.M.; Piñonosa Cano, S.; García-Concepción, M.Á.; Sillero-Quintana, M. Classification of Factors Influencing the Use of Infrared Thermography in Humans: A Review. Infrared. Phys. Technol. 2015, 71, 28–55. [Google Scholar] [CrossRef]
  24. Sillero-Quintana, M.; Gomez-Carmona, P.M.; Fernández-Cuevas, I. Infrared Thermography as a Means of Monitoring and Preventing Sports Injuries; IGI Global: Hershey, PA, USA, 2017; ISBN 9781522520726. [Google Scholar]
  25. dos Santos Bunn, P.; Miranda, M.E.K.; Rodrigues, A.I.; de Souza Sodré, R.; Neves, E.B.; Bezerra da Silva, E. Infrared Thermography and Musculoskeletal Injuries: A Systematic Review with Meta-Analysis. Infrared. Phys. Technol. 2020, 109, 103435. [Google Scholar] [CrossRef]
  26. Fokam, D.; Lehmann, C. Clinical Assessment of Arthritic Knee Pain by Infrared Thermography. J. Basic Clin. Physiol. Pharmacol. 2019, 30, 1–5. [Google Scholar] [CrossRef]
  27. Denoble, A.E.; Hall, N.; Pieper, C.F.; Kraus, V.B. Patellar Skin Surface Temperature by Thermography Reflects Knee Osteoarthritis Severity. Clin. Med. Insights Arthritis Musculoskelet Disord. 2010, 3, 69–75. [Google Scholar] [CrossRef] [PubMed] [Green Version]
  28. Arfaoui, A.; Bouzid, M.A.; Pron, H.; Taiar, R.; Polidori, G. Application of Infrared Thermography as a Diagnostic Tool of Knee Osteoarthritis. J. Therm. Sci. Technol. 2012, 7, 227–235. [Google Scholar] [CrossRef] [Green Version]
  29. Jin, C.; Yang, Y.; Xue, Z.J.; Liu, K.M.; Liu, J. Automated Analysis Method for Screening Knee Osteoarthritis Using Medical Infrared Thermography. J. Med. Biol. Eng. 2013, 33, 471–477. [Google Scholar] [CrossRef]
  30. Kumar, P.; Gaurav, A.; Rajnish, R.K.; Sharma, S.; Kumar, V.; Aggarwal, S.; Patel, S. Applications of Thermal Imaging with Infrared Thermography in Orthopaedics. J. Clin. Orthop. Trauma 2022, 24, 101722. [Google Scholar] [CrossRef]
  31. Lahiri, B.B.; Bagavathiappan, S.; Jayakumar, T.; Philip, J. Medical Applications of Infrared Thermography: A Review. Infrared. Phys. Technol. 2012, 55, 221–235. [Google Scholar] [CrossRef]
  32. Frize, M.; Adéa, C.; Payeur, P.; di Primio, G.; Karsh, J.; Ogungbemile, A. Detection of Rheumatoid Arthritis Using Infrared Imaging. In Medical Imaging 2011: Image Processing; Dawant, B.M., Haynor, D.R., Eds.; SPIE: Bellingham, DC, USA, 2011; Volume 7962, p. 79620M. [Google Scholar]
  33. Guzaitis, J.; Kadusauskiene, A.; Raisutis, R. Algorithm for Automated Foot Detection in Thermal and Optical Images for Temperature Asymmetry Analysis. Electronics 2021, 10, 571. [Google Scholar] [CrossRef]
  34. Usamentiaga, R.; Venegas, P.; Guerediaga, J.; Vega, L.; Molleda, J.; Bulnes, F. Infrared Thermography for Temperature Measurement and Non-Destructive Testing. Sensors 2014, 14, 12305–12348. [Google Scholar] [CrossRef] [Green Version]
  35. Gonzalez, R.C.; Woods, R.E. Digital Image Processing, 4th ed.; Gonzalez, R.C., Woods, R.E., Eds.; Pearson Education: New York, NY, USA, 2017; ISBN 9780133356724. [Google Scholar]
  36. Cruz-Albarran, I.A.; Benitez-Rangel, J.P.; Osornio-Rios, R.A.; Dominguez-Trejo, B.; Rodriguez-Medina, D.A.; Morales-Hernandez, L.A. A Methodology Based on Infrared Thermography for the Study of Stress in Hands of Young People during the Trier Social Stress Test. Infrared. Phys. Technol. 2018, 93, 116–123. [Google Scholar] [CrossRef]
  37. Liu, T.; Xu, H.; Ragulskis, M.; Cao, M.; Ostachowicz, W. A Data-Driven Damage Identification Framework Based on Transmissibility Function Datasets and One-Dimensional Convolutional Neural Networks: Verification on a Structural Health Monitoring Benchmark Structure. Sensors 2020, 20, 1059. [Google Scholar] [CrossRef] [PubMed] [Green Version]
  38. Krizhevsky, A.; Sutskever, I.; Hinton, G.E. ImageNet Classification with Deep Convolutional Neural Networks. Commun. ACM 2017, 60, 84–90. [Google Scholar] [CrossRef] [Green Version]
  39. Ieracitano, C.; Mammone, N.; Bramanti, A.; Hussain, A.; Morabito, F.C. A Convolutional Neural Network Approach for Classification of Dementia Stages Based on 2D-Spectral Representation of EEG Recordings. Neurocomputing 2019, 323, 96–107. [Google Scholar] [CrossRef]
  40. Mammone, N.; Ieracitano, C.; Morabito, F.C. A Deep CNN Approach to Decode Motor Preparation of Upper Limbs from Time–Frequency Maps of EEG Signals at Source Level. Neural Netw. 2020, 124, 357–372. [Google Scholar] [CrossRef] [PubMed]
  41. Wang, L.H.; Zhao, X.P.; Wu, J.X.; Xie, Y.Y.; Zhang, Y.H. Motor Fault Diagnosis Based on Short-Time Fourier Transform and Convolutional Neural Network. Chin. J. Mech. Eng. (Engl. Ed.) 2017, 30, 1357–1368. [Google Scholar] [CrossRef]
  42. Scherer, D.; Müller, A.; Behnke, S. Evaluation of Pooling Operations in Convolutional Architectures for Object Recognition. In Proceedings of the 20th International Conference on Artificial Neural Networks (ICANN), Thessaloniki, Greece, 3 September 2010; pp. 92–101. [Google Scholar]
  43. Moreira, D.G.; Costello, J.T.; Brito, C.J.; Adamczyk, J.G.; Ammer, K.; Bach, A.J.E.; Costa, C.M.A.; Eglin, C.; Fernandes, A.A.; Fernández-Cuevas, I.; et al. Thermographic Imaging in Sports and Exercise Medicine: A Delphi Study and Consensus Statement on the Measurement of Human Skin Temperature. J. Therm. Biol. 2017, 69, 155–162. [Google Scholar] [CrossRef]
  44. Javed Awan, M.; Mohd Rahim, M.; Salim, N.; Mohammed, M.; Garcia-Zapirain, B.; Abdulkareem, K. Efficient Detection of Knee Anterior Cruciate Ligament from Magnetic Resonance Imaging Using Deep Learning Approach. Diagnostics 2021, 11, 105. [Google Scholar] [CrossRef]
  45. Sarvamangala, D.R.; Kulkarni, R.V. Grading of Knee Osteoarthritis Using Convolutional Neural Networks. Neural Process. Lett. 2021, 53, 2985–3009. [Google Scholar] [CrossRef]
  46. Yunus, U.; Amin, J.; Sharif, M.; Yasmin, M.; Kadry, S.; Krishnamoorthy, S. Recognition of Knee Osteoarthritis (KOA) Using YOLOv2 and Classification Based on Convolutional Neural Network. Life 2022, 12, 1126. [Google Scholar] [CrossRef]
  47. Bardhan, S.; Nath, S.; Debnath, T.; Bhattacharjee, D.; Bhowmik, M.K. Designing of an Inflammatory Knee Joint Thermogram Dataset for Arthritis Classification Using Deep Convolution Neural Network. Quant. Infrared Thermogr. J. 2022, 19, 145–171. [Google Scholar] [CrossRef]
Figure 1. Image processing: (a) color space infrared image, (b) grayscale infrared image, (c) equalized infrared image, and (d) thermal image in grayscale.
Electronics 11 03987 g001
Figure 2. CNN architecture.
Electronics 11 03987 g002
Figure 3. Flowchart for the proposed methodology.
Electronics 11 03987 g003
Figure 4. Infrared image acquisition.
Electronics 11 03987 g004
Figure 5. Flowchart for participant selection and image acquisition.
Electronics 11 03987 g005
Figure 6. Image size and preprocessing.
Electronics 11 03987 g006
Figure 7. Flowchart for CNN configuration.
Electronics 11 03987 g007
Figure 8. CNN configuration values for: (a) image size; (b) image size and filter size; (c) image size, filter size, and BS; and (d) image size, filter size, BS, and number of epochs.
Electronics 11 03987 g008
Figure 9. Final CNN architecture.
Electronics 11 03987 g009
Figure 10. Feature maps for the convolutional layer.
Electronics 11 03987 g010
Figure 11. CNN training and validation: (a) accuracy and (b) loss.
Electronics 11 03987 g011
Figure 12. Confusion matrix.
Electronics 11 03987 g012
Figure 13. CNN results for images with different rotation angles and brightness levels: (a) input images and (b) confusion matrix for images with rotation and 10% of brightness.
Electronics 11 03987 g013
Table 1. Settings for the research.
ResourcesSpecifications
Participants
  • 24 participants in the control group.
  • 24 participants in the experimental group.
  • Age range: 22.5 ± 4.5 years.
  • Average body mass index: 23.68 ± 2.71.
ExpertsHealth professionals and thermography experts.
Ethical IssuesLetters of informed consent and data confidentiality with the ethics committee approval.
Technological equipment
  • Thermographic camera: FLIR model GF320.
  • Air conditioning system: MAPS1211C with R410A refrigerant.
  • Personal computer: INTEL (R) Core i7-6500U, processor at 2.50 GHz, 12.0 GB RAM.
Room for image acquisition
  • Temperature room: 21 ± 2 °C.
  • Distance: 1.2 m.
Table 2. Accuracy and training time for different image configurations.
Image SizeGrayscaleEqualizedThermal
AccuracyTraining TimeAccuracyTraining TimeAccuracyTraining Time
80 × 8072%24.18 s50%23.80 s58%22.93 s
50 × 5070%22.21 s50%21.31 s70%22.56 s
30 × 3080%21.12 s56%20.96 s86%21.40 s
20 × 2076%20.69 s62%20.98 s82%20.99 s
10 × 1074%21.43 s58%21.20 s75%20.98 s
Table 3. Final CNN architecture/configuration.
NameTypeActivationsLearnables
InputImage input30 × 30 × 1
ConvConvolution26 × 26 × 8Weights 5 × 5 × 1 × 8 and Bias 1 × 1 × 8
ReluRectified linear unit26 × 26 × 8
2 × 2-APAverage Pooling13 × 13 × 8
FCFully connected1 × 1 × 2Weights 2 × 1352 and Bias 2 × 1
SMSoftMax1 × 1 × 2
ClassClassification output
Table 4. CNN results for rotated images and brightness levels.
Input ImagesConfusion Matrix Indicators
RotationBrightnessAccuracyPrecisionRecallF1-Score
No10%97.44%95.12%100.00%97.50%
No20%94.87%90.69%100.00%95.11%
No30%94.87%90.69%100.00%95.11%
Yes10%97.44%95.12%100.00%97.50%
Yes20%93.58%90.49%97.22%93.72%
Yes30%92.31%94.59%90.24%92.36%
Average95.09%92.78%97.91%95.22%
Table 5. Image-based methods for automatic knee-injury identification.
WorkMethodInput ImageAccuracy
[16]Fusion of CNN1 and CNN2 (CNNf)MRI and Computer tomography93.86%
[9]Three-layered compact parallel deep convolutional neural network (CPDCNN)MRI96.60%
[17]Deep Siamese Convolutional Neural NetworksX-ray61%
[44]14 layers ResNet-14 architecture of convolutional neural networkMRI92%
[45]Multiscale convolutional blocks in convolutional neural network (MCBCNN)X-ray95%
[46]Local Binary Pattern—Principal Component Analysis and YOLOv2X-ray90.6%
[29]Feature extraction—Support Vector Machine (SVM)Thermographic images85.49%
[47]Thermographic image processing—shallow learning and deep learning (VGG16 and VGG19)Thermographic images96%
Proposed workImage preprocessing and convolutional neural networkThermographic images97.44%
Publisher’s Note: MDPI stays neutral with regard to jurisdictional claims in published maps and institutional affiliations.

