
Classification of Plates and Trihedral Corner Reflectors Based on Linear Wavefront Phase-Modulated Beam

1
Beijing Key Laboratory of Millimeter Wave and Terahertz Technology, School of Integrated Circuits and Electronics, Beijing Institute of Technology, Beijing 100081, China
2
School of Physics, Beijing Institute of Technology, Beijing 100081, China
*
Author to whom correspondence should be addressed.
Electronics 2022, 11(23), 4044; https://doi.org/10.3390/electronics11234044
Submission received: 25 October 2022
/
Revised: 28 November 2022
/
Accepted: 3 December 2022
/
Published: 5 December 2022
Abstract
:Wavefront-modulated beams such as vortex beams have attracted much attention in the field of target recognition due to the introduced degrees of freedom. However, traditional wavefront-modulated beams are doughnut shaped, and are not suitable for radar detection or tracking. To solve this problem, a linear wavefront phase-modulated beam with a maximum radiation intensity in the center was proposed in a previous study. In this paper, we continue to study target characteristics under the linear wavefront phase-modulated beam. Through analysis of the target scattering based on the physical optics (PO) method, we find that a part of the monostatic or bistatic radar cross-section (RCS) of the target could be obtained by changing the phase gradient of the modulated beam. Taking this part of RCS for feature extraction, we recognize the plates and trihedral corner reflectors through the support vector machine (SVM) method. For data visualization, we use the t-distributed stochastic neighbor embedding (t-SNE) method for data dimensionality reduction. The results show that the recognition probability of the plates and trihedral corner reflectors can reach 91% with an antenna array having an aperture of 20 wavelengths when the signal-to-noise ratio (SNR) is 20 dB, while the traditional plane beam cannot classify these two targets directly.
1. Introduction
Radar target recognition plays an important role in military reconnaissance [1], automatic driving [2], security imaging [3], geologic examination [4], and ocean remote sensing [5]. In target recognition, increasing the dimension of features can improve the recognition accuracy [6]. For example, when a polarimetric feature is introduced into radar target recognition, a dataset with one more dimension can be obtained, which can improve recognition accuracy [7]. D. Perissin used polarization information to distinguish urban-targets [8]. V. Vassilev made it possible to infer the ground surface type by using a polarimetric radar [9]. G. Xiong utilized polarization information to distinguish a ship target through a deep network [10]. The polarization characteristics also have limits. For example, when different targets share the same polarization scattering matrix, such as plates and trihedral corner reflectors, it is difficult to distinguish them in the polarization dimension [11]. Jafari. M found that the polarization characteristics of the plates and trihedral corner reflectors are the same and cannot be distinguished [12]. For the same reason, the plates and trihedral corner reflectors are not used together in the polarization calibration of the polarization synthetic aperture radar [13,14]. Therefore, it is difficult to classify the plates and trihedral corner reflectors through polarization or amplitude characteristics of the target.
In recent years, wavefront-modulated beams have attracted much attention. Similar to the polarization of electromagnetic waves, wavefront-modulated beams can also increase the number of feature dimensions and therefore could improve target recognition performance [15]. Random phase coding (RPC) is one of the wavefront-modulating methods mostly used for imaging, but the radiating intensity of an RPC beam is not focused [16]. Vortex beams carrying orbital angular momentum (OAM) are another type of wavefront-modulated beam. When vortex beams are used instead of plane beams, the scattering results are different due to the spiral phase gradient [17]. S. Qiu used a vortex beam in spinning object detection [18]. L. Bu used the vortex beam to detect and image high-speed targets [19]. Z. Wu studied the scattering characteristics of targets under vortex beams and concluded that the characteristics of targets were different when changing the OAM mode [20]. Compared with plane beams, vortex beams improve the ability of information acquisition and target detection [21,22,23]. B. Tang found that OAMs can carry more information than plane waves when passing through the chaff clouds [24]. Y. Liao found that using vortex beam detection can reduce the effects of clutter [25]. By using the OAM radar, C. Zhang realized that the vortex beam improves the receiving signal-to-noise ratio (SNR) of stealth targets [26,27]. Therefore, vortex beams could increase the feature dimension by modifying the OAM mode. However, the vortex beams are doughnut shaped. Furthermore, when the OAM mode changes, the maximum radiation direction of the vortex beam also changes. These defects are not conducive to radar detection or forward-looking imaging [28].
To solve this problem, a linear wavefront phase-modulated beam was proposed [29]. Similar to vortex beams, the phase-modulated beam also brings an extra feature dimension with a linear phase distribution in the azimuth or elevation angle direction and the maximum radiation intensity in the center. In the literature [29], a modulated field with a single-phase gradient is used to measure the three-dimensional velocity of the target. In this study, we analyze the phase distribution of a target in the modulated beam and recognize the target using multiple modulated beams with different phase gradients. Through the theoretical analysis, we conclude that by changing the phase gradient of the modulated beam, a part of the monostatic or bistatic target radar cross-section (RCS) could be obtained when the target is stationary relative to the radar. A full-wave simulation was conducted in FEKO to obtain the simulation data of the plates and trihedral corner reflectors through the modulated beam. The classification rate of both plates and trihedral corner reflectors through support vector machine (SVM) can reach 95%.
The innovation of this paper is as follows: First, we can obtain a part of the RCS of the target by changing the phase gradient of the modulation field when the target and the radar are relatively stationary, and therefore increase the dimensionality of the target features. Second, by extracting the features from the additional RCS, we can improve the target recognition accuracy performance with this extra dimension for targets such as plates and trihedral corner reflectors.
The rest of this paper is organized as follows: In Section 2, we analyze the scattering characteristics of targets when changing the phase gradient of the modulated beam and propose the feature extraction method. In Section 3, we use FEKO for simulation and classify targets according to simulation data. Finally, we draw the conclusion in Section 4.
2. Method
2.1. Linear Wavefront Phase-Modulated Beam
Figure 1 shows the coordinate system for the array antenna and the target. O is the geometric center of the array antenna. is the geometric center of the target. d is the distance between O and . The position vector of the n-th antenna units is . P is any point on the target. is the vector position of the beam point. and are the spherical coordinate angles of .
The linear wavefront phase-modulated beam can be generated by the antenna array, and the generation method is proposed in [29]. The radiation electric pattern of the array shown in Figure 1 can be expressed as
where is the location of the n-th antenna unit; N is the number of antenna units; is the feeding coefficient of the n-th antenna,; is the wavenumber vector, which is given by ; and the unit position . Therefore, the phase pattern of F is
When the target is in the far field of the antenna and is close to 0, the phase at P can be simplified as
where and are the equivalent feeding positions of the array along x and y directions, respectively. Therefore, the phase gradient of point P is
From formula (4), when , the phase gradient is along the azimuth angle (), and when , the phase gradient is along the elevation angle (). By changing the feeding coefficient of each unit (), the equivalent feeding positions ( and ) also change, and the magnitude and direction of the phase gradient of the generated beam can be adjusted accordingly.
Figure 2 compares the pattern of linear wavefront phase-modulated beam and the plane beam. The beams are generated by a uniform circular array (UCA). The position of the n-th unit in Cartesian coordinates is , where , is the radius of the circular array, and . The amplitude coefficients of the modulated beams and the plane beam are shown in Table 1.
The range of the azimuth and elevation directions is .
2.2. Scattering Characteristics
To analyze the scattering characteristics of the target, the physical optics (PO) method [30] was introduced. The PO method is convenient for studying the effect of target surface phase on scattering characteristics. For the bistatic RCS situation, the scattering characteristic of the target under the plane beam can be expressed as
where S is the surface of the target irradiated by the beam. S is divided into N small triangles , and . is the incident electric field. , , and are the central current, position vector, and area of the n-th triangle, respectively. is the incident wavenumber vector, , and is the reflected wavenumber vector, , .
According to (3), the phase on the n-th triangle under the linear wavefront phase-modulated beam could expressed as
where . Therefore, the scattering field of the target under the modulated beam could be obtained as
where , .
For the monostatic RCS, the direction of the received wave is opposite to that of the transmitted wave, , and the scattering characteristic of the target under the plane beam can be expressed as [30]
The scattering field of the target under the modulated beam could be obtained as
According to (7) and (9), we could measure a part of the target bistatic or monostatic RCS by changing the wavefront phase gradient of the modulated beam without the relative movement of the target. The range of the RCS is related to and d. Therefore, when the aperture of the array is increased or the distance between radar and target is reduced, a larger range of the RCS could be obtained.
2.3. Feature Extraction
By changing the phase gradient of the modulated beam, the amplitude and phase of the target in different linear wavefront phase-modulated beams can be obtained, which is proven to be related to the RCS of the target. On this basis, we can classify the targets through the difference in the attitude sensitivity. In order to acquire the features for classification, we need to extract the features in the amplitude and phase of the targets.
We chose two types of the modulated beam with different magnitude and direction of the phase gradients. The phase gradient of the first type of beam is , and the direction of the phase gradient is along the y-axis. The phase gradient of the second type of beam is , and the direction is along the x-axis. To remove the effect of scattering intensity, the amplitude and phase of the received signals is normalized by the data under plane wave. For a monostatic situation, after normalization, the amplitude and phase of the target are expressed as
where is the phase of . Therefore, the features for classification are expressed as
where .
3. Results
To verify the proposed method, we simulated the plates and trihedral corner reflectors in FEKO to obtain receiving signals with different wavefront phase gradient. Then, we used these features to verify formulas (7) and (9) while classifying the two targets.
3.1. Scattering Characteristics of Plates and Trihedral Corner reflectors
First, we used FEKO for the full-wave simulation to verify formulas (7) and (9). The simulation process is shown in Figure 3.
The simulation model of the plate and the trihedral corner reflector is shown in Figure 4.
The position of geometric center of the target in Cartesian coordinate is . The working frequency is 17GHz. In the initial angle, the transmitting plane beam propagates along the z-axis in a negative direction, . The receiving antenna array is a uniform circular array (UCA). The antenna unit is the electric dipole. The position of n-th unit in Cartesian coordinate is , where , is the radius of the circular array and . The amplitude coefficients of the receiving antenna array are shown in Table 2, where . From Formula (4), the phase gradient of the modulated beam is .
For the bistatic RCS simulation, the receiving antenna array rotates along the y-axis around the geometric center of the object in a range of , and the angle interval is . The transmitting plane beam remains stationary. The bistatic RCS is , . By changing the phase gradient of the modulated beams, from (7), the fitting bistatic RCS data is . Figure 5 provides a comparison of the bistatic RCS and the fitting bistatic RCS of the plate and trihedral corner reflector through (7).
For the monostatic RCS simulation, the receiving antenna array and transmitting plane beam rotate along the y-axis around the geometric center of the object in a range of , and the angle interval is . The monostatic RCS is . By changing the phase gradient of the modulated beams, from (9), the fitting monostatic RCS is . Figure 6 provides a comparison of the monostatic RCS and the fitting monostatic RCS of the plate and trihedral corner reflector through (9).
In Figure 5 and Figure 6, the RCS is obtained by rotating the receiving array with a total of 11 data points. After rotating the receiving array, the fitting RCS is obtained by changing the phase gradient of the modulated beam using (7) and (9). There are nine fitting RCS points near each RCS point. For the plates and trihedral corner reflectors, the simulation results show that the RCS data and fitting RCS data have high consistency.
3.2. Classification
To classify the plates and trihedral corner reflectors, we use simulation to obtain the amplitude and phase of the target in different linear wavefront phase-modulated beams. The classification process is shown in Figure 7.
Take the monostatic RCS as an example. The working frequency is 17 GHz. The targets parameters are shown in Table 3.
The receiving antenna array and transmitting plane beam rotate along the y and x-axis in a range of , from which 231 angles are selected as datasets. We use the method presented in Section 2.3 to extract the features of the trihedral corner reflectors and the plates. The amplitude coefficients of the receiving antenna array of the first type of beam are shown in Table 2, where , and the phase gradient of modulated beam is according to formula (4). The amplitude coefficients of the receiving antenna array of the second type beam are shown in Table 4, where , and the phase gradient of modulated beam is according to formula (4).
Then, the SVM was selected as the classification method. The SVM method is excellent at solving non-linear and binary classification problems [31]. The time complexity of SVM is , where n is the number of features, and d is the dimension of features [32]. From formula (11), the dataset X was selected as the classified data. A total of 20% of the data were randomly selected as the test set, and the rest of the data were used as the training set. We used the “fitcsvm” function in MATLAB to achieve classification, where the kernel function was set to “rbf”. The classification rate is shown in Table 5. The average classification rate reaches , indicating that this method is effective for classifying plates and trihedral corner reflectors.
As a comparison, we used plane beam to classify the trihedral corner reflectors and the plates, and the amplitude of RCS was selected as a classification feature. The classification rate is shown in Table 5. The characteristic distribution is shown in Figure 8.
From Table 5, the target recognition rate of the modulated beam is better than that of the plane beam. The recognition effect of the plane beam depends on the amplitude of these two targets.
For data visualization, it is necessary to reduce the dimensionality of features. When the relationship between features is complex polynomial, a nonlinear dimension reduction algorithm is needed, such as t-SNE. t-SNE can increase the probability of similar targets being selected, thus maintaining the difference between data at high dimensions [33]. X is the high-dimensional dataset. After dimensionality reduction, we can acquire the low-dimensional datasets . The cost function C is
is the conditional probability between and , and are the joint probabilities between and . t-SNE aims to minimize the cost function C. We used the “tsne” function in MATLAB to achieve dimensionality reduction, where the algorithm was set to “barneshut”. The visualization of dataset Y is shown in Figure 9.
From Figure 9, the boundary of the two data groups was clear.
Next, we discuss the impact of signal-to-noise ratio (SNR) on this work. In order to discuss the recognition effect under different SNRs, we chose the antenna array with an aperture of 20, which has a phase gradient for feature extraction of . The recognition accuracy at different SNRs is shown in Figure 10.
The results show that the recognition accuracy is 91.67% when the SNR is 20 dB.
4. Conclusions
In this paper, we study the scattering characteristics of a target under a linear wavefront phase-modulated beam to improve the target classification accuracy. Theoretical analysis and simulation show that a part of the RCS of the target can be obtained by changing the phase gradient of the modulated beam when the target is stationary relative to the radar. Utilizing multiple modulated beams with different phase gradients, we propose a feature extraction method to recognize the plates and the trihedral corner reflectors. The results show that the average classification rate reaches 95%, while the traditional plane beam cannot classify these two targets directly. Furthermore, the classification rate can reach 91% with an antenna array that has an aperture of 20 wavelengths when the SNR is 20 dB. In summary, the feature information of the target is increased by introducing the linear wavefront phase-modulated beam and therefore improves the target recognition result. To further improve the accuracy of target recognition, a larger phase gradient or a large-aperture antenna would help.
Author Contributions
Conceptualization, X.W. and H.S.; Methodology, X.W. and Y.Z.; Investigation, X.Z.; Resources, K.Z.; Writing—original draft, X.W.; Writing—review & editing, X.W. and Y.Z. All authors have read and agreed to the published version of the manuscript.
Funding
This research was funded by the National Natural Science Foundation of China under Grant 62001025.
Institutional Review Board Statement
Not applicable.
Informed Consent Statement
Informed consent was obtained from all subjects involved in the study.
Data Availability Statement
Not applicable.
Conflicts of Interest
The authors declare no conflict of interest.
References
- Wang, T.; Wenjian, B.; Zhao, Y.; Xue, W. Radar Target Recognition Algorithm Based on RCS Observation Sequence-Set-Valued Identification Method. J. Syst. Sci. Complex. 2016, 29, 573–588. [Google Scholar] [CrossRef]
- Chipengo, U.; Sligar, A.P.; Canta, S.M.; Goldgruber, M.; Leibovich, H.; Carpenter, S. High Fidelity Physics Simulation-Based Convolutional Neural Network for Automotive Radar Target Classification Using Micro-Doppler. IEEE Access 2021, 9, 82597–82617. [Google Scholar] [CrossRef]
- Griffin, L.D.; Caldwell, M.; Andrews, J.T.A.; Bohler, H. “Unexpected Item in the Bagging Area”: Anomaly Detection in X-ray Security Images. IEEE Trans. Inf. Forensics Secur. 2019, 14, 1539–1553. [Google Scholar] [CrossRef]
- Marghany, M. Advanced Algorithms for Mineral and Hydrocarbon Exploration Using Synthetic Aperture Radar; Elsevier: New York, NY, USA, 2021. [Google Scholar]
- Marghany, M. Nonlinear Ocean Dynamics: Synthetic Aperture Radar; Elsevier: New York, NY, USA, 2021. [Google Scholar]
- Ai, J.; Mao, Y.; Luo, Q.; Jia, L.; Xing, M. SAR Target Classification Using the Multikernel-Size Feature Fusion-Based Convolutional Neural Network. IEEE Trans. Geosci. Remote Sens. 2022, 60, 1–13. [Google Scholar] [CrossRef]
- Sadjadi, F. Improved target classification using optimum polarimetric SAR signatures. IEEE Trans. Aerosp. Electron. Syst. 2002, 38, 38–49. [Google Scholar] [CrossRef]
- Perissin, D.; Ferretti, A. Urban-Target Recognition by Means of Repeated Spaceborne SAR Images. IEEE Trans. Geosci. Remote Sens. 2007, 45, 4043–4058. [Google Scholar] [CrossRef]
- Vassilev, V. Road surface recognition at mm-wavelengths using a polarimetric radar. IEEE Trans. Intell. Transp. Syst. 2021, 23, 6985–6990. [Google Scholar] [CrossRef]
- Xiong, G.; Xi, Y.; Chen, D. Dual-Polarization SAR Ship Target Recognition Based on Mini Hourglass Region Extraction and Dual-Channel Efficient Fusion Network. IEEE Access 2021, 99, 1. [Google Scholar] [CrossRef]
- Lee, J.S.; Pottier, E. Polarimetric Radar Imaging: From Basics to Applications; CRC Press: Boca Raton, FL, USA, 2009. [Google Scholar]
- Jafari, M.; Maghsoudi, Y.; Zoej, M. A New Component Scattering Model Using Polarimetric Signatures Based Pattern Recognition on Polarimetric SAR Data. J. Indian Soc. Remote Sens. 2016, 44, 297–306. [Google Scholar] [CrossRef]
- Dadhich, G.; Sharma, S.; Rambhia, M.; Mathur, A.K.; Patel, P.R.; Shukla, A. Image quality characterization of fine resolution RISAT-1 data using impulse response function. Int. J. Remote Sens. 2017, 38, 586–596. [Google Scholar] [CrossRef]
- Wang, S.; Chen, K.-S.; Sato, M. Performance of SAR Polarimetric Calibration Using Hybrid Corner Reflectors: Numerical Simulations and Experimental Measurements. IEEE J. Sel. Top. Appl. Earth Obs. Remote Sens. 2021, 14, 440–451. [Google Scholar] [CrossRef]
- Sergienko, A.V.; Uribe-Patarroyo, N.; Fraine, A.; Fitzpatrick, C.; Simon, D.S.; Minaeva, O. High Information Capacity Image Recognition Using Correlated Orbital Angular Momentum (OAM) States. In Frontiers in Optics 2014; Optica Publishing Group: Boston, MA, USA, 2014; p. FM4E.2. [Google Scholar]
- Tong, X. Staring high-resolution imaging algorithm based on random coded-wavefront. Signal Image Video Process. 2021, 15, 1115–1123. [Google Scholar] [CrossRef]
- Liu, K.; Cheng, Y.; Yang, Z.; Wang, H.; Qin, Y.; Li, X. Orbital-Angular-Momentum-Based Electromagnetic Vortex Imaging. IEEE Antennas Wirel. Propag. Lett. 2015, 14, 711–714. [Google Scholar] [CrossRef]
- Qiu, S.; Ren, Y.; Liu, T.; Chen, L.; Wang, C.; Li, Z.; Shao, Q. Spinning object detection based on perfect optical vortex. Opt. Lasers Eng. 2020, 124, 105842. [Google Scholar] [CrossRef]
- Bu, L.; Zhu, Y.; Chen, Y.; Yang, Y.; Zang, Y. Vortex-electromagnetic-wave-based ISAR imaging for high-speed maneuvering targets. Sci. Rep. 2022, 12, 18009. [Google Scholar] [CrossRef]
- Wu, Z.; Wu, J.; Li, H.; Qu, T.; Meng, X.; Xu, Q.; Wu, Z.; Bai, J.; Yang, L.; Gong, L.; et al. Integrated Physical Optics for Calculating Electric-Large Metallic Sphere Scattering Irradiated by Vortex Wave in Microwave Frequency Band. IEEE Antennas Wirel. Propag. Lett. 2022, 21, 1288–1292. [Google Scholar] [CrossRef]
- Zhang, X.; Su, X.; Wu, Z.; Ma, L.; Li, X.; Bai, J. Analysis of electromagnetic scattering from typical targets for orbital-angular-momentum waves: Theoretical model. IET Microw. Antennas Propag. 2022, 16, 699–708. [Google Scholar] [CrossRef]
- Liu, K.; Liu, H.; Sha, W.E.I.; Cheng, Y.; Wang, H. Backward Scattering of Electrically Large Standard Objects Illuminated by OAM Beams. IEEE Antennas Wirel. Propag. Lett. 2020, 19, 1167–1171. [Google Scholar] [CrossRef]
- Liu, K.; Gao, Y.; Li, X.; Cheng, Y. Target scattering characteristics for OAM-based radar. AIP Adv. 2018, 8, 025002. [Google Scholar] [CrossRef]
- Tang, B.; Bai, J.; Sheng, X. Orbital-angular-momentum-carrying wave scattering by the chaff clouds. IET Radar Sonar Navig. 2018, 12, 649–653. [Google Scholar]
- Liao, Y.; Yang, S.; Li, K.; Ji, J.; Lin, X.; Hao, Y.; Li, Z.; Wang, X.; Zhang, J. Reduction of Scattering Clutters in an Underwater Lidar System by Using an Optical Vortex. IEEE Photonics Technol. Lett. 2022, 34, 927–930. [Google Scholar] [CrossRef]
- Zhang, C.; Chen, D.; Jiang, X. RCS Diversity of Electromagnetic Wave Carrying Orbital Angular Momentum. Sci. Rep. 2018, 7, 15412. [Google Scholar] [CrossRef] [PubMed] [Green Version]
- Zhang, C.; Jiang, X.; Chen, D. Signal-to-Noise Ratio Improvement by Vortex Wave Detection With a Rotational Antenna. IEEE Trans. Antennas Propag. 2018, 99, 1. [Google Scholar] [CrossRef]
- Feng, P.-Y.; Qu, S.-W.; Yang, S. OAM-Generating Transmitarray Antenna With Circular Phased Array Antenna Feed. IEEE Trans. Antennas Propag. 2020, 68, 4540–4548. [Google Scholar] [CrossRef]
- Zhong, Y.; Zhang, Y.; Zhang, X.; Sun, H.; Zhao, G. Velocity measurement of an arbitrary three-dimensional moving object by using a novel modulated field. Opt. Express 2021, 29, 26210–26219. [Google Scholar] [CrossRef]
- Knott, E. Radar Cross Section; Artech House, Inc.: Norwood, MA, USA, 1985. [Google Scholar]
- Mathur, A.; Foody, G.M. Multiclass and Binary SVM Classification: Implications for Training and Classification Users. IEEE Geosci. Remote Sens. Lett. 2008, 5, 241–245. [Google Scholar] [CrossRef]
- Yu, H.; Sun, W.; Zhou, X.; Zhu, G.; Hu, W. Heuristic sample reduction based support vector regression method. In Proceedings of the IEEE International Conference on Mechatronics and Automation, Harbin, China, 7–10 August 2016; pp. 2065–2069. [Google Scholar]
- Zhang, G.; Cao, Y.; Chen, J.; Huang, P.; Ge, W.; Hou, D. Classification and identification of human colon cancer cell line in terahertz domain using t-SNE. In Clinical and Preclinical Optical Diagnostics II; Optica Publishing Group: Hangzhou, China, 2019; p. 11073_45. [Google Scholar]
Figure 1.
The coordinate system of the antenna array and target.
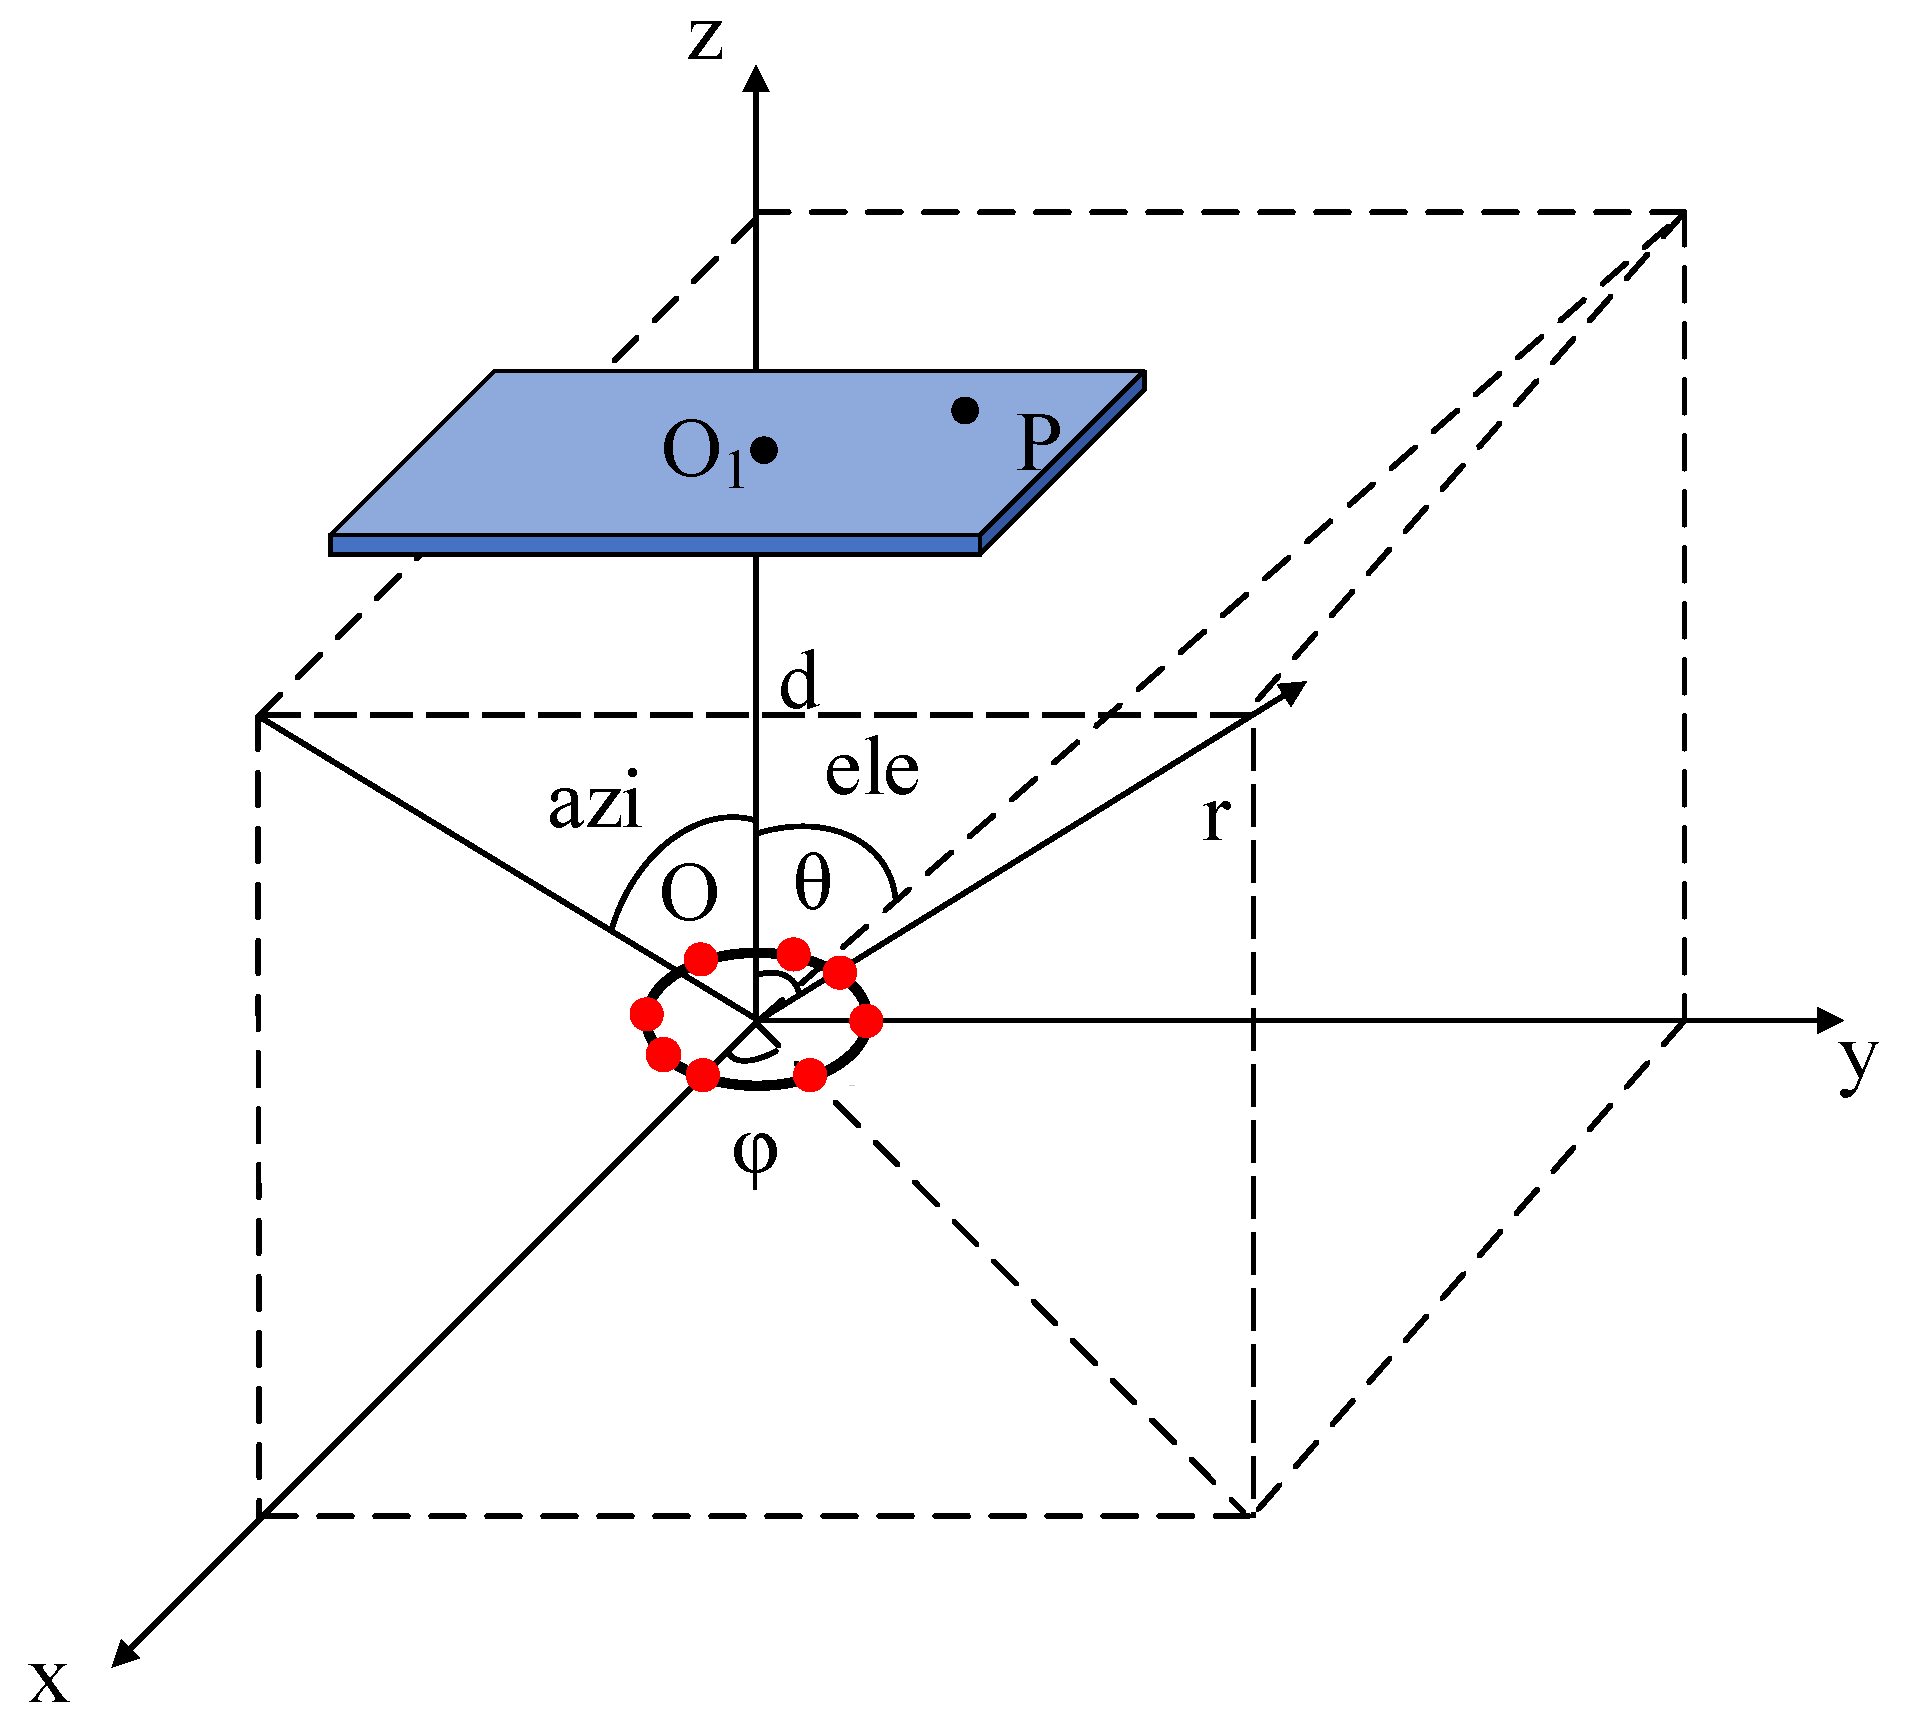
Figure 2.
Comparison between the plane beam and the modulated beam. (a) The pattern of the plane beam. (b) The phase pattern of the plane beam. (c) The pattern of the modulated beam I. (d) The phase pattern of the modulated beam I. (e) The pattern of the modulated beam II. (f) The phase pattern of the modulated beam II.

Figure 3.
The simulation process.
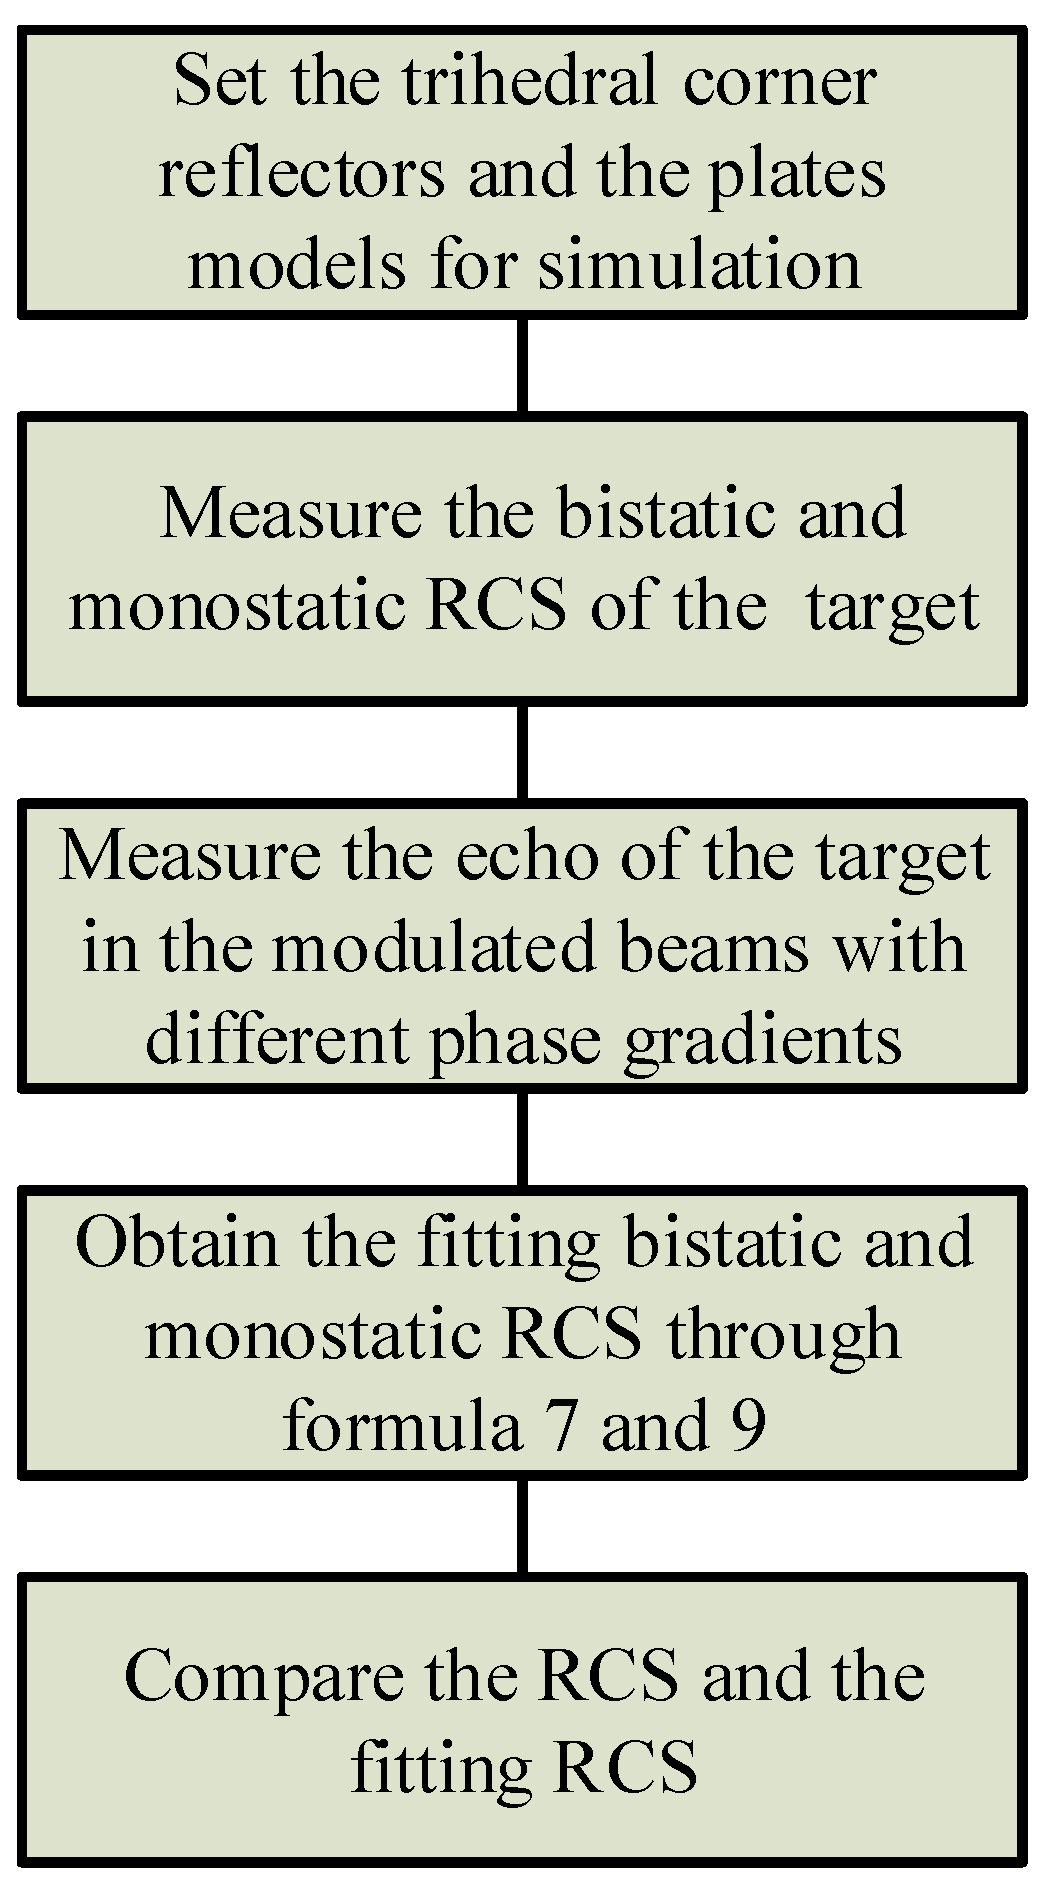
Figure 4.
The simulation model. (a) The model of the plate. (b) The model of the trihedral corner reflector. (c) The overview of simulation.
Figure 4.
The simulation model. (a) The model of the plate. (b) The model of the trihedral corner reflector. (c) The overview of simulation.
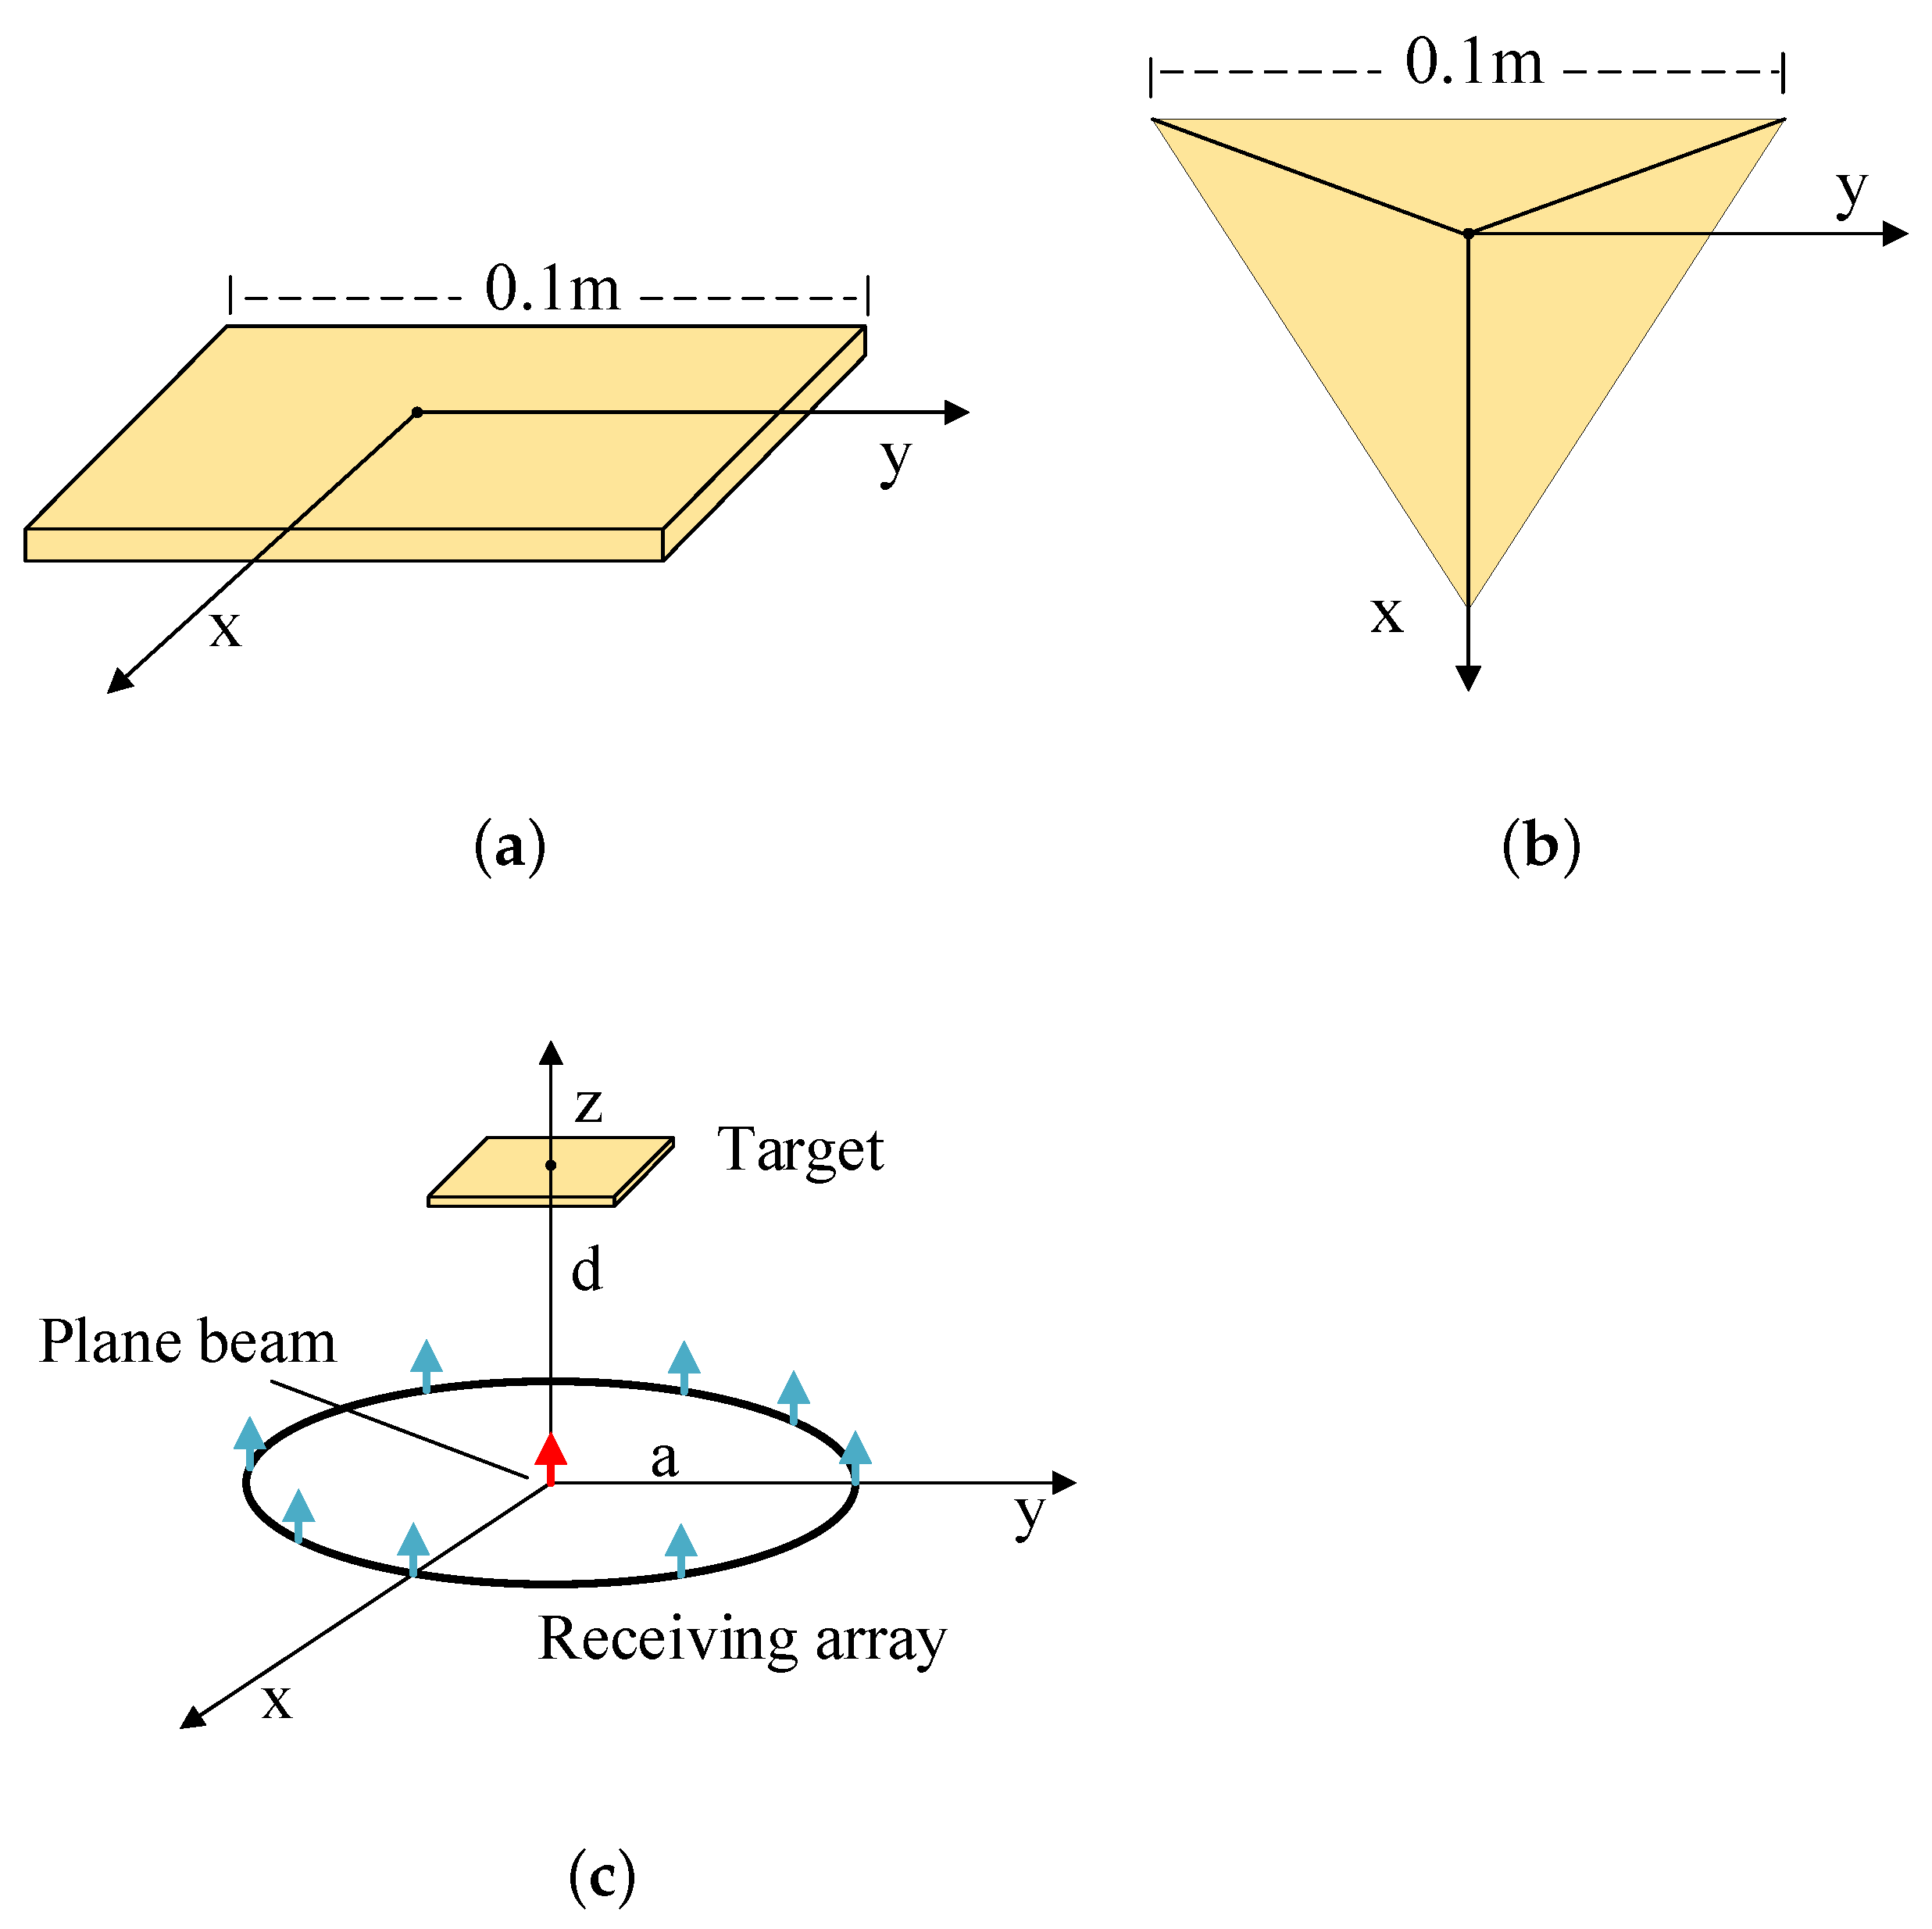
Figure 5.
Comparison of the plate and trihedral corner reflector bistatic RCS. (a) The RCS amplitude of the plate. (b) The RCS amplitude of the trihedral corner reflector. (c) The RCS phase of the plate. (d) The RCS phase of the trihedral corner reflector.
Figure 5.
Comparison of the plate and trihedral corner reflector bistatic RCS. (a) The RCS amplitude of the plate. (b) The RCS amplitude of the trihedral corner reflector. (c) The RCS phase of the plate. (d) The RCS phase of the trihedral corner reflector.

Figure 6.
Comparison of the plate and trihedral corner reflector monostatic RCS. (a) The RCS amplitude of the plate. (b) The RCS amplitude of the trihedral corner reflector. (c) The RCS phase of the plate. (d) The RCS phase of the trihedral corner reflector.
Figure 6.
Comparison of the plate and trihedral corner reflector monostatic RCS. (a) The RCS amplitude of the plate. (b) The RCS amplitude of the trihedral corner reflector. (c) The RCS phase of the plate. (d) The RCS phase of the trihedral corner reflector.
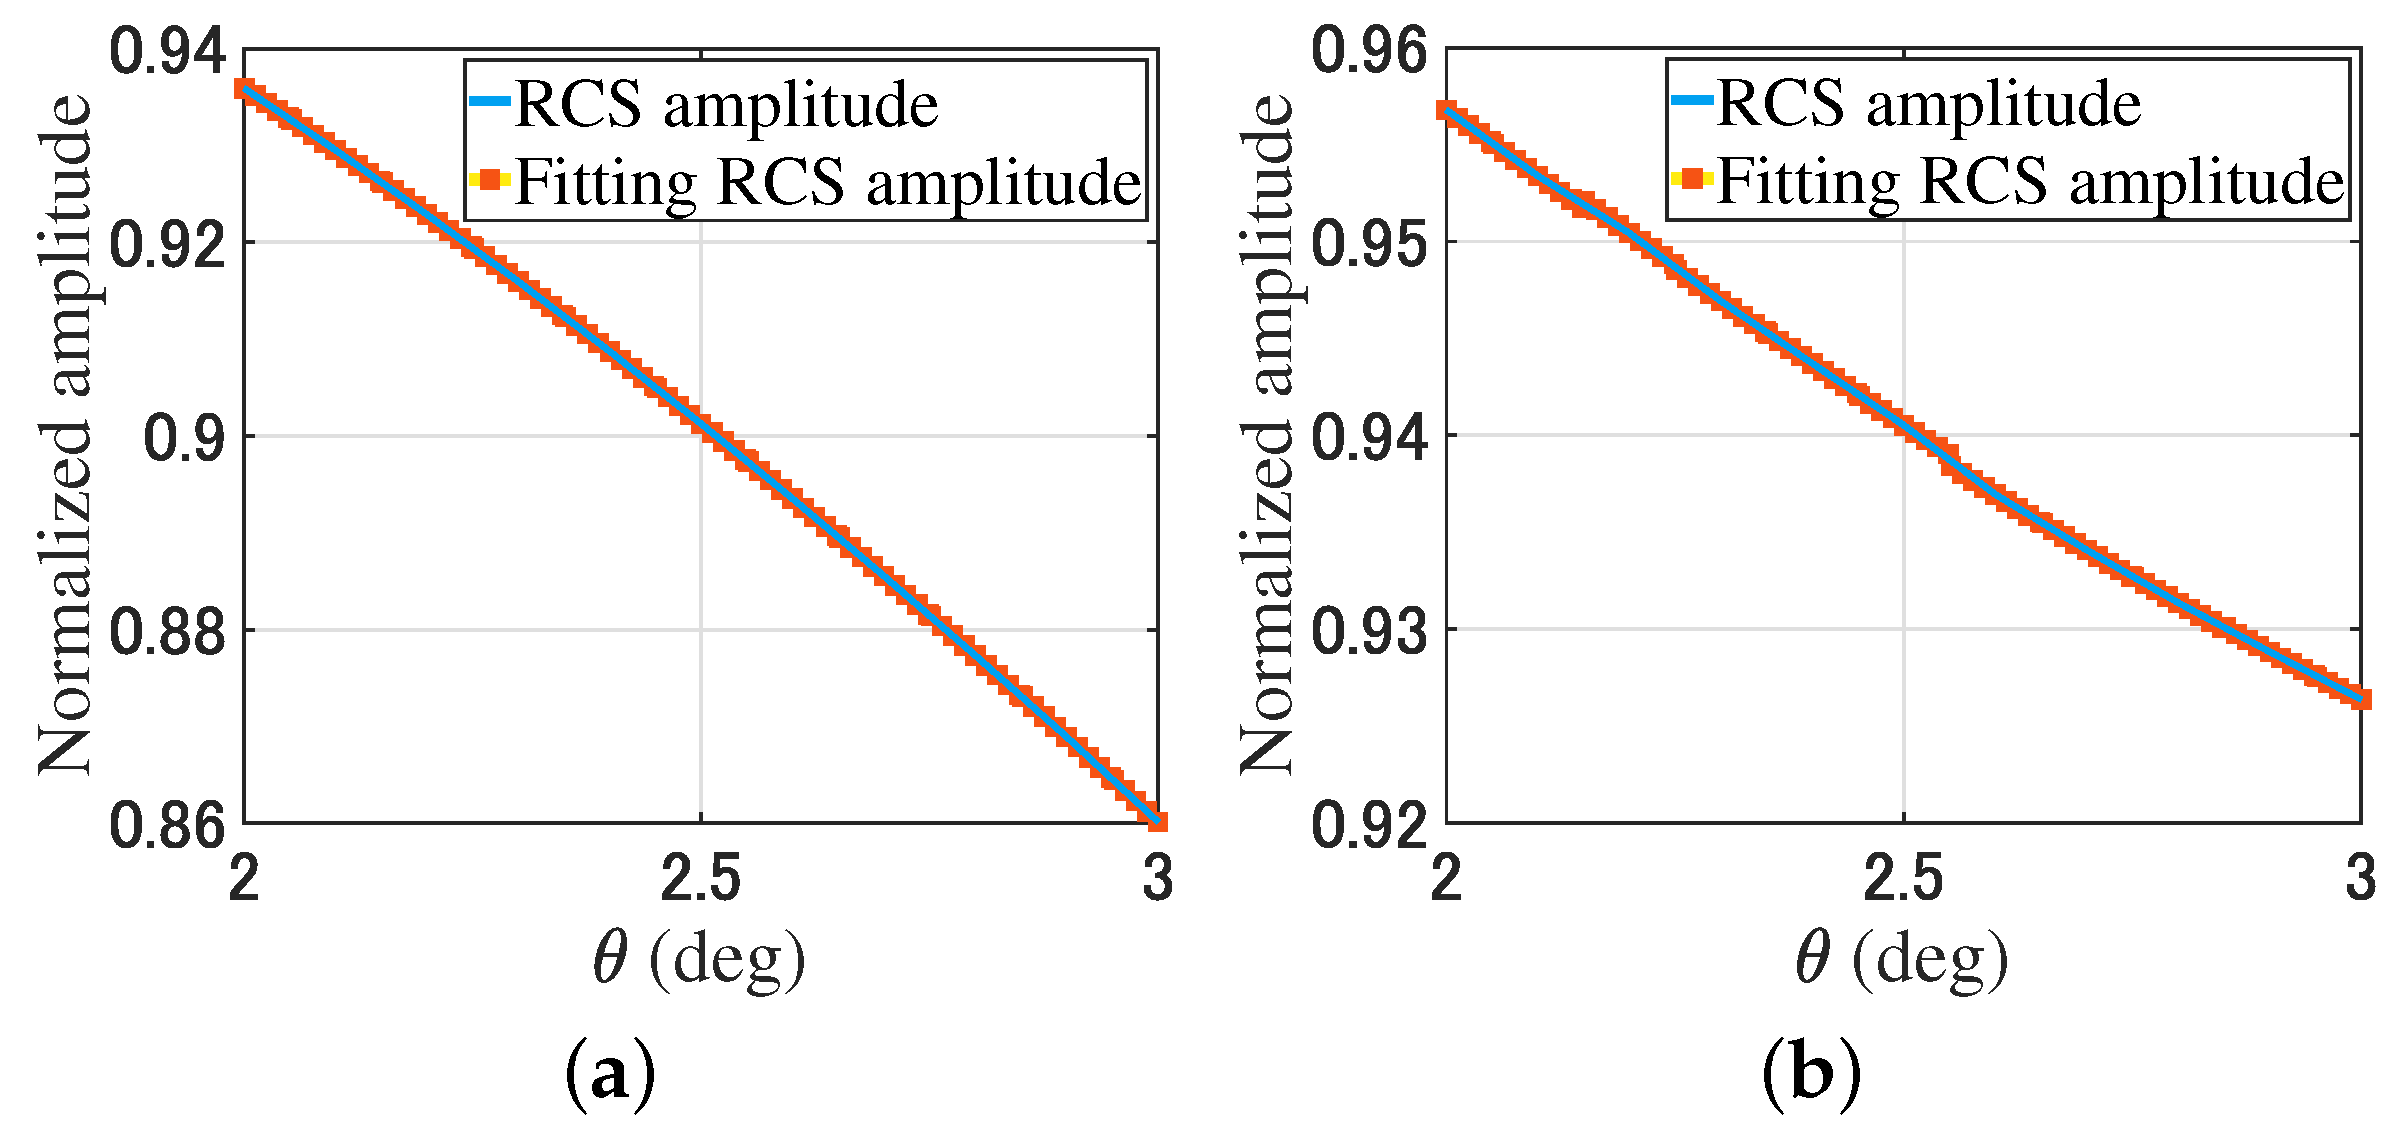

Figure 7.
The classification process.
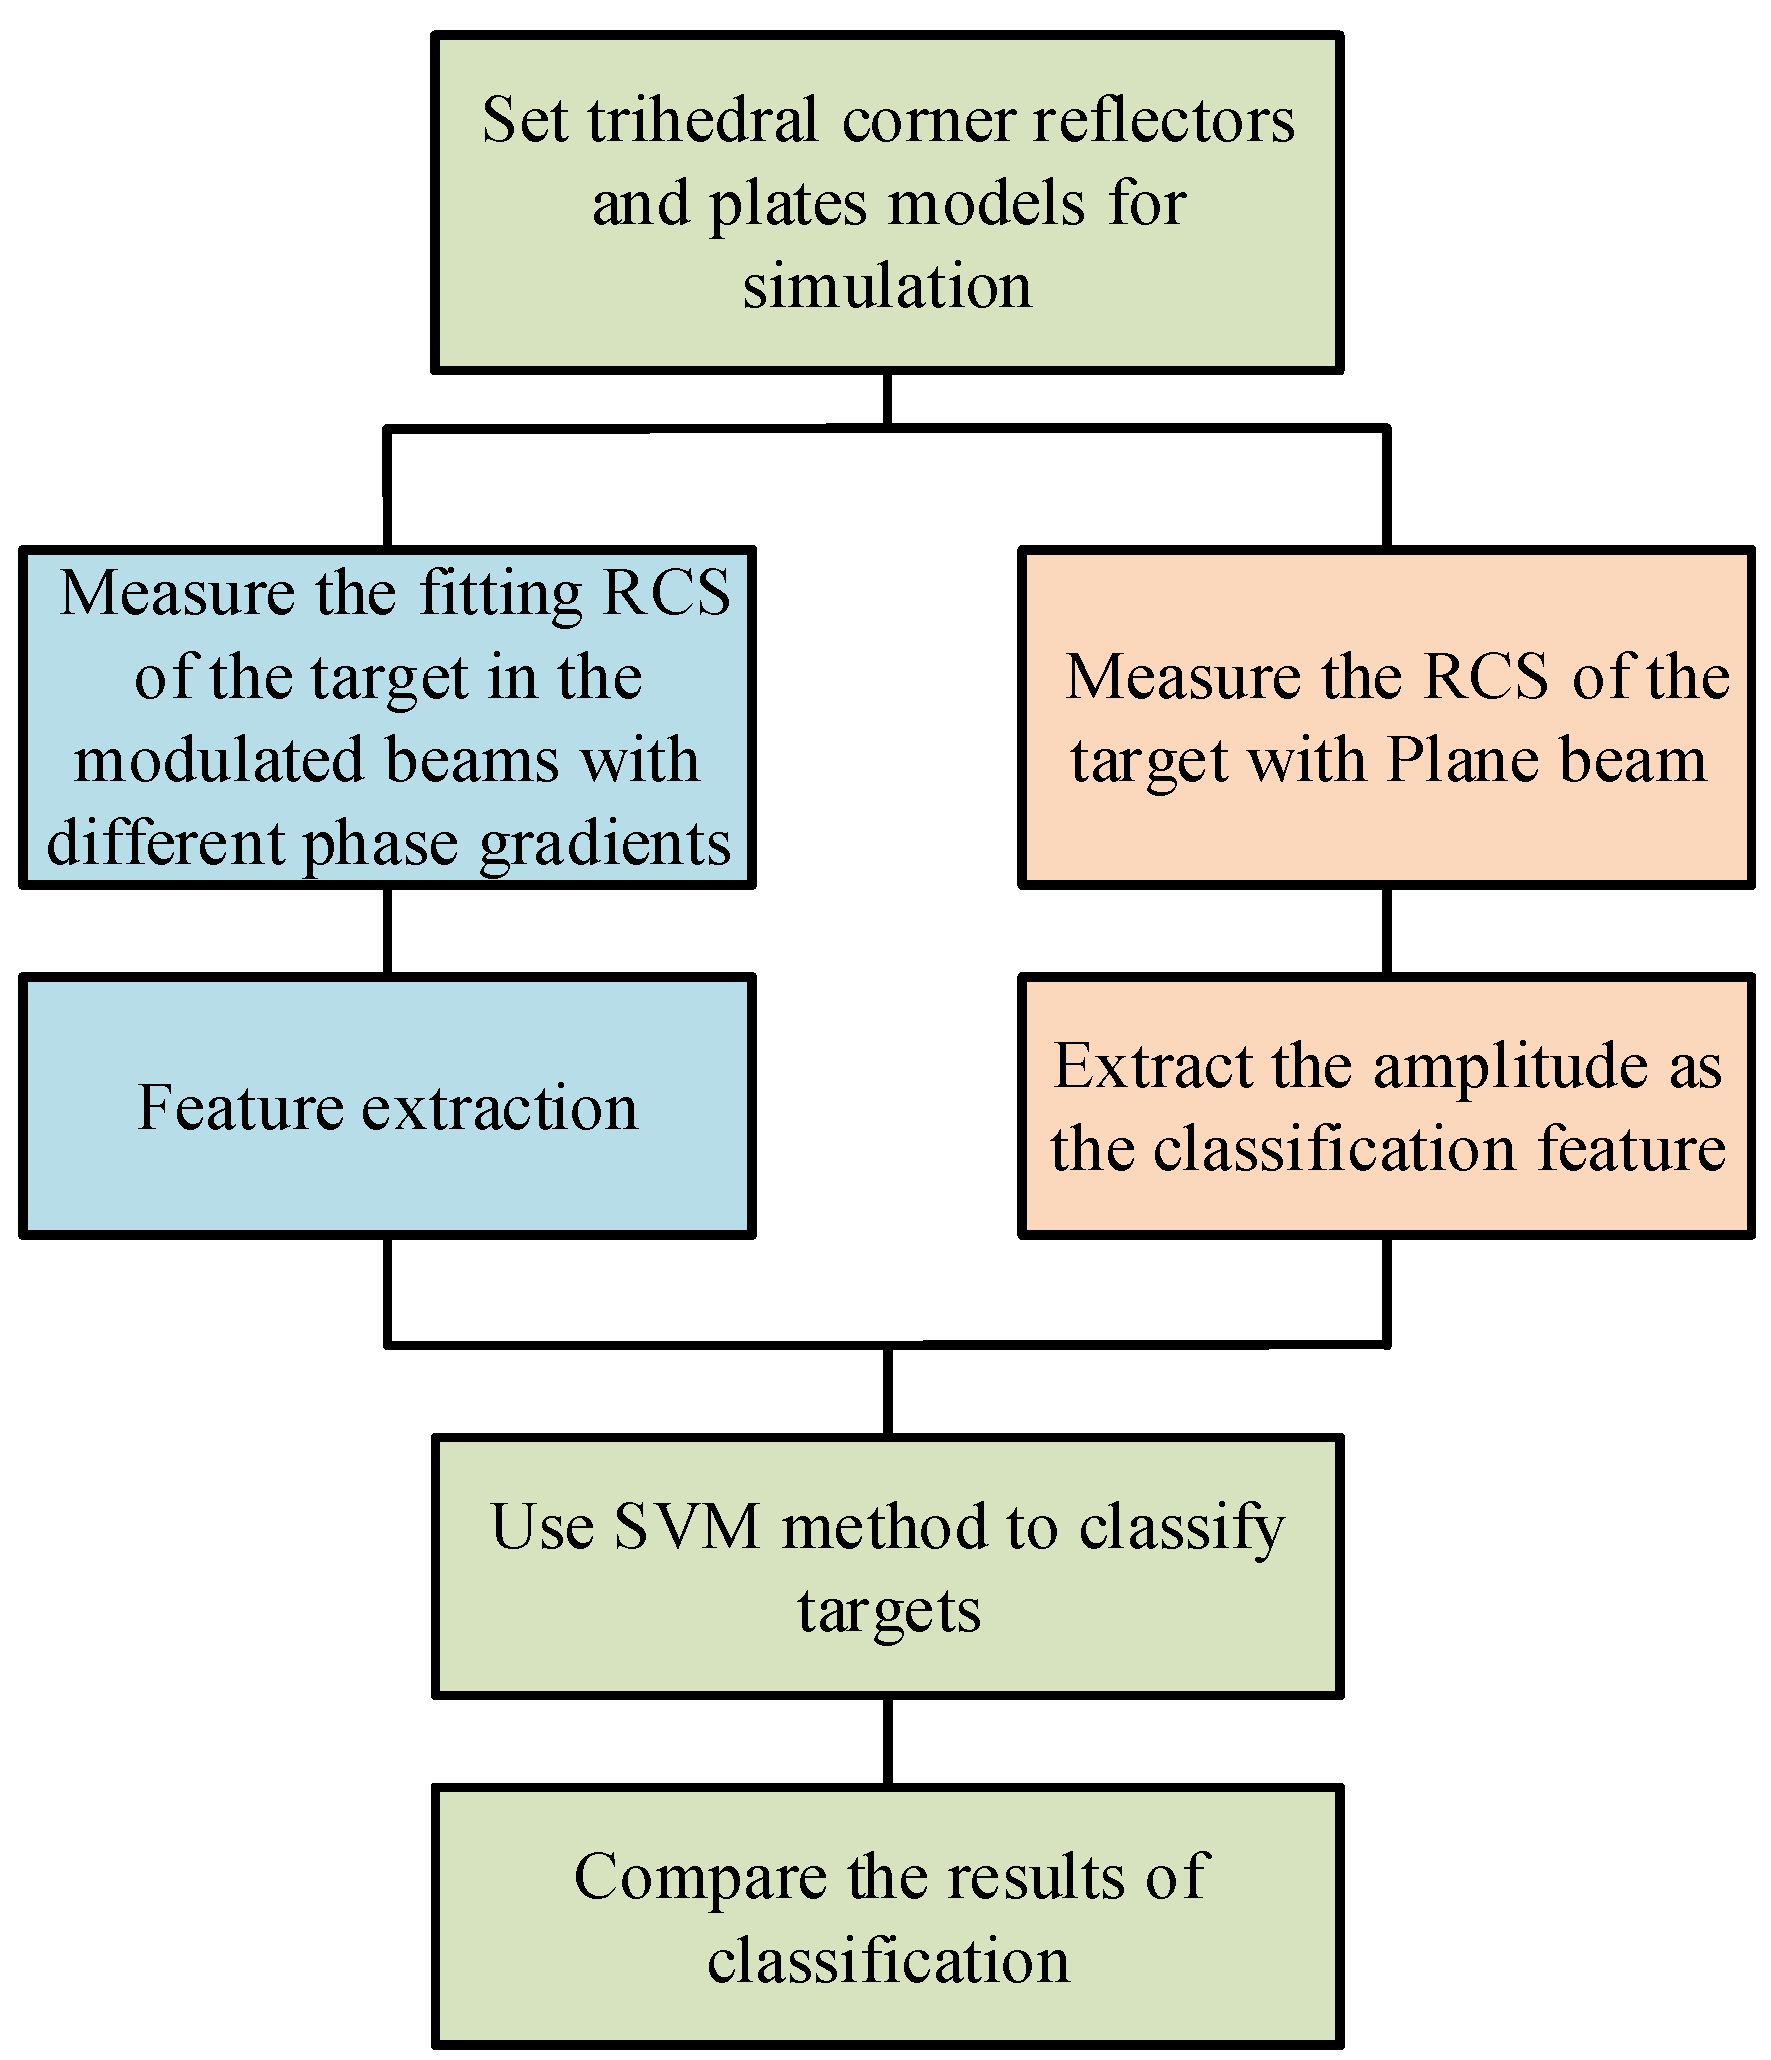
Figure 8.
The characteristic distribution of the plane beam (the number of data is 1386).
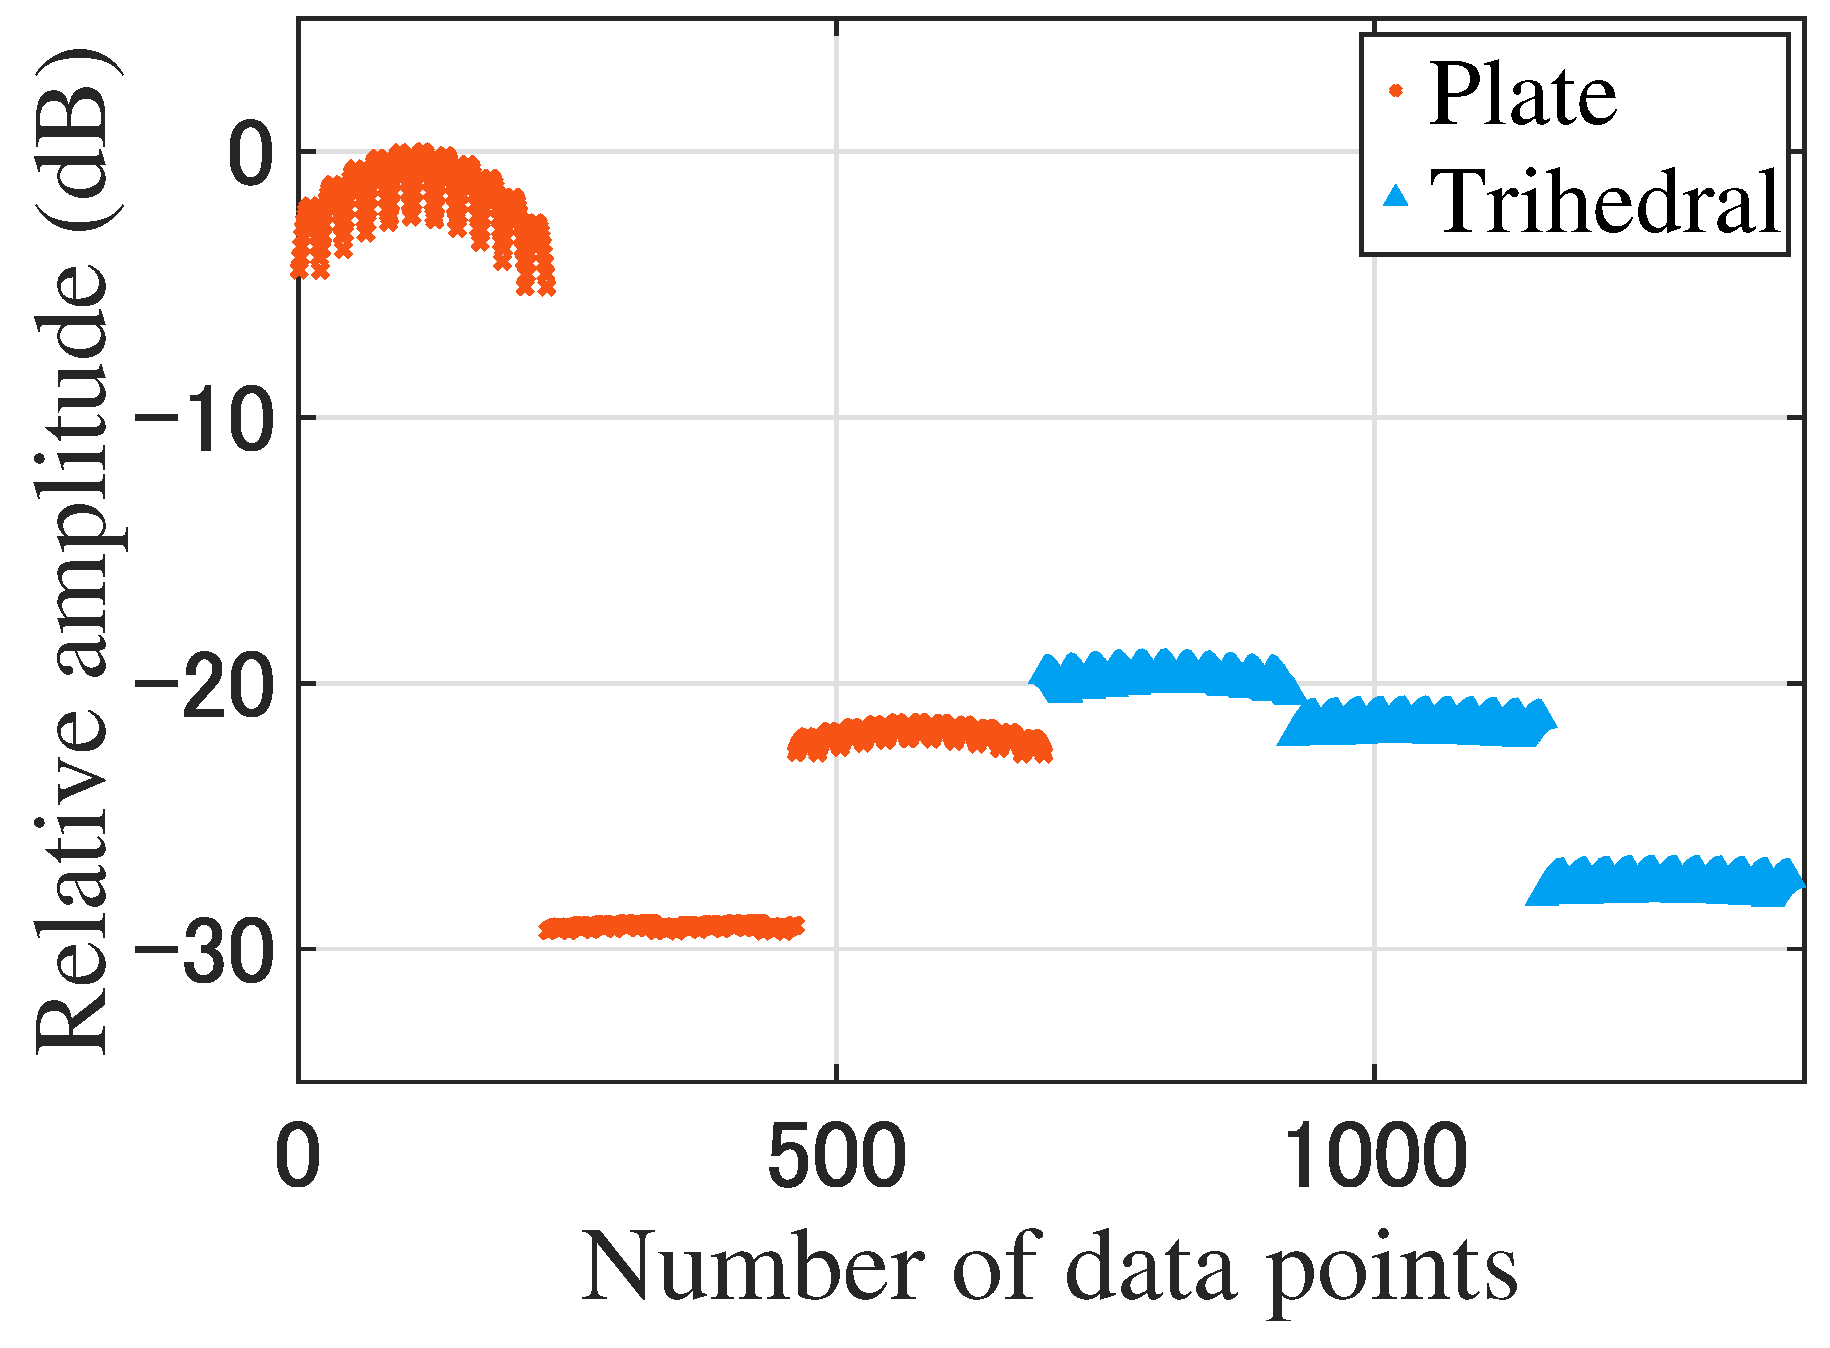
Figure 9.
The visualization of the features of the plates and trihedral corner reflectors after dimensionality reduction (the number of data is 1386).
Figure 9.
The visualization of the features of the plates and trihedral corner reflectors after dimensionality reduction (the number of data is 1386).

Figure 10.
Average recognition accuracy at different SNRs.


Table 1.
Relative amplitude coefficients of beams.
| N-th unit | 1 | 2 | 3 | 4 | 5 | 6 | 7 | 8 |
| Plane | 1 | 1 | 1 | 1 | 1 | 1 | 1 | 1 |
| Modulated I | 0.1 | 0.55 | 1 | 1.45 | 1.9 | 1.45 | 1 | 0.55 |
| Modulated II | 1 | 0.55 | 0.1 | 0.55 | 1 | 1.45 | 1.9 | 1.45 |
Table 2.
Relative amplitude coefficients of the receiving array (forst type).
| N-th unit | 1 | 2 | 3 | 4 | 5 | 6 | 7 | 8 |
| receiving | 1 | 1 | 1 | 1 + t | 1 + 2t | 1 + t | 1 | 1 |
Table 3.
The type of the targets.
| Type | Distance (m) | Length of Side (m) |
|---|---|---|
| Trihedral | 2 | 0.125 |
| Trihedral | 2 | 0.1 |
| Trihedral | 4 | 0.05 |
| Plate | 2 | 0.1 |
| Plate | 4 | 0.025 |
| Plate | 6 | 0.05 |
Table 4.
Relative amplitude coefficients of the receiving array (second type).
| N-th unit | 1 | 2 | 3 | 4 | 5 | 6 | 7 | 8 |
| receiving | 1 | 1 | 1 | 1 | 1 | 1 + t | 1 + 2t | 1 + t |
Table 5.
The classification rate of the modulated beam and plane beam.
| Average of Multiple Experiments | Predicted Class | ||
|---|---|---|---|
| Plate | Trihedral | ||
| Actual class (Modulated beam) | Plate | 100% | 0% |
| Trihedral | 1.45% | 98.55% | |
| Actual class (Plane beam) | Plate | 67.39% | 32.61% |
| Trihedral | 33.09% | 66.91% | |
Publisher’s Note: MDPI stays neutral with regard to jurisdictional claims in published maps and institutional affiliations. |
© 2022 by the authors. Licensee MDPI, Basel, Switzerland. This article is an open access article distributed under the terms and conditions of the Creative Commons Attribution (CC BY) license (https://creativecommons.org/licenses/by/4.0/).
Share and Cite
MDPI and ACS Style
Wang, X.; Zhang, Y.; Zhu, K.; Zhang, X.; Sun, H. Classification of Plates and Trihedral Corner Reflectors Based on Linear Wavefront Phase-Modulated Beam. Electronics 2022, 11, 4044. https://doi.org/10.3390/electronics11234044
AMA Style
Wang X, Zhang Y, Zhu K, Zhang X, Sun H. Classification of Plates and Trihedral Corner Reflectors Based on Linear Wavefront Phase-Modulated Beam. Electronics. 2022; 11(23):4044. https://doi.org/10.3390/electronics11234044
Chicago/Turabian StyleWang, Xiaodong, Yi Zhang, Kaiqiang Zhu, Xiangdong Zhang, and Houjun Sun. 2022. "Classification of Plates and Trihedral Corner Reflectors Based on Linear Wavefront Phase-Modulated Beam" Electronics 11, no. 23: 4044. https://doi.org/10.3390/electronics11234044
Note that from the first issue of 2016, this journal uses article numbers instead of page numbers. See further details here.