Abstract
Multi-static SARs from LEO orbits allow the single-pass high-resolution imaging and detection of moving targets. A coherent MIMO approach requires the generation of multi-band, thus orthogonal, signals, the fusion of which increases the system resolution. Up to now the synchronization capability of SAR signals of different satellites is critical. Here, we propose the use of photonics to generate, receive and distribute the radar signals in a coherent multi-static SAR constellation. Photonics overcomes issues in the implementation of MIMO SAR, allowing for the flexible generation of multi-band signals and centralized generation in a primary satellite with coherent distribution to all the secondary satellites of the SAR signals over FSO links. The numerical analysis shows the proposed system has a NESZ < −29.6 dB, satisfying the SAR system requirements. An experimental proof of concept based on COTS, for both signal up- and down-conversion, is implemented to demonstrate the system functionality, showing performance similar to the simulations. The implementation of the proposed systems with integrated technologies could reduce the system SWaP and increase robustness to vibrations. A design based on the consolidated SOI platform with the transfer printing-based hybrid integration of InP semiconductor optical amplifiers is proposed. The amplifiers compensate for the losses of the passive SOI waveguides, decreasing the overall conversion loss. The polarization multiplexing of the modulated and unmodulated combs to be sent from (to) the primary to (from) the secondary satellite over the FSO links avoids complex space-consuming optical filters requiring several control signals.
1. Introduction
Earth Observation (EO) from space is considered of fundamental importance for the European Union. One of the most effective EO methods is by using high-resolution Radio Frequency (RF) imaging from space through mission-specific Synthetic Aperture Radars (SARs) on low-orbit satellites [1,2]. High resolutions require antenna apertures of several km, not achievable by real antennas. Synthetic Aperture Radars exploit the satellite movement to synthesize a long antenna, observing the scene of interest and collecting radar echoes of the scene while moving over it, and then processing all the acquired data. Over the last decade, spaceborne SAR systems have evolved in two opposite directions: (i) single-node High-Resolution Wide-Swath (HRWS) systems that aim at enhancing resolution and coverage by resorting to increasingly expensive and power-hungry systems, demanding complex hardware; (ii) Low Size, Weight and Power-consuming (SWaP) systems on small satellites, where the rationale is not to outperform the big-sized satellites, but rather to reach high resolution, wide-swath imaging combined with fast temporal revisit through large constellations of SARs and information fusion.
Single-node SARs need multi-pass independent acquisitions [3] to obtain the desired resolution, requiring up to a few days, thus suffering from temporal decorrelation, atmospheric distortions and errors induced by the fusion of independent images. Instead, the use of multiple nodes (i.e., multiple SARs on a satellite constellation) introduces a twofold benefit: (i) a single-pass configuration for obtaining all the required detections, overcoming the temporal decorrelation issues; (ii) a multistatic approach enabling different viewpoints and introducing several benefits in the detection of targets with either a low scattering coefficient, or a huge angular variability. Moreover, it is more robust to shadow, foreshortening and layover effects: these cause the loss of information (in the shadow areas) and severely hinder the interpretability of the data (for example inverting the relative positions of targets at different altitudes, as in the case of layover). Several viewpoints also provide better performance in detecting moving targets: in fact, in the single-node SAR, the aperture synthesis happens under the assumption that the observed objects do not move nor change during the observation. In consequence, single-node systems fail to provide high-resolution images of moving targets such as vessels, or rapidly decorrelating targets such as the ocean surface, contrarily to multistatic SARs. Finally, while the single-node SAR resolution in the along-track direction depends on the length of the synthesized antenna and thus it can be considerably enhanced by the satellite movement, the bandwidth of the transmitted signal limits the resolution in cross-track direction. This limit can be reduced by multistatic detections exploiting the space diversity.
To maximize the imaging potential of multistatic systems, the level of cooperation among SARs has to be maximized too. Cooperation has a twofold meaning: (i) coherence among received signals; (ii) data processing with centralized (i.e., centralized processing of the received raw data without independent pre-processing) and coherent (i.e., based on signal amplitude and phase) capability [4,5]. The maximum level of cooperation is achieved through a coherent Multiple Input-Multiple Output (MIMO) approach with coherent and centralized processing.
In MIMO systems, each SAR transmits its own signal and receives the echoes from all the SARs, with the capability to jointly process them [6,7]. This concept should not be mistaken with what is usually named MIMO SAR, where the MIMO approach refers to the use of an antenna array in a single SAR satellite. MIMO radars can be considered as sparse antenna arrays and achieve an excellent cross-range resolution independent of the antenna features [4]. This way, in a system composed of N SARs (with N transmitters-TX and N receivers-RX), the maximum number of possible acquisitions (N·N = N2) is simultaneously captured with different combinations of incidence angles and looking directions. The radiometric quality of the imagery can be greatly enhanced by increasing the number of nodes cooperating coherently. Since in a MIMO system the N SAR transmitters are expected to illuminate a common area on the ground, they are requested to generate distinguishable orthogonal signals. A robust and simple approach consists in the frequency division multiplexing strategy, where the signals’ bands do not overlap and the orthogonality between waveforms is ensured [7]. This way, the fusion of the multiband detections (N bands) allows the synthesis of a larger bandwidth. As a result, the resolution is augmented roughly by a factor N in the cross-track direction, and it can also be significantly increased in azimuth due to enhanced azimuth ambiguity suppression, and to the squint diversity. In addition, frequency diversity involving significantly different spectral regions would allow the retrieval of even richer information of the area under observation, exploiting the different spectral response of the observed spot [8]. The further added values of the MIMO scheme are: (i) the presence of multiple receivers potentially increases the performance/capabilities by a factor N, as an equivalent N-times larger antenna would be available in reception; (ii) the multiple transmitters are expected to further lead to an overall N2 performance boost, thanks to the N-factor increase in power; (iii) MIMO schemes enhance the robustness of the system to eventual failures. The benefits of MIMO with coherent and centralized processing have already been preliminarily demonstrated [9,10].
The most cooperative systems deployed so far are bistatic SARs for spatial interferometry [11], observing the same spot from two satellites in close formation and with partial cooperation (i.e., independent data pre-processing) and synchronization based on Global Navigation Satellite Systems (GNSSs) and inter-satellite RF communications [12]. However, these synchronization approaches are limited in the attainable accuracy, impairing the focusing operation of the bistatic SAR image, and often requiring additional autofocusing algorithms [13], thus burdening the computational load of the overall processing chain. Up to now, these synchronization issues have hindered the development of more complex cooperating SARs constellations. A distributed architecture with centralized processing has been investigated, but not yet implemented, demonstrating the coherence and the centralized processing benefits on multistatic SARs [14]. In this case, the synchronization issues have been reduced envisaging RF analog links between each couple of transmitter and receiver. However, this solution is not suitable for MIMO approaches.
A multistatic coherent MIMO SAR system with the central and coherent fusion of all sensor raw data is still experimentally unexplored, except for a few limited lab prototypes [15,16].
Two main issues exist: (i) they need high-capacity data links able to guarantee signal coherence, to send raw data from the multiple radars to the central unit for joint data processing; (ii) they need precise time synchronization and high phase coherence between all the components of the distributed system and between all the bands [17].
Finding a solution based on standard RF technology is challenging, requiring complex wireless communication and clock distribution systems, with SWaP and interference problems. Moreover, due to the lack of frequency flexibility in standard RF technologies, the theoretical analyses on MIMO SARs [18] are limited to single-band systems only, and the impact of MIMO multi-band operation has not been investigated yet.
Recently, the potential of photonics and integrated photonics in implementing several advanced functionalities (e.g., wideband or multiband up- and down-conversion) in radars and other microwave systems has been demonstrated [19,20,21,22,23]. The possibility to distribute RF signals through optical fibers or Free Space Optical (FSO) links has also been demonstrated, with the benefits, compared to RF links, of maintaining an extremely high level of coherence and guaranteeing insensitivity to electro-magnetic interference. Moreover, integrated photonic technologies have already proven to be very promising in reducing the power/mass/volume budget, demonstrating their suitability for small satellite platforms [24].
In this work we present a coherent MIMO SAR architecture where photonics is used to generate, receive and distribute the radar signals. Integrated photonics is meant to be used for overcoming the current issues in the implementation of coherent MIMO SARs with centralized and coherent processing (i.e., the need of high capacity data links and of precise signal synchronization). In the proposed architecture, the synchronization issues are overcome by centralizing the generation of all the RF SAR signals in a single primary satellite that distributes them to several secondary satellites, where the SAR antennas are placed, through FSO links acting as high capacity analogue data links. The received echoes are then sent back to the primary satellite for a centralized fusion of raw data and for data relay to the ground. Primary and secondary satellites fly as a swarm on related orbits. The architecture concentrates in the primary satellite the direct generation and detection of all the multiband RF SAR signals, exploiting a single high-precision optical clock, thus providing high intrinsic coherence among all the RF sensor signals (for every secondary satellite and every band). This approach avoids the typically noisy electronic multistage up- and down-conversions, and the use of different electronic local oscillators for different bands.
Compared to conventional RF multi-band architectures, the photonics-based solution relaxes the bandwidth requirements for the RF technology, not including large band RF local oscillators and mixers. Moreover, the distributed photonic payload allows for the concentration of most of the power-hungry and complex hardware in the primary satellite, thus reducing the cost of the secondary satellites and increasing their lifetime. Consequently, the number of SAR nodes can be increased without cost explosion.
2. Definition of the SAR System Parameters
In this section the parameters of the SAR system are defined. The parameters will be used in the analysis detailed in the following sections to identify the requirements of the proposed optical system. Figure 1 depicts a general MIMO SAR scenario, where different satellites move along separate, but close Low Earth Orbits (LEOs). Each satellite illuminates the same Earth portion, working both as transmitter and receiver. In this work, we consider a case of reduced complexity where two satellites are present: a primary, working as the transmitter of the SAR signal, and a secondary working as receiver, in a bistatic configuration similar to the one implemented in Tandem-X [25]. The primary and secondary satellites are located on the same orbit (in-plane configuration), a configuration where the scattering coefficients for different surfaces (desert, ocean, …) can be analytically calculated. Unlike in [23], where inter-satellite distances of a few km are addressed, in this work we aim to investigate the performance of the proposed system for longer distances, up to 10 km. Relatively short distances keep the SAR signals received from each satellite coherent, reducing the impact of the atmospheric propagation, thus allowing for high-resolution imaging. The parameters of the SAR satellites are shown in Table 1.
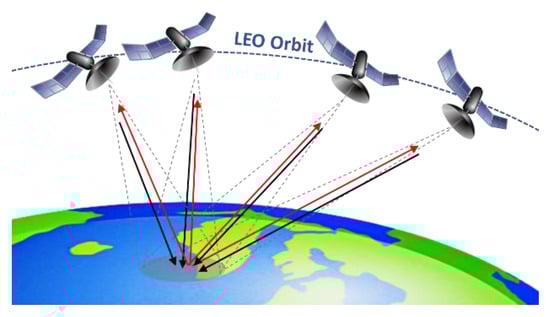
Figure 1.
Example of MIMO SAR configuration based on a swarm of satellites in LEO orbits.

Table 1.
SAR satellite parameters and requirements [25].
Most of the parameters are chosen to match the SAR mission Tandem-X (height, chirp bandwidth, power, duty cycle, Pulse Repetition Frequency (PRF), antenna length, antenna width, antenna loss). For the multi-band capability, frequencies from different bands, i.e., orthogonal, are exploited. For the C, X and Ku bands, the frequencies of the satellites Sentinel-1 [26], Tandem-X [25] and SRAL [27] are chosen.
The sensitivity of the bistatic SAR system is identified by Noise Equivalent Sigma Zero (NESZ), a typical SAR parameter that corresponds to the target reflectivity that gives a received Signal-to-Noise Ratio (SNR) equal to 1. Noise Equivalent Sigma Zero quantifies the system sensitivity and will be considered the target requirements for the numerical analysis detailed in the following sections.
Earth reflectivity is calculated for two scenarios: the desert and the slight swell sea, corresponding to Code 3 of the World Meteorological Organization, from here on referred as state 3 sea. The desert is a surface with relatively high reflectivity, while state 3 sea is a surface with relatively low reflectivity. From the reflectivity, the losses of the SAR signals are calculated according to the radar equation, including the atmospheric losses in conditions of clear sky. These losses are considered in the system numerical analysis to calculate the overall system performance.
The total received power Pr can be calculated using a radar range equation in a bistatic SAR scenario [28]:
Pr = (Pta·Gt·Ares·σB·Ar)/(16π2·Rt2·Rr2·L)
Here, Pta is the average transmitted power, Gt is the transmitting antenna power gain, Ar is the receiver antenna aperture and Ares is the area of resolution cell. Rt and Rr are the range of area of interest from transmitter and receiver, respectively, while L is the antenna and atmospheric total loss. The antenna loss is 3.1 dB, which is taken from the Tandem X SAR missions [25], whereas atmospheric losses, such as tropospheric losses, gas absorption, etc. can be found in [29]. σB is the bistatic reflection coefficient, which varies with the type of Earth surface and transmitter and receiver angle of the bistatic SAR configuration. The bistatic reflection coefficient can be calculated starting from the monostatic reflection coefficient according to the following equation [30]:
where σM is the monostatic scattering coefficient, whereas θi and θs are the incident and scattering angles, respectively. The monostatic reflection coefficients are extracted as in [31]. The bistatic reflection coefficients as a function of grazing angle for C (5.4 GHz), X (9.6 GHz) and Ku (13.5 GHz) bands for desert terrain and state 3 sea are shown in Table 2. The overall loss, calculated by subtracting received power from the total transmitted power, is used in the numerical analysis to evaluate the system performance, which is discussed in the next sections. Besides the reflectivity, the SAR processing gain is calculated. This gain is due to the overlapping of registered SAR images taken at the different positions along the track, i.e., time averaging and the pulse compression gain [28]. The processing gain has to be taken into account in the numerical analysis to determine the overall system SNR. The overall SNR of the SAR system can be expressed as:
where k is the Boltzmann constant, T the system temperature, B the noise bandwidth, Gcomp the compression gain due to the chirp of the radar pulse and Gint the gain due to the time integration. Gcomp and Gint can be expressed as:
where Dc is the radar signal duty cycle, PRF the pulse repetition frequency, λ the wavelength of the RF signal, R the satellite height orbit, vs. the satellite ground speed and Rx the cross-range. Table 2 summarizes the processing gain values, calculated as Gcomp·Gint. These values are used in the numerical analysis for the system performance evaluation.
σB = σM(sin(θs)/sin(θi))1/2
SNR = Pr/(kTB) × Gcomp × Gint
Gcomp = B·DC/PRF
Gint = PRF·λ·R/(2·v·Rx)
Table 2.
Calculated bistatic reflectivity and processing gain for desert and state 3 sea in C, X and Ku bands.
3. Photonic-Based MIMO SAR Constellation Architecture
The proposed approach for a MIMO SAR formation based on photonics is represented in Figure 2.
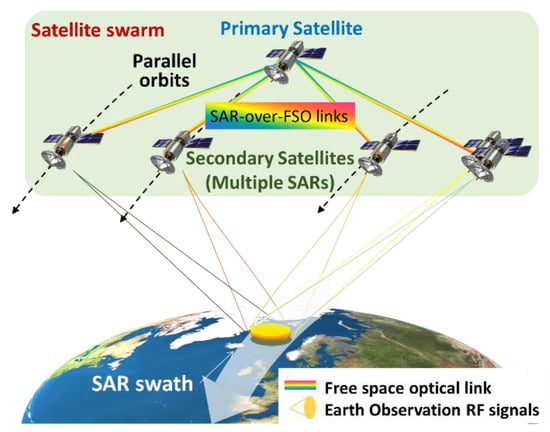
Figure 2.
Proposed approach of a MIMO SAR satellite formation based on optical generation, detection and distribution of RF signals. A primary satellite sends and receives the radar signals to/from secondary satellites. The secondary satellites operate as sensor peripherals, transmitting the radar signals to Earth surface and receiving the back-scattered echoes. The satellites operate in close LEO orbits. FSO: free-space optical link.
The satellites are organized as a radar network, whose nodes are distributed in a two-level hierarchy (see Figure 3): a primary satellite and secondary satellites. The transmitter in the primary satellite first generates the Intermediate-Frequency (IF) electrical radar waveforms, and then electro-optically (E/O) converts them into optical signals that the optical front-end distributes to the secondary satellites on FSO links. In the receiver of each secondary satellite, the received optical signals undergo an opto-electronic (O/E) conversion followed by a frequency up-conversion to RF. The obtained RF radar waveforms are transmitted by the RF front-end to the Earth’s surface. Subsequently, the RF backscattered echoes from the Earth are received by all the secondary satellite RF frontends. In the transmitter of each secondary satellite, the received RF backscattered echoes are E/O-converted into optical signals that the optical front-end send back to the primary satellite on FSO links. The receiver in the primary satellite first O/E and then frequency down-converts to IF all the gathered optical signals. In the receiver, these electrical IF signals, carrying the echo information sent by secondary satellites via the FSO links, are first digitized via Analog-to-Digital Converters (ADCs) and then digitally pre-processed. These on board-generated SAR digital data are stored and used as base-band signals for the RF front-end that delivers them to a Ground Station (GS) on RF links as for the standard SAR systems [25].
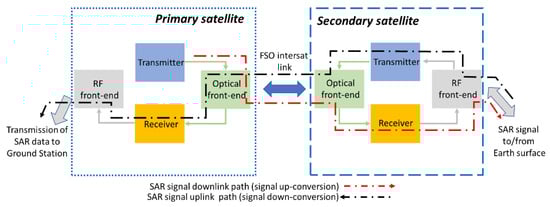
Figure 3.
Architecture of the transceivers on primary and secondary satellites. The transmitters and receivers implement photonic techniques for RF signal up- and down-conversion.
The strength of the proposed approach is that the RF transmitted signals and received echoes are obtained by the O/E conversion of optical signals generated by the same optical source in the primary satellite. Therefore, the overall signal coherence and synchronization is guaranteed, without needing dedicated RF clock signal distribution. Moreover, this architecture ensures the possibility of the exchange of analog signals and raw data between the primary and the secondary satellites, allowing for distributed remote sensing and, at the same time, for centralized data processing with no information loss. These architectural advantages are enabled by the use of photonics to exchange signals between primary and secondary satellites through FSO links.
The proposed architecture is suitable for the generation of multiple radar signals at different carrier frequency with the single photonic core, i.e., enabling multiband multistatic SAR interferometry. The possibility of applying SAR interferometry with multiple bands allows an increase in the overall system resolution [7,8].
3.1. Architecture of the Satellite Electro-Optical Modules
Figure 4a shows the architecture of the electro-optical module for the generation and transmission of the radar signals at the primary satellite.
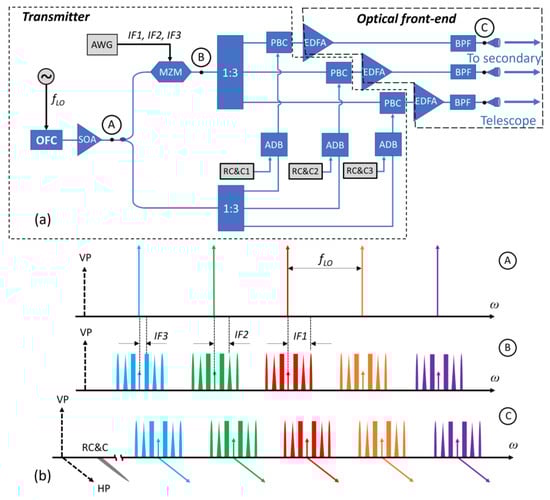
Figure 4.
Primary satellite transmitter section. (a) Block diagram of the architecture. This part operates the generation and E/O conversion of the radar waveforms at IF and the generation of remote command and control signals to coordinate the operation of the secondary satellite. (b) Spectra representation of the signals in representative points of the architecture.
The optical source, common for the whole system, is an Optical Frequency Comb (OFC) obtained by the external E/O modulation of a Continuous Wave (CW) laser, obtained by overdriving a low-Vπ Mach–Zehnder Modulator (MZM) with an electrical Local Oscillator (LO) at frequency fLO. The OFC spectrum, at point A of the block scheme, is made of five lines spaced by fLO, as schematically depicted in inset A of Figure 4b.
After amplification by a Semiconductor Optical Amplifier (SOA), the OFC is equally split over two paths. On the upper path, it is fed into a MZM implementing a Double Side Band-Carrier Suppression (DSB-CS) modulation of the optical source controlled by three IF radar electrical signals, at frequencies IFn and with bandwidths Bn, (n = 1, 2, 3) generated by an Arbitrary Waveform Generator (AWG). Inset B of Figure 4b shows the resulting optical spectrum at point B of the scheme. Each mode of the OFC is partially suppressed, because of the finite Extinction Ratio (ER) of the MZM, and exhibits three Upper Side Bands (USBs) and three Lower Side Bands (LSBs) each spaced from the carrier by IF1, IF2 and IF3. On the other hand, on the lower path, the OFC does not undergo any operation. A 1:3 splitter is present on both the branches. On the lower path, a Remote Command and Control (RC and C) signal, is coupled to the OFC thanks to an Add/Drop Block (ADB) with the aim of coordinating the primary satellite and remote-driving the operations of all the secondary satellites. On the upper path, Polarization Beam Combiners (PBCs) couple the split DSB-CS-modulated OFC to the corresponding unmodulated OFC. The PBC behaves like a 3-dB coupler, but the two inputs are transmitted separately to the output along two orthogonal polarization axes. This allows the avoidance of the use of optical filters, i.e., to reduce the system complexity. Then, the signal is boosted by an Erbium-Doped Fiber Amplifier (EDFA) and filtered by an optical Band-Pass Filter (BPF), to reject most of the out-of-band Amplified Spontaneous Emission (ASE) noise. Inset C in Figure 4b shows the optical spectrum at the output of each BPF, point C highlighting the Vertical (VP) and Horizontal (HP) Polarizations. Three telescopes collimate the resulting three optical signals on a secondary satellite, making possible the FSO link.
The three secondary satellites own the same architecture, reported in Figure 5a. A telescope allows the receiving of the optical signal transmitted by the primary satellite, and the optical spectrum of the received signal at point D of Figure 5a is the free-space propagation losses-attenuated replica of the optical spectrum in Figure 4b inset C. A pre-amplifier, i.e., an EDFA with low Noise Figure (NF), allows these losses to be largely compensated for. After a BPF to reject ASE noise, a Polarization Beam Splitter (PBS) separates the signals along VP and HP over two paths, at the same time aligning them along the same VP axis. Insets E and F of Figure 5b show the output spectra at points E and F, respectively. It is worth noticing that, before point F, another ADB takes care of dropping the RC and C signal, which is photodetected and employed to drive the secondary system operations. The signals at points E and F are heterodyned into a Balanced Photo Detector (BPD), then O/E converted and, eventually, boosted by an electrical High-Power Amplifier (HPA), thus producing some radar electrical waveforms replica up-converted to different radio frequencies. The up-conversion process causes a phase noise increasing with the frequency of the RF carrier, which has to be taken into account when high-frequency RF carriers are considered.
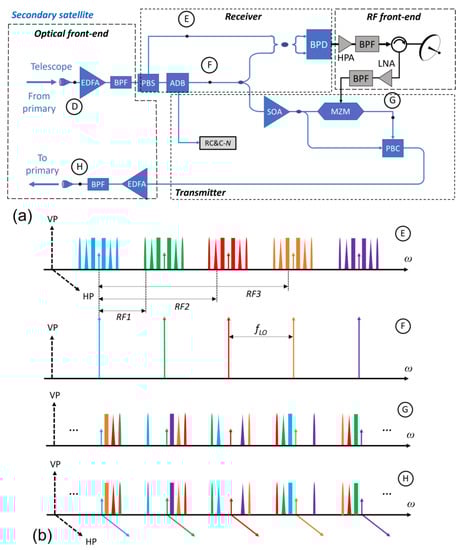
Figure 5.
Secondary satellite architecture. (a) Block diagram of the architecture. This part operates the O/E up-conversion of the radar waveforms to RF and E/O conversion of the backscattered radar signal to be sent to the primary satellite. (b) Spectra representation of the signals in representative points of the architecture.
Among all the generated frequencies, a BPF selects the frequencies RF1, RF2 and RF3 to be delivered to the antenna. The insets E and F of Figure 5b report the corresponding frequency spacing involved in the optical beating. The BPD output is split over three paths, so that the three radar waveforms can be selected on each arm by a further BPF and transmitted in three different regions of the electromagnetic spectrum, namely in the C, X and Ku band. For the sake of simplicity, the three electrical output paths are not represented in Figure 5a.
After transmission, the three signals are backscattered by targets on the Earth and received by the same antenna, and an electrical circulator separates the transmit and receive paths. After being received, the echoes are amplified by a Low-Noise Amplifier (LNA), filtered by a BPF, and E/O-converted by a MZM, so that they can be employed to DSB-CS modulate the unmodulated OFC replica in point F, amplified by an SOA. The obtained optical signal, in point G, has a spectrum as the one sketched in inset G of Figure 5b. It is worth noticing that this time, each modulated line of the OFC has three USBs and LSBs at RF1, RF2, RF3 distance on the frequency axis. Figure 5b reports only the sidebands falling in between other modes. Here, the color-coding helps understanding to which of the modes each sideband corresponds. As an example, the central mode in red has the USB and LSB at RF1 distance, and the USB and LSB at RF2 distance, in red, falling in between other OFC modes. The USB and LSB at RF3 distance are not represented, since they are far away in frequency from the closest modes, i.e., below the lowest frequency one in light blue, and above the highest frequency one in purple. After amplification by the SOA, the signal in F is equally split and recombined with its modulated replica in point G by a PBC, obtaining at the output the two signals on orthogonal polarization axes. Afterwards, the optical signal is boosted by an EDFA, filtered by a BPF for ASE noise rejection, and sent back to the primary satellite over a FOS link thanks to a telescope. Inset H in Figure 5b sketches the spectrum of the transmitted signal.
Figure 6a reports the architecture of the receiver (RX) section of the primary satellite. The optical signal transmitted back from the secondary satellites is received by three telescopes over three separated branches, one for each Secondary. Considering a single branch, the received signal is pre-amplified by a low-NF EDFA and filtered by an optical BPF. The obtained spectrum is equivalent to the one in inset H of Figure 5b, with the modulated comb replica over the VP and the unmodulated replica over the HP. A PBS separates the two polarizations over two outputs, aligning both along the VP axis. This way, the two separated optical signals are obtained at points J and K of the block scheme in Figure 6a, whose spectra are represented in the insets J and K of Figure 6b, respectively. The two signals are fed into the inputs of a BPD, generating an electrical output signal containing many beat products. After amplification, a bank of low-frequency BPFs selects the terms down-converted at IF1, IF2, IF3. To obtain the signal separation over three frequencies, as in the secondary TX section, the BPD outputs must be divided over three paths and then recombined. Also here, for the sake of simplicity, this has not been represented in Figure 6a. After filtering, the signals are acquired by an ADC before processing for SAR imaging.
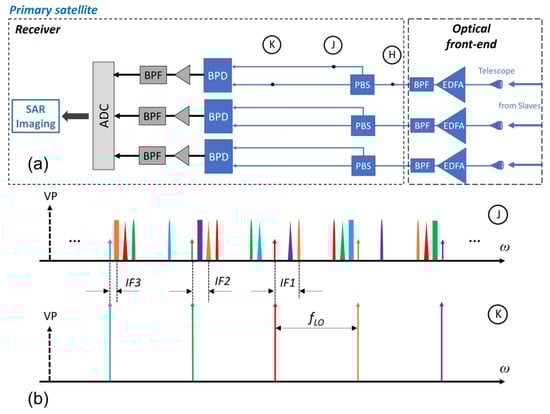
Figure 6.
Primary satellite receiver section. (a) Block diagram of the architecture. This part operates the O/E down-conversion of the radar waveforms. (b) Spectra representation of the signals in representative points of the architecture.
3.2. Inter-Satellite Free-Space Optical Links Assessment
The proposed multistatic SAR approach based on photonic signal generation, detection and distribution requires FSO links to be established between the primary and the secondary satellites as seen in the previous paragraphs. Inter-satellite FSO links have been demonstrated for many years for Geostationary Earth Orbit (GEO) to LEO, LEO to LEO, GEO to Ground communication links [32]. The interest of the international space agencies in deep-space exploration also brought the investigation of deep-space FSO links from Mars to Earth [33]. A first demonstration is represented by the Lunar Laser Demonstrator, where a FSO link between the Moon and the Earth was established [34].
Interest in building satellite networks to relay large data traffic from different parts of the Earth has pushed the industry to develop commercial compact optical transceivers for inter-satellite links targeting medium and small satellites for LEO to LEO [35,36,37], LEO to Ground [38] and LEO to GEO [37,39] communications. In the following, the FSO link is discussed in terms of loss and optical phase coherence.
3.2.1. Loss Budget
The SAR formation envisaged in the proposed application requires the establishment of FSO links for the exchange of the SAR signal between the primary and secondary satellites. In the Tandem-X SAR formation, based on two satellites, the maximum separation among the satellites is in the order of 1–2 km [25]. In order to investigate the capabilities of the proposed system, a FSO link length of up to 10 km is considered.
The propagation loss for the inter-satellite links is due to the divergence of the diffraction-limited collimated beams. Since the LEO orbit is much higher than the atmosphere upper limit, atmospheric losses are not significant. To estimate the free-space losses, we consider an optical antenna (telescope) with 7 cm diameter, according to the design trends for optical heads designed for the LEO to LEO scenario [37]. A wavelength of 1550 nm is considered, according to the tendency that considers for inter-satellite links wavelengths corresponding to the ones used for the established terrestrial optical communications systems. The loss can be calculated as the ratio between the beam area and the optical antenna aperture area at the receiver. The beam area at the receiver is proportional to the link length and to the diffraction-limited beam divergence angle θ ≈ λ/D, λ being the signal wavelength and D the optical transmitting aperture diameter [40]. The longer the FSO link, the higher the propagation loss.
Concerning losses to the pointing system, these are due to the residual pointing error not being compensated by the fine pointing tracking system that is based on fast steering mirrors. The residual pointing error causes a rotation of the radiation pattern of the optical antenna; thus, its maximum is no longer oriented to the center of the receiver aperture. The power reduction corresponding to the uncertainty angle can be easily calculated from the radiation pattern of the circular aperture of the optical antenna [40]. Considering a residual pointing uncertainty < 10 μrad [35,41,42], the pointing loss can be estimated as 2 dB. In the power budget, we also have to take into account other losses due to non-idealities of the transmitter and the receiver. Table 3 summarizes all the parameters for the FSO link loss calculation. Up to 1 km link length, the loss is 10.21 dB. For a FSO link of 10 km, the loss is 21.3 dB. These values of losses can be easily compensated by standard commercial space-qualified EDFA.
Table 3.
Inter-satellite FSO link parameters and loss budget [40].
3.2.2. Impact on Signal Coherence
The impact of the FSO link on the coherence of the SAR signal is discussed in this subsection. Since atmospheric effects are not present, the signal coherence can be affected only by the satellite motions:
- Relative movement among the primary and secondary satellites;
- Mechanical vibrations of the satellite platform.
As described in previous sections, in the proposed architecture the up- and down-conversion of the radar signal is obtained by the beating into a photodiode (PD) of an optical comb with the sidebands of a modulated signal. The photodiode output signal given by each beating can be expressed as:
where R is the responsivity of the photodiode, fi is the optical frequency, ki = 2πfi/c is the wave vector, c is the speed of light, z is the distance between primary and secondary satellite, ϕi is the initial phase of the optical signal, A(t) is the amplitude of the modulating signal, C is the amplitude of the optical carrier. For i = 0 (1), the parameters are referred to the optical carrier (optical modulating signal). Assuming equal amplitudes and substituting z = v·t, v being the relative speed among the primary and secondary satellite platforms along the FSO link direction, Equation (6) yields:
PDout = R|C·exp (j·2πf0t + k0z + ϕ0) + A(t)·exp (j·2πf1t + k1z + ϕ1)|2
PDout∝cos [2π(f0 − f1)·(1 + v/c)·t + (ϕ0 − ϕ1)]
Equation (7) shows that the RF signal at f0 − f1 is affected by a Doppler frequency shift due to the relative movement of the satellite platforms. In order to estimate the amount of Doppler shift, we can refer to the Tandem-X SAR constellation, where two satellites fly in close orbits and the difference in the satellite speed is lower than 1 m/s [43]. The resulting frequency shift is lower than 33 Hz. This is a small amount compared to the frequency of the RF signal, e.g., a few GHz. Nevertheless, since the satellite orbit is known at each time with a precision better than 1 mm [43], this amount of Doppler frequency shift can be compensated at the signal processing stage.
The impact of vibrations can be estimated by considering the maximum vibration measured on a satellite platform. According to [44], the maximum platform vibration is 0.5 m·s−2 @ 30 Hz. A rough estimation of the maximum vibration-induced speed is 0.016 m/s, which corresponds to a frequency shift of 0.5 Hz @ 10 GHz. This is a very small amount that should have a negligible impact on the system performance. The impact of the vibration on the pointing precision has already been discussed in the previous paragraph.
The FSO link losses in the analysis detailed in this paragraph are used in the system simulation analysis described in the next section.
4. Numerical Analysis of the System
The proposed photonics-based SAR architecture is numerically investigated by means of the commercial Computer Aided Design (CAD) tools of VPI Photonics. Referring to Figure 3, the performance of the photonic circuits involved in the signal up (primary satellite transmitter and secondary satellite receiver) and down (secondary satellite transmitter and primary satellite receiver) conversions are investigated. The parameters used in the simulations are summarized in Table 4. The goal of the analysis is to estimate the system performance for three different RF bands (C, X and Ku), which are the main bands used in the SAR systems. The capability of a system to up (down)-convert a radar signal from (to) an IF can be measured referring to the system NF conversion loss, i.e., the difference between the power of the signal at IF (RF) and the power of the signal at RF (IF) input and output SNR. Table 5 summarizes the simulation results that will be compared in the next section with the experimental ones obtained from the characterization of the system implemented with Commercial-Off-The-Shelf (COTS) devices.
Table 4.
Simulation parameters.
Table 5.
Simulation performance for the up- and down-conversion.
In the worst case, the output SNR is higher than 42.7 dB, the NF is lower than 60.2 dB and the conversion loss is lower than 32.5 dB.
The linearity of the system is strongly influenced by the linear response of the modulators [45]. A two-tone analysis is carried out for the considered bands both for up- and down-conversion. The analysis accounts, as input signals, for two 10 MHz spaced tones. Figure 7 shows the obtained results. The Spurious-Free Dynamic Range (SFDR) is higher than 85 dBHz2/3 for all the considered cases, with all performance included in a range of 7.85 dBHz2/3. The noise floor is not flat for high input powers. This is due to the ASE-signal beating summing with the ASE-IMD3 beating. The floor starts increasing when the latter becomes stronger.
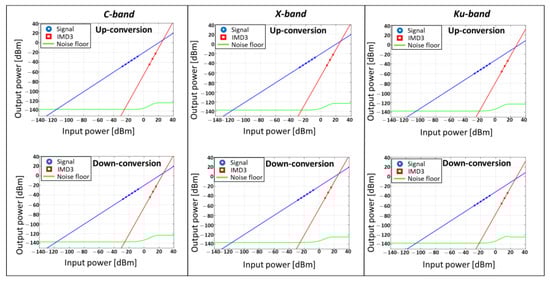
Figure 7.
Two-tone analysis for up- and down-conversion for C, X and Ku bands.
Simulations of the whole SAR system are also implemented, i.e., including the RF front-ends to send/receive the signal from the Earth’s surface, the SAR signal propagation through the atmosphere, the scattering from the Earth’s surface, and the optical FSO link losses calculated with the analysis reported in Section 3. The goal of this analysis is to calculate the performance of the overall photonic-based SAR system, comparing it with the performance expected for the implemented multi-static SAR system Tandem-X.
Figure 8 shows the simulated scheme, which reproduces the photonic systems architecture in Figure 3. Two different Earth surfaces are considered with high (desert) and low (sea) scattering coefficients. The RF front-ends include the cascade of a preamplifier with a booster on the transmitter side, and the cascade of three low-noise amplifiers on the receiver side, in order to compensate for the high losses suffered by the SAR signal. Besides the NF and the conversion loss, the quality parameter NESZ is considered, which is the main parameter to evaluate SAR system sensitivity (see Section 2). The NESZ is calculated from the Earth’s surface reflectivity and the signal SNR after the SAR processing gain [43]. The simulations are carried out for a high (60 deg) and low (45 deg) incidence angle of the SAR signal.
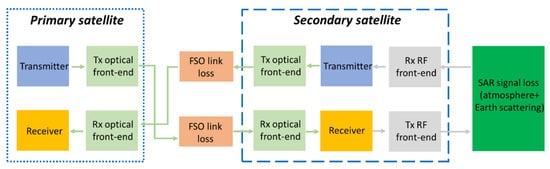
Figure 8.
Scheme of the simulated proposed SAR system.
Table 6 summarizes the obtained results. The highest NESZ is −29.62 dB. This value indicates the system sensitivity can satisfy the requirements of a deployed system, e.g., Tandem X, where the target NESZ is −26 dB. The lowest performance is for the Ku band due to the higher SAR signal attenuation through the atmosphere.
Table 6.
Simulation performance for the whole proposed SAR system (concatenated up- and down-conversion), including optical FSO link losses, SAR signal propagation through atmosphere, Earth surface scattering. Different surfaces and SAR incidence angles are considered.
5. Proof of Concept of the Main Optical Systems
The main optical systems of the proposed photonic architectures for the primary and secondary satellites were implemented with COTS and characterized in the laboratory. This approach is useful to investigate the capability of the proposed system, despite the fact that the system stability is not comparable to the one reachable with an integrated photonic circuit.
Figure 9 shows the scheme of the experimental set-up. A 1550 nm laser with 100 kHz linewidth and 14 dBm output power generates the input signal, which is fed into a dual-drive MZM for the generation of the comb [46]. A 7 GHz sinusoidal electrical signal, generated by a synthesizer, drives the MZM. An electrical delay line allows the optimization of the equalization of the comb. The comb is then amplified with an EDFA and filtered with an optical BPF with a 1 nm 3 dB bandwidth. The signal is then split over two arms of a Polarization Maintaining (PM) splitter. In order to set the polarization aligned with the principal axes of the PM splitter, a polarization controller is used. The signal on the upper branch (A) is fed to a MZM driven by a DAC. For the testing of the up-conversions, the DAC generates three electrical signals at intermediate frequency (IF) (0.5, 1.6, 2.6 GHz) that modulate each line of the comb. The carrier is suppressed to build a double-sideband carrier suppressed signal. On the lower branch (B), the comb is attenuated with a Variable Optical Attenuator (VOA) and its delay adjusted with a variable Optical Delay Line (ODL). The lengths of the upper and lower branches are matched within a tolerance better than 2 cm. The signals at the end of the upper and lower branches are coupled with orthogonal polarization with a PBC according to the working principle explained in the previous sections. The two orthogonal signals are then separated with a PBS and sent to a BPD after coupling for the signal testing. For the testing of the down-conversion functionality, the DAC generates three electrical signals at RF (5.4, 9.6, 13.5 GHz). Figure 10-left shows the spectrum of the optical comb captured with a with a high-resolution optical spectrum analyzer. The five highest lines exhibit a spectral flatness within 10 dB. Figure 10-right shows the spectrum of the modulated comb. As an example, the case where the setting of the modulator working point was more critical, i.e., corresponding to a 2.6 GHz IF, is shown. The suppressed comb carriers and the modulation sidebands are visible in the spectrum.
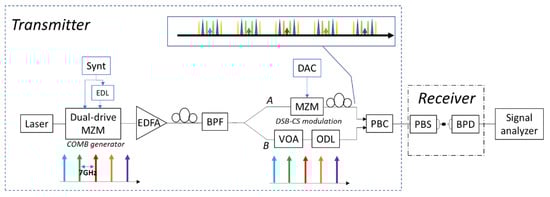
Figure 9.
Experimental set-up for the characterization of the optical circuit for the RF signal generation (up-conversion) and detection (down-conversion). Referring to Figure 3, the transmitter and receiver devices are highlighted. MZM: Mach–Zehnder modulator; EDL: electrical delay line; EDFA: Erbium doped fiber amplifier; BPF: band pass filter; VOA: variable optical attenuator; ODL: optical delay line; DAC: Digital to analog converter; PBC: polarization beam combiner; PBS: polarization beam splitter; BPD: balanced photodiode.
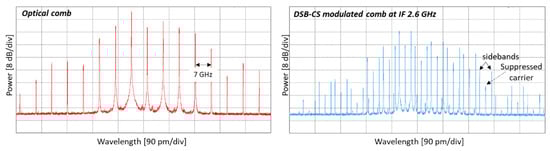
Figure 10.
(Left): Optical spectra of the comb, 7 GHz line spacing. (Right): Optical spectrum of the comb after DSB-CS modulation. The case of IF = 2.6 GHz is shown as an example. Spectrum analyzer resolution is 1.12 pm.
Figure 11 shows the electrical spectra of the up- (top) and down (bottom)-converted signals for C (left), X (center) and Ku (right) bands. The signals are analyzed in terms of power, signal to noise ratio, noise figure, conversion loss, phase noise as summarized in Table 7 and Figure 12. Similar performance is measured for up- and down-conversion at for all the considered bands. For up (down)-conversion the maximum variation of output SNR, NF and conversion loss is 2.6 (4.3), 1.6 (5.9) and 1.6 (5.9) dB, respectively. The variations are mainly due to some residual system instability, which originates from the thermal and mechanical vibrations that generate independent optical phase changes on the modulated (path A in Figure 9) and unmodulated (path B in Figure 9) combs. Those time-varying phase changes cause a time-varying amplitude oscillation on the signals after beating into the photodiodes. The integrated implementation of the proposed scheme suppresses the phase oscillations, because the lengths of the two paths are perfectly matched and the vibration effects are minimized thanks to the low mechanical inertia.
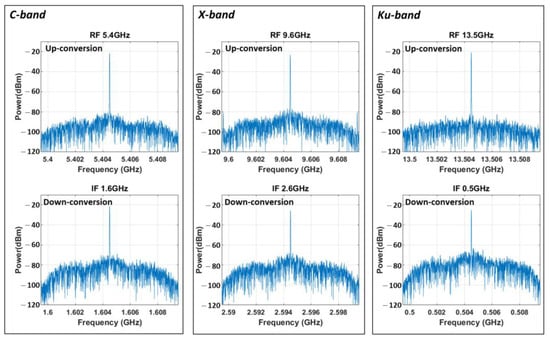
Figure 11.
Electrical spectra of the up- (top) and down (bottom)-converted signals for C (left), X (center) and Ku (right) bands. Images taken with 1 kHz resolution bandwidth.
Table 7.
Results of the experimental characterization of the photonic circuits for the up- and down-conversion of the radar signals.
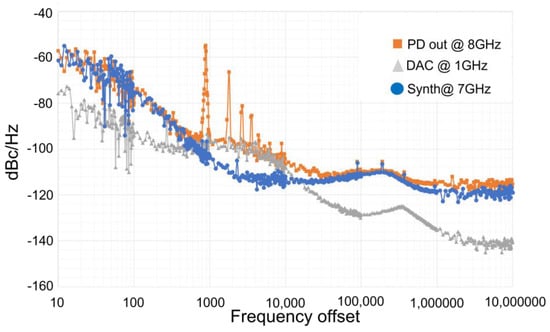
Figure 12.
Phase noise measurements.
Table 5 shows that the simulations outperform by about 10 dB the measurements. In the simulations, some non-idealities are not taken into account such as the thermal and mechanical random vibrations that cause oscillations in the beating at the PD outputs. Moreover, in the experimental setup, losses are present in the electrical and optical paths due to the RF connectors, the RF cables and the optical fibers, which are slightly different than the ideal devices.
Figure 12 shows the measured phase noise of the system. During the measurement, the synthesizer frequency was set at 7 GHz, while the DAC generated a 1 GHz sinusoidal tone. The phase is measured at the PD output looking at the 8 GHz beating line. The phase noise of the beating signal, as expected, matches the phase noise curve of the signal with the highest noise.
At high frequency offset, beyond 100 MHz, the noise magnitude is higher than the one of the noisiest source, because of the spontaneous emission contribution of the EDFA (see the experimental setup in Figure 9). The spurious peaks present on the curve related to PD out are due to environmental electrical noise coming from the power suppliers used to generate the modulator bias signal.
In the case of large numbers of FSO links, the system performance is expected to be not significantly affected by crosstalk among the links, being that the paths of the signals to each link are physically disjoined. Nevertheless, a noise increase is expected due to the significant reduction of the signal power at the EDFA input.
6. Towards System-On-Chip Integration
The photonic system described and analyzed in this work will benefit progress in photonic integrated technologies. Nowadays, almost all the components and subsystems that constitute this architecture, including lasers, modulators and detectors, can be implemented in Photonic Integrated Circuits (PICs), with several advantages compared to standard fiber or bulk optic implementations such as extremely low footprint, lower power consumption and the potential of low unit price for large scale production [47]. There are also inherent benefits of the solid-state implementations of the photonic system, because PICs are much less sensitive to external perturbations such as vibrations and temperature gradients compared to discrete fiber components. Finally, extremely confined waveguide modes in PICs open new functionalities. The reduced footprint and power consumption, together with the larger tolerance to perturbations, are of foremost importance in space applications where payload needs to be minimized. For all these reasons, the microwave photonic SAR radar system for Earth observation here described has been designed to be compatible with PIC technologies.
Nevertheless, as commonly reported in most works, one of the greatest hindrances to the performance of microwave photonic systems in integrated chips is represented by the worse power budget of the optical carrier [47]. This is the reason why many efforts were aimed at dealing with optical losses, a problem that is even more pronounced in PICs, where propagation losses are of an order of magnitude five to six times larger than the fiber equivalent, although paths are much shorter. Unfortunately, there is currently no photonic integrated platform capable of providing optimal performance for every function required in complex systems. For example, Indium Phosphide (InP) is the most mature and complete photonic-integrated technology: lasers sources, optical amplifiers, the intensity or phase modulators and photodiodes can be realized in the same chip. However, the waveguide connections suffer from excessive propagation losses, and the loose optical confinement leads to large bend radii, preventing the realization of compact circuits and giving an upper limit to the free spectral range of microresonator-based filters. On the other hand, Silicon-On-Insulator (SOI) is much better in this regard: the integrated waveguides have lower propagation losses and support much more confined optical modes. Many optical functions can be implemented, including modulators and photodiodes. Furthermore, it is also a mature technology that leverages the established CMOS foundry processes, which guarantee much higher reliability and yield compared to other technologies [48,49]. Nevertheless, current SOI technology lacks one of the most fundamental functions, optical amplification, which prevents the realization of active devices such as Light-Emitting Diodes (LEDs), lasers and SOAs.
The shortcomings of the different photonic-integrated technologies prevent the identification of a single photonic technological platform capable of implementing complex photonic systems. Currently, the most effective way to couple the laser carrier is by butt-coupling the InP diode laser to the Si photonic chip. This approach comes with a series of technological complications, since it is not scalable at wafer level and must be performed only in the final step of the packaging. Therefore, numerous efforts have been dedicated to integrating III-V material with SOI wafers. The possibility of introducing active material and SOI reduces the necessity for including external laser and fiber amplifiers, with huge benefits in terms of costs and compactness thanks to the reduced interfaces and packaging. Currently, this hybrid integration is realized with various techniques, ranging from flip-chip [50], to wafer bonding [51] to direct epitaxial growth [52]. One of the most promising techniques that is being explored is the microtransfer printing technique [53]: the technique allows the integration of active devices fabricated in III-V semiconductors as “coupons” over a processed SOI chip. By adding the InP SOA, this hybrid SOI platform allows the implementation of the full toolkit of functionalities required by our microwave system.
The novel microtransfer printing technique was exploited for the design of the integrated SAR RF transceiver system described in this work into a set of hybrid SOI PICs realized with the iSIPP50G platform of IMEC (Belgium) [54]. It includes splitters, combiners, plasma-dispersion effect phase and intensity modulators and Ge photodiodes, combined with the InP SOAs fabricated by the University of Ghent [55]. One of the objectives of this work is thus also to establish the addition of the SOA in the SOI building block set as an enabler for high-performance integrated microwave photonics.
The PIC design of this work aims to integrate most of the functions of the whole optical transceiver system architecture in a set of four PICs: one, shown in Figure 13a, for the primary satellite, and the remaining ones, shown in Figure 13b, for each secondary satellite. The input laser source (output power of 20 dBm can be reached) is externally coupled to the primary PIC using a fiber Grating Coupler (GC) with an insertion loss of 3 dB. The frequency optical comb is internally generated by a Dual-Drive Travelling-Wave Mach–Zehnder Modulator (DDTWMZM), constituted by a balanced Mach–Zehnder Interferometer (MZI) structure with each arm loaded by an independent 2.5 mm long P-N junction phase modulator, with a target half-wave voltage of 5 V, a bandwidth of 36 GHz and an insertion loss of 4 dB [54]. The dual-drive configuration for the MZM is needful, because two different signals on the two arms make possible different comb coefficients, including a flat comb under certain conditions [46]. The comb is then amplified by a SOA with an estimated gain of 10 dB and then split in two paths by a 1 × 2 Multi-Mode Interferometer (MMI) (excess loss of 0.13 dB), one of which is modulated with the IF signal by another DDTWMZM biased in carrier-suppression mode. Both paths are then split with a cascade of 1 × 2 MMIs in 3 paths. The gate synchronization signals are added to the unmodulated carriers through add-drop microring resonators acting as ADB. The GCs allow the coupling of the signals to be added. Each couple of modulated and unmodulated carrier paths is then recombined and multiplexed in two orthogonal polarizations. The polarization diversity is achieved by using bidimensional dual-polarization grating couplers, which are bidimensional photonic crystals that couple the light from the fiber into two integrated waveguides according to the polarization components, or vice versa [56]. The nominal dual-polarization grating coupler insertion loss and polarization extinction ratio is 6 and >20 dB, respectively. Over the FSO link, the multiplexed signal in each fiber is then transmitted to the secondary, where the received optical signal is coupled with the PIC and demultiplexed in polarization using the dual-polarization grating coupler. The unmodulated and modulated carriers are then recombined using a 2 × 2 MMI and detected by two matched Ge photodiodes with a nominal responsivity of 1 A/W at 1550 nm and a bandwidth of 20 GHz. The two electrical current outputs are connected to a differential Trans-Impedance Amplifier (TIA) with differential output for the balanced detection. The generated signals are filtered in the C, X and Ku bands before being sent to the antenna. Before the optical detection, an add-drop microring resonator on the unmodulated carrier path extracts the gate synchronization signals from the unmodulated carriers. The path for these signals is split again by a 1 × 2 MMI, and, with the same schematic of the primary, boosted by an SOA and split again. The carriers are then modulated by the returning backscattered signal and multiplexed in polarization with the recovered unmodulated carriers again. Over the same FSO link, the optical signal is then sent back to the primary satellite where the three signals coming from the secondary satellites are polarization demultiplexed again, recombined and sent to a low-bandwidth, high-responsivity Ge-balanced receiver inside the PIC in the primary satellite. The detected signal will carry the down-converted signal at IF. The expected loss of the PICs can be estimated as: 11 dB (21 if we neglect the SOA) for the transmission chain in the primary satellite, 5 dB for the receiver chain in the secondary satellite, 7 dB (17 if we neglect the SOA), for the transmitter chain of the secondary satellite and finally 6 dB for the receiver chain of the primary satellite.
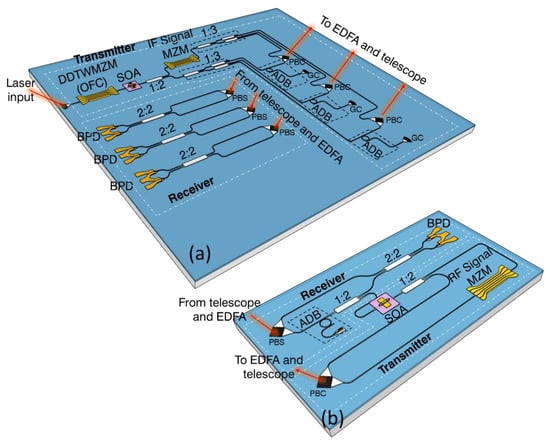
Figure 13.
(a) PIC layout for the primary satellite. (b) PIC layout for the secondary satellite. The 1:3 splitter is implemented cascading 1:2 splitters.
7. Conclusions
Synthetic Aperture Radars are the most effective systems for the monitoring of Earth from space using low-orbit satellites, allowing for high-resolution imaging. The multi-static SAR, i.e., multiple SARs on a satellite constellation, allows single-pass configuration, thus avoiding temporal decorrelation issues and allowing for the detection of moving targets. The maximum level of cooperation among the SARs is obtained through a coherent MIMO approach with coherent and centralized signal processing. This approach requires the generation of orthogonal signals that can be distinguished. The orthogonal signals can be obtained exploiting different frequencies (multiband system). Thanks to the fusion of the different bands, the system resolution can be increased. Up to now, implemented bistatic SARs for spatial interferometry have synchronized the RF by GNSS systems and the exchange of RF synchronization signals. Nevertheless the synchronization is limited in accuracy, which impacts on the image resolution.
Overcoming these limitations with standard RF technology is hard, because it requires complex solutions with SWaP and interference troubles. Moreover, the generation of multiband signals is difficult due to the lack of frequency flexibility.
In the present work, we propose the use of photonics to generate, receive and distribute the radar signals in a coherent multi-static SAR satellite constellation. Photonics allows the overcoming of the current issues in the implementation of MIMO SAR, allowing for the flexible generation of multi-band signals and the centralized generation of all the RF SAR signals in a primary satellite with coherent distribution to all the secondary satellites through FSO links. A single high-precision optical clock is used, providing high intrinsic coherence among all the RF sensor signals.
The proposed system is a satellite formation composed by a primary satellite and a swarm of secondary satellites. The primary satellite transmitter generates an optical comb in two replicas. A replica is modulated in carrier suppression with the radar signal at three IFs. The unmodulated and modulated combs are polarization multiplexed and sent to an optical front-end to be sent to the secondary satellites, where the receiver up-converts the modulated comb into the radar signal at RF in C, X or Ku band to be sent to the Earth’s surface. The received echo is converted to the optical domain in the secondary satellite transmitter by modulating the unmodulated comb replica and sent to the primary satellite over the FSO link. At the receiver of the primary satellite, the signal is converted back at IF.
We carried out numerical analysis of the system by means of a commercial simulation software, accounting for the main parameters used in currently implemented SAR satellites. Two different kinds of Earth surfaces are considered: desert and state 3 sea, to address, respectively, high and low reflectivity targets. The analysis shows that the proposed system has a NESZ < −29.6 dB, indicating that the system sensitivity can satisfy the requirements of a deployed multi-static SAR system.
We realized also an experimental proof of concept based on COTS, including the transmitter and the receiver for both up- and down-conversion. The results show, in the worst case, a conversion loss 10 dB higher with respect to the simulations. The discrepancies are due to the instability caused by thermal and mechanical vibrations that generate oscillations in the beating of the signals into the photodiodes. This is due to the bulk implementation. Moreover, in the electrical and optical paths extra losses are present due to the RF and optical connectors, RF cables and optical fibers, not considered in the more ideal situation simulations. The phase noise measurements show that the proposed techniques do not introduce significant phase noise with respect to the input electrical sources.
We also identified a way to implement the proposed system with integrated technologies. The integrated implementation in principle allows for SWaP reduction and increased robustness against mechanical vibrations. The consolidated SOI platform allows the implementation of all the basic blocks required by the microwave photonic circuit as modulators for comb generation and modulation and photodiodes. The laser can be implemented by InP technology and coupled to the circuit by optical fiber or hybrid integration. One of the main innovations introduced here is the exploitation of the innovative transfer printing technique, available in few SOI foundries, to realize semiconductor optical amplifiers in InP technology and transfer them into a SOI circuit. The use of optical amplifiers allows compensation for the losses of the passive SOI waveguides and thus decreases the overall conversion loss, which is one of the main criticalities of the microwave photonics system. The system architecture is simplified at the integration stage by exploiting the polarization multiplexing of the modulated and unmodulated combs to be sent from (to) the primary to (from) the secondary satellite over the FSO links. This avoids the use of complex and space-consuming optical filters requiring several control signals to separate the modulated and unmodulated combs.
Author Contributions
Conceptualization, M.R., G.S., A.B., P.G. and F.S.; methodology, M.S. and G.S.; software, G.P., M.M.H.A., F.C. and S.M.; validation, M.S., M.I. and F.S.; formal analysis, M.S. and A.M.; investigation, M.R. and G.P.; resources, C.P. and F.S.; data curation, M.S. and S.M.; writing—original draft preparation, M.S. and A.B.; writing—review and editing, M.S., A.B. and G.P.; visualization, M.S., A.B. and G.P.; supervision, M.S. and A.B.; project administration, A.B.; funding acquisition, A.B. All authors have read and agreed to the published version of the manuscript.
Funding
This research was funded within the project COSMOS by the FISR funding scheme, Italian Ministry of University and Research, grant number FISR2019_03476.
Data Availability Statement
Not applicable.
Acknowledgments
The results shown here have been partially carried out within the projects CLARIFIER (SPS funding scheme by NATO), ESTIMATOR (funded by U.S.A. Office of Naval Research Global), PON “Ricerca e Innovazione 2014-2020”.
Conflicts of Interest
The authors declare no conflict of interest. The funders had no role in the design of the study; in the collection, analyses, or interpretation of data; in the writing of the manuscript; or in the decision to publish the results.
References
- Moreira, A.; Prats-Iraola, P.; Younis, M.; Krieger, G.; Hajnsek, I.; Papathanassiou, K.P. A tutorial on synthetic aperture radar. IEEE Geosci. Remote Sens. Mag. 2013, 1, 6–43. [Google Scholar] [CrossRef]
- Aukema, Y.J.; Wilson, S.; Irwin, D. SAR Handbook: Comprehensive Methodologies for Forest Monitoring and Biomass Estimation, 1st ed.; SERVIR Global: Huntsville, AL, USA, 2019; pp. 1–306. [Google Scholar] [CrossRef]
- Monti-Guarnieri, A.V.; Brovelli, M.A.; Manzoni, M.; D’Alessandro, M.M.; Molinari, M.E.; Oxoli, D. Coherent Change Detection for Multipass SAR. IEEE Trans. Geosci. Remote Sens. 2018, 56, 6811–6822. [Google Scholar] [CrossRef]
- Krieger, G. Advanced Bistatic and Multistatic SAR Concepts and Applications. In Proceedings of the 6th European Conference on Synthetic Aperture Radar (EUSAR), Dresden, Germany, 16–18 May 2006. [Google Scholar]
- Iannini, L.; Lopez-Dekker, P.; Hoogeboom, P. A Highly Flexible and Scalable S-band SwarmSAR from Very Simple Nodes. In Proceedings of the 2020 IEEE Radar Conference, Florence, Italy, 21–25 September 2020; pp. 1–6. [Google Scholar] [CrossRef]
- Godrich, H.; Haimovich, A.M.; Blum, R.S. Target Localization Accuracy Gain in MIMO Radar-Based Systems. IEEE Trans. Inf. Theory 2010, 56, 2783–2803. [Google Scholar] [CrossRef]
- Haimovich, A.M.; Blum, R.S.; Cimini, L.J. MIMO Radar with Widely Separated Antennas. IEEE Signal Process. Mag. 2008, 25, 116–129. [Google Scholar] [CrossRef]
- Santi, E.; Paloscia, S.; Pettinato, S.; Fontanelli, G.; Mura, M.; Zolli, C.; Maselli, F.; Chiesi, M.; Bottai, L.; Chirici, G. The potential of multifrequency SAR images for estimating forest biomass in Mediterranean areas. Remote Sens. Environ. 2017, 200, 63–73. [Google Scholar] [CrossRef]
- Maresca, S.; Serafino, G.; Scotti, F.; Amato, F.; Lembo, L.; Bogoni, A.; Ghelfi, P. Photonics for Coherent MIMO Radar: An Experimental Multi-Target Surveillance Scenario. In Proceedings of the 20th International Radar Symposium (IRS), Ulm, Germany, 26–28 June 2019; pp. 1–6. [Google Scholar] [CrossRef]
- Maresca, S.; Scotti, F.; Serafino, G.; Lembo, L.; Malacarne, A.; Falconi, F.; Ghelfi, P.; Bogoni, A. Coherent MIMO radar network enabled by photonics with unprecedented resolution. Opt. Lett. 2020, 45, 3953–3956. [Google Scholar] [CrossRef]
- Available online: https://www.sto.nato.int/publications/STO%20Educational%20Notes/STO-EN-SET-235/EN-SET-235-03.pdf (accessed on 22 August 2022).
- Younis, M.; Metzig, R.; Krieger, G. Performance prediction of a phase synchronization link for bistatic SAR. IEEE Geosci. Remote Sens. Lett. 2006, 3, 429–433. [Google Scholar] [CrossRef]
- Walterscheid, I.; Espeter, T.; Brenner, A.R.; Klare, J.; Ender, J.H.G.; Nies, H.; Wang, R.; Loffeld, O. Bistatic SAR Experiments With PAMIR and TerraSAR-X—Setup, Processing, and Image Results. IEEE Trans. Geosci. Remote Sens. 2010, 48, 3268–3279. [Google Scholar] [CrossRef]
- Zink, M.; Moreira, A.; Bachmann, M.; Rizzoli, P.; Fritz, T.; Hajnsek, I.; Krieger, G.; Wessel, B. The Global TanDEM-X DEM—A Unique Data Set. In Proceedings of the 2017 IEEE International Geoscience and Remote Sensing Symposium (IGARSS), Fort Worth, TX, USA, 23–28 July 2017; pp. 906–909. [Google Scholar] [CrossRef]
- Walterscheid, I.; Smith, G.E.; Ender, J.; Baker, C.J. Experimental Demonstration of Distributed MIMO Imaging. In Proceedings of the 11th European Conference on Synthetic Aperture Radar (EUSAR), Hamburg, Germany, 6–9 June 2016; pp. 1–4. [Google Scholar]
- Gao, B.; Zhang, F.; Sun, G.; Xiang, Y.; Pan, S. Microwave Photonic MIMO Radar for High-Resolution Imaging. IEEE J. Light. Technol. 2021, 39, 7726–7733. [Google Scholar] [CrossRef]
- Akcakaya, M.; Nehorai, A. MIMO Radar Detection under Phase Synchronization Errors. In Proceedings of the 2010 IEEE International Conference on Acoustics, Speech and Signal Processing, Dallas, TX, USA, 14–19 March 2010; pp. 2578–2581. [Google Scholar] [CrossRef]
- Cristallini, D.; Pastina, D.; Lombardo, P. Exploiting MIMO SAR Potentialities With Efficient Cross-Track Constellation Configurations for Improved Range Resolution. IEEE Trans. Geosci. Remote Sens. 2011, 49, 38–52. [Google Scholar] [CrossRef]
- Ghelfi, P.; Laghezza, F.; Scotti, F.; Serafino, G.; Capria, A.; Pinna, S.; Onori, D.; Porzi, C.; Scaffardi, M.; Malacarne, A.; et al. A fully photonics-based coherent radar system. Nature 2014, 507, 341–345. [Google Scholar] [CrossRef] [PubMed]
- Serafino, G.; Maresca, S.; Porzi, C.; Scotti, F.; Ghelfi, P.; Bogoni, A. Microwave Photonics for Remote Sensing: From Basic Concepts to High-Level Functionalities. IEEE J. Light. Technol. 2020, 38, 5339–5355. [Google Scholar] [CrossRef]
- Liu, Y.; Wichman, A.R.; Isaac, B.; Kalkavage, J.; Adles, E.J.; Clark, T.R.; Klamkin, J. Ultra-Low-Loss Silicon Nitride Optical Beamforming Network for Wideband Wireless Applications. IEEE J. Sel. Top. Quantum Electron. 2018, 24, 8300410. [Google Scholar] [CrossRef]
- Gao, Y.-P.; Liu, X.-C.; Cao, C.; Han, L.-H.; Lu, P.-F. Optomagnonically induced RoF chaotic synchronization. New J. Phys. 2022, 24, 083022. [Google Scholar] [CrossRef]
- Wu, X.-Y.; Zhang, Y.; Gao, Y.-P.; Wang, C. Optimal photon-magnon mode matching in whispering-gallery mode cavities. Opt. Express 2021, 29, 40061–40071. [Google Scholar] [CrossRef] [PubMed]
- Aveline, M.; Sotom, M.; Barbaste, R.; Benazet, B.; le Kernec, A.; Magnaval, J.; Ginestet, P.; Navasquillo, O.; Piqueras, M.A. Reconfigurable Microwave Photonic Repeater for Broadband Telecom Missions: Concepts and Technologies. In Proceedings of the International Conference on Space Optics (ICSO 2014), Tenerife, Spain, 17 November 2017; p. 105633M. [Google Scholar] [CrossRef]
- ESA Earth Observation Portal. Available online: https://directory.eoportal.org/web/eoportal/satellite-missions/t/tandem-x (accessed on 22 August 2022).
- Sentinel Online. Available online: https://sentinels.copernicus.eu/web/sentinel/missions/sentinel-1/instrument-payload (accessed on 22 August 2022).
- Sentinel Online. Available online: https://sentinels.copernicus.eu/web/sentinel/technical-guides/sentinel-3-altimetry/instrument/sral (accessed on 22 August 2022).
- Skolnik, M. Radar Handbook, 3rd ed.; McGraw-Hill: Boston, MA, USA, 2015. [Google Scholar]
- ITU. Available online: https://www.itu.int/dms_pubrec/itu-r/rec/p/R-REC-P.676-11-201609-S!!PDF-E.pdf (accessed on 22 August 2022).
- Li, Y.; Guarnieri, A.; Hu, C.; Rocca, F. Performance and Requirements of GEO SAR Systems in the Presence of Radio Frequency Interferences. Remote Sens. 2018, 10, 82. [Google Scholar] [CrossRef]
- Richards, M.A.; Scheer, J.A.; Holm, W.A. Principles of Modern Radar; Scitech Publishing: Edison, NJ, USA, 2010. [Google Scholar]
- Sodnik, Z.; Furch, B.; Lutz, H. Optical Intersatellite Communication. IEEE J. Sel. Top. Quantum Electron. 2010, 16, 1051–1057. [Google Scholar] [CrossRef]
- Townes, S.A.; Edwards, B.L.; Biswas, A.; Bold, D.R.; Bondurant, R.S.; Boroson, D.; Burnside, J.W.; Caplan, D.O.; Decew, A.E.; DePaula, R.; et al. The Mars laser communication demonstration. In Proceedings of the 2004 IEEE Aerospace Conference Proceedings, Big Sky, MT, USA, 6–13 March 2004; pp. 1180–1195. [Google Scholar] [CrossRef]
- Boroson, D.M.; Robinson, B.S.; Murphy, D.V.; Burianek, D.A.; Khatri, F.; Kovalik, J.M.; Sodnik, Z.; Cornwell, M.D. Overview and results of the Lunar Laser Communication Demonstration. In Proceedings of the SPIE 8971, Free-Space Laser Communication and Atmospheric Propagation XXVI, San Francisco, CA, USA, 6 March 2014; p. 89710S. [Google Scholar] [CrossRef]
- Carrizo, C.; Knapek, M.; Horwath, J.; Gonzalez, D.D.; Cornwell, P. Optical inter-satellite link terminals for next generation satellite constellations. In Proceedings of the SPIE 11272, Free-Space Laser Communications XXXII, San Francisco, CA, USA, 2 March 2020; p. 1127203. [Google Scholar] [CrossRef]
- Tesat. Available online: https://www.tesat.de/images/tesat/products/220607_DataSheet_SCOT80_A4.pdf (accessed on 22 August 2022).
- Space Micro. Available online: https://www.spacemicro.com/products/communication-systems/%CE%BCLCT%E2%84%A2%20LASER%20COMMUNICATION%20TERMINAL.pdf (accessed on 22 August 2022).
- Tesat. Available online: https://www.tesat.de/images/tesat/products/TOSIRIS_Data-Sheet.pdf (accessed on 22 August 2022).
- Tesat. Available online: https://www.tesat.de/images/tesat/products/220607_DataSheet_SmartLCT70_A4.pdf (accessed on 22 August 2022).
- Hemmati, H. Deep Space Optical Communications; Wiley: Hoboken, NJ, USA, 2010. [Google Scholar]
- Tolker-Nielsen, T.T.; Oppenhauser, G. In-orbit test result of an operational optical intersatellite link between ARTEMIS and SPOT4, SILEX. In Proceedings of the SPIE 4635, Free-Space Laser Communication Technologies XIV, San Jose, CA, USA, 26 April 2002. [Google Scholar] [CrossRef]
- Miyatake, K.; Fujii, Y.; Haruna, M.; Suzuki, J.; Kodeki, K.; Yamakawa, S.; Hanada, T. Development of acquisition and tracking sensor for next-generation optical inter-satellite communication. In Proceedings of the International Conference on Space Optical Systems and Applications (ICSOS), Santa Monica, CA, USA, 11–13 May 2011; pp. 132–135. [Google Scholar] [CrossRef]
- Moreira, A.; Fiedler, H.; Hajnsek, I.; Werner, M.; Younis, M.; Zink, M. TanDEM-X: A Satellite Formation for High-Resolution SAR Interferometry. IEEE Trans. Geosci. Remote Sens. 2007, 45, 3317–3341. [Google Scholar] [CrossRef]
- Toyoshima, M.; Takayama, Y.; Kunimori, H.; Jono, T.; Yamakawa, S. In-orbit measurements of spacecraft microvibrations for satellite laser communication links. Opt. Eng. 2010, 49, 083604. [Google Scholar] [CrossRef]
- Morton, P.A.; Zhang, C.; Khurgin, J.B.; Peters, J.D.; Bowers, J.E. Hybrid III-V/Si MZI modulators for high SFDR analog links and systems. In Proceedings of the 2016 IEEE Avionics and Vehicle Fiber-Optics and Photonics Conference (AVFOP), Long Beach, CA, USA, 31 October–3 November 2016; pp. 7–8. [Google Scholar] [CrossRef]
- Sakamoto, T.; Kawanishi, T.; Izutsu, M. Asymptotic formalism for ultraflat optical frequency comb generation using a Mach-Zehnder modulator. Opt. Lett. 2007, 32, 1515–1517. [Google Scholar] [CrossRef]
- Kish, F.; Lal, V.; Evans, P.; Corzine, S.W.; Ziari, M.; Butrie, T.; Reffle, M.; Tsai, H.-S.; Dentai, A.; Pleumeekers, J.; et al. System-on-Chip Photonic Integrated Circuits. IEEE J. Sel. Top. Quantum Electron. 2018, 24, 6100120. [Google Scholar] [CrossRef]
- Marpaung, D.; Yao, J.; Capmany, J. Integrated microwave photonics. Nat. Photonics 2019, 13, 80–90. [Google Scholar] [CrossRef]
- Thomson, D.; Zilkie, A.; Bowers, J.E.; Komljenovic, T.; Reed, G.T.; Vivien, L.; Marris-Morini, D.; Cassan, E.; Virot, L.; Fédéli, J.-M.; et al. Roadmap on silicon photonics. J. Opt. 2016, 18, 073003. [Google Scholar] [CrossRef]
- Matsumoto, T.; Kurahashi, T.; Konoike, R.; Suzuki, K.; Tanizawa, K.; Uetake, A.; Takabayashi, K.; Ikeda, K.; Kawashima, H.; Akiyama, S.; et al. Hybrid-Integration of SOA on Silicon Photonics Platform Based on Flip-Chip Bonding. IEEE J. Light. Technol. 2019, 37, 307–313. [Google Scholar] [CrossRef]
- Jhang, Y.; Tanabe, K.; Iwamoto, S.; Arakawa, Y. InAs/GaAs Quantum Dot Lasers on Silicon-on-Insulator Substrates by Metal-Stripe Wafer Bonding. IEEE Photonics Technol. Lett. 2015, 27, 875–878. [Google Scholar] [CrossRef]
- Holland, M.; van Dal, M.; Duriez, B.; Oxland, R.; Vellianitis, G.; Doornbos, G.; Afzalian, A.; Chen, T.-K.; Hsieh, C.-H.; Ramvall, P.; et al. Passlack. Atomically flat and uniform relaxed III–V epitaxial films on silicon substrate for heterogeneous and hybrid integration. Sci. Rep. 2017, 7, 14632. [Google Scholar] [CrossRef] [PubMed]
- Zhang, J.; Muliuk, G.; Juvert, J.; Kumari, S.; Goyvaerts, J.; Haq, B.; Op De Beeck, C.; Kuyken, B.; Morthier, G.; Van Thourhout, D.; et al. III-V-on-Si photonic integrated circuits realized using micro-transfer-printing. APL Photonics 2019, 4, 110803. [Google Scholar] [CrossRef]
- Rahim, A.; Goyvaerts, J.; Szelag, B.; Fedeli, J.-M.; Absil, P.; Aalto, T.; Harjanne, M.; Littlejohns, C.G.; Reed, G.T.; Winzer, G.; et al. Open-Access Silicon Photonics Platforms in Europe. IEEE J. Sel. Top. Quantum Electron. 2019, 25, 8200818. [Google Scholar] [CrossRef]
- Haq, B.; Vaskasi, J.R.; Zhang, J.; Gocalinska, A.; Pelucchi, E.; Corbett, B.; Roelkens, G. Micro-transfer-printed III-V-on-silicon C-band distributed feedback lasers. Opt. Express 2020, 28, 32793–32801. [Google Scholar] [CrossRef]
- Cheng, L.; Mao, S.; Li, Z.; Han, Y.; Fu, H.Y. Grating Couplers on Silicon Photonics: Design Principles, Emerging Trends and Practical Issues. Micromachines 2020, 11, 666. [Google Scholar] [CrossRef]
Publisher’s Note: MDPI stays neutral with regard to jurisdictional claims in published maps and institutional affiliations. |
© 2022 by the authors. Licensee MDPI, Basel, Switzerland. This article is an open access article distributed under the terms and conditions of the Creative Commons Attribution (CC BY) license (https://creativecommons.org/licenses/by/4.0/).