Article

A Two-Stage Approach to Locate and Size PV Sources in Distribution Networks for Annual Grid Operative Costs Minimization

by
Oscar Danilo Montoya
1,2,*,
Edwin Rivas-Trujillo
1 and
Jesus C. Hernández
3,*
1
Grupo de Compatibilidad e Interferencia Electromagnética, Facultad de Ingeniería, Universidad Distrital Francisco José de Caldas, Bogotá 110231, Colombia
2
Laboratorio Inteligente de Energía, Facultad de Ingeniería, Universidad Tecnológica de Bolívar, Cartagena 131001, Colombia
3
Department of Electrical Engineering, University of Jaén, Campus Lagunillas s/n, Edificio A3, 23071 Jaén, Spain
*
Authors to whom correspondence should be addressed.
Electronics 2022, 11(6), 961; https://doi.org/10.3390/electronics11060961
Submission received: 14 February 2022 / Revised: 15 March 2022 / Accepted: 17 March 2022 / Published: 21 March 2022

Abstract

:
This paper contributes with a new two-stage optimization methodology to solve the problem of the optimal placement and sizing of solar photovoltaic (PV) generation units in medium-voltage distribution networks. The optimization problem is formulated with a mixed-integer nonlinear programming (MINLP) model, where it combines binary variables regarding the nodes where the PV generators will be located and continuous variables associated with the power flow solution. To solve the MINLP model a decoupled methodology is used where the binary problem is firstly solved with mixed-integer quadratic approximation; and once the nodes where the PV sources will be located are known, the dimensioning problem of the PV generators is secondly solved through an interior point method applied to the classical multi-period power flow formulation. Numerical results in the IEEE 33-bus and IEEE 85-bus systems demonstrate that the proposed approach improves the current literature results reached with combinatorial methods such as the Chu and Beasley genetic algorithm, the vortex search algorithm, the Newton-metaheuristic algorithm as well as the exact solution of the MINLP model with the GAMS software and the BONMIN solver. All the numerical simulations are implemented in the MATLAB programming environment and the convex equivalent models are solved with the CVX tool.

1. Introduction

Nowadays, the harmful effects of global warming make necessary important changes in the energetic consumption worldwide [1,2]. In the case of electrical energy, the systems with fossil fuels are in the third place with total greenhouse gas emissions to the atmosphere [3], behind transportation systems and the cow and pork beef production [4], respectively. Electrical distribution networks contribute indirectly to global warming, since these systems buy energy in the frontiers of the power system (i.e., substations) to provide these to all end-users. However, if the power system is predominantly thermal, greenhouse gas emissions are caused due to the usage of this electrical energy in medium and low voltage levels.
In distribution levels, to reduce the usage of thermal energy from power systems, renewable energies appear as a promissory alternative since these can supply part of this energy consumption with minimum environmental impact [5]. In the case of renewable energy resources, the most common technologies are solar photovoltaic (PV) and wind power sources [6]. Since solar radiation has small variations throughout the year and these are cheaper in comparison with small wind turbines [7], countries located in the equatorial region prefers the usage of PV sources in medium-voltage grids.
Owing to the fact that optimal integration of the renewable energy resources can help with the greenhouse gas emissions’ minimization, distribution companies are massively integrating these sources in their grids [8]. However, these are integrated using mainly economical objective function indicators instead of environmental ones [9]; nonetheless, these objectives are closely connected due to the minimization of the energy purchasing costs in the substation bus is equivalent to minimize the tons of greenhouse gas emissions produced by thermal sources, since these are directly replaced by renewable generation [10].
The location of PV generation units in distribution networks, considering the economical and technical aspects, has recently gained significant attention in scientific literature. Some of the most relevant works are presented below. The authors of [11] applied the classical Chu and Beasley genetic algorithm to locate and size PV generation units in radial distribution networks. The objective function value was the minimization of the annual grid operative costs of the network, which includes the energy purchasing costs in the substation terminals added with the investment and operating costs of the PV units. Numerical results in the IEEE 33- and IEEE 69-bus system demonstrated that the CBGA improves the results of the exact MINLP model when solved with the GAMS software and the BONMIN solver. The authors of [12] proposed the application of the improved version of the jaya optimization algorithm to locate PV sources in distribution networks considering the simultaneous minimization of the grid power losses and voltage profile improvement. Numerical results in the IEEE 33-bus system demonstrated the effectiveness of the proposed optimization algorithm. However, the main flaw of this research is that the authors did not include an economic analysis regarding the PV generators, which makes it difficult to determine the feasibility of the solution in terms of the investment recovering during the planning period. In [10], the application of the Newton-metaheuristic algorithm (NMA) it is proposed to locate and size PV generators in radial distribution grids. The objective function corresponds to the minimization of the annual grid operation costs, which includes the energy purchasing costs in the substation terminals summed with the investment and operating costs of the PV sources. Numerical results in the IEEE 34- and IEEE 85-bus systems demonstrated the efficiency of the NMA when compared with the CBGA and the exact solution in the GAMS software. Cortes-Caícedo et al. [13] presented the application of the discrete version of the vortex search algorithm to locate and size PV sources in radial distribution networks with 33 and 69 nodes. The main contribution of the authors correspond to the generalization of the proposed methodology for distribution networks with alternating- and direct-current technologies. Numerical results showed superior performance compared to the CBGA and the GAMS software. The authors of [9] studied the problem of the optimal placement and sizing of renewable energy resources and batteries in medium- and low-voltage distribution networks. To deal with the problem of location, the authors used the classical simulated annealing algorithm. To determine the size of these distributed energy resources, the authors proposed an equivalent mixed-integer linear programming model. Numerical results showed the effectiveness of the proposed approaches in a test feeder composed of 11, 135, and 230 nodes, respectively. However, the main flaw of this work corresponded to the lack of comparison with metaheuristic or exact methodologies.
The main contribution of this research corresponds to the proposition of a two-stage methodology to locate and size PV generation units in distribution networks, where the problem of location is decoupled from the problem of sizing. To determine the best places for locating PV sources in the first stage, a mixed-integer quadratic convex model that can be solved by combining the interior point method with the Branch and Bound approach by ensuring the global optimum finding is proposed. In the second stage, the application of the classical logarithmic barrier interior point method is proposed to determine the optimal sizes of the PV sources. Numerical results in two test feeders known as the IEEE 33- and IEEE 85-bus networks demonstrate the effectiveness and robustness of the proposed optimization method when compared with literature reports such as the genetic algorithm, the Newton-metaheuristic algorithm, the vortex search algorithm, and the exact solution of the MINLP model in the GAMS software.
The remainder of this research has the following organization: Section 2 describes the exact MINLP formulation of the problem of the optimal location and sizing of PV generation units in radial distribution grids. Section 3 reveals the proposed two-stage solution methodology based on decoupling the problem of location from the problem of the sizing. Section 4 shows the main characteristics of the IEEE 33-bus system and the parametrization of the objective function. Section 5 presents the main numerical achievements with the proposed two-stage optimization methodology as well as its complete comparison with recent literature reports in the IEEE 33- and IEEE 85-bus systems. Section 6 lists the concluding remarks derived from this research as well as some possible future researches.

2. Optimization Problem

To determine the optimal location and sizing of PV generation units in distribution networks, a mixed-integer nonlinear programming (MINLP) model is formulated [14]. In this optimization model, binary (also integer) variables define the nodes where the PV sources will be sited, while the continuous variables are related with power flow variables, i.e., voltages, currents, active and reactive power flows in lines, and power injections in all the nodes, respectively [15]. The MINLP model that represents the studied problem is presented below.

2.1. Objective Function

The main goal with the optimal placement and sizing of PV generation units in distribution networks corresponds to the total grid operative costs minimization [16,17]. These costs are calculated with the sum of the annual energy purchasing costs in the substation bus and the investment and operating costs in renewable generation [11]. The objective function and its components are defined in Equations (1)–(3).
A cost = A 1 + A 2 ,
A 1 = C kWh T t a 1 ( 1 + t a ) N t h H i N p 0 i , h c g Δ h t T 1 + t e 1 + t a t ,
A 2 = C p v t a 1 ( 1 + t a ) N t i N p i p v + C O & M T h H i N G h p v p i , h p v Δ h ,
where A cost represents the total annual operative costs of the network, A 1 calculates the energy purchasing costs in the substation bus, and A 2 sums the PV installation costs per kilowatt peak and its corresponding costs as a function of the total expected clean energy generation during the planning period. C kWh represents the average value of the energy purchasing costs in terminals of the substation; T is defined as the number of days of an ordinary year; t a is defined as the internal return rate of the distribution company, which is expected to recover the investment during the project duration; N t defines the duration of the project in years; p 0 i , h c g is associated with the active power flow from the substation bus, i.e., node 0, to each node i directly connected with this node during each period of time h; Δ h = 1   h defines the period of time where all the variables in the MINLP hold constant. t e describes the expected cost increment of the energy costs during the project duration; C p v defines the average installation of a kilowatt-peak of power generation with PV sources. p i p v defines the size of the PV generation source connected at node i. C O & M represents the total maintenance and operating cost of generating a kilowatt power with PV sources; G h p v defines the expected generation curve from PV sources in the area of influence of the distribution grid. Finally, the sets that define the number of periods in the daily operation, the number of nodes that composes the distribution grid, and the number of years of the planning period are defined as H , N , and T , respectively.
Remark 1.
The objective function defined in Equation (1) exhibits a linear form, which implies that this function is convex (also concave) as function of the variables p 0 i , h c g and p i p v [18].

2.2. Set of Constraints

The problem of the optimal siting and sizing of PV generation units is constrained by active and reactive power balance equilibrium at each node, voltage regulation limits allowed per node, voltage drops per line, and devices capabilities, among others [19]. These constraints are presented below.
p i j , h R i j i i j , h 2 k : ( j k ) L p j k , h = P j , h d G h p v p j p v , j N , j slack , h H ,
q i j , h X i j i i j , h 2 k : ( j k ) L q j k , h = Q j , h d , j N , j slack , h H ,
v j , h 2 = v i , h 2 2 R i j p i j , h + X i j q i j , h + R i j 2 + X i j 2 i i j , h 2 i j E , h H ,
p i j , h 2 + q i j , h 2 = v i , h 2 i i j , h 2 , i j L , h H
z j P p v min p j p v z j P p v max j N ,
v j min v j , h v j max j N , h H ,
i i j max i i j , h i i j max i j L , h H ,
i N z j N p v max ,
z j 0 , 1 , i N ,
where the active power flows between nodes i and j (and j and k) during the period of time h are defined by the variables p i j , h ( p j k , h ) and q i j , h ( p j k , h ) , respectively. The active and reactive power demands at node j are represented by P j , h d and Q j , h d at each period of time h; X i j and R i j are the reactance and resistance parameters associated with the line i j . P p v min and p p v max represent the minimum and maximum dimensions allowed for a PV generator that will be installed in the distribution grid. z j is the binary variable that decides if a PV generation unit is connected ( z j = 1 ) or not ( z j = 0 ) in the node j; v j min and v j max are the minimum and maximum voltage regulation bounds permitted by regulatory entities in all the nodes of the network; i i j max is the maximum current (i.e., thermal bound) associated with the conductor that connects nodes i and j; N p v max is the maximum number of PV generation units available for installation along the distribution grid.
Remark 2.
The main complication with the set of constraints (4) to (12) is that there are four nonlinear non-convex constraints, i.e., power balance equilibrium constraints (4) and (5), the voltage drop at each line (6), and the power definition in Equation (7). These constraints make it necessary to propose efficient strategies to solve this type of MINLP model efficiently [20].

2.3. Model Characterization

The optimization model, defined from Equations (1) to (12), corresponds to the MINLP representation of the problem of the optimal siting and sizing of PV generation units in radial distribution networks, and it has the following interpretation. Equation (1) defines the objective function of the optimization problem, which is composed of the annual energy purchasing costs in the substation bus, i.e., Equation (2), and the investment and operating costs in PV generation units in Equation (3). The active and reactive power equilibrium constraints are defined in Equations (4) and (5). Note that these equations ensure the energy balance at each node at each period of time. Equation (6) defines the voltage drop at each distribution line as a function of the voltage magnitudes in its terminals and the active and reactive power flows on it. Equality constraint (7) shows the application of the power definition at each sending terminal of each distribution line for each period of time. Box-type restriction in (8) defines the maximum power generation output in the PV generation that would be installed at node j in the case of the binary variable z j being activated. Box-type constraints (10) and (11) define the grid voltage regulation bounds and the maximum thermal bounds that can be supported by the distribution lines (i.e., current transportation capabilities of the conductors in the corridor i j .), respectively. Inequality constraint (11) limits the maximum number of PV generation sources that can be integrated in the whole distribution network, and Constraint (12) presents the discrete nature of the decision variable z j .
The complexity of the optimization model (1) to (12), mainly caused by the combination of nonlinear non-convex constraints in the continuous domain with binary variables produces a complex MINLP model that is hard to solve with exact optimization methods, mainly addressed in the current literature with combinatorial methods [12]. In this research, we propose a novel two-stage optimization approach that decouples the problem of PV location from the problem of the PV sizing.

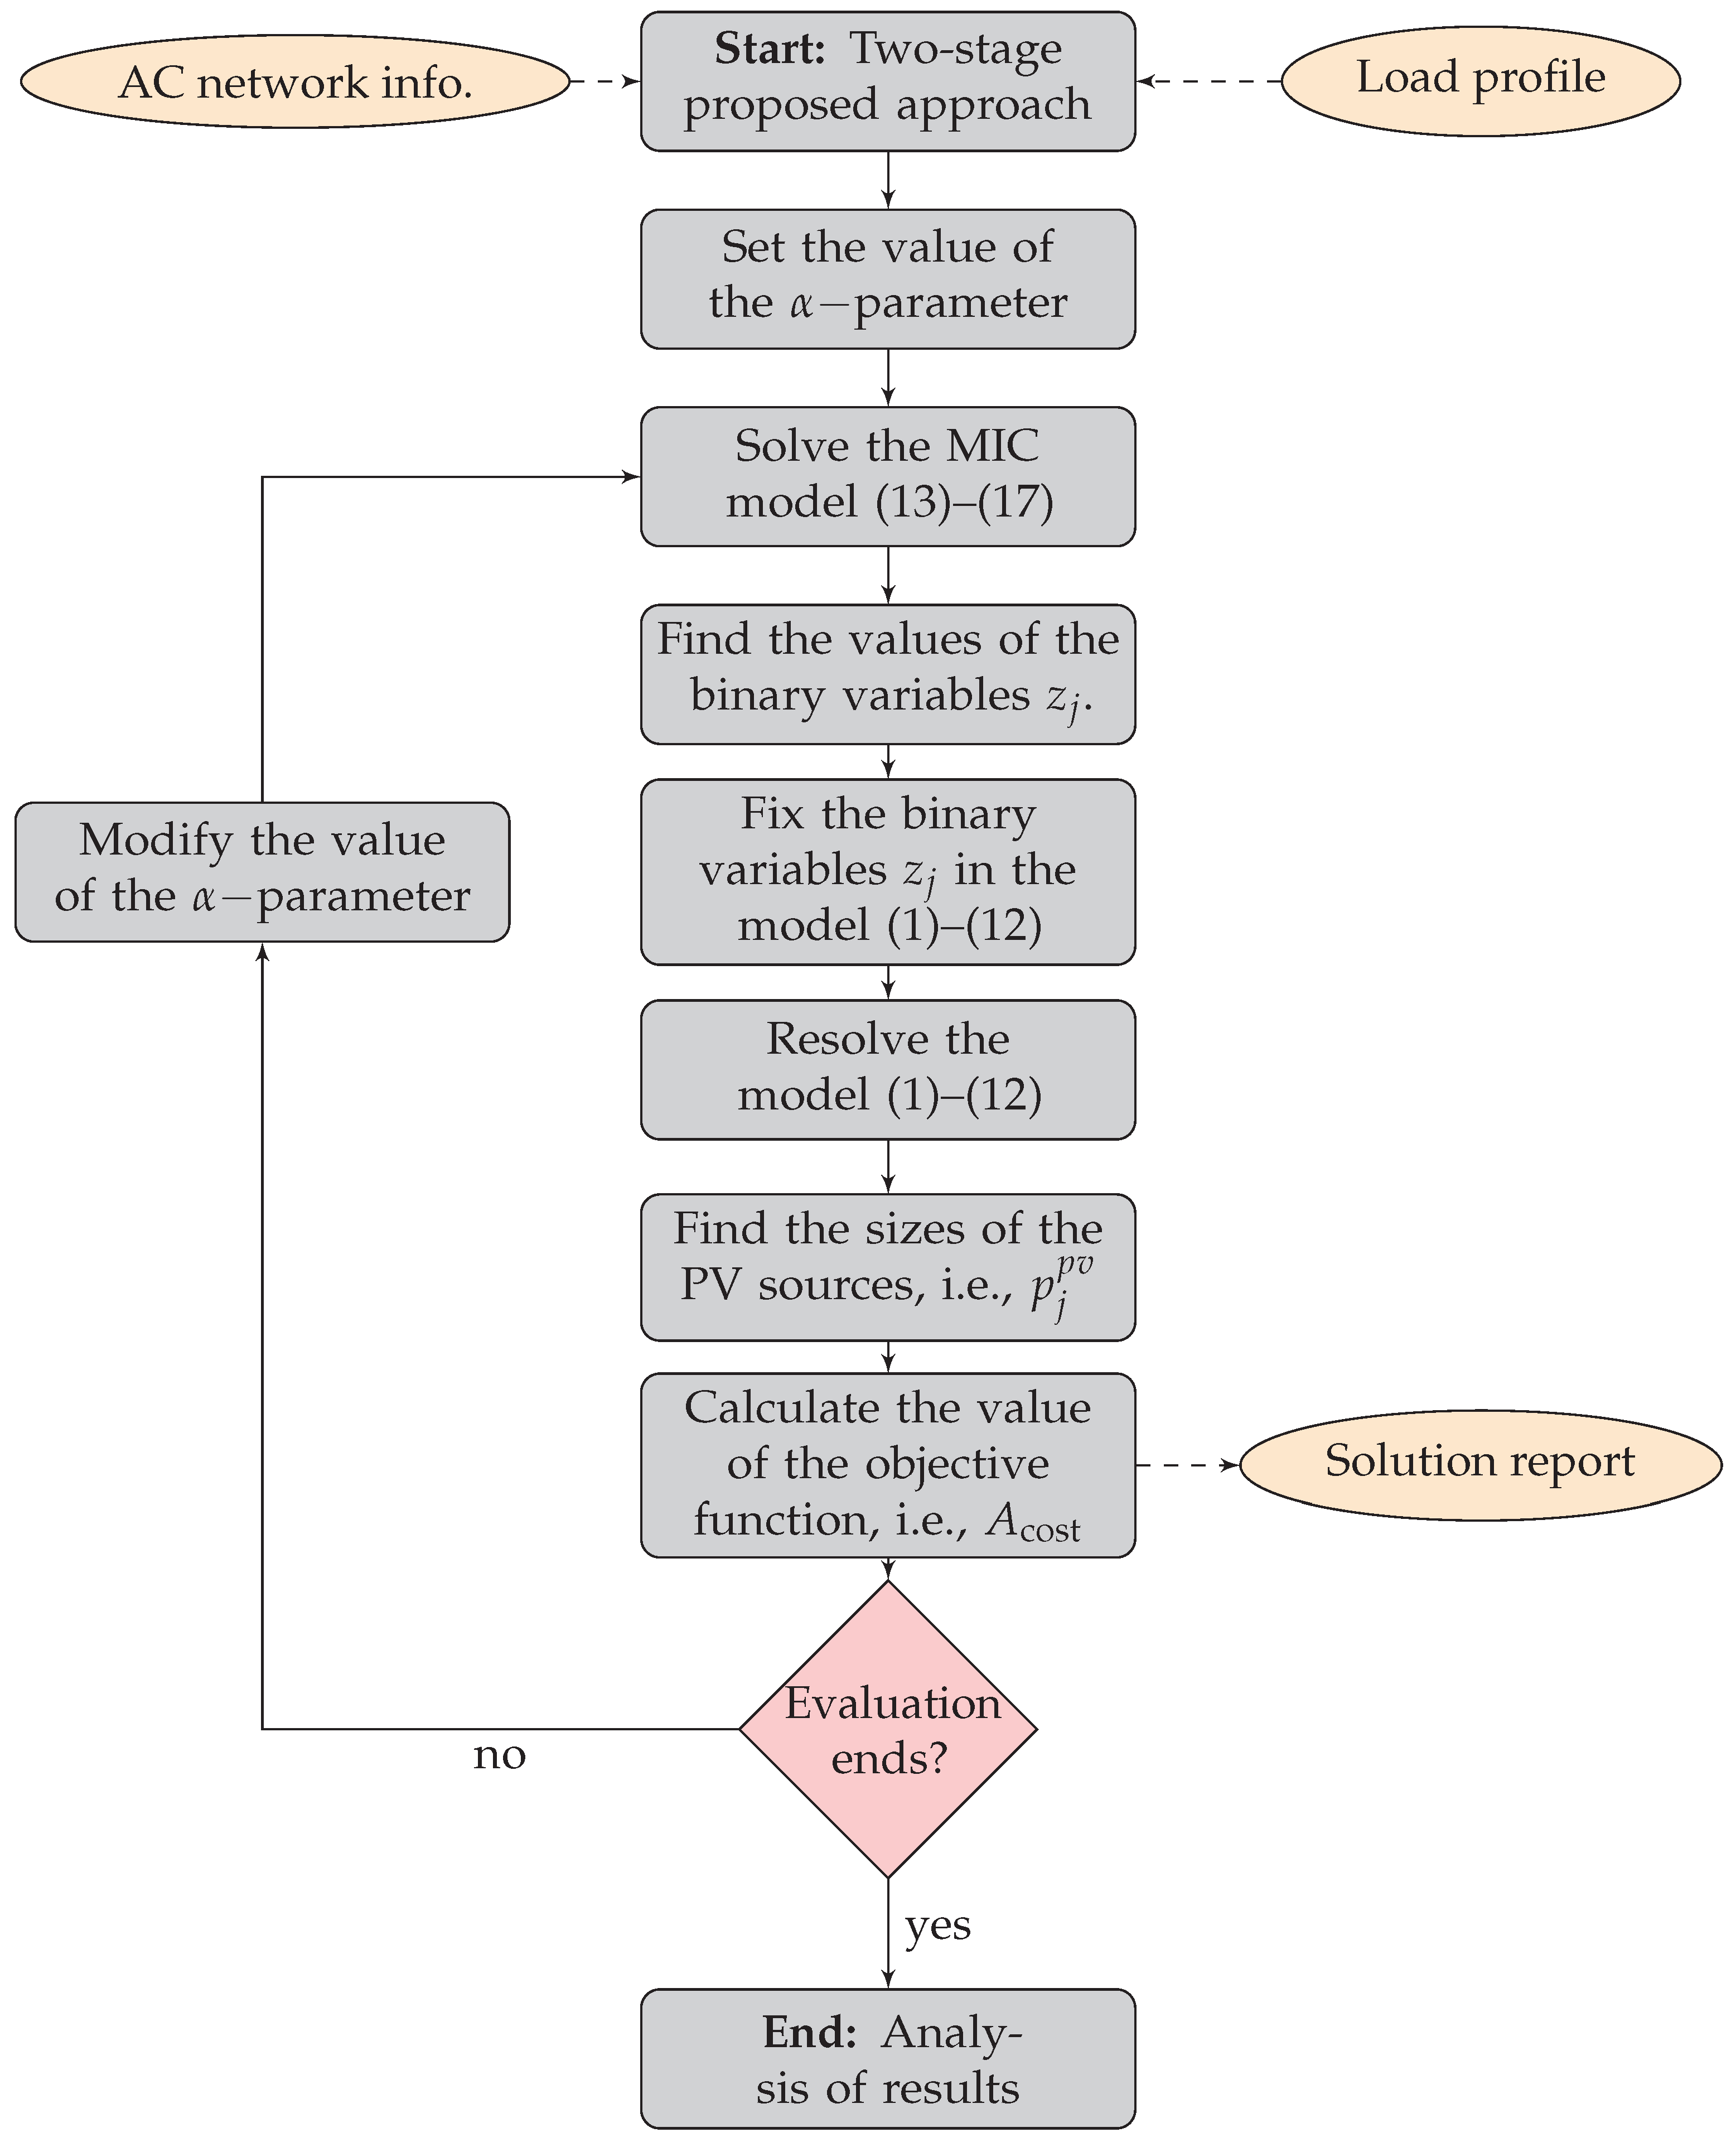
3. Solution Methodology

In this section, we present a novel two-stage optimization strategy to locate and size PV generation units in radial distribution networks with the aim of minimizing the total annual operational costs of the distribution system [21,22]. The first stage of the proposed methodology consists of the formulation of a mixed-integer quadratic model that allows defining the nodes where the PV generation units will be located. In the second stage, the resulting multi-period optimal power flow model with an logarithmic barrier interior point method is evaluated. Numerical results in the IEEE 33- and IEEE 85-bus systems will demonstrate the effectiveness and robustness of the proposed optimization model to deal with better objective function values when compared with the current literature results. The main aspects of the proposed two-stage optimization approach are discussed below.

3.1. First Stage: Selection of the Nodes for Locating PV Sources

In this section, we present an approximate quadratic convex model to select the nodes where the PV generators will be located. With this mixed-integer convex (MIC) model, the exact MINLP formulation is reduced to a MIC model in the first stage and an NLP model in the second stage. The MIC model is obtained after applying the following considerations based on the recommendations provided by Taylor et al. in [23]:
The voltage magnitudes using per-unit representation are near the unity value, i.e., v j = 1 , j N .
The magnitude of the active and reactive power losses in the branches are negligible with respect to the magnitude of the power flows on these.
With the aforementioned assumptions, the set of constraints (4) to (12) can be simplified as follows:
p i j , h k : ( j k ) L p j k , h = P j , h d G h p v p j p v , j N , j slack , h H ,
q i j , h k : ( j k ) L q j k , h = Q j , h d , j N , j slack , h H ,
z j P p v min p j p v z j P p v max j N ,
i N z j N s t max ,
z j 0 , 1 , i N ,
Note that the main characteristic of the set of constraints (13) to (17) is that these are a set of mixed-integer linear constraints that can be solved with a modification of the Branch and Bound method [24]. Owing to the objective function and its components defined from Equations (1) to (3), this remains without any approximation. However, in order to include the effect of resistance parameter (i.e., power losses in distribution lines) from Equation (6), an approximation of the energy losses costs is obtained, which is added to the objective function as follows:
A approx = A cost + α C kWh T i j L h H R i j p i j , h 2 + q i j , h 2 Δ h .
where α is defined an activation parameter that defines if the approximate costs of the energy losses is used ( α = 1 ) or not ( α = 0 ) to define the nodes where the PV sources will be installed.
Remark 3.
Observe that the approximated objective function in Equation (18) is a quadratic convex function, which when added to the relaxed set of constraints (13)–(17) produces a mixed-integer quadratic convex model that can be solved by ensuring the global optimum reaching with the correct combination of the Branch and Bound method with interior point methods [20].
It is worth emphasizing that the optimization model (13)–(18) defines the optimal set of nodes where the PV sources will be connected, and also it provides approximate sizes for these sources; however, these sizes are not the correct values for the PV generators’ capacities, since these were obtained with the approximate grid model that does not consider the voltage and current variables. In this sense, from the solution of the MIC model (13)–(18), we only take the location of the PV sources to fix these in the second stage (presented below), which is entrusted with defining the correct (i.e., optimal) PV generation sizes.

3.2. Second Stage: Selection of the Size PV Sources

With the solution of the equivalent MIC model defined from (13) to (18), the value of the binary variables z j for all the nodes of the network are fixed. This solution implies that the MINLP model (1)–(12) is transformed into a NLP model, which can be solvable with a interior point method with logarithmic barrier [25]. In this research, to solve the resulting NLP model, the General Algebraic Modeling System (GAMS) software [26] is used. The general solution methodology to locate and size PV generation units in distribution grids is summarized in the flow diagram depicted in Figure 1.
It is worth mentioning that the search process presented in Figure 1 ends when all the possible values for the α -parameter have been tested. In addition, observe that the proposed optimization methodology depicted in Figure 1 is independent of the optimization tool, and it can be implemented in multiple software that deals with mixed-integer convex formulations, with the main advantage that its solution will always be the same due to the convexity of the solution space in the case that the binary variable input in the second optimization model is the same.

4. Test Feeders

In this section, we present the test feeders employed in the numerical validation of the proposed optimization methodology. The first test feeder corresponds to the IEEE 33-bus system, and the second test feeder is the IEEE 85-bus system. The complete information for each one of these distribution grids is presented below.

4.1. IEEE 33-Bus System

The electrical connection among nodes in this test feeder is depicted in Figure 2.
All the electrical parameters of the IEEE 33-bus system are listed in Table 1. In addition, it is important to mention that for both test feeders, the substation bus is operated with a medium-voltage magnitude of 12.66 kV.

4.2. IEEE 85-Bus System

The IEEE 85-node test feeder is a medium-voltage distribution network with 85 nodes and 84 lines (radial distribution system), which is operated with 11 kV in the substation bus. The total active and reactive power demand under the peak load consumption for this system is 2570.28 + j 2622.20 kVA. The electrical configuration is depicted in Figure 3, and its parametric information for this test feeder is listed in Table 2.

4.3. Demand and PV Generation Curves, and Objective Function Parametrization

One of the key aspects in the optimal design of solar PV generation systems corresponds to the effectiveness and robustness of the solar and demand curves prediction, since these are exogenous inputs of the optimization model, which implies that the quality of the solution is highly dependent on the precision of these data [27,28]. In this research, we use the information of the solar and demand curves typical from the Medellín city in Colombia, which was originally used by Grisales et al. in [29] to operate battery energy storage systems in direct current distribution networks. The demand and solar generation curves are presented in Figure 4.
In addition, to calculate the objective function value, the parameters reported in Table 3 are used. Some of these values are taken from [30].

5. Computational Validation

To validate the effectiveness of the proposed two-stage methodology to locate and size PV sources in distribution networks, we combine the convex tool for MATLAB software known as the CVX tool where the MIC model is solved, and the GAMS software where the equivalent NLP model is resolved. In addition, the exact MINLP model is also solved with the GAMS and the BONMIN solver, and with the discrete-continuous Chu and Beasely genetic algorithm (DCCBGA) proposed in [11], the discrete-continuous Newton-metaheuristic algorithm proposed in [10], and the discrete-continuous vortex-search algorithm proposed in [13]. Note that for the MATLAB implementations, its 2021 b on a PC with an AMD Ryzen 7 3700 2.3 -GHz processor and 16.0 GB RAM was used, running on a 64-bit version of Microsoft Windows 10 Single language.
For both test feeders, the benchmark case corresponds to the simulation scenario with the initial conditions of the distribution grid without including PV generation sources during the planning period. This simulation scenario provides the grid reference operative costs, which are the object of minimization with the optimal integration of the PV sources.

5.1. Results in the IEEE 33-Bus Grid

After applying the solution methodology described in Figure 1, the results in Table 4 are obtained. Note that for this test feeder, the best solution regarding the final objective function is reached when the α -parameter is assigned to 0.
Numerical results in Table 4 show that:
The proposed two-stage optimization approach finds a better solution of the IEEE 33-bus system in comparison with the literature reports. The solution of the MIC-NLP model selects nodes 11, 16, and 32 to locate PV generation units with sizes of 1064.6 kW, 889.9 kW, and 1698.9 kW, respectively. With this solution, it improved the result of the DCVSA by about USD/year 7.74 .
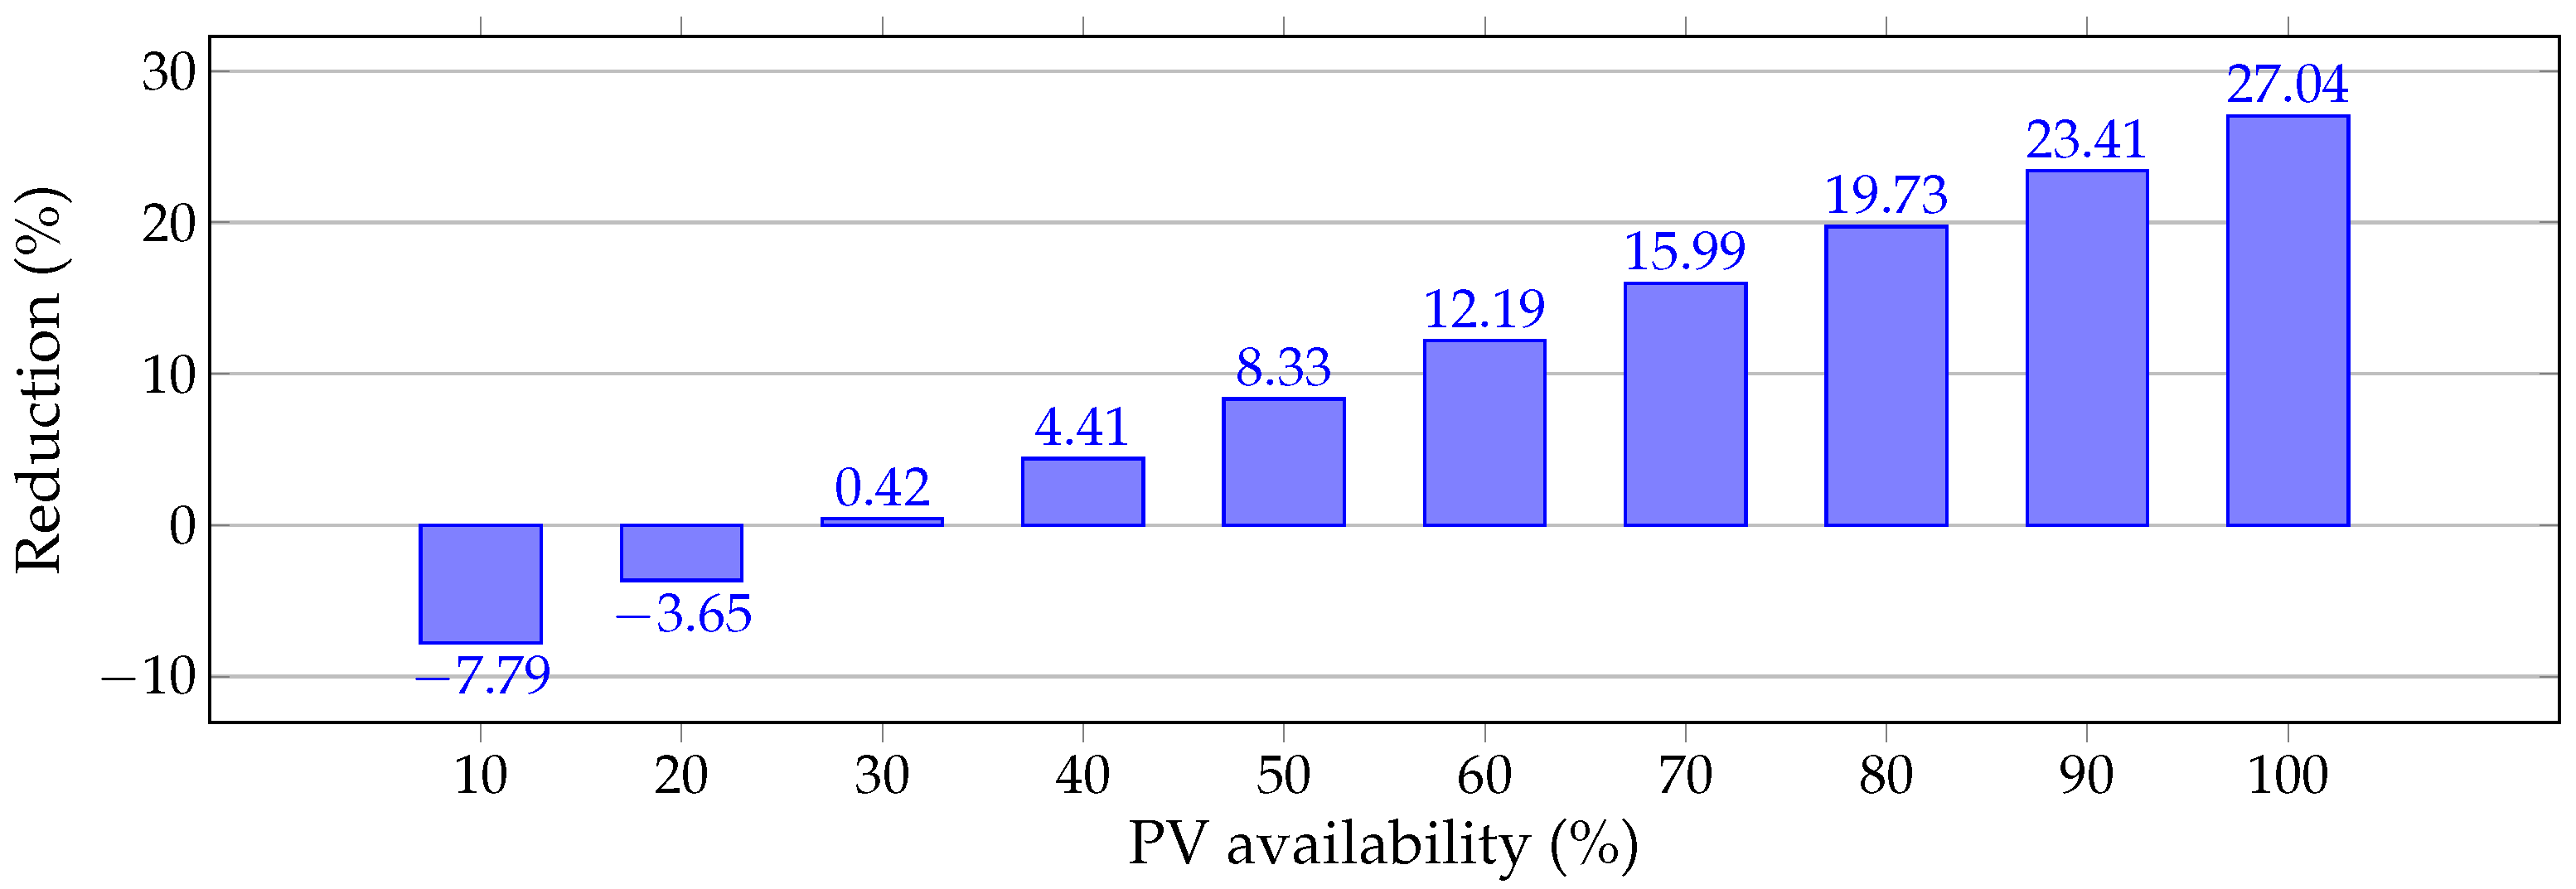
With regards to the objective function value, the proposed MIC-NLP approach allows reducing the annual grid operative costs by about USD1000701.41 per year of operation, i.e., a reduction of 27.04% with respect to the benchmark case.
The solution of the BONMIN solver in the GAMS software is the worst solution reported in Table 4. This situation occurs due to the complexity of the exact MINLP model to be solved, which makes the exact solvers stuck in locally optimal solutions. Note that the difference between the proposed MIC-NLP model is about 2070.17 dollars per year of operation, which clearly justifies the proposed two-stage approach to deal with the location and size of the PV generation units in distribution grids.
The DCCBGA and the DCNMA present solutions between the BONMIN solver and the DCVSA. These solutions differ from the proposed MIC-NLP model about USD/year 178.31 and USD/year 473.36 , respectively. These differences confirm the effectiveness of the MIC-NLP model to determine the best nodes to place the PV sources and also their optimal sizes.
It is important to emphasize that even if the metaheuristic optimizers provide near-optimal solutions to locate and size PV generation units in the IEEE 33-node system, these must be evaluated multiple times to make a statistical analysis, which will show their average performance. However, it is not possible to ensure that in each evaluation, there is no guarantee to obtain the optimal solution. In the case of the proposed MIC-NLP approach, the main advantage is that the MIC always provides the set of nodes reported in Table 4 due to its mixed-integer quadratic structure [24], and the logarithmic barrier also ensures the same solution for the equivalent NLP mode. This situation implies that the proposed MIC-NLP model does not require statistical analysis and its effectiveness is 100% in solving the studied problem in the IEEE 33-bus system.

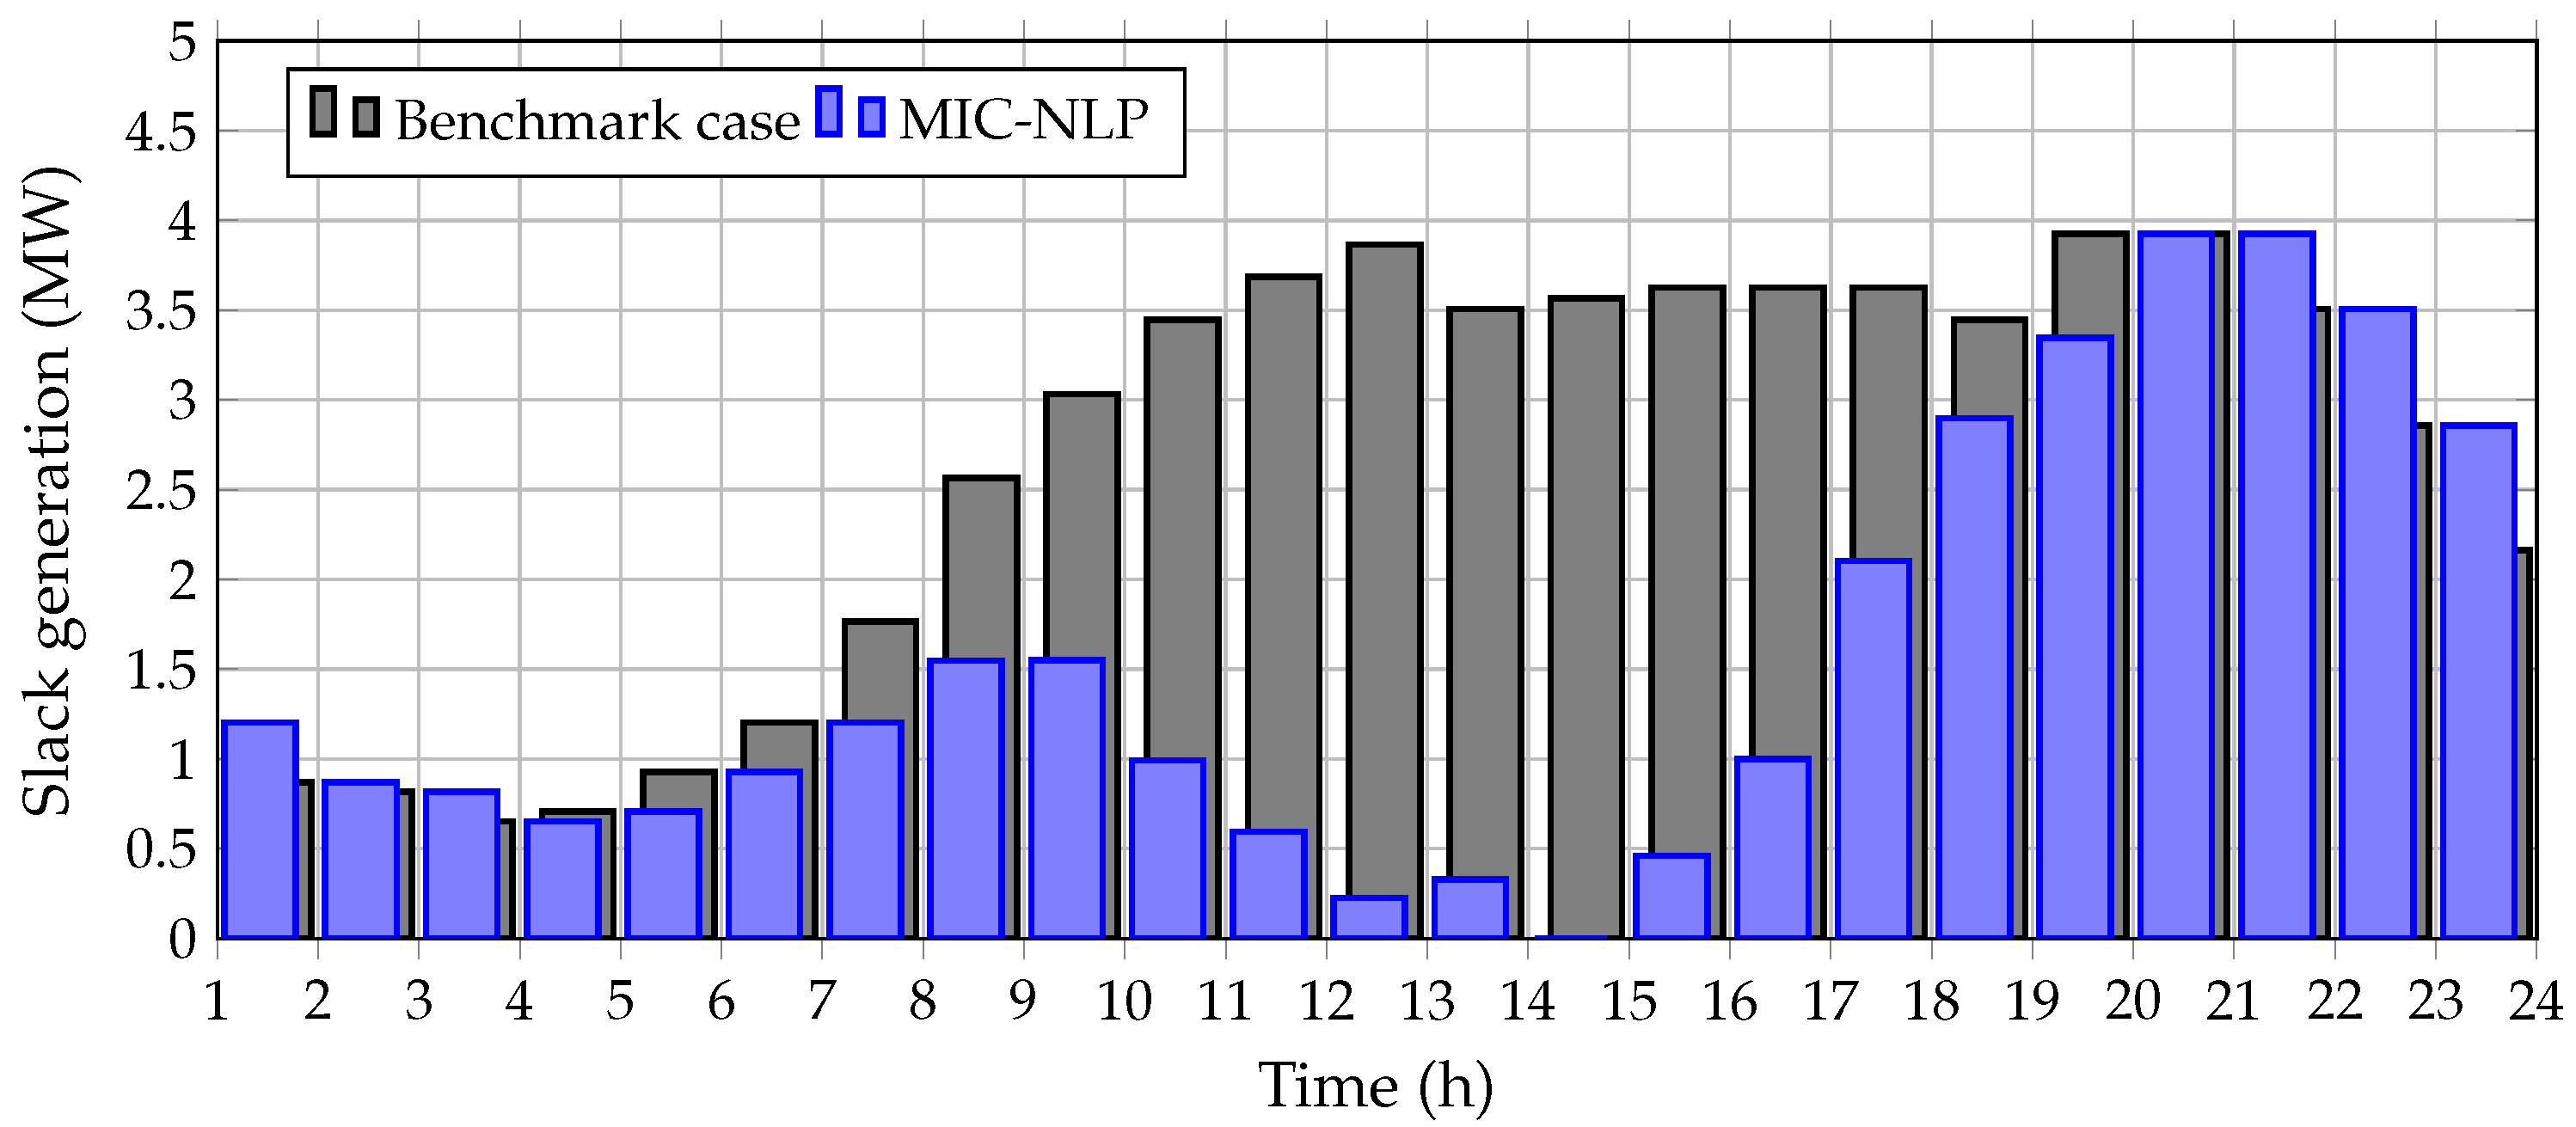
5.1.1. Behavior of Substation Power and Grid Voltage Profiles

To verify that the voltage profiles of the final solution with the PV sources are between their upper and lower bounds, Figure 5 presents the maximum and minimum voltage profiles for the IEEE 33-bus system during the daily operation.
The demeanor of the maximum and minimum voltage profiles in the IEEE 33-bus grid show that:
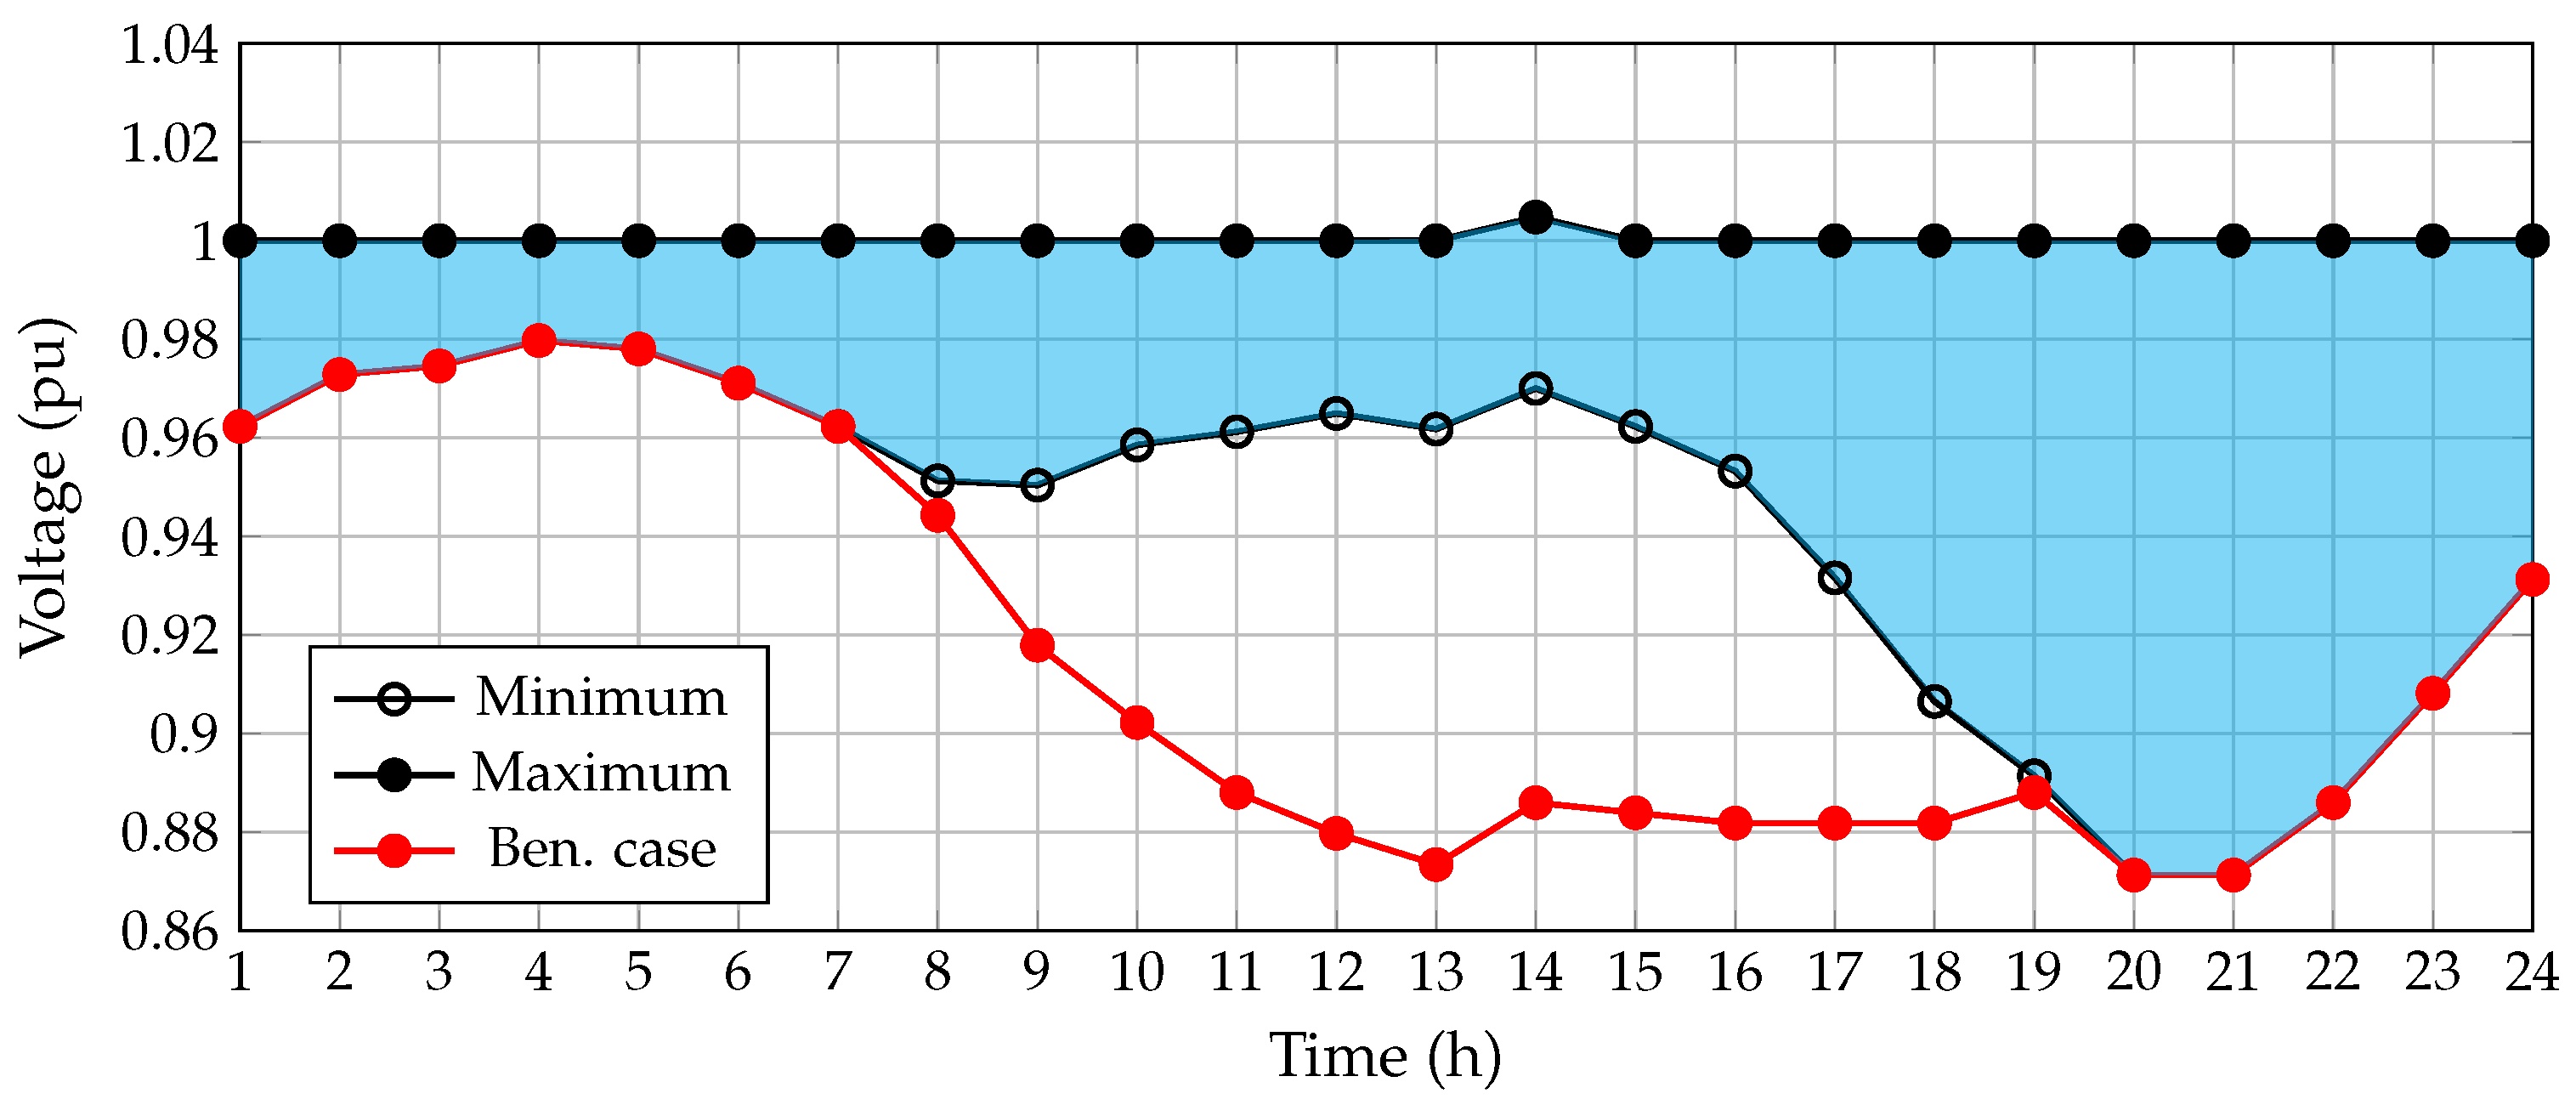
During the period of time 14 when the PV generation is maximum, it presents the maximum voltage magnitude of the voltage with a value of 1.0334 pu. Note that this voltage magnitude exceeds the value of the substation bus; however, it is between the ±10% imposed by the regulatory policies.
The minimum voltage profile occurs during periods of time where the demand is maximum, i.e., 20 and 21, and the renewable generation is zero. Note that the minimum voltage is 0.9038 pu and as is expected, it meets with the benchmark voltage curve.
In addition, to verify that that the power output in the substation bus is always positive of null, in Figure 6 the power generation output for the proposed MIC-NLP solution and its comparison with the benchmark case are illustrated.
Results in Figure 6 confirm that when the PV sources increase their active power injection at nodes 11, 16, and 32, the amount of active power injection in the slack source decreases until reaching a zero value when the PV generation is maximum in the period of time 14. However, in the periods of time when the PV generation is null, i.e., during periods 1 to 7 and 20 to 24, the slack power generation and the benchmark case have the same numerical behavior, which is an expected situation due to the inactivity of the PV sources in those periods.

5.1.2. Uncertainties Effect in the Expected Annual Grid Operating Costs

In this section, we evaluate the effect of the possible renewable energy variations during the duration of the project. We consider that the expected generation can vary from 10% to 100% of the nominal curve in Figure 4. The effect of the solar energy variation is determined from the economical point of view regarding the annual grid operating cost. Note that in Equation (1), the only costs that remain constant are the investment in renewable energy sizes, since these are selected as the solution provided by the MIC-NLP model, while the energy purchasing costs and the maintenance costs of the PV are variables as a function of the net power injection in the PV sources. Figure 7 illustrates the expected reduction of the total annual grid operating costs as a function of the percentage of PV generation.
Results in Figure 7 demonstrate that (i) the variation of the PV output generation drastically affects the expected annual profit, since for penetrations lower than 28.97% the expected profit after the implementation of the PV resources with the sizes in Table 4, is null or negative; note that when the PV generation is 30% of the expected generation, the net profit is only about 0.4153%, i.e., USD15,367.48 per year of operation; (ii) when the PV generation is from 50% to 80%, the expected profit varies from 8.3330 % to 19.7295 % , i.e., in this range, the minimum gain is about USD/year 308,357.54 plus a variable gain of USD/year 421,725.25; and (iii) the expected increment in the annual grid operative costs when the PV generation increases 10% is about 3.8707 % , which implies an additional gain of 143,234.71 dollars per year of operation.

5.2. Results in the IEEE 85-Bus Grid

Once the proposed methodology described in Figure 1 is applied, the results listed in Table 5 are found. It is worth emphasizing that the best solution regarding the final objective function value is reached when the α -parameter is set as 1. In addition, for this test feeder, the BONMIN solver does not converge to any feasible solution, and the comparative methods are chosen as the DCNMA and the DCCBGA, based on the results reported in [10].
Numerical reports in Table 5 allow observe that:
The proposed two-stage optimization approach only selects two nodes to locate dispersed generators, which are nodes 48 and 67, with a total peak power installed capacity of 2590.20 kWp since node 8 is assigned with 0 installed capacity. When compared with the DCNMA that select nodes 37, 67, and 71 with an installed power capability of 2598.40 kWp, it is observed that the solution of our approach reduces the need of PV capacity by about 8.20 kWp with a small increment regarding the final objective function of USD/year 30.25 .
The reduction with respect to the benchmark reached by the proposed approach is about 27.60 % , its difference with respect to the DCNMA being less than 1.12 × 10 3 % , which confirms that both solutions are numerically equivalent, with the main advantage that the proposed two-stage approach just requires two interventions in the distribution network (i.e., installation of two PV systems) when compared with the three interventions required by the DCNMA.
The main advantage of the proposed two-stage solution methodology, when compared with the DCNMA is that in the former case, the solution of the MIC model always will report the same set of nodes to locate the PV sources due to the convexity of the solution space, while the latter requires statistical analysis to obtain the best optimal solution and it does not guarantee that the solution obtained in each evaluation will be the same due to the complete optimization model (1)–(11) being non-linear and non-convex.

5.2.1. Behavior of Substation Power and Grid Voltage Profiles

To verify that the voltage profiles of the final solution with the PV sources are between their upper and lower bounds, Figure 8 presents the maximum and minimum voltage profiles for the IEEE 85-bus system during the daily operation.
The behavior of the upper and lower magnitudes of the voltage profiles in the IEEE 85-bus grid show that:
During the period of time 14 when the PV generation is maximum, the maximum voltage magnitude of the voltage with a value of 1.0048 pu is presented; nevertheless, this value is practically equal to the value of the substation bus.
The minimum voltage profile occurs during periods of time where the demand is maximum, i.e., 20 and 21, and the renewable generation is zero. Note that the minimum voltage is 0.8713 pu and as is expected, it follows with the benchmark voltage curve.
It is worth mentioning that lower voltage magnitude in the IEEE 85-bus system implies a voltage regulation of 12.87 % , which is out of the typical regulation bounds imposed by regulatory policies, i.e., ±10%. However, it is the normal operative condition of the network when not shunt devices are connected, making it impossible to resolve only with PV sources, as the case studied in this research.
In addition, to verify that that the power output in the substation bus is always positive of null, Figure 9 illustrates the power generation output for the proposed MIC-NLP solution and its comparison with the benchmark case.
The numerical performance in the IEEE 85-bus system for the slack source confirms that the power injection in the substation is always positive or null, being in the hour of the maximum PV generation, i.e., hour 14, zero. In addition, during periods 1 to 7 and 20 to 24, the slack power generation and the benchmark case have the same numerical behavior, which is an expected situation due to the zero generation in the PV sources for those periods.

5.2.2. Uncertainties Effect in the Expected Annual Grid Operating Costs

Here, we evaluate the renewable energy variations in the expected annual grid operational costs. It is considered that the PV sources can vary their energy availability from 10% to 100% of the nominal curve depicted in Figure 4. Note that in this scenario, the investment costs in PV sources are constant, while the energy purchasing costs in the substation bus and the PV maintenance costs are variable as a function of the PV generation availability. Figure 10 presents the expected reductions in the annual grid operative costs as a function of the percentage of the PV generation.
Results in Figure 10 demonstrate as equal as the IEEE 33-bus system that:
  • The variation in the PV generation availability directly affects the expected annual profit, for the IEEE 85-bus grid positive benefits are obtained for PV generation availability upper than 27.95%.
  • For renewable energy penetrations between 50% to 80% the expected profits are between 8.8161 % and 20.2679 % . These values implies a minimum annual gain of US%/year 236,810.84 with a variable gain of USD/year 307,608.97.
  • The expected increment in the annual grid operative costs when the PV generation increases 10% is about 3.8953 % , which implies an additional gain of 104,633.39 dollars per year of operation.

5.3. Additional Results

Numerical solutions reported in the previous sections show that the best result with the proposed MIC-NLP model for the IEEE 33-bus system is reached when the α -parameters is set as 0; however, in the IEEE 85-bus system, the best solution is found when this parameter is assigned as 1. For this reason, the solutions of both test feeders when the α -parameter changes its value are also reported.
For the IEEE 33-bus system when the α -parameter is set as 1, the nodes where the PV must be located are 13, 24, and 30, with installed capacities of 1646.64 kWp, 459.07 kWp, and 1949.09 kWp, respectively. With these sizes, the final objective function value is USD/year 2,700,286.59, i.e., 532.62 dollars per year, which is more expensive that the optimal solution reported in Table 4, which confirms that in practical terms, the proposed MIC-NLP model provides two effective solutions for the utility company that can be analyzed before the final physical implementation.
For the IEEE 85-bus system when the α -parameter is set as 0, the nodes where the PV must be located are 45, 53, and 74, with installed capacities of 772.86 kWp, 783.96 kWp, and 1057.91 kWp, respectively. With these sizes, the final objective function value is USD/year 1,945,100.44, i.e., 369.31 dollars per year more expensive that the optimal solution reported in Table 5 with the NMA. As the previous test feeder, it is possible to affirm that the proposed MIC-NLP is an excellent alternative with multiple options to locate and size PV sources in distribution systems, which can be used by the utility to make different studies before the final implementation of the selected solution.
Regarding processing times for the IEEE 33-bus system, the proposed methodology takes about 13.5 s solving the location problem and 1.5 s solving the sizing problem. In the case of the IEEE 85-bus grid, the average time is 15 s for the location problem and 2.2 s for the sizing problem. These processing times confirm the effectiveness of the proposed MIC-NLP model to solve the exact MINLP formulation by decoupling this into two subproblems. It is worth mentioning that the main advantage of the proposed two-stage optimization model lies in the possibility of finding the same numerical solution at each running of the complete model, which is not possible with the conventional metaheuristic methods used to solve MINLP models due to the strong nonlinearities and non-convexities of the power flow equations and their combination with integer decision variables.
With respect to the comparative methods for the IEEE 33-bus system, the processing times were as follows: 5.50 s for the DCCBGA, 20.22 s for the DCNMA, and 28.44 s for the DCVSA. In the case of the IEEE 85-bus grid, these times were: 157.24 s for the DCNMA, and 38.08 for the DCCBGA. These results confirm that the proposed MIC-NLP model to solve the studied problem is, on average, the most stable method regarding processing times since it takes 15 s for the IEEE 33-bus grid and 17.20 s for the IEEE 85-bus grid, while the metaheuristic comparison methods increase their processing times drastically as a function of the number of nodes in the grid.

6. Conclusions and Future Works

The problem of the optimal siting and dimensioning PV generation sources in radial distribution networks was addressed in this research by the application of a two-stage optimization methodology. In the first stage, a simplified mixed-integer quadratic model was proposed to define the nodes where the PV generations must be installed. With this information, in the second stage, the nodes in the exact MINLP model (1)–(12) are fixed, which turned this into a NLP model associated with the dimension problem (optimal power flow problem). The NLP model is resolved with the application of logarithmic barrier interior point method available in the GAMS software. Numerical results in the IEEE 33- and IEEE 85-bus systems demonstrated that:
The expected annual operative costs reduction for the IEEE 33-bus system (i.e., net profit) is about 27.04% with the proposed MINLP model, i.e., USD1,000,701.41 per year of operation, which improved the best current solution reported in the current literature through the application of the DCVSA about USD/year 7.74 . In the case of the IEEE 85-bus system, this reduction was about 27.60% with respect to the benchmark case, which was 30.25 dollars per year more expensive than the solution reported by the NMA.
The main advantage of the proposed MIC-NLP model is that the problem of the nodal selection with the MIC model has a unique solution due to the convexity of the solution space; this implies that the solution regarding the location of the PV generation is unique for each α value. In addition, when the PV locations are provided to the interior point method in GAMS, the final solution regarding the sizes does not change, which implies that statistical validations are not required to verify the efficiency of our proposal, which is not the case of the metaheuristic optimizers due to their random nature.
The evaluation of the renewable energy variation from 10% to 100% showed that if the percentage of renewable generation is lower than 28.97 % for the IEEE 33-bus system, and 27.95 % for the IEEE 85-bus system, the expected annual profit will be negative or zero. In addition, when the PV generation is higher than 50% of the initial projected output, the expected annual profit will be higher than USD/year 308,357.54 for the IEEE 33-bus grid and higher than USD/year 236,810.84 for the IEEE 85-bus grid.
For future works, it will be possible to develop the following researches: (i) the formulation on equivalent mixed-integer second-order cone programming model to locate and size PV generators in distribution grids considering the possibility of generating PV power from zero to the nominal expected generation curve; and (ii) integrating the simultaneous allocation and sizing of reactive power compensators in the proposed MINLP model, considering their investment and operating costs; and (iii) including the stochastic nature of the PV generation and demand curves as well as the variability of the energy pricing along the planning period in the MINLP formulation.

Author Contributions

Conceptualization, methodology, software, and writing—review and editing, O.D.M., E.R.-T. and J.C.H. All authors have read and agreed to the published version of the manuscript.

Funding

This work was supported in part by the Centro de Investigación y Desarrollo Científico de la Universidad Distrital Francisco José de Caldas under grant 1643-12-2020 associated with the project: “Desarrollo de una metodología de optimización para la gestión óptima de recursos energéticos distribuidos en redes de distribución de energía eléctrica”.

Data Availability Statement

No new data were created or analyzed in this study. Data sharing is not applicable to this article.

Conflicts of Interest

The authors declare no conflict of interest.

References

  1. van Ruijven, B.J.; Cian, E.D.; Wing, I.S. Amplification of future energy demand growth due to climate change. Nat. Commun. 2019, 10, 2762. [Google Scholar] [CrossRef] [PubMed] [Green Version]
  2. Lamb, W.F.; Wiedmann, T.; Pongratz, J.; Andrew, R.; Crippa, M.; Olivier, J.G.J.; Wiedenhofer, D.; Mattioli, G.; Khourdajie, A.A.; House, J.; et al. A review of trends and drivers of greenhouse gas emissions by sector from 1990 to 2018. Environ. Res. Lett. 2021, 16, 073005. [Google Scholar] [CrossRef]
  3. Amponsah, N.Y.; Troldborg, M.; Kington, B.; Aalders, I.; Hough, R.L. Greenhouse gas emissions from renewable energy sources: A review of lifecycle considerations. Renew. Sustain. Energy Rev. 2014, 39, 461–475. [Google Scholar] [CrossRef]
  4. Caro, D.; Davis, S.J.; Bastianoni, S.; Caldeira, K. Greenhouse Gas Emissions Due to Meat Production in the Last Fifty Years. In Quantification of Climate Variability, Adaptation and Mitigation for Agricultural Sustainability; Springer International Publishing: Cham, Switzerland, 2016; pp. 27–37. [Google Scholar] [CrossRef]
  5. Abdallah, L.; El-Shennawy, T. Reducing Carbon Dioxide Emissions from Electricity Sector Using Smart Electric Grid Applications. J. Eng. 2013, 2013, 845051. [Google Scholar] [CrossRef] [Green Version]
  6. Iweh, C.D.; Gyamfi, S.; Tanyi, E.; Effah-Donyina, E. Distributed Generation and Renewable Energy Integration into the Grid: Prerequisites, Push Factors, Practical Options, Issues and Merits. Energies 2021, 14, 5375. [Google Scholar] [CrossRef]
  7. Taba, M.F.A.; Mwanza, M.; Çetin, N.S.; Ülgen, K. Assessment of the energy generation potential of photovoltaic systems in Caribbean region of Colombia. Period. Eng. Nat. Sci. 2017, 5, 55–60. [Google Scholar] [CrossRef] [Green Version]
  8. Holjevac, N.; Baškarad, T.; Đaković, J.; Krpan, M.; Zidar, M.; Kuzle, I. Challenges of High Renewable Energy Sources Integration in Power Systems—The Case of Croatia. Energies 2021, 14, 1047. [Google Scholar] [CrossRef]
  9. Valencia, A.; Hincapie, R.A.; Gallego, R.A. Optimal location, selection, and operation of battery energy storage systems and renewable distributed generation in medium–low voltage distribution networks. J. Energy Storage 2021, 34, 102158. [Google Scholar] [CrossRef]
  10. Montoya, O.D.; Grisales-Noreña, L.F.; Alvarado-Barrios, L.; Arias-Londoño, A.; Álvarez-Arroyo, C. Efficient Reduction in the Annual Investment Costs in AC Distribution Networks via Optimal Integration of Solar PV Sources Using the Newton Metaheuristic Algorithm. Appl. Sci. 2021, 11, 11525. [Google Scholar] [CrossRef]
  11. Montoya, O.D.; Grisales-Noreña, L.F.; Perea-Moreno, A.J. Optimal Investments in PV Sources for Grid-Connected Distribution Networks: An Application of the Discrete–Continuous Genetic Algorithm. Sustainability 2021, 13, 13633. [Google Scholar] [CrossRef]
  12. Hraiz, M.D.; Garcia, J.A.M.; Castaneda, R.J.; Muhsen, H. Optimal PV Size and Location to Reduce Active Power Losses While Achieving Very High Penetration Level With Improvement in Voltage Profile Using Modified Jaya Algorithm. IEEE J. Photovolt. 2020, 10, 1166–1174. [Google Scholar] [CrossRef]
  13. Cortés-Caicedo, B.; Molina-Martin, F.; Grisales-Noreña, L.F.; Montoya, O.D.; Hernández, J.C. Optimal Design of PV Systems in Electrical Distribution Networks by Minimizing the Annual Equivalent Operative Costs through the Discrete-Continuous Vortex Search Algorithm. Sensors 2022, 22, 851. [Google Scholar] [CrossRef]
  14. Kaur, S.; Kumbhar, G.; Sharma, J. A MINLP technique for optimal placement of multiple DG units in distribution systems. Int. J. Electr. Power Energy Syst. 2014, 63, 609–617. [Google Scholar] [CrossRef]
  15. Jiménez, J.; Cardona, J.E.; Carvajal, S.X. Location and optimal sizing of photovoltaic sources in an isolated mini-grid. Tecnológicas 2019, 22, 61–80. [Google Scholar] [CrossRef]
  16. Alsadi, S.; Khatib, T. Photovoltaic Power Systems Optimization Research Status: A Review of Criteria, Constrains, Models, Techniques, and Software Tools. Appl. Sci. 2018, 8, 1761. [Google Scholar] [CrossRef] [Green Version]
  17. Alayi, R.; Mohkam, M.; Seyednouri, S.R.; Ahmadi, M.H.; Sharifpur, M. Energy/Economic Analysis and Optimization of On-Grid Photovoltaic System Using CPSO Algorithm. Sustainability 2021, 13, 12420. [Google Scholar] [CrossRef]
  18. Thai, J.; Bayen, A.M. Imputing a variational inequality function or a convex objective function: A robust approach. J. Math. Anal. Appl. 2018, 457, 1675–1695. [Google Scholar] [CrossRef]
  19. dos Santos, C.; Cavalheiro, E.; Bartmeyer, P.; Lyra, C. A MINLP Model to Optimize Battery Placement and Operation in Smart Grids. In Proceedings of the 2020 IEEE Power & Energy Society Innovative Smart Grid Technologies Conference (ISGT), Washington, DC, USA, 17–20 February 2020. [Google Scholar] [CrossRef]
  20. Montoya, O.D.; Alvarado-Barrios, L.; Hernández, J.C. An Approximate Mixed-Integer Convex Model to Reduce Annual Operating Costs in Radial Distribution Networks Using STATCOMs. Electronics 2021, 10, 3102. [Google Scholar] [CrossRef]
  21. Sheikhahmadi, P.; Mafakheri, R.; Bahramara, S.; Damavandi, M.; Catalão, J. Risk-Based Two-Stage Stochastic Optimization Problem of Micro-Grid Operation with Renewables and Incentive-Based Demand Response Programs. Energies 2018, 11, 610. [Google Scholar] [CrossRef] [Green Version]
  22. Dui, X.; Zhu, G.; Yao, L. Two-Stage Optimization of Battery Energy Storage Capacity to Decrease Wind Power Curtailment in Grid-Connected Wind Farms. IEEE Trans. Power Syst. 2018, 33, 3296–3305. [Google Scholar] [CrossRef]
  23. Taylor, J.A.; Hover, F.S. Convex Models of Distribution System Reconfiguration. IEEE Trans. Power Syst. 2012, 27, 1407–1413. [Google Scholar] [CrossRef]
  24. Alkhalifa, L.; Mittelmann, H. New Algorithm to Solve Mixed Integer Quadratically Constrained Quadratic Programming Problems Using Piecewise Linear Approximation. Mathematics 2022, 10, 198. [Google Scholar] [CrossRef]
  25. Andrei, N. Continuous Nonlinear Optimization for Engineering Applications in GAMS Technology; Springer International Publishing: Cham, Switzerland, 2017. [Google Scholar] [CrossRef]
  26. Soroudi, A. Power System Optimization Modeling in GAMS; Springer International Publishing: Cham, Switzerland, 2017. [Google Scholar] [CrossRef]
  27. Li, H.; Li, H.; Lu, W.; Wang, Z.; Bian, J. Optimal Power Flow Calculation Considering Large-Scale Photovoltaic Generation Correlation. Front. Energy Res. 2020, 8, 338. [Google Scholar] [CrossRef]
  28. Sulaiman, M.H.; Mustaffa, Z.; Mohamad, A.J.; Saari, M.M.; Mohamed, M.R. Optimal power flow with stochastic solar power using barnacles mating optimizer. Int. Trans. Electr. Energy Syst. 2021, 31, e12858. [Google Scholar] [CrossRef]
  29. Grisales-Noreña, L.; Montoya, O.D.; Ramos-Paja, C.A. An energy management system for optimal operation of BSS in DC distributed generation environments based on a parallel PSO algorithm. J. Energy Storage 2020, 29, 101488. [Google Scholar] [CrossRef]
  30. Wang, P.; Wang, W.; Xu, D. Optimal Sizing of Distributed Generations in DC Microgrids With Comprehensive Consideration of System Operation Modes and Operation Targets. IEEE Access 2018, 6, 31129–31140. [Google Scholar] [CrossRef]
Figure 1. General implementation of the two-stage methodology.
Electronics 11 00961 g001
Figure 2. Electrical network under analysis.
Electronics 11 00961 g002
Figure 3. Single-line diagram for the IEEE 85-node test feeder.
Electronics 11 00961 g003
Figure 4. Electrical generation and demand curves for Medellín city in Colombia.
Electronics 11 00961 g004
Figure 5. Minimum and maximum voltage magnitudes when the MIC-NLP solution is implemented in the IEEE 33-node test feeder.
Electronics 11 00961 g005
Figure 6. Slack power generation when compared to the benchmark case and the solution proposed by the proposed MIC-NLP for the IEEE 33-bus system.
Electronics 11 00961 g006
Figure 7. Effect of the PV generation uncertainties in the annual expected profit.
Electronics 11 00961 g007
Figure 8. Minimum and maximum voltage magnitudes when the MIC-NLP solution is implemented in the IEEE 85-node test feeder.
Electronics 11 00961 g008
Figure 9. Slack power generation when comparing the benchmark case and the solution proposed by the proposed MIC-NLP for the IEEE 85-bus grid.
Electronics 11 00961 g009
Figure 10. Effect of the PV generation uncertainties in the annual expected profit for the IEEE 85-bus system.
Electronics 11 00961 g010
Table 1. Electrical data of the IEEE 33-node system.
Node iNode j R i j ( Ω ) X i j ( Ω ) P j (kW) Q j (kvar)Node iNode j R i j ( Ω ) X i j ( Ω ) P j (kW) Q j (kvar)
120.09220.04771006017180.73200.57409040
230.49300.251190402190.16400.15659040
340.36600.18641208019201.50421.35549040
450.38110.1941603020210.40950.47849040
560.81900.7070602021220.70890.93739040
670.18720.61882001003230.45120.30839050
781.71141.235120010023240.89800.7091420200
891.03000.7400602024250.89600.7011420200
9101.04000.740060206260.20300.10346025
10110.19660.0650453026270.28420.14476025
11120.37440.1238603527281.05900.93376020
12131.46801.1550603528290.80420.700612070
13140.54160.71291208029300.50750.2585200600
14150.59100.5260601030310.97440.963015070
15160.74630.5450602031320.31050.3619210100
16171.28901.7210602032330.34100.53026040
Table 2. Electrical data of the IEEE 85-node system.
Node iNode j R i j ( Ω ) X i j ( Ω ) P j (kW) Q j (kvar)Node iNode j R i j ( Ω ) X i j ( Ω ) P j (kW) Q j (kvar)
120.1080.0750034441.0020.41635.2835.99
230.1630.1120044450.9110.37835.2835.99
340.2170.1495657.1345460.9110.37835.2835.99
450.1080.0740046470.5460.2261414.28
560.4350.29835.2835.9935480.6370.26400
670.2720.1860048490.1820.07500
781.1970.82035.2835.9949500.3640.15136.2837.01
890.1080.0740050510.4550.1895657.13
9100.5980.4100048521.3660.56700
10110.5440.3735657.1352530.4550.18935.2835.99
11120.5440.3730053540.5460.2265657.13
12130.5980.4100052550.5460.2265657.13
13140.2720.18635.2835.9949560.5460.2261414.28
14150.3260.22335.2835.999570.2730.1135657.13
2160.7280.30235.2835.9957580.8190.34000
3170.4550.189112114.2658590.1820.0755657.13
5180.8200.3405657.1358600.5460.2265657.13
18190.6370.2645657.1360610.7280.3025657.13
19200.4550.18935.2835.9961621.0020.4155657.13
20210.8190.34035.2835.9960630.1820.0751414.28
21221.5480.64235.2835.9963640.7280.30200
19230.1820.0755657.1364650.1820.07500
7240.9100.37835.2835.9965660.1820.0755657.13
8250.4550.18935.2835.9964670.4550.18900
25260.3640.1515657.1367680.9100.37800
26270.5460.2260068691.0920.4535657.13
27280.2730.1135657.1369700.4550.18900
28290.5460.2260070710.5460.22635.2835.99
29300.5460.22635.2835.9967720.1820.0755657.13
30310.2730.11335.2835.9968731.1840.49100
31320.1820.0750073740.2730.1135657.13
32330.1820.0751414.2873751.0020.41635.2835.99
33340.8190.3400070760.5460.2265657.13
34350.6370.2640065770.0910.0371414.28
35360.1820.07535.2835.9910780.6370.2645657.13
26370.3640.1515657.1367790.5460.22635.2835.99
27381.0020.4165657.1312800.7280.3025657.13
29390.5460.2265657.1380810.3640.15100
32400.4550.18935.2835.9981820.0910.0375657.13
40411.0020.4160081831.0920.45335.2835.99
41420.2730.11335.2835.9983841.0020.4161414.28
41430.4550.18935.2835.9913850.8190.34035.2835.99
Table 3. Data for objective function calculation.
Param.ValueUnitParam.ValueUnit
C kWh 0.1390USD/kWhT365days
t a 10% t e 2%
N t 20years Δ h 1h
C p v 1036.49USD/kWp C O & M 0.0019USD/kWh
p i p v , max 2400kW p i p v , min 0kW
N p v max 3 Δ V ±10%
Table 4. Numerical results in the IEEE 33-bus system for the proposed and comparative methods.
MethodLocation (Node)Size (MW) A cost (USD/year)
Benchmark case3,700,455.38
BONMIN 17 , 18 , 33 1.3539 , 0.2105 , 2.1452 2,701,824.14
DCCBGA 11 , 15 , 30 0.7605 , 0.9690 , 1.9060 2,699,932.28
DCNMA 8 , 16 , 30 2.0961 , 1.2688 , 0.2770 2,700,227.33
DCVSA 11 , 14 , 31 0.7606 , 1.0852 , 1.8030 2,699,761.71
MIC-NLP 11 , 16 , 32 1.0646 , 0.8899 , 1.6989 2,699,753.97
Table 5. Numerical results in the IEEE 85-bus system for the proposed and comparative methods.
MethodLocation (Node)Size (MW) A cost (USD/year)
Benchmark case2,686,114.05
DCCBGA 47 , 48 , 68 0.2603 , 1.1657 , 1.1680 1,944,779.15
DCNMA 37 , 67 , 71 1.6313 , 0.4633 , 0.5038 1,944,731.13
MIC-NLP 8 , 48 , 67 0.0000 , 1.3450 , 1.2452 1,944,761.38
Publisher’s Note: MDPI stays neutral with regard to jurisdictional claims in published maps and institutional affiliations.

