
Predictive Maintenance System for Wafer Transport Robot Using K-Means Algorithm and Neural Network Model

Department of Information and Communication Engineering, Myongji University, Yongin 17058, Korea
*
Author to whom correspondence should be addressed.
Electronics 2022, 11(9), 1324; https://doi.org/10.3390/electronics11091324
Submission received: 17 March 2022
/
Revised: 14 April 2022
/
Accepted: 18 April 2022
/
Published: 21 April 2022
(This article belongs to the Special Issue Advances in Machine Condition Monitoring and Fault Diagnosis)
Abstract
:Maintenance is the technology of continuously monitoring the conditions of equipment and predicting the timing of maintenance for equipment. Particularly in the field of semiconductor manufacturing, where processes are automated, various methods are being tried to minimize the economic losses and maintenance costs caused by equipment failure. A new Predictive Maintenance (PdM) technique, a new method of maintenance, is introduced in this paper to develop an algorithm for predicting the failure of wafer transfer robots in advance. The acceleration sensor data used in the experiment were obtained by installing a sensor onto the wafer transfer robot. To analyze these data, the data preprocessing and FFT process were performed. These data were divided into normal data, first error data, second error data, and third error data (failure data) in stages. By clustering the data using the K-means algorithm, the center point distribution of the clusters was analyzed, and the features of the error data and normal data were extracted. Using these features, an artificial neural network model was designed to predict the point of failure of the robot. Previous research on maintenance systems of the transfer robot used fewer than 50 error data, but 1686 error data were used in this experiment. The reliability of the model is improved by randomly selecting data from a total of 2248 data sets. In addition, it was confirmed that it was possible to classify normal data and error data with an accuracy of 97% and to predict equipment failure by applying neural network modeling.
1. Introduction
Maintenance comprises measures and activities to maintain equipment in operational condition and repair failure and defects. Maintenance as a technology, which began in the late 1960s, started with the purpose of detecting and monitoring equipment abnormalities such as vibration, heat, and noise generated by equipment, and the technology continues to develop even now. One of the earliest representative maintenance methods is BM (Breakdown Maintenance), which repairs or replaces equipment when it breaks down. This is a post-maintenance method that restores equipment to a normal state after a failure occurs. Another method is PM (Planned Maintenance), which regularly inspects and replaces parts of equipment on a set date. In the case of a BM, if a defect occurs, the equipment cannot be operated until the equipment is repaired. In contrast, PM regularly inspects the equipment and performs unnecessary inspections, resulting in economic losses. Recently, Predictive Maintenance (PdM), which can solve these problems, has been used in a variety of fields [1,2,3,4]. PdM consists of a process to monitor equipment periodically (offline) or continuously (online) to determine equipment status [5]. By using the data obtained from monitoring, it is possible to obtain the characteristics of a defect in the equipment and to identify the point in time at which the possibility of equipment failure will be high. This minimizes economic loss by taking measures such as replacing parts or repairing equipment before equipment problems occur [6].
In the field of semiconductor manufacturing, where the process is automated, various methods are being tried to minimize the economic losses and maintenance costs caused by equipment failure. Various types of equipment are used in the semiconductor process industry, one of which is a wafer transfer robot. The wafer transfer robot is a robot that transfers wafers inside and outside of the equipment. As wafers have become larger and denser, it has become impossible to transport them via human efforts. In addition, the transfer of wafers by humans causes contamination that has the greatest impact on the semiconductor manufacturing process and has a huge influence on the tack time that determines the yield of the process. Therefore, a wafer transfer robot is essential in the semiconductor process, and since it is necessary to ensure the stability of the system, the development of a technology for monitoring and diagnosing the robot is required.
This paper presents a new PdM system including a neural network model that can predict the failure of a wafer transfer robot in advance. To achieve this purpose, the data obtained from the acceleration sensor attached to the wafer transfer robot were clustered through the K-means algorithm. The change in the center points of the clustered data was tracked, and finally, the neural network system was completed to predict the appropriate maintenance time of the equipment.
2. Background
Various attempts are being made to increase the yield of wafers in the semiconductor process and to reduce unnecessary maintenance costs of equipment. The development of new technologies and equipment is important, but research to monitor the condition of equipment and predict failures is also required. With the recent development of big data technology, it has become possible to utilize a large amount of semiconductor equipment data and sensor data [7,8,9]. Accordingly, research on fab-wide PdM realization and predicting equipment failure by developing PdM technology by analyzing numerous data obtained through equipment operation is underway [10,11].
Recently, various studies have been conducted to detect the point of error using data from wafer transfer robots [12,13,14,15]. To find abnormalities in the robot, a study was conducted to analyze the data obtained from the transfer robot [15]. Additionally, existing research has scheduled wafer transfer robots by analyzing photos of wafers and using endpoint determination algorithms [14]. However, if the status of the wafer cannot be checked in the middle of the process, scheduling cannot be performed. The studies have developed PdM technologies using various algorithms such as DBSCAN and K-means [12,13]. The features of error data and normal data were analyzed, but the data were not classified according to the analyzed features [12,13]. In addition, the above studies did not provide the number of data analyzed [9] or analyzed with a small number of error data [12].
In this study, an improved PdM system was developed to predict the point of failure of the wafer transfer robot to prevent equipment failure and to inform inspection for maintenance. In this experiment, after the robot arm loads the wafer, the robot rotates 180 degrees clockwise, then rotates the arm 90 degrees clockwise to unload the wafer and returns to its original position in one cycle. By operating the equipment, 562 data sets were acquired from the sensors installed in the wafer transfer robot, and error data were generated for each equipment failure stage to obtain data necessary for training such as equipment status and failure. By applying the K-means algorithm to these data, the features of the data are extracted. A neural network model was constructed using the features of normal data and error data. Unlike the existing studies, the developed system was designed to be able to classify and detect errors on its own, not by humans, using the model learned from the data itself, rather than based on numerical standards set by humans.
3. Method
3.1. Equipment Setup
In this experiment, data were acquired using a wafer transfer robot, RR732, by Rorze System (Hukushima, Japan). After setting the robot, a three-axis acceleration sensor (ADXL335) was installed at the top of the equipment handler to gather the acceleration data of the moving arm. This sensor obtained data according to the movement of the robot arm [16,17]. In addition, a weather-proof ultrasonic sensor (DFRobot (Shanghai, China)) and a camera were installed in order to exclude the occurrence of errors except for the errors set in this experiment. The ultrasonic sensor measures the position of the starting point and the end point of the arm and verifies the camera photo image data to determine the unintended abnormal movement of the robot.
Figure 1 shows the wafer transfer robot and the equipment setting for this experiment. The data acquisition code was written using Python 3.5 version, and the model was trained and tested using a desktop computer equipped with Intel Core i5-8500 CPU and NVIDIA GeFORCE GTX 1060 6 GB GPU.
3.2. Data Acquisition Method
A total of 562 data sets were acquired using the acceleration sensor. These 562 data sets are the results of excluding unintentional abnormal data using ultrasonic sensor and camera data. One data set consists of three axes (x, y, z) with 968 data on each axis.
3.3. Data Preprocessing
Data obtained from the acceleration sensor are expressed as output voltage values, and these voltage values were converted to acceleration values [16,17,18]. To understand the characteristics of the transformed data, all three-axis (x, y, z) time domain data were transformed into the frequency domain using Fast Fourier Transformation (FFT). Since the ranges of magnitude of the converted three-axis frequency domain data are different, data were normalized by x. The normalization formula is as follows.
Since the FFT delivers a signal that is symmetric around zero, only a positive frequency from 0 to 483 data (484 data) are analyzed in this paper. After investigating the characteristics of each datum by plotting on the three axes of x, y, and z, it was confirmed that the characteristics of the x-axis data were clearly distinct.
As shown in Figure 2a, most of the values of the x-axis data have values less than 0.4 and have a peak value only near a particular frequency. Figure 2b shows the frequency domain data plot of the y-axis. In Figure 2b, there were many large values in the frequency domain, but no prominent values to show noticeable characteristics.
Figure 2c is the z-axis data. In Figure 2c, the magnitude of the frequency is between 0.2 and 0.4 in most frequency domains. Since the difference in values is not large enough, there is no distinct characteristic.
For the above reasons, it is difficult to extract features from data on the y-axis and z-axis, so features are extracted and analyzed from data on the x-axis. In the x-axis data, data with values less than 0.4 show no special characteristics. Therefore, values less than 0.4 among the preprocessed data were treated as noise and removed.
3.4. Error Data Generation
Since error data cannot be obtained before an error occurs in the actual equipment, virtual error data were created and used for system modeling. The error data were generated based on Fluke’s vibration signal-based anomaly signal detection study, which manufactures and sells industrial instruments worldwide [19]. The error data consisted of a total of three levels. Normal data are pre-processed data on the x-axis of acceleration data acquired from normally operating equipment. The 3rd error data were defined as data generated by the faulty equipment. The 2nd error data were defined as the data just before the failure, and the 1st error data were defined as the data when the equipment started to malfunction. Normal data are the data when the equipment is operating normally, and 1st, 2nd, and 3rd error data are set to occur sequentially when the failure begins.
According to Fluke’s study, the magnitude of the low frequency increases in the early stage of equipment failure [19]. Based on that study, after filtering the normal data in Figure 2, the 1st error data as shown in Figure 3a were generated. If there is an error in the equipment, the error data are highly likely to follow a normal distribution, so the 1st error data are set to have a threshold value or higher by adding a normal distribution with a peak to a specific low frequency [12].
In the 2nd error data, the values of errors generated in the 1st error data were increased and the range was increased. In addition, as shown in Figure 3b, it is designed to generate abnormal signals in other frequency domains. As with the 1st error, the error values were set to follow a normal distribution
The 3rd error data are designed so that the magnitude increases very significantly throughout the frequency. As shown in Figure 3c, it has a magnitude that exceeds the threshold value of 0.4 at most frequencies. Abnormal signals are generated due to frequent shocks and vibrations inside the wafer transfer robot, which means the equipment is in abnormal state or failure [12]. To prevent the failure of the robot, it is necessary to predict the failure of the equipment in the 2nd error state, which is the stage before the 3rd error is generated.
3.5. Clustering
In this experiment, the K-means algorithm was applied to each datum to find the characteristics of the error data in each of three levels and normal data. The K-means algorithm is an algorithm that groups the given data into k clusters. When this algorithm receives n objects, it is divided into k groups that are less than or equal to n, and each group forms a cluster. In other words, the data are grouped into k groups of one or more data objects. To achieve optimal clusters, the variance in the distance difference between each cluster and the data within that cluster must be minimized [20]. In this process, the similarity between data in the same cluster increases, and the similarity with data in other clusters decreases [20,21,22]. This is expressed in the following Equation (2).
In the equation, means each cluster, is the center point of the cluster, and is the data of each cluster.
Before applying the K-means algorithm, the user must set the k value in advance. Since the performance of the algorithm greatly differs depending on the value of k, it is important to select an appropriate value [20,21,22].
In this study, the K-means algorithm is applied to each data set and the results are analyzed to extract the characteristics of the classification. For K-means, since the k value affects the performance of the algorithm, it is important to select optimal k value that can extract the features for each classification in this study. To find the optimal value of k, the center points were compared by applying K-means to the data from k = 2 to k = 4. As a result, when the value of k is 4, that is, when divided into four clusters, it was confirmed that the characteristics of the normal data and each error data were distinguished well. Additionally, as mentioned earlier, the location of the center point of each cluster, which is set randomly, is also important, so in this study, the initial center points were set so that they spread appropriately without being too close to each other.
To extract key features of the data, 100 data were randomly selected from each type of data (normal data, 1st, 2nd, and 3rd error data). The K-means (k = 4) algorithm was applied to each data and the center points of four clusters were identified.
Figure 4a shows the center points of the four clusters obtained by applying the K-means algorithm to the randomly selected 100 normal datasets. Additionally, Figure 4b–d show the centroids of four clusters obtained by applying the K-means algorithm to the randomly selected 100 1st, 2nd, and 3rd error datasets.
Figure 4a–d show that each data type has a different distribution of center points. Based on this, to clearly confirm the characteristics of each data type, the distribution of all central points for each type were investigated.
Most of the normal data (85%) have the same distribution as shown in Figure 5a. The four center points were present in the frequency index near the early 300, differing only in size. As shown in Figure 5b, there were cases where the center point of one cluster fell at a lower frequency. This is the second most common aspect with a probability of about 10 percent. There are also exceptional distributions that do not apply to the above two cases. In addition, for normal data, there were cases where the number of data above 0.4 was less than four, so the number of clusters was two to three.
After analyzing the center points of the normal data, changes in position in the center points of the data with errors were confirmed. The 1st error data were clustered with K-means (k = 4) and the center point was investigated.
Most of the 1st-order error data have the characteristics shown in Figure 6a. There is one cluster at frequencies near 300 and three clusters at low frequencies. As shown in Figure 6b, there were also cases where there were two center points in the frequencies closest to 300 and two center points in the frequencies lower than that.
After the analysis of 1st-order error data, the distribution of the center point of the 2nd-order error data was analyzed.
The center points of the 2nd-order error data are evenly distributed over all frequencies. The distribution of approximately 98% is shown in Figure 7a,b. The center point with the highest frequency appears near frequency 300 or frequencies between 200 and 300.
Finally, the results of the 3rd-order error data were analyzed, and the distribution of the central points is shown in Figure 8.
The 3rd-order error data can be regarded as equipment failure. Since they have a value of 0.4 or higher at almost all frequencies, the center points are widespread as shown in Figure 8. The difference from the 2nd-order error data is that the 3rd-order error data have a center point close to 400 at a frequency, far exceeding 300.
Figure 5, Figure 6, Figure 7 and Figure 8 show that there are differences in the distribution of center points among normal data and 1st-/2nd-/3rd-order error data. However, in all types of data, there was also 1–2% distribution of exceptional center points that were not in the case above. For example, Figure 9 is the 2nd-order error data, but the distribution of the center points is the same as Figure 6a of the 1st-order error data. Since this problem exists in all data types, an appropriate modeling method for accurate classification is required.
3.6. Modeling
Through the clustering process, the characteristics of each state were obtained. These features make it very difficult to establish standards for classification, and there is a high possibility that errors may be included in determining whether a piece of equipment is malfunctioning. To solve this problem, in this study, a neural network model that trains and classifies normal data and error data was developed.
To apply the data to the neural network, the pairs of orthogonal coordinates of four center points obtained during clustering were rearranged in ascending order of x value. ((, ), (, ), (, ), (, )). In this expression, x1 is the smallest x value and x4 is the largest x value. A neural network model was designed to take these eight values as input and classify normal data, 1st-, 2nd-, and 3rd-order error data as output.
Figure 10 shows the structure of the neural network designed in this study. It consists of an input layer, five hidden layers, and an output layer, and the five hidden layers consist of 8, 10, 12, 10, and 8 neurons. Feed-forward error-backpropagation algorithm is used for training, and the Sigmoid function is used as an activation function in each neuron.
The model was trained and evaluated using randomly selected 800 train data, 200 validation data, and 400 test data. Each data type is selected at the same rate. A neural network model was trained using the selected training data. Dropout was not included, and a learning rate was set to 0.01 to train the model. To obtain optimal training parameters, the Adam algorithm, which adaptively adjusts parameters, was used to optimize the parameters. The cross-entropy error was used as the loss function, and the neural network model was trained to minimize it.
Equation (3) is the formula used to calculate the cross entropy, where is the value of the correct answer and is the result of the neural network. In this model, hyper-parameters were selected randomly, and the experiment was repeated by slightly modifying the values to increase the validation data accuracy.
4. Results and Discussion
To verify the performance of the trained model, data randomly selected from data not used as training data were used as test data. A total of 400 data were used to calculate the accuracy of the model by randomly selecting 100 each evaluation data in four data groups.
To verify the accuracy performance of the trained model, the evaluation process was repeated five times.
Table 1 shows the accuracy results of five runs of the experiment using different test data. In all experimental results, the accuracies are over 97%. The lowest accuracy is 97%, the highest accuracy is 97.5%, and the average accuracy of the five runs is 97.25%.
A confusion matrix was calculated to confirm the performance of data classification using the fifth experiment data with 97.5% accuracy.
Table 2 shows the accuracy of the actual and predicted data of the experiment. Although the normal data and the first-order error data do not show much difference by visual inspection, this experiment confirmed that the normal data and the first-order error data can be distinguished with 1–2% error. In addition, it was confirmed that normal data, first-, second-, and third-order error data can be classified with less than 4% error. Since the sensor data obtained in this experiment do not always show the same pattern and there are data that deviate from the general characteristics, there is a possibility that a slight classification error may occur.
In this experiment, equipment with third-order error data showed failures. The main purpose of this research is to predict when the wafer transfer robot should be repaired before it breaks down and to develop a system that notifies that equipment maintenance is necessary when a second-order error occurs. Through Table 1 and Table 2, it was confirmed that the classification of normal data and first-, second-, and third-order error data can be accurately classified.
In a previous study [13], only the change in the center point of the cluster according to the equipment error was detected. However, in this study, it was possible to determine whether the equipment was in a normal state using the system itself or in the first-, second-, or third-order error states by tracking the change in the center point of the cluster with an accuracy of at least 97%.
5. Conclusions and Future Works
In this study, a PdM system was developed to identify the characteristics of the sensor data from a wafer transfer robot using the K-means algorithm and to diagnose the robot’s abnormal state through a neural network model. As a result of training the designed model and evaluating the classification result, an accuracy of over 97% was obtained. Additionally, it was confirmed that the normal data and first-order error data that started to appear abnormal could be classified with high accuracy. By using this system to accurately predict the condition of equipment and to perform maintenance before failure of equipment occurs, the cost of unnecessary equipment inspections in the semiconductor process can be reduced. Moreover, it shows that the system itself works well with the function of predicting the possibility of an error and notifying about maintenance time, which is one of the main purposes of this study. The function of detection and notification of equipment errors on its own, not by humans, is very important, and this is an important difference from previous studies. This system can be applied to various fields that use sensor data beyond the semiconductor manufacturing area and will make it possible to predict equipment failure.
There should be some future work conducted to extend this research. The neural network model was trained without a hyper-parameter optimization process in this study because the modeling process is not very complicated. However, to increase the learning efficiency and to prevent overfitting and underfitting, studies to obtain optimal hyper-parameters are needed.
Additionally, since the prediction accuracy from the developed neural network model was tested on the data collected prior to the experiment, the process of testing with real-time data is required too. Moreover, better results can be obtained if the algorithm is modified after obtaining and analyzing the actual error data. Although this paper focused on the development of the PdM algorithm for detecting equipment errors, a method for inferencing the cause of such errors will need to be developed. Furthermore, research on how to deal with complex pattern data and an algorithm that accurately analyzes not only the x-axis but also the y- and z-axis data will be studied.
All raw data and Python codes used in this paper can be downloaded from [23].
Author Contributions
Conceptualization, S.-S.H.; methodology, S.-S.H. and Y.-K.P.; software, J.-H.Y. and Y.-K.P.; validation, J.-H.Y., Y.-K.P. and S.-S.H.; formal analysis, J.-H.Y.; investigation, S.-S.H.; resources, S.-S.H., Y.-K.P. and J.-H.Y.; data curation, J.-H.Y.; writing—original draft preparation, J.-H.Y.; writing—review and editing, J.-H.Y. and S.-S.H.; visualization, J.-H.Y.; supervision, S.-S.H.; project administration, S.-S.H.; funding acquisition, S.-S.H. All authors have read and agreed to the published version of the manuscript.
Funding
This research was supported by Basic Science Research Program through the National Research Foundation of Korea (NRF) funded by the Ministry of Education (No. 2017R1D1A1B03029991).
Institutional Review Board Statement
This study did not require ethical approval.
Data Availability Statement
https://github.com/YJH-jm/WaferRobotFaultDetection.git, accessed on 16 March 2022.
Conflicts of Interest
The authors declare no conflict of interest.
References
- Amruthnath, N.; Gupta, T. A Research Study on Unsupervised Machine Learning Algorithms for Early Fault Detection in Predictive Maintenance. In Proceedings of the 2018 5th International Conference on Industrial Engineering and Applications, Singapore, 26–28 April 2018; pp. 355–361. [Google Scholar]
- William, T. 5 Use Cases for Predictive Maintenance and Big Data. Available online: https://blogs.oracle.com/bigdata/post/5-use-cases-for-predictive-maintenance-and-big-data (accessed on 13 August 2020).
- Borgi, T.; Hidri, A.; Neef, B.; Naceur, M.S. Data Analytics for Predictive Maintenance of Industrial Robots. In Proceedings of the 2017 International Conference on Advanced Systems and Electric Technologies (IC_ASET), Hammamet, Tunisia, 14–17 January 2017; pp. 412–417. [Google Scholar]
- Carvalho, T.P.; Soares, F.A.A.M.N.; Vita, R.; Francisco, R.D.P.; Basto, J.P.; Alcala, S.G.S. A systematic literature review of machine learning methods applied to predictive maintenance. Comput. Ind. Eng. 2019, 137, 106024. [Google Scholar] [CrossRef]
- Amruthnath, N.; Gupta, T. Fault Class Prediction in Unsupervised Learning using Model-Based Clustering Approach. In Proceedings of the 2018 International Conference on Information and Computer Technologies, DeKalb, IL, USA, 23–25 March 2018; pp. 5–12. [Google Scholar]
- Adam, C. Oil Analysis Saves You Money, but How Much? Available online: https://web.archive.org/web/20171003234014/http://learnoilanalysis.com/oil-analysis-saves-you-money-but-how-much (accessed on 13 August 2020).
- Fan, S.K.S.; Hsu, C.Y.; Tsai, D.M.; He, F.; Cheng, C.C. Data-Driven Approach for Fault Detection and Diagnostic in Semiconductor Manufacturing. IEEE Trans. Autom. Sci. Eng. 2020, 17, 1925–1936. [Google Scholar] [CrossRef]
- Wang, J.; Zhang, J. Big data analytics for forecasting cycle time in semiconductor wafer fabrication system. Int. J. Prod. Res. 2016, 54, 7231–7244. [Google Scholar] [CrossRef]
- Moyne, J.; Iskandar, J. Big data analytics for smart manufacturing: Case studies in semiconductor manufacturing. Processes 2017, 5, 39. [Google Scholar] [CrossRef] [Green Version]
- Moyne, J.; Armacost, M. Big Data Analytics Applied to Semiconductor Manufacturing. In Proceedings of the Big Data Analytics 2017-Topical Conference at the 2017 AIChE Spring Meeting and 13th Global Congress on Process Safety, San Antonio, TX, USA, 26–30 March 2017; pp. 142–143. [Google Scholar]
- Iskandar, J.; Moyne, J.; Subrahmanyam, K.; Hawkins, P.; Armacost, M. Predictive Maintenance in Semiconductor Manufacturing. In Proceedings of the 26th Annual SEMI Advanced Semiconductor Manufacturing Conference (ASMC), Saratoga Springs, NY, USA, 3–6 May 2015; pp. 384–389. [Google Scholar] [CrossRef]
- Yoon, H.S.; Han, S.S. Clustering Parameter Optimization of Predictive Maintenance Algorithm for Semiconductor Equipment Using One-way Factorial Design. In Proceedings of the International Conference on Control, Automation and Systems, Beijing, China, 19–22 April 2019; Volume 2019, pp. 1219–1221. [Google Scholar]
- Kim, H.G.; Yoon, H.S.; Yoo, J.H.; Yoon, H.I.L.; Han, S.S. Development of Predictive Maintenance Technology for Wafer Transfer Robot using Clustering Algorithm. In Proceedings of the ICEIC 2019-International Conference on Electronics, Information, and Communication, Auckland, New Zealand, 22–25 January 2019; pp. 1–4. [Google Scholar]
- Song, K.T.; Ou, S.Q.; Yang, C.A.; Sun, Y.X.; Kang, L.R.; Wang, Z.Y.; Wang, Y.S.; Lu, P.C.; Ko, C.L.; Chen, Y.H. Scheduling and control of a wafer transfer robot for foundry equipment innovation competition. Proc. IFAC-Pap. 2019, 52, 624–632. [Google Scholar] [CrossRef]
- Cheng, H.; Chen, H.; Mooring, B.W. Accuracy analysis of dynamic-wafer-handling robotic system in semiconductor manufacturing. IEEE Trans. Ind. Electron. 2014, 61, 1402–1410. [Google Scholar] [CrossRef]
- Analog Device Small, Low Power, 3-Axis Accelerometer (ADXL335). Available online: https://www.analog.com/media/en/technical-documentation/data-sheets/ADXL335.pdf (accessed on 12 August 2020).
- Manjiyani, Z.A.A.; Jacob, R.T.; Kumar, K.R.; Varghese, B. Development of MEMS Based 3-Axis Accelerometer for Hand Movement Monitoring. Int. J. Scinetific Res. Publ. 2014, 4, 2–5. [Google Scholar]
- Varanis, M.; Silva, A.L.; Mereles, A.G. On mechanical vibration analysis of a multi degree of freedom system based on arduino and MEMS accelerometers. Rev. Bras. Ensino Fis. 2018, 40, e1304. [Google Scholar] [CrossRef] [Green Version]
- Fluke. Understanding the Effects of Vibration Testing. Available online: https://www.e4ds.com/webinar_tech_dn.asp?idx=58 (accessed on 2 October 2020).
- Kanungo, T.; Mount, D.M.; Netanyahu, N.S.; Piatko, C.D.; Silverman, R.; Wu, A.Y. An efficient k-means clustering algorithms: Analysis and implementation. IEEE Trans. Pattern Anal. Mach. Intell. 2002, 24, 881–892. [Google Scholar] [CrossRef]
- Xu, D.; Tian, Y. A Comprehensive Survey of Clustering Algorithms. Ann. Data. Sci. 2015, 2, 165–193. [Google Scholar] [CrossRef] [Green Version]
- Bindra, K.; Mishra, A. A Detailed Study of Clustering Algorithms. In Proceedings of the 2017 6th International Conference on Reliability, Infocom Technologies and Optimization (Trends and Future Directions), (ICRITO), Noida, India, 20–22 September 2017; pp. 371–376. [Google Scholar]
- Available online: https://github.com/YJH-jm/WaferRobotFaultDetection.git (accessed on 16 March 2022).
Figure 1.
Wafer transfer robot and equipment setting for data acquisition.
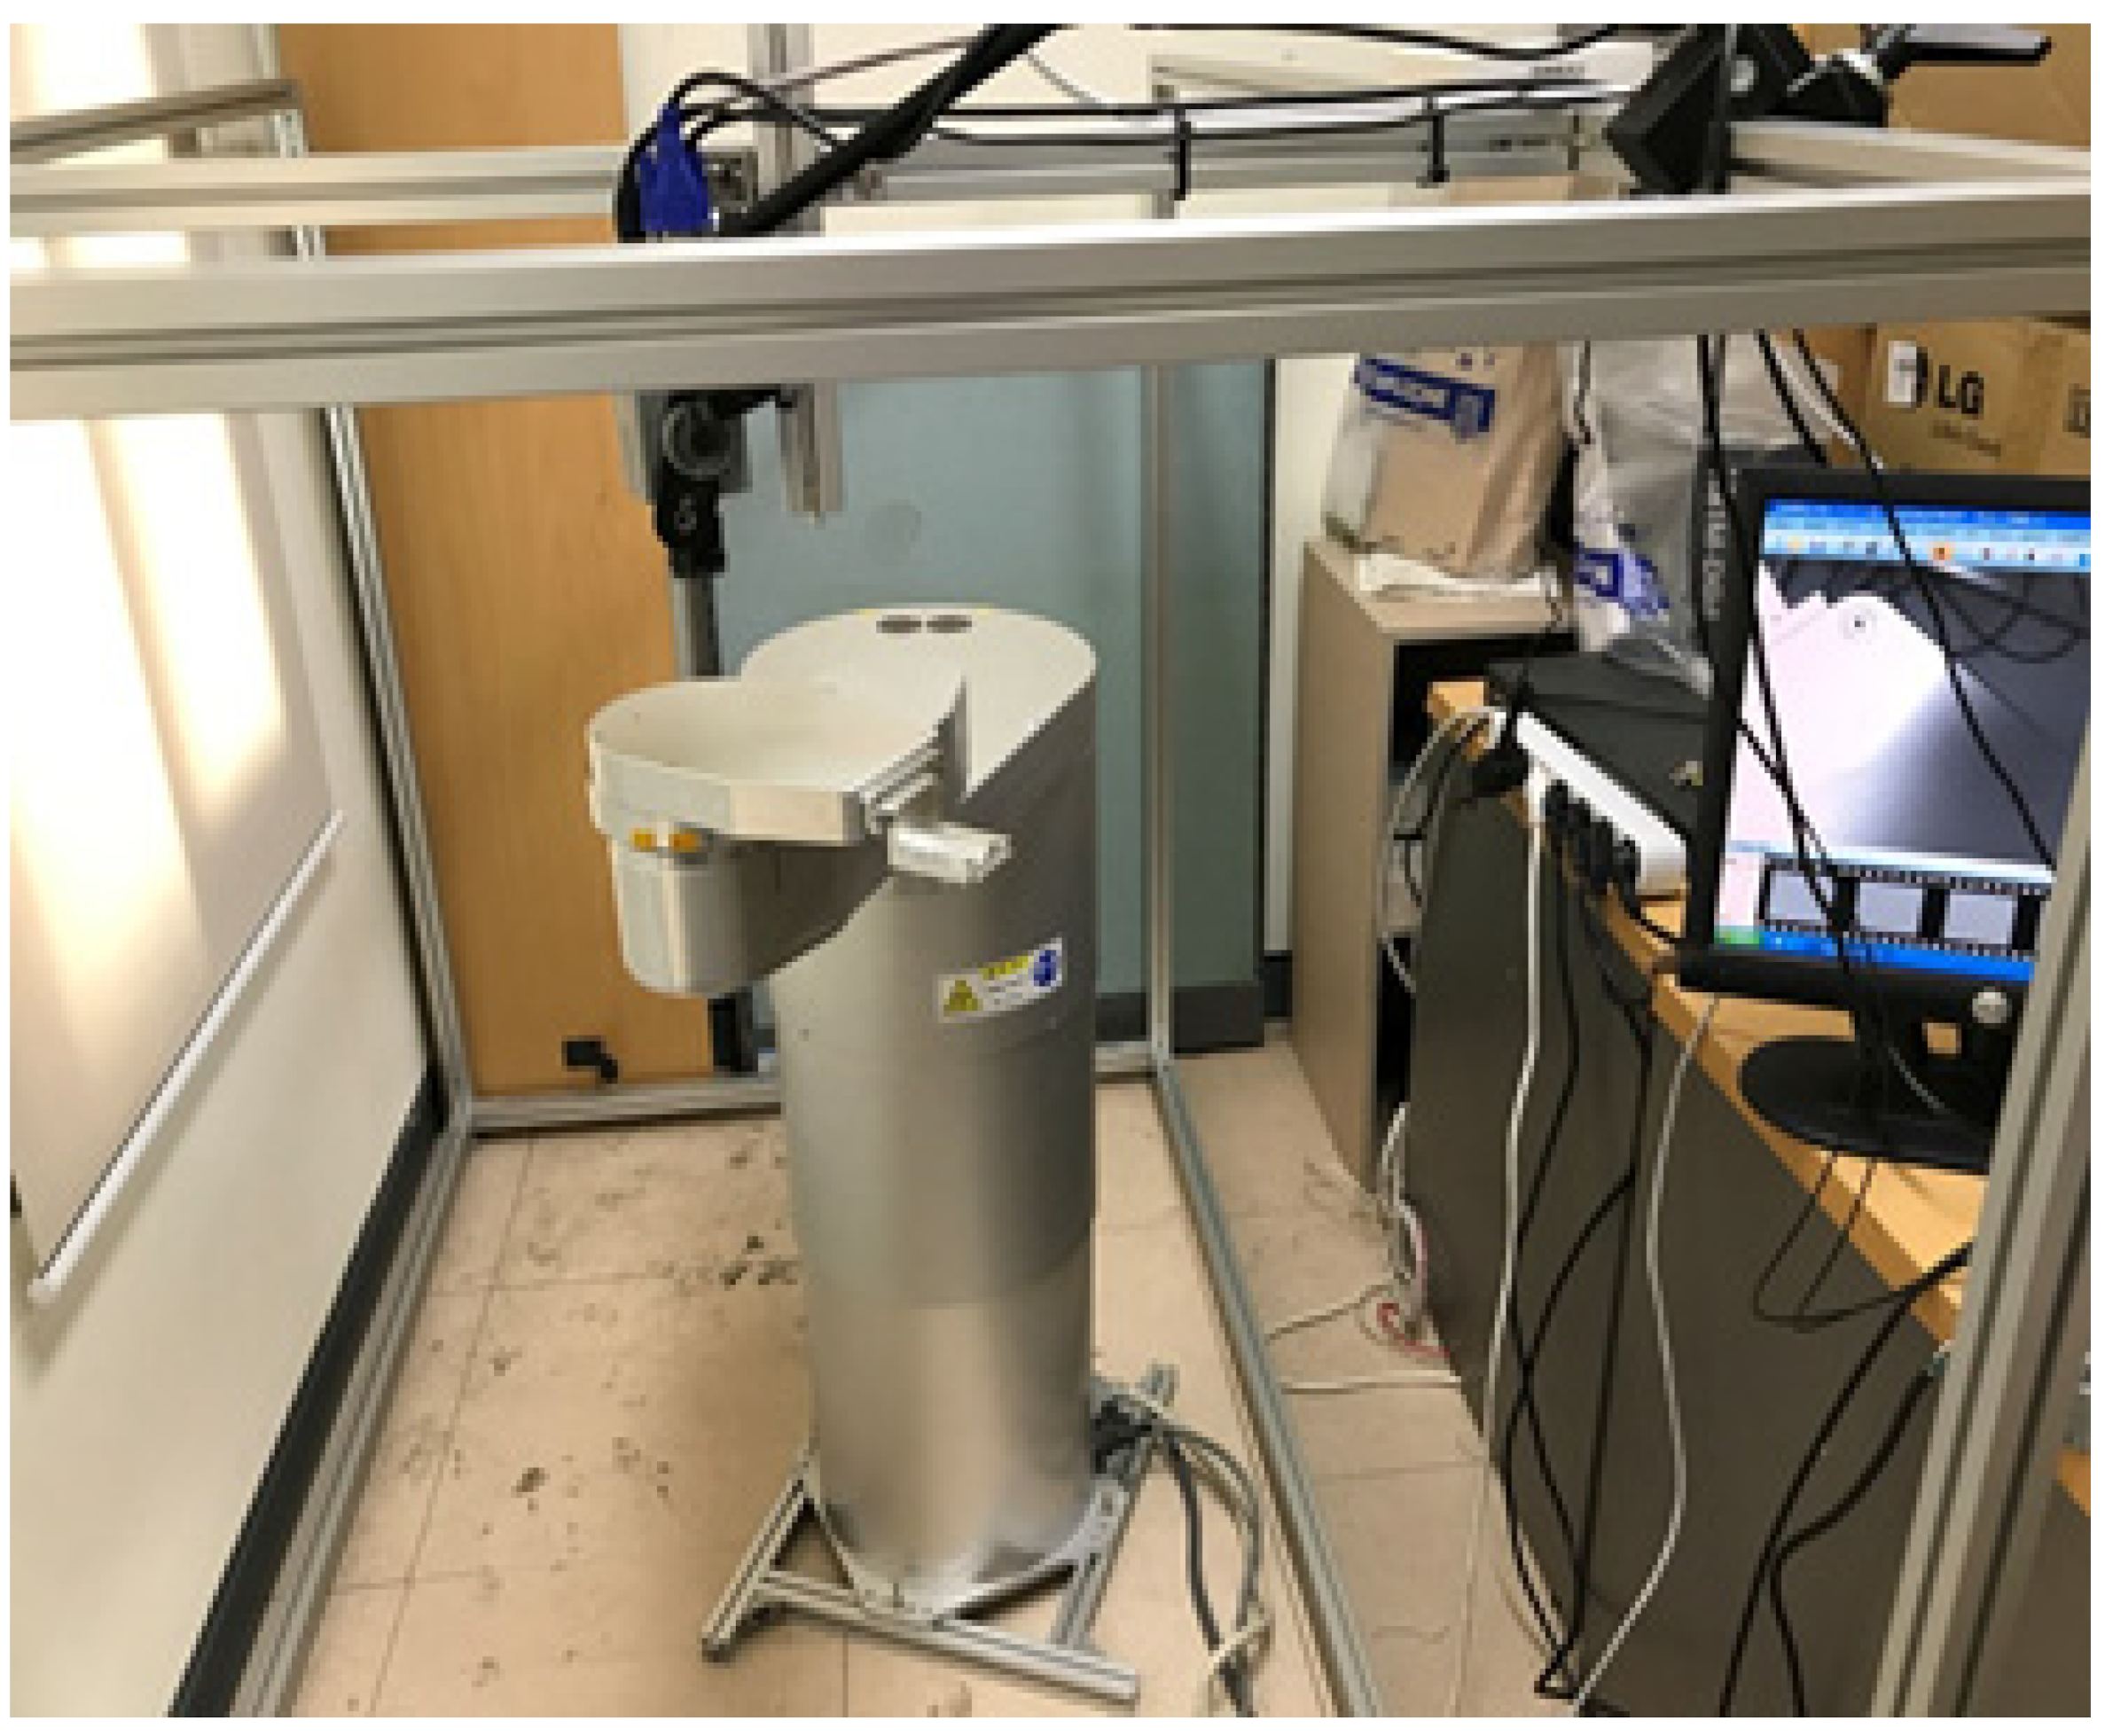
Figure 2.
Normalized FFT data. (a) Normalized FFT (x-axis data), (b) normalized FFT (y-axis data), and (c) normalized FFT (z-axis data).
Figure 2.
Normalized FFT data. (a) Normalized FFT (x-axis data), (b) normalized FFT (y-axis data), and (c) normalized FFT (z-axis data).
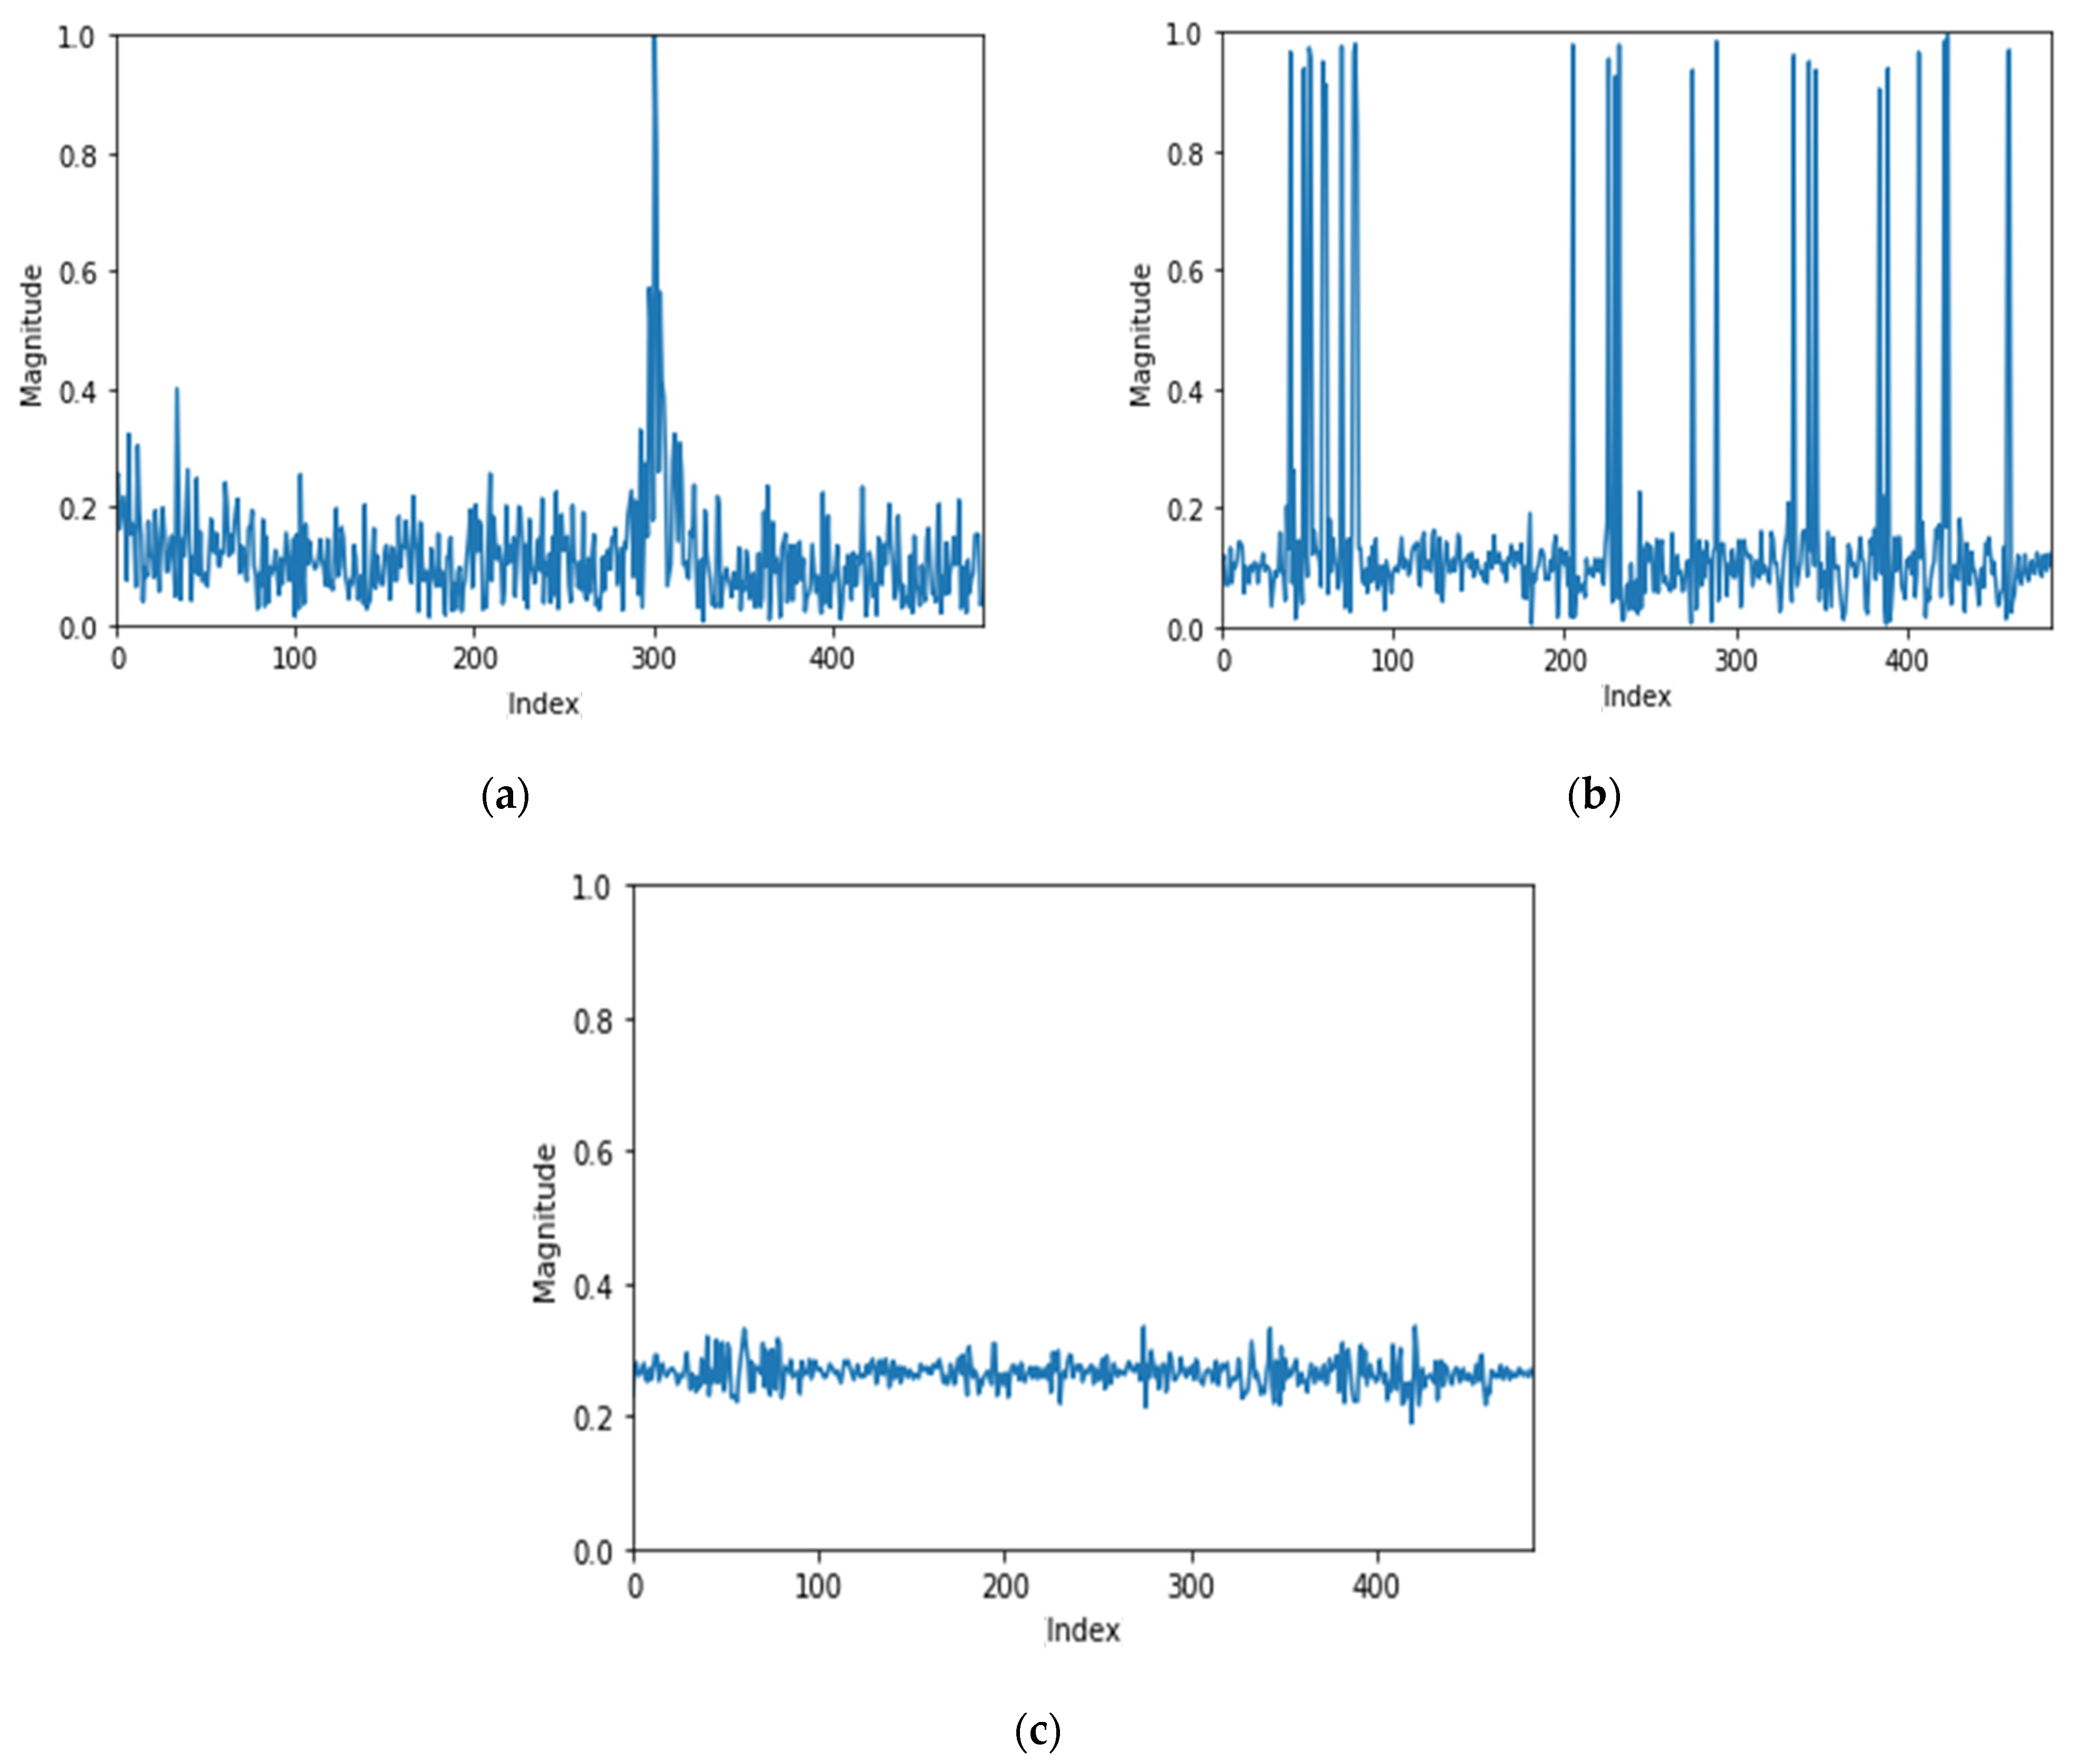
Figure 3.
Generated error data: (a) first-order error data, (b) second-order error data, and (c) third-order error data.
Figure 3.
Generated error data: (a) first-order error data, (b) second-order error data, and (c) third-order error data.
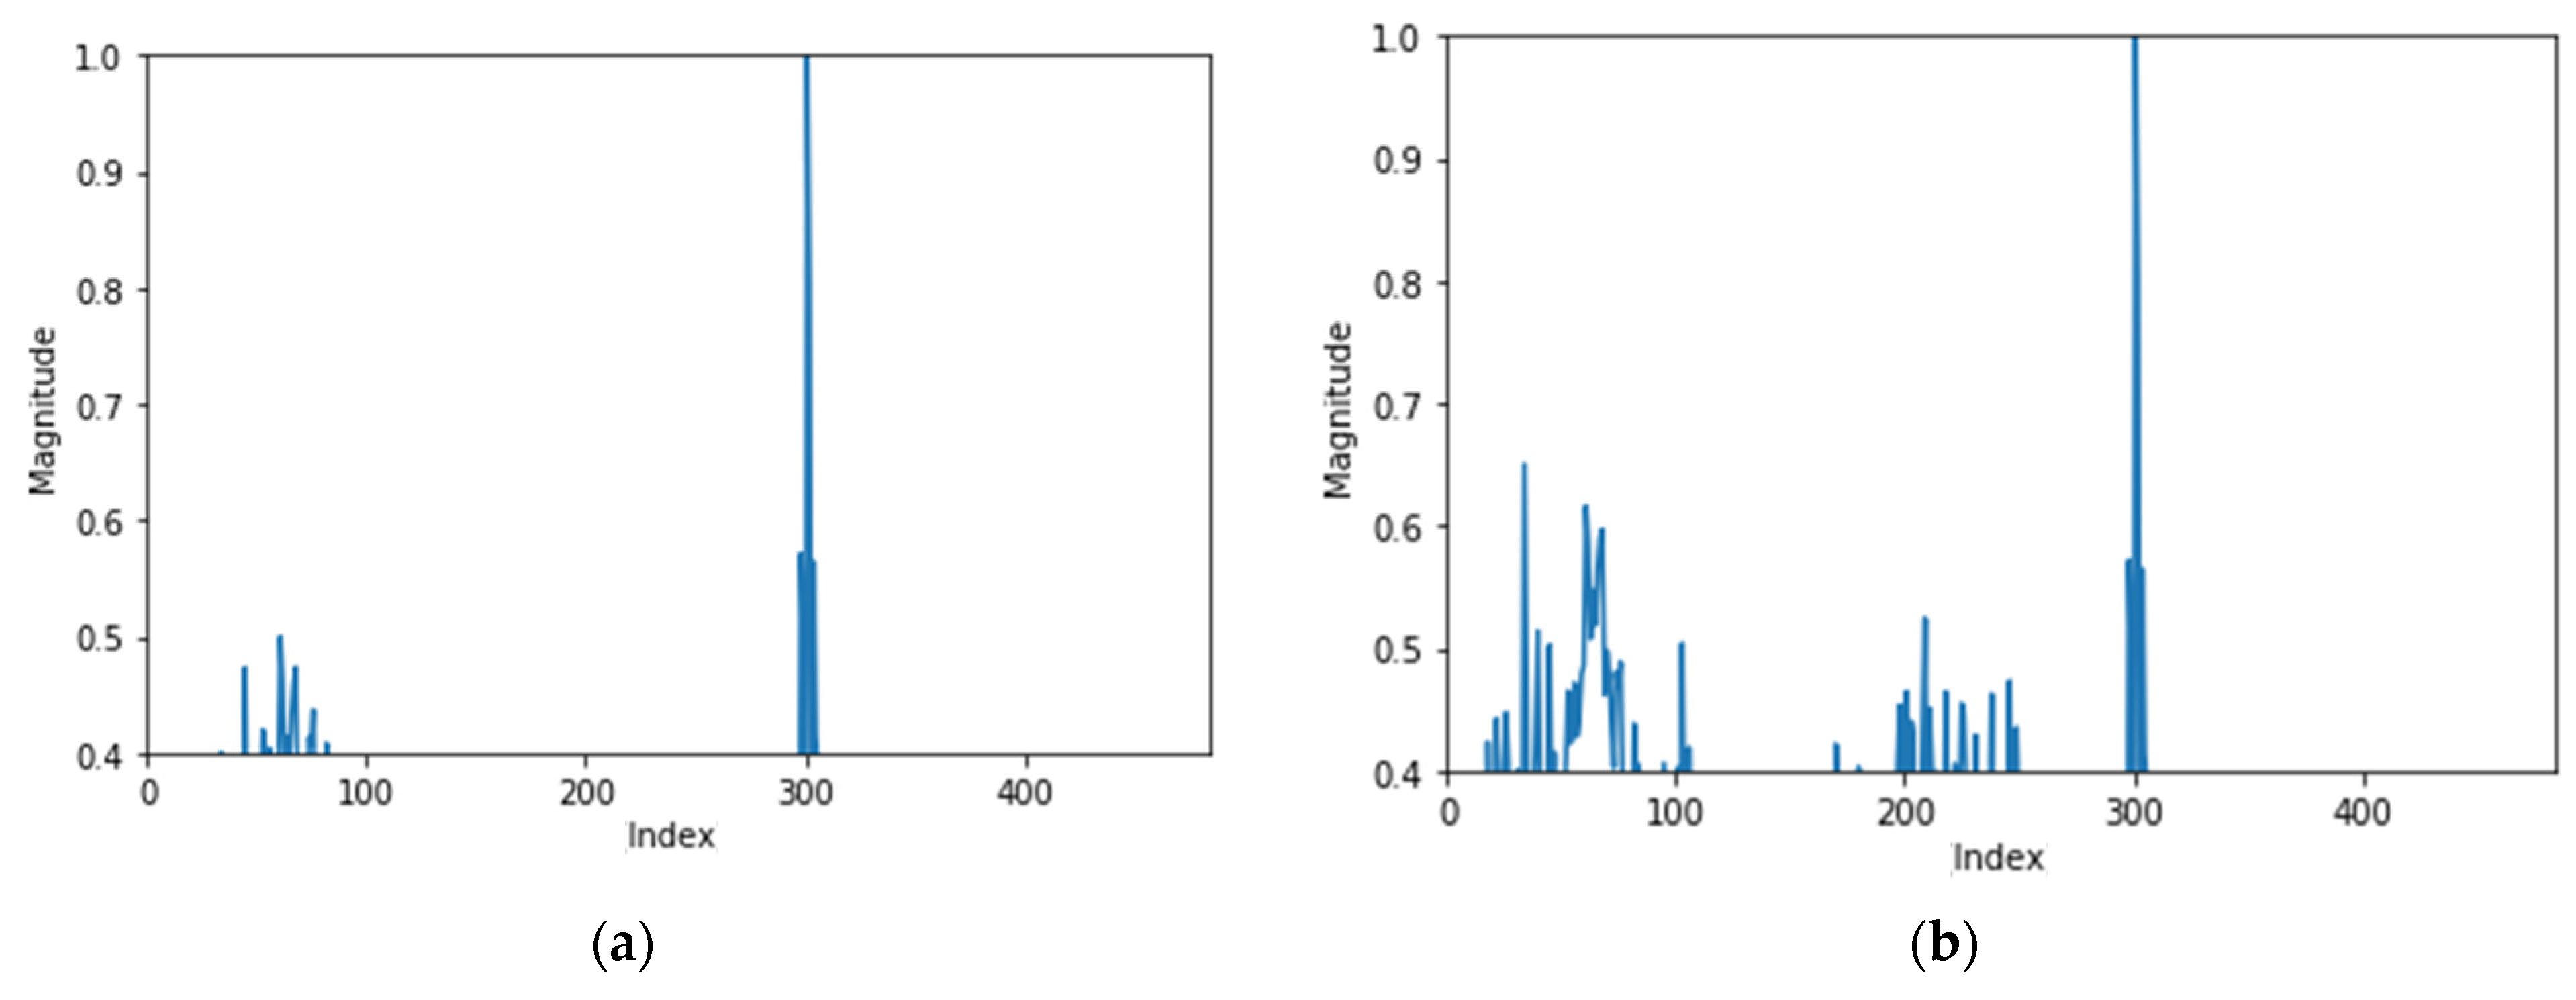

Figure 4.
Cluster center points of normal data set and error data sets. (a) Center points of normal data (100 sets), (b) center points of first-order error data (100 sets), (c) center points of second-order error data (100 sets), and (d) center points of third-order error data (100 sets).
Figure 4.
Cluster center points of normal data set and error data sets. (a) Center points of normal data (100 sets), (b) center points of first-order error data (100 sets), (c) center points of second-order error data (100 sets), and (d) center points of third-order error data (100 sets).
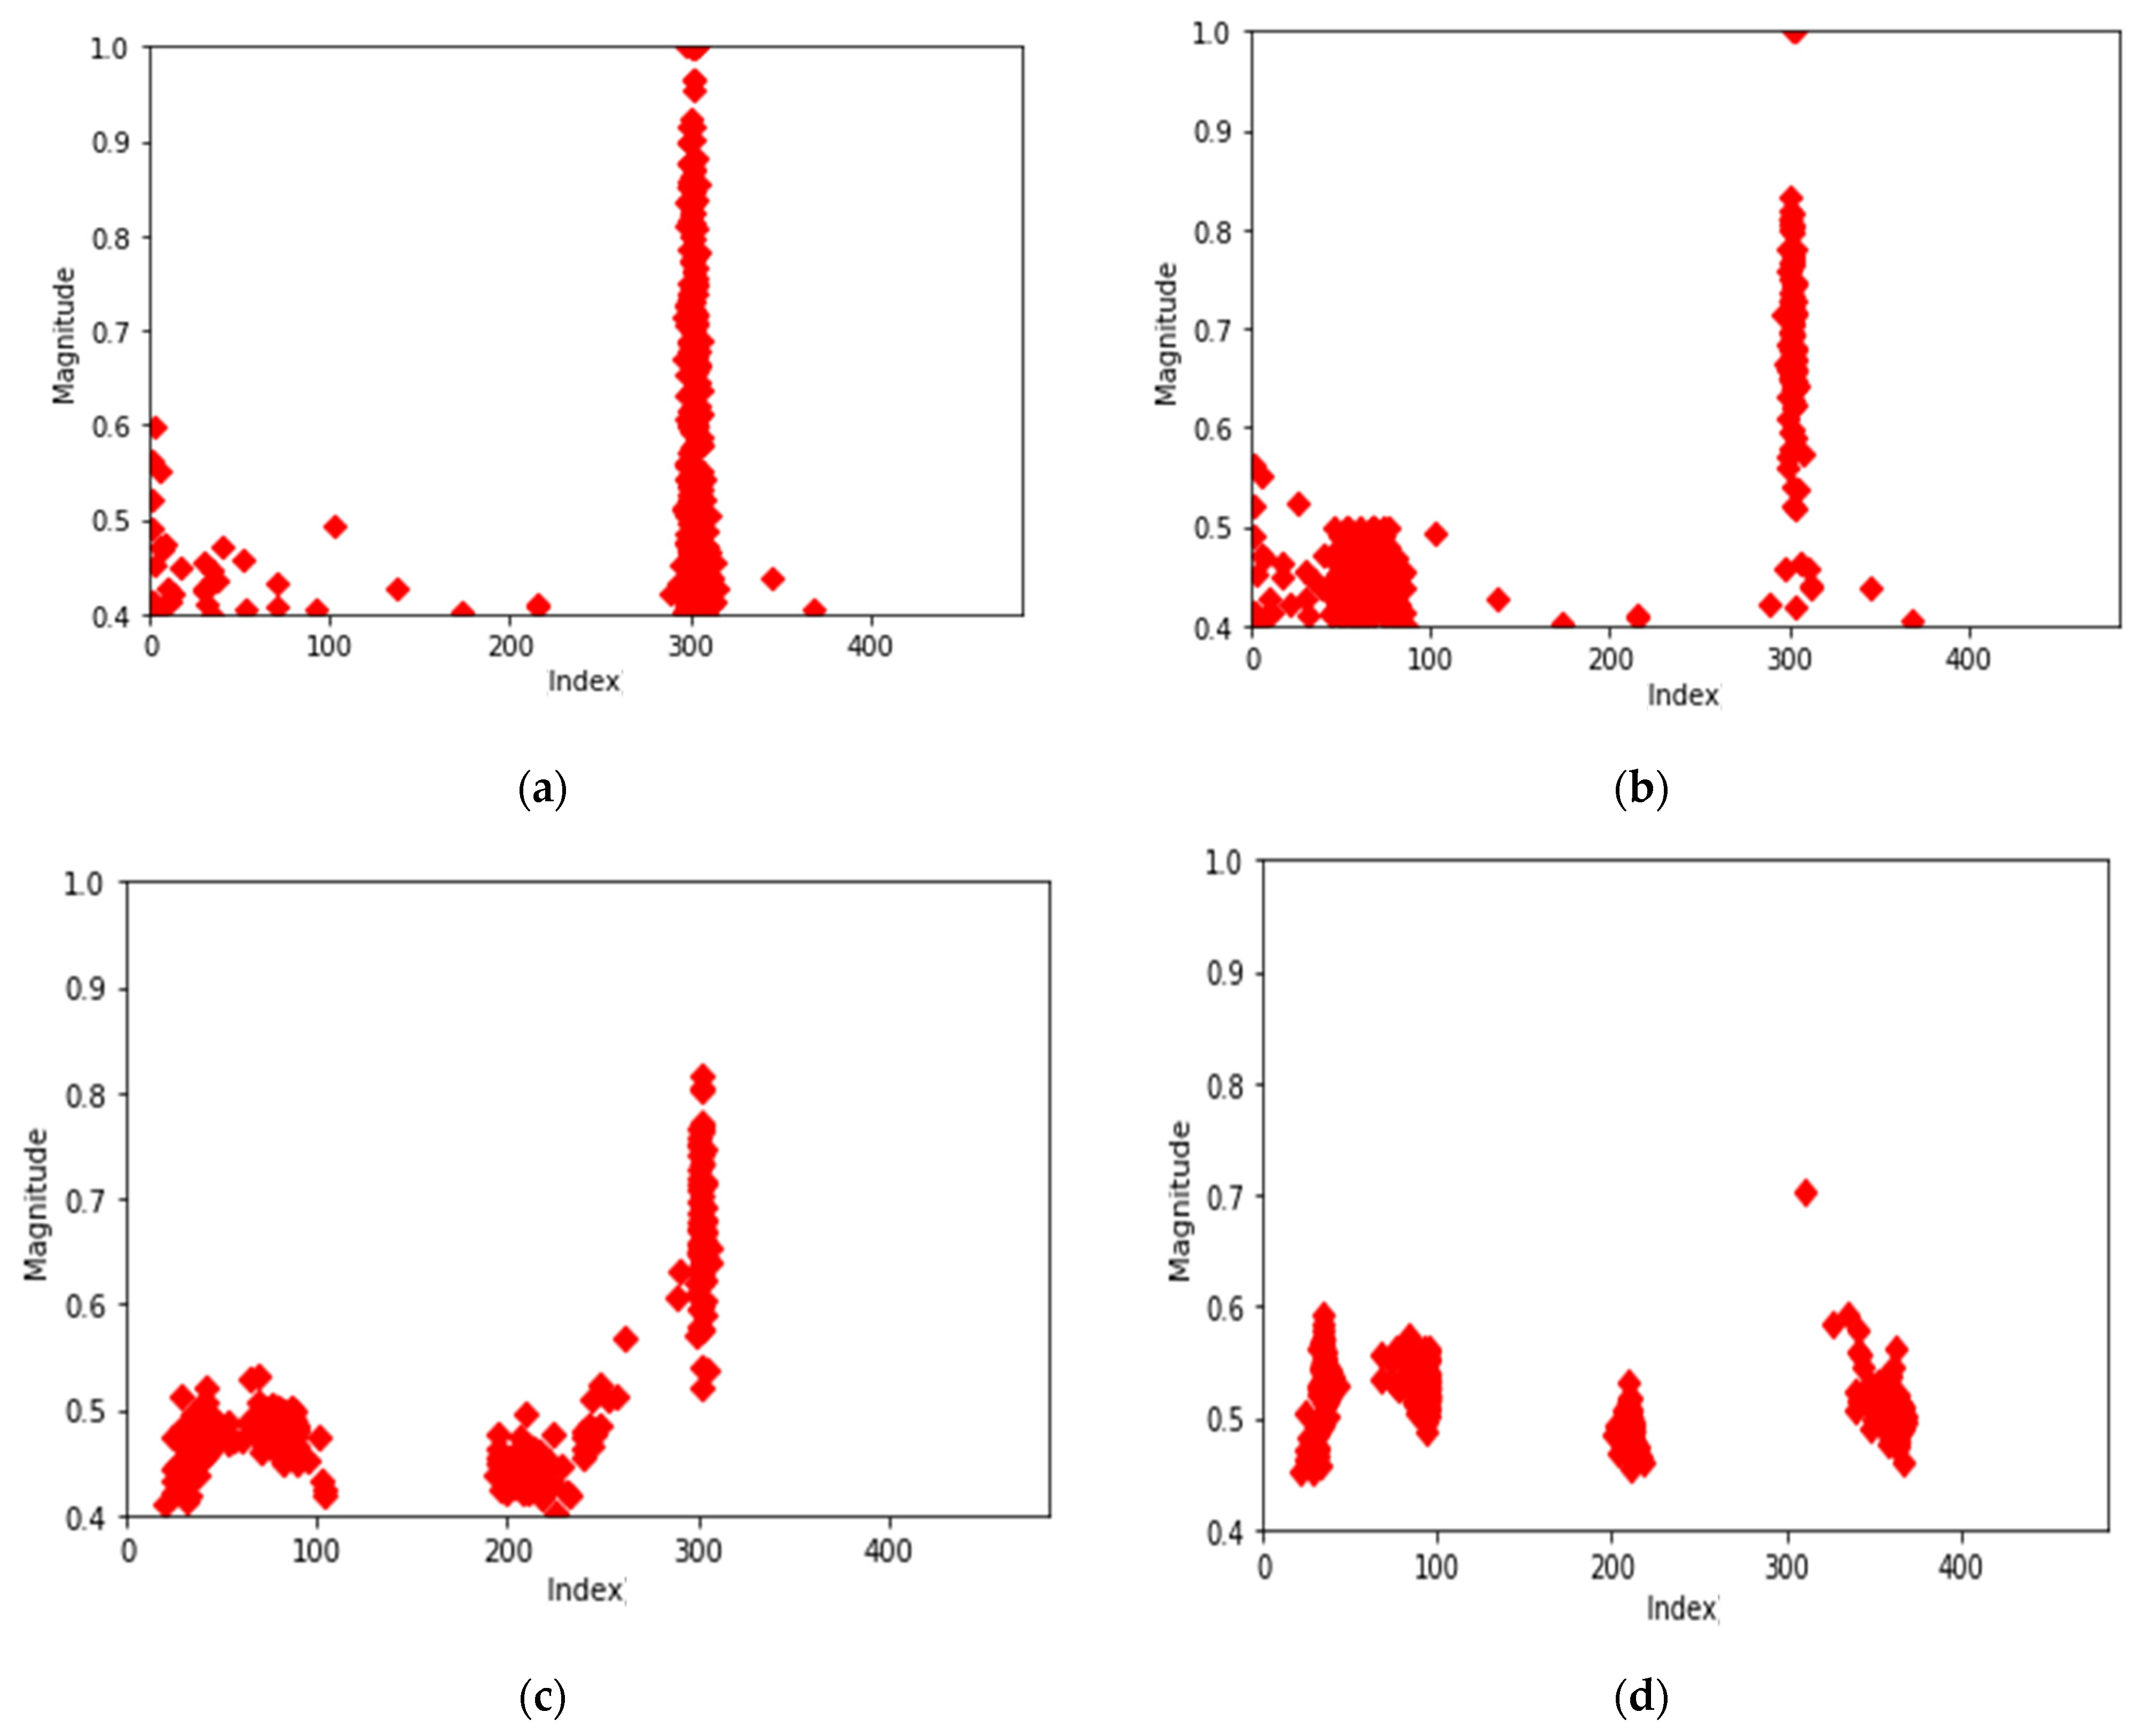
Figure 5.
Center points of two most common normal data. (a) Most common normal data; (b) second most common normal data.
Figure 5.
Center points of two most common normal data. (a) Most common normal data; (b) second most common normal data.

Figure 6.
Center points of two most common first-order error data. (a) Center points of first-order error data (most common data); (b) center points of first-order error data (second common data).
Figure 6.
Center points of two most common first-order error data. (a) Center points of first-order error data (most common data); (b) center points of first-order error data (second common data).
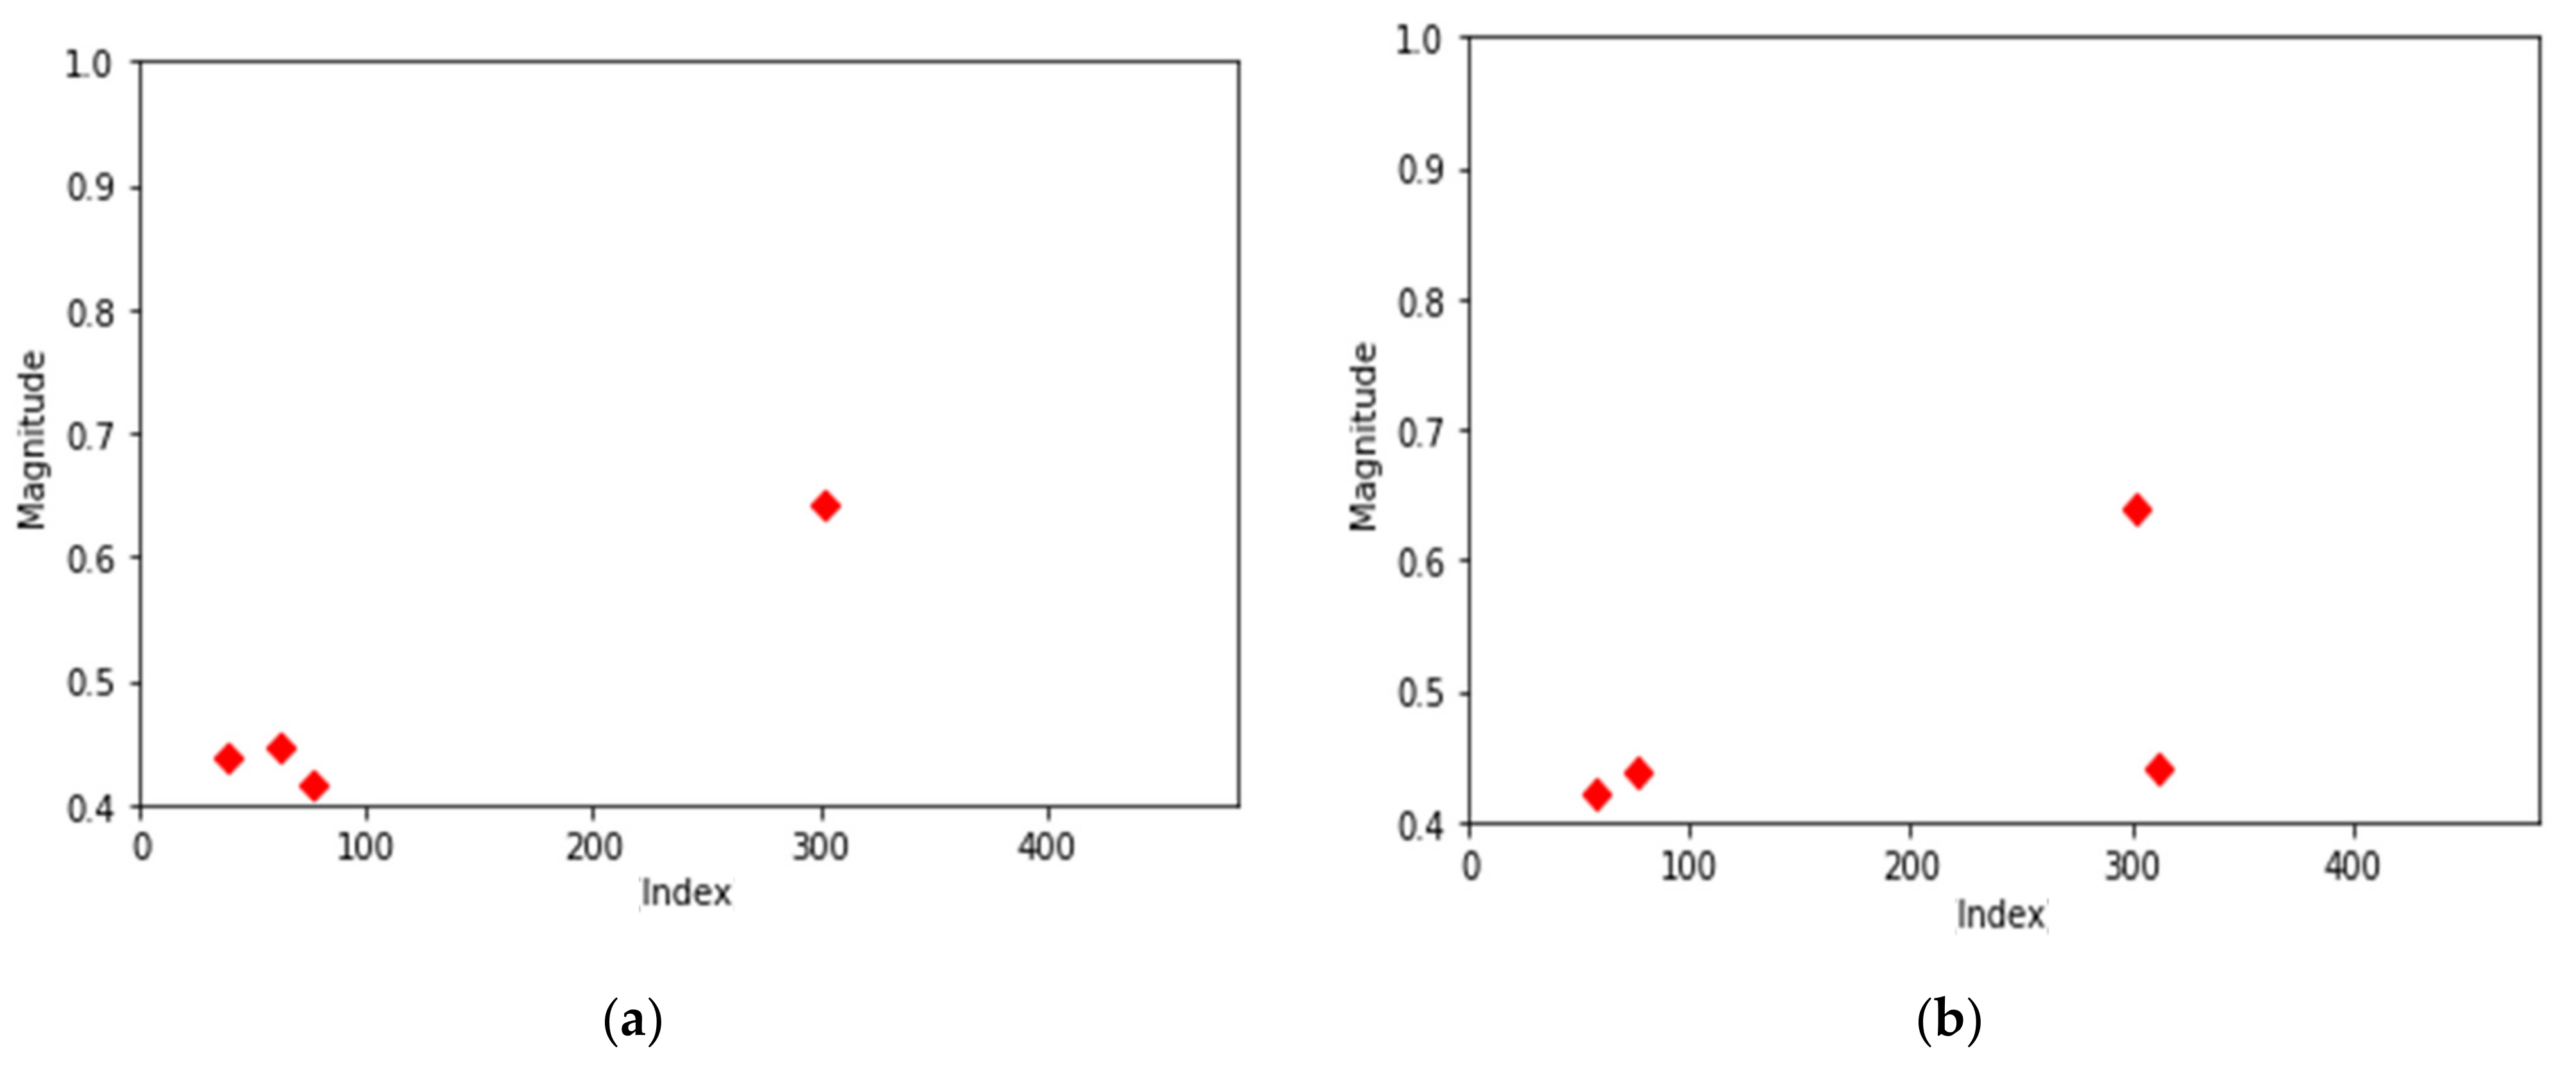
Figure 7.
Center points of two most common second-order error data. (a) Center points of second-order error data (most common data); (b) center points of second-order error data (second common data).
Figure 7.
Center points of two most common second-order error data. (a) Center points of second-order error data (most common data); (b) center points of second-order error data (second common data).
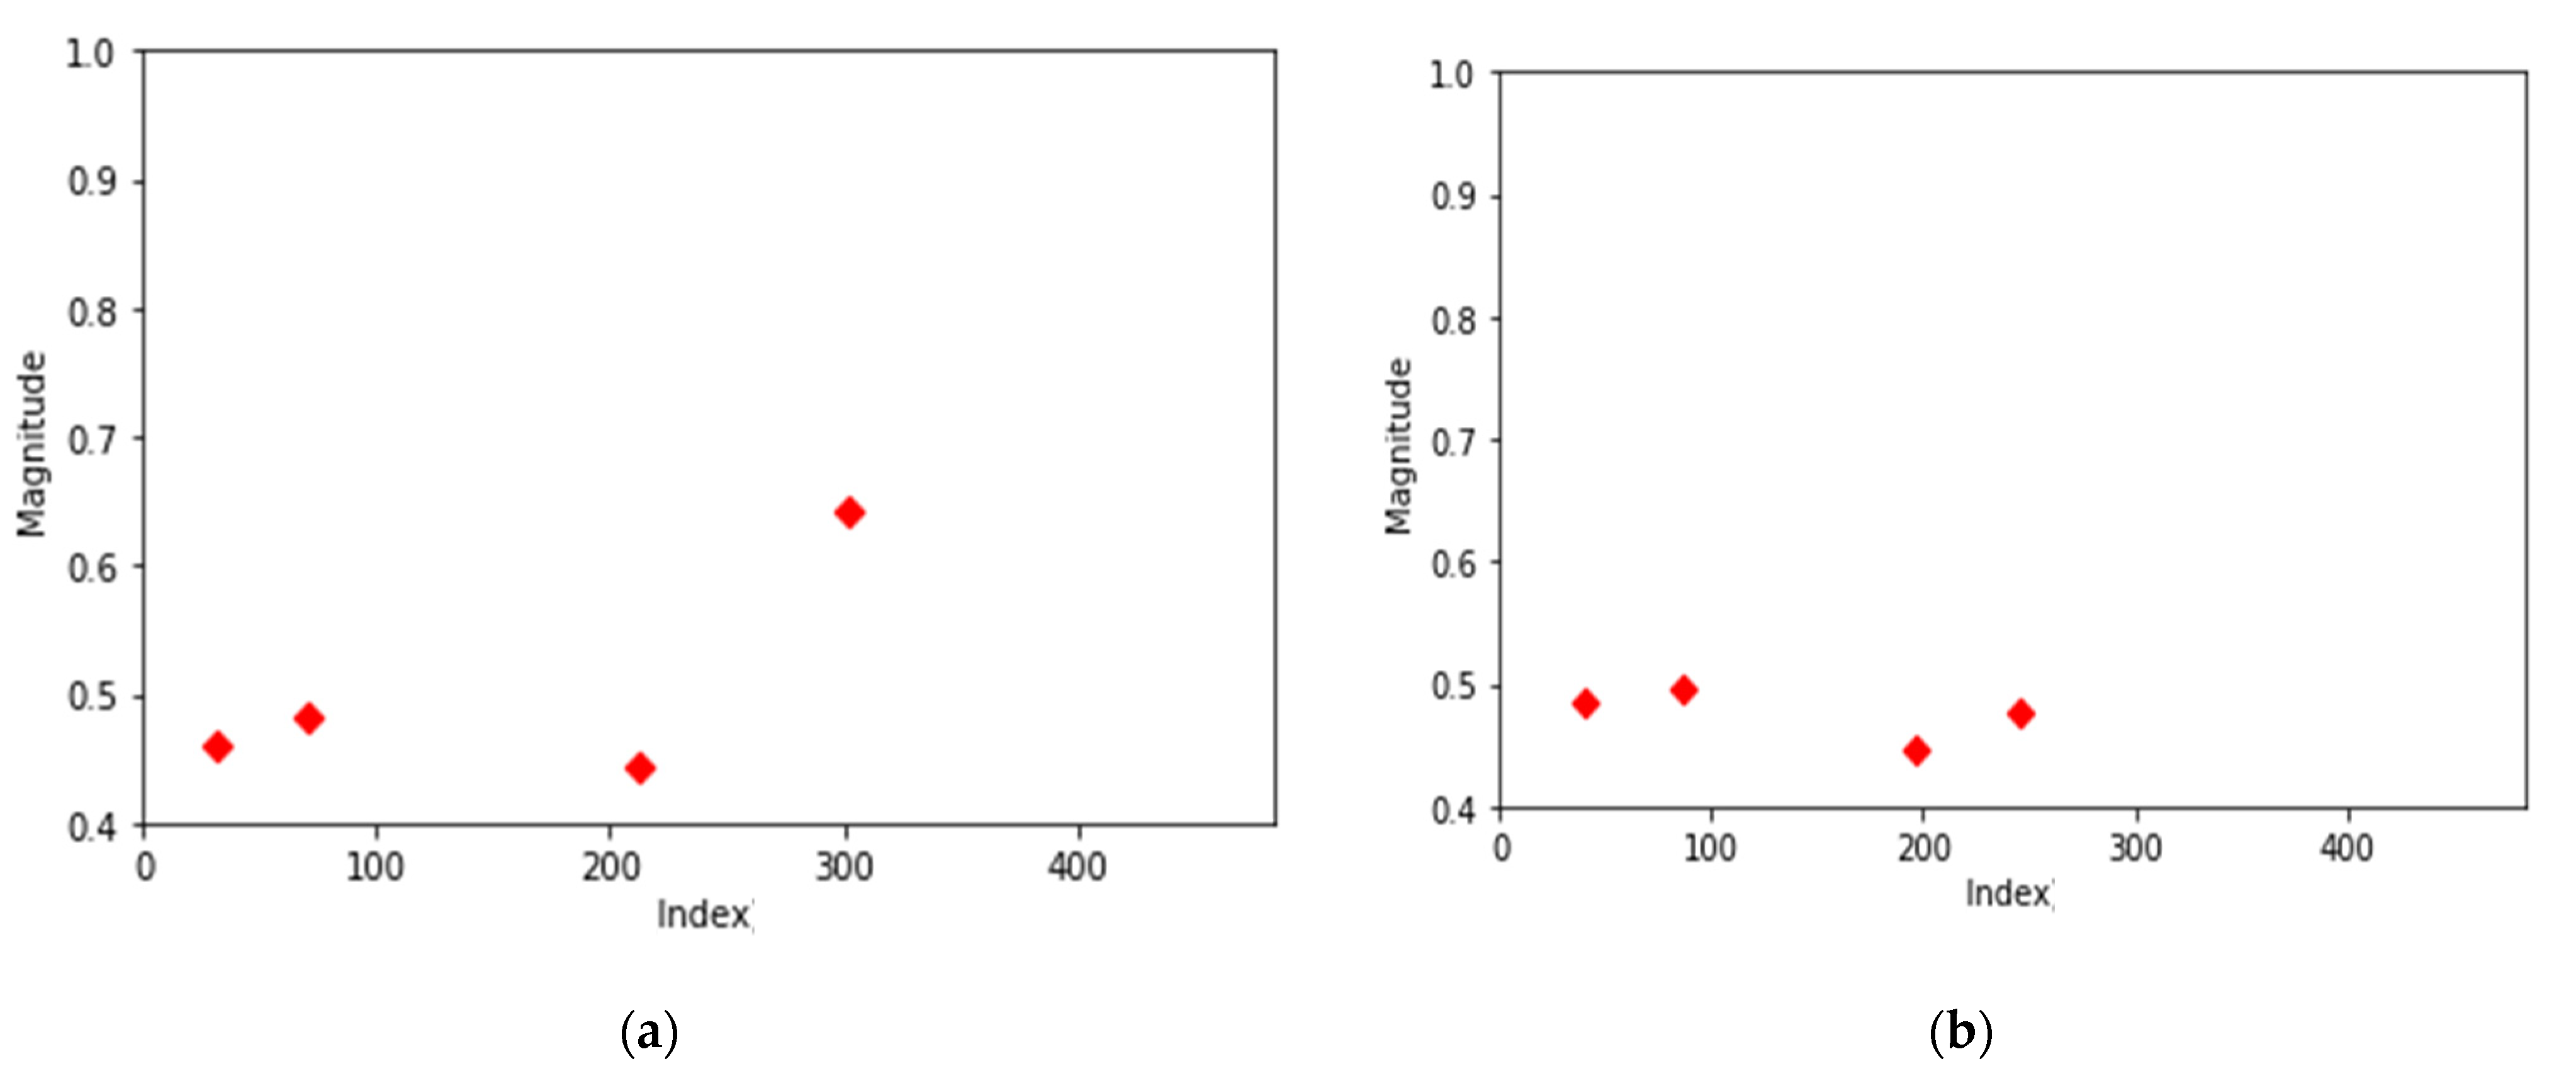
Figure 8.
Center points of third-order error data.
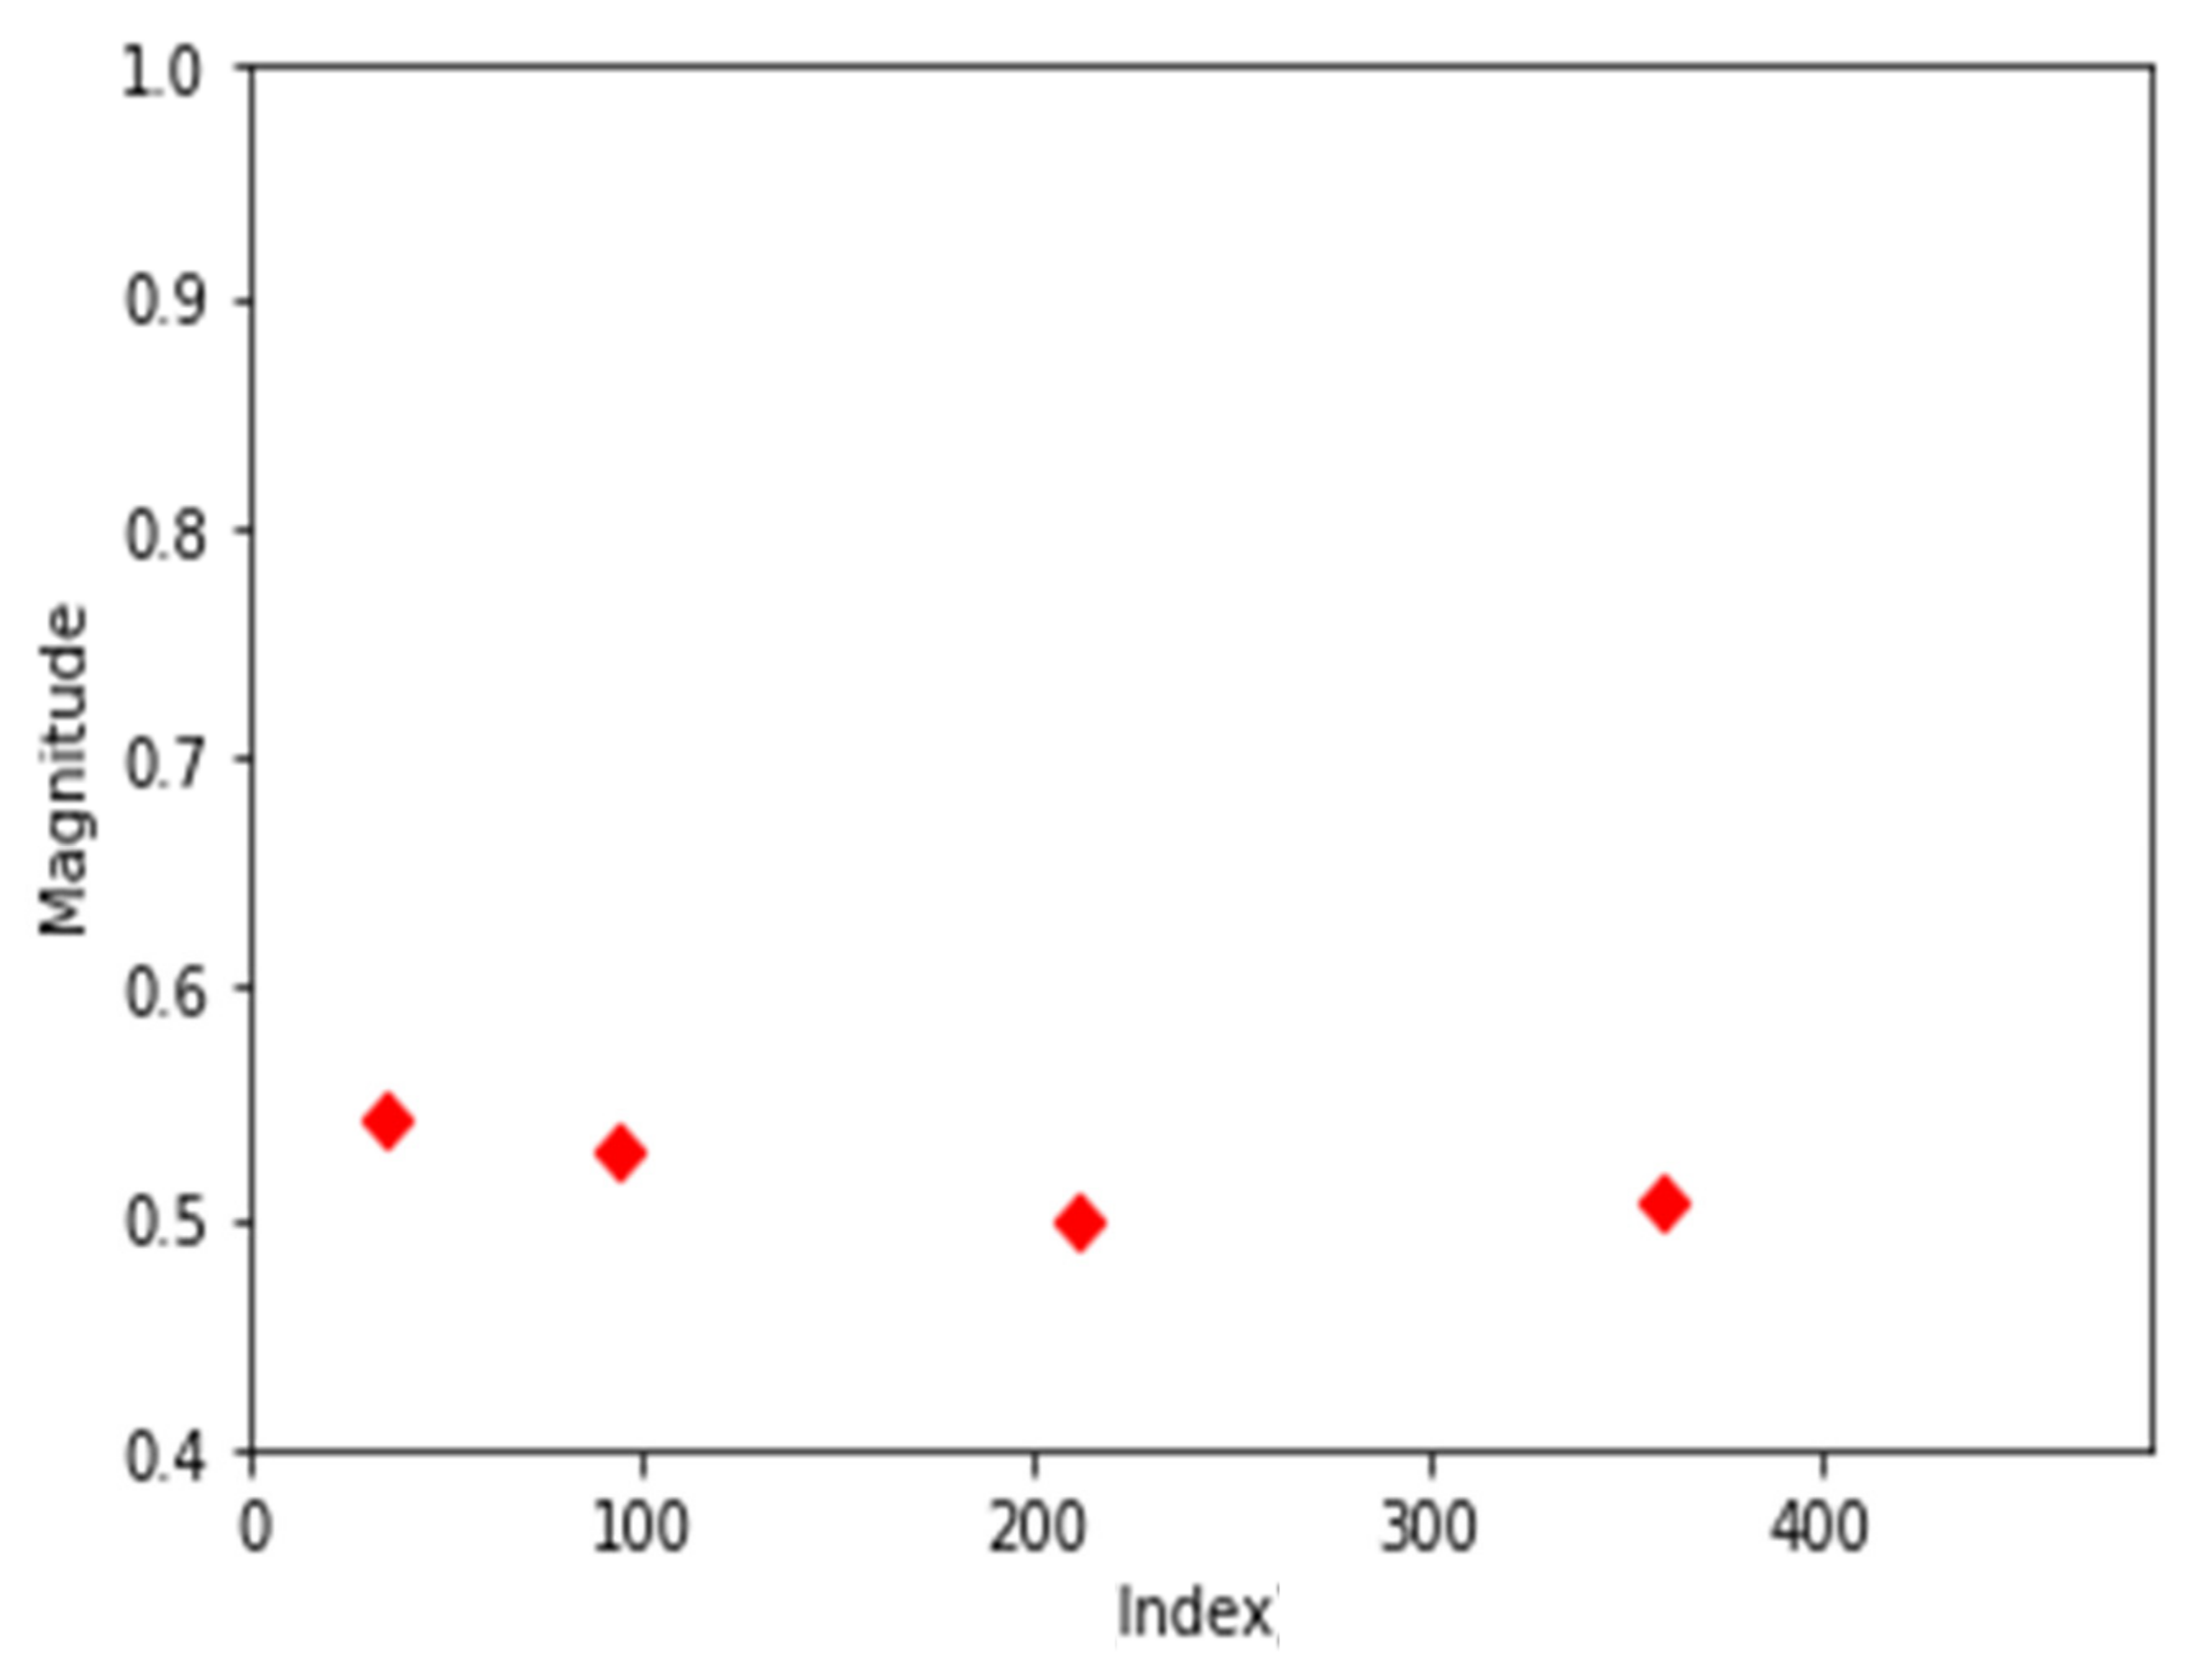
Figure 9.
Center points of second-order error data.
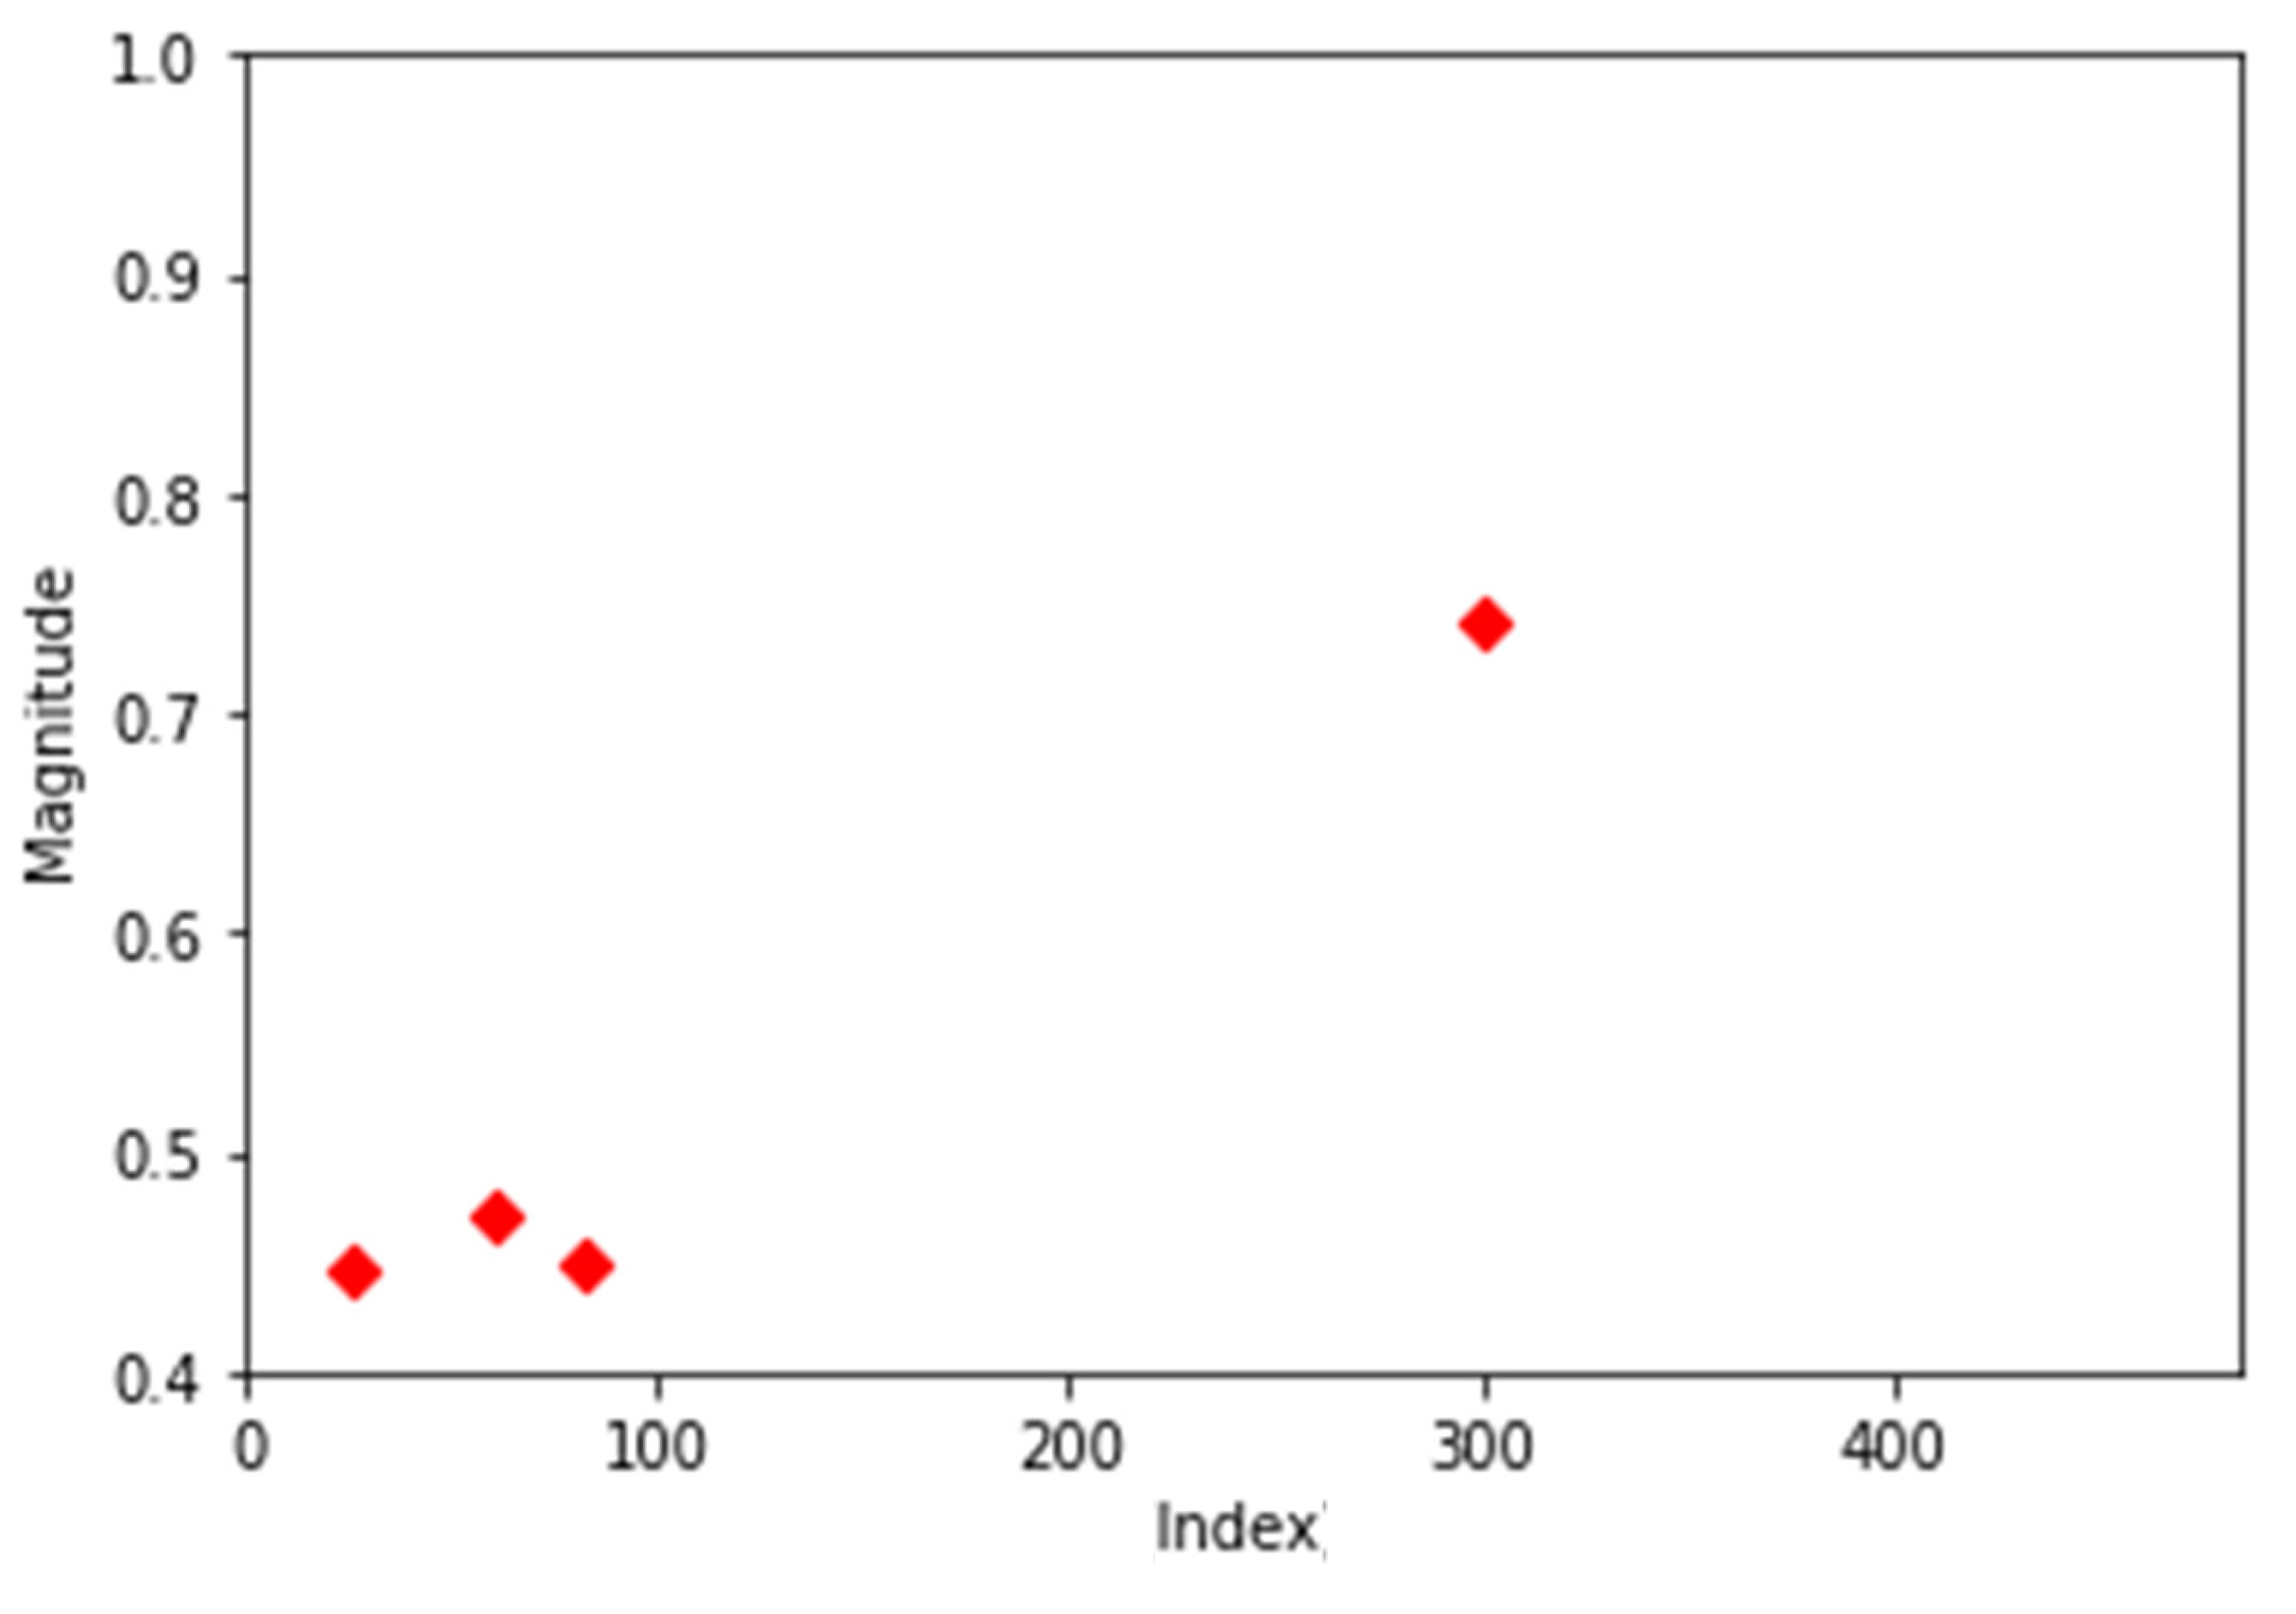
Figure 10.
Neural network structure.


Table 1.
The accuracy of model.
| Run | Accuracy (%) |
|---|---|
| 1 | 97.00 |
| 2 | 97.25 |
| 3 | 97.00 |
| 4 | 97.50 |
| 5 | 97.50 |
| Average | 97.25 |
Table 2.
Confusion matrix of the fifth experiment.
| Predicted | Normal | 1st Error | 2nd Error | 3rd Error | |
|---|---|---|---|---|---|
| Actual | |||||
| Normal | 96 | 2 | 1 | 1 | |
| 1st Error | 1 | 96 | 1 | 2 | |
| 2nd Error | 0 | 1 | 99 | 0 | |
| 3rd Error | 0 | 0 | 1 | 99 | |
Publisher’s Note: MDPI stays neutral with regard to jurisdictional claims in published maps and institutional affiliations. |
© 2022 by the authors. Licensee MDPI, Basel, Switzerland. This article is an open access article distributed under the terms and conditions of the Creative Commons Attribution (CC BY) license (https://creativecommons.org/licenses/by/4.0/).
Share and Cite
MDPI and ACS Style
Yoo, J.-H.; Park, Y.-K.; Han, S.-S. Predictive Maintenance System for Wafer Transport Robot Using K-Means Algorithm and Neural Network Model. Electronics 2022, 11, 1324. https://doi.org/10.3390/electronics11091324
AMA Style
Yoo J-H, Park Y-K, Han S-S. Predictive Maintenance System for Wafer Transport Robot Using K-Means Algorithm and Neural Network Model. Electronics. 2022; 11(9):1324. https://doi.org/10.3390/electronics11091324
Chicago/Turabian StyleYoo, Ji-Hyun, Young-Kook Park, and Seung-Soo Han. 2022. "Predictive Maintenance System for Wafer Transport Robot Using K-Means Algorithm and Neural Network Model" Electronics 11, no. 9: 1324. https://doi.org/10.3390/electronics11091324
Note that from the first issue of 2016, this journal uses article numbers instead of page numbers. See further details here.