


Explainable AI to Predict Male Fertility Using Extreme Gradient Boosting Algorithm with SMOTE

1
School of Automation, Banasthali Vidyapith, Banasthali 304022, India
2
Department of Physics, Banasthali Vidyapith, Banasthali 304022, India
3
Applied AI Research Lab, Department of Computer Science, University of South Dakota, Vermillion, SD 57069, USA
*
Author to whom correspondence should be addressed.
Electronics 2023, 12(1), 15; https://doi.org/10.3390/electronics12010015
Submission received: 21 November 2022
/
Revised: 13 December 2022
/
Accepted: 15 December 2022
/
Published: 21 December 2022
(This article belongs to the Special Issue Feature Papers in Computer Science & Engineering)
Abstract
:Infertility is a common problem across the world. Infertility distribution due to male factors ranges from 40% to 50%. Existing artificial intelligence (AI) systems are not often human interpretable. Further, clinicians are unaware of how data analytical tools make decisions, and as a result, they have limited exposure to healthcare. Using explainable AI tools makes AI systems transparent and traceable, enhancing users’ trust and confidence in decision-making. The main contribution of this study is to introduce an explainable model for investigating male fertility prediction. Nine features related to lifestyle and environmental factors are utilized to develop a male fertility prediction model. Five AI tools, namely support vector machine, adaptive boosting, conventional extreme gradient boost (XGB), random forest, and extra tree algorithms are deployed with a balanced and imbalanced dataset. To produce our model in a trustworthy way, an explainable AI is applied. The techniques are (1) local interpretable model-agnostic explanations (LIME) and (2) Shapley additive explanations (SHAP). Additionally, ELI5 is utilized to inspect the feature’s importance. Finally, XGB outperformed and obtained an AUC of 0.98, which is optimal compared to existing AI systems.
1. Introduction
Pregnancy is a natural process that succeeds within three months to the end of 1 year after conception [1]. In previous decades, couples failed to conceive due to impaired reproduction, singly or with a partner. The World Health Organization (WHO) suggested that about 48.5 million couples are affected by infertility, and 40 to 50 percent of cases occur due to male-related factors [2,3]. Environmental, occupational, and lifestyle factors are profound causes that may be the reason for increasing male infertility [4]. Key lifestyle factors include smoking, liquor intake, advanced paternal age, stress, food habit, caffeine consumption, mobile usage, and lack of sleep. These factors are easily modified and are the utmost reason for concern [5]. Several studies have been performed to examine the effects of these factors, and their negative impact may well be mostly overcome. Hence, more awareness and early prediction are potential solutions for male reproductive disorders.
AI systems have significantly contributed to different healthcare areas such as genetics, urology, radiology, oncology, and many more. Reproductive medicine is not different, where predictive systems are helpful for problem analysis [6,7]. However, the sheer volume of iterations and hyperparameters make AI systems challenging to evaluate and grasp. They are initially evaluated depending on their performance on the dataset under study, which must be more compelling for medical professionals and patients. As a result, it is restricted to the technical community. Because of this, we refer to such tools as ‘black boxes’ regardless of their performance quality compared to decision-making processes used in a medical setting. In other words, without medical implications, trust does not exist [8,9]. Due to these reasons, AI systems need to be comprehensible and interpretable to analyze data and make judgments that would enhance patient care [10,11]. With the help of these systems, we can enhance our ability to discover new biological phenomena [12,13].
In the last few decades, various studies have used different types of data, either image or behavioral/lifestyle, and environmental factors. For example, Ma et al. [14] recently performed a study to develop a model for predicting seminal quality where data balancing and classification were a prime concern. The ESLSMOTE approach is used to handle data balancing along with BPNN, ADA, and SVM classifiers. The maximum accuracy of 97% was reported (using ADA). Yibre and Kocer [15] developed a model based on a feed-forward neural network to predict male fertility. The authors reported that the proposed model had achieved accuracy and AUC of 97.50% and 97%, respectively. In addition, SMOTE technique is used to overcome data imbalance issues. Dash and Ray [16] performed the comparative study using eight classifiers: soft voting, DT, NB, LR, DT bagged, RF, and ET. The maximum accuracy of 90.02% was achieved by ET. Ahmed and Imtiaz [17] used the NB classifier for predicting male fertility and reported an accuracy of 87.75%. Engy et al. [18] conducted a comparative analysis using five AI techniques: ANN, ANN-GA, DT, SVM, and ANN-SWA for male fertility detection, and their reported accuracies were 90%, 95%, 88%, 95%, and 99.96%, respectively. Candemir et al. [19] used four Machine Learning (ML) techniques, such as MLP, SVM, DT, and FRBF, to detect male fertility. Of all, the FRBF classifier outperformed, and 90% accuracy was reported. Soltanzadeh et al. [20] performed a comparative analysis among four algorithms: NB, NN, LR, and Fuzzy C-means. The authors have used a filtering method and compared performance before and after that application. Simfukwe et al. [21] used NB and ANN to predict male fertility. In total, a 97% training accuracy was reported for both algorithms during the training phase. Palechor et al. [22] used classification and clustering methods to identify male fertility. J48, SMO, NB, and lazy IBK algorithms were considered for classification, whereas the simple K-means algorithm was used for clustering. The authors used TP and FP to identify model performance. Rhemimet et al. [23] developed individual systems for detecting male fertility using regression, classification, and clustering methods. DT and NB have been used for classification with 61.36% and 88.63% accuracy. Similarly, K-means and O-means have been applied to make a cluster, and the reported accuracies of 100% and 50% were noted. Finally, GLM and SVM were used for regression, and 12.34% and 15.08% accuracy were reported. Bidgoli et al. [24] used four methods: optimized MLP, NB, DT, and SVM, and the models obtained an accuracy of 93.3%, 73.10%, 83.82%, and 80.88%, respectively. Sahoo and Kumar [25] experimented to identify the importance of the feature selection method along with five algorithms. DT, MLP, SVM, SVM-PSO, and NB were used as classifiers, and they performed relatively similarly. The maximum accuracies of 89%, 92%, 91%, 94%, and 89% were reported using feature selection. Girela et al. [26] used the ANN model to detect seminal quality, and 97% accuracy was reported on the training dataset. Gil et al. [27] used three ML algorithms, such as SVM, MLP, and DT, to identify sperm concentration and morphology. The authors reported 86%, 86%, and 84% accuracies for sperm concentration, whereas 69%, 69%, and 67% accuracies were reported for sperm morphology. Wang et al. [28] used a clustering-based decision forest to predict the seminal quality. The authors compared the proposed model performance with SVM, MLP, and LR. Of all, the CBDF algorithm outperformed with an AUC of 80.5%. Roy and Alvi [29] used four AI tools, KNN, SVM, LR, and DT, to detect male fertility. They reported that KNN performed well, with an accuracy of 90%.
In the literature mentioned above, authors have worked on male fertility detection by considering only improvement accuracy level and imbalanced dataset handling [14,15,16,17,18,19,20,21,22,23,24,25,26,27,28,29]. Unless the previously developed systems for predicting male fertility performed well, the articles in which system explainability issues are discussed have yet to be identified. As a result, most AI systems are not accepted in the healthcare setting. Very briefly, many authors not only used modifiable factors, but sperm images were also taken into consideration. For both cases, sperm concentration and morphology are gold standards in male fertility prediction. It is prudent to comprehend which factors are critical and determine their impact on changes in developed systems. For this reason, explainability is a fundamental tool to gain insights into the model.
This paper presents an explainable AI (XAI) system for prediction analysis of male fertility for early-stage diagnosis using modifiable factors (lifestyle/environment). Our prime objective is to comprise a fertility risk predictive system for males. In this study, the explainability of AI system enables the discovery of risk factors which contribute to transparent and traceable explanations for decision-making criteria using AI. To the best of our knowledge, this is the first article where explainability techniques are used for predictive analysis of male fertility. This explanation provides significant benefits for patients and clinicians to understand the ways in which each feature contributes to the prediction. In line with the above-mentioned rigorous literature review, the key contributions in this research are summarized as follows:
- To detect male fertility, a conventional XGB-SMOTE-based generalized AI system is proposed;
- Hold-out and five-fold cross-validation schemes are utilized for system testing;
- Benchmarking of the interpretability of the proposed system is performed via implemented XAI tools;
- To assess the performance of the proposed system, a comparative analysis is performed with existing AI systems.
The remaining article is structured as follows: Section 2 describes the model development process for male fertility prediction. It also includes an overview of the XGB and XAI approaches. Section 3 describes the experimental setting, concentrating on the dataset and assessing the effectiveness of the suggested strategy. The model’s testing and comparison to alternative strategies are shown in Section 4 of the article. The final concluding remarks are provided in Section 5.
2. The Model Development
In this article, an ML-assisted XGB-SMOTE algorithm for predicting male fertility has been proposed.
The dataset is represented as D = where and is a row vector of input features having real values.
The output or target class is represented as . This means that it is a binary classification problem that can generate a system, , depending on training data points. Now, for prediction (, we can apply the system to the test data points, and the predicted output is which is the same as The first challenge in AI model design is the data processing and classifier selection. We are dealing with imbalanced data and a small number of samples. In other words, imbalanced data is a common issue, particularly in medical datasets. Hence, our prime objective is to balance our dataset and then predict patient classes with an ML classifier that can predict male fertility. Figure 1 depicts the prediction of male fertility using the proposed XGB-SMOTE method. Additionally, XGB also ensures the explainability of processing, resulting in reliable tools.
Numerous approaches are listed in the literature for dealing with imbalanced data and classifier selection. Each has unique advantages and disadvantages, and not one appears to be the best all-around. We looked for a suitable approach for our specific application of male fertility analysis and screening simulation. Finally, the following techniques are chosen, as discussed below.
2.1. Synthetic Minority Oversampling Technique (SMOTE)
Oversampling techniques, such as SMOTE, are utilized to increase the number of samples in the minority class. According to previous research, Ma et al. [14] and Yibre and Kocer [15] used ESMOTE and SMOTE techniques to increase the number of samples in the minority class.
We assume that and represent the number of majority and minority class instances. The imbalance ratio of is represented as Now, after the application of oversampling technique, the total data are computed using the following equations: total instances = and where denotes the number of synthetically generated instances.
2.2. XGB Algorithm
XGB is an ML classifier that is scalable and efficient. It is used to solve classification, regression, and ranking problems. In 2016, Chen and Guestrin popularized this algorithm [33]. A gradient-boosting decision tree, a boosting mixture of many decision trees, is the foundation of the original XGB model. Each tree is built using gradient boosting to lower the residual of the preceding model. The term “residual” refers to the discrepancy between the actual and predicted values [34]. The model has been trained until the threshold’s allotted number of decision trees has been reached. This method accommodates both regression and classification [35]. By 2015, XGB had completed 17 of the 29 ML tasks posted on Kaggle.
2.3. XAI
Black box AI and ML models do not provide explainable decisions. Explainable AI (XAI) approach is used to convert this black box to a glass box system that helps understand the AI system’s prediction report [36]. Explainability is the degree to which humans can understand the AI decision [37], provide insights into the AI system, and discuss the logic behind the decision. Application of XAI has three main benefits: (a) provides a transparent interpretation and boosts trust in the designed model; (b) enables model troubleshooting; (c) specifies the source of the system basis. Explainability and efficacy are two distinct aspects that should be maintained while designing AI systems. In contrast, efficiency needs to explain their decisions coherently and vice versa. Classification of XAI techniques includes global and local methods. Global explainability helps comprehend system behaviour and feature effects on prediction labels. Local explainability provides transparency in the decision of the model for individual instances [38,39,40]. The interpretable system is critical to translate the output decision into human-understandable language, especially in healthcare.
3. Experimental Setting
To felicitate the fast development of our model, we use the Python language on the windows operating system. This section describes the dataset, feature importance, and performance evaluation metrics.
3.1. Dataset
Based on WHO guidelines, Gil et al. [27] investigated the factors that may impair male seminal quality. The study was carried out at the University of Alicante in Spain. A total of 123 young, healthy volunteers between the ages of 18 and 36 took part in the study and were required to refrain from having sex for a period of 3 to 6 days. Due to incomplete information from some participants, only 100 people were available at the end. The sperm examination was completed within 60 min of the sample collection. This dataset, available in the UCI databases, is used in this study. The dataset contains nine input attributes related to lifestyle and environmental factors. Table 1 summarizes the dataset information where the data values are normalized under the following rules.
This dataset comprises 12 samples which belong to altered, and 88 are normal. Due to unequal distribution, this dataset nature is imbalanced, where most instances are fertile.
3.2. Feature Importance
A dataset is a collection of information typically presented in a tabular manner. A dataset consists of input features and output or target class. Each feature has its own relevance and is essential for the development of any ML model. These features have directly affected the model’s performance. There are two main processes, feature selection and engineering, considered to be the primary steps to build an effective model. The benefits of feature selection are an optimized dataset, low memory consumption, and improved model performance. Similarly, feature engineering helps to reduce overfitting and underfitting issues. Under feature selection, most of the researchers used Pearson’s correlation to identify the significant features from the dataset which have a high impact on input features. Similarly, under feature engineering, normalization and standardization approaches are always considered. The Pearson’s correlation is calculated by .
3.3. Performance Evalutaion
The accuracy, sensitivity, specificity, and f1-score of a designed model are typically used to estimate its performance. These measures are determined using fundamental terms.
True positive (TP) refers to the modified instances the classifier labels correctly.
True negative (TN) refers to the normal instances the classifier labels correctly.
False positive (FP) refers to normal occurrences that have been mislabeled as altered.
False negative (FN) refers to altered instances incorrectly labelled as normal.
Accuracy (ACC) is an AI system metric that determines the proportion of a specific class that is correctly predicted over the total number of samples. It can be calculated as .
Sensitivity (SEN) is the ratio of correctly predicted ill cases to the total number of ill cases, and it is calculated as .
Specificity (SPEC) is defined as the ratio of correctly predicted healthy cases to total healthy cases, and it is calculated as .
F1-Score is calculated as , where precision (PREC) is defined as the ratio of correctly predicted ill cases to the total predicted ill cases, and it is calculated as .
The area under the ROC curve is defined as the Area Under Curve (AUC). AUC is the sum of measured performance across all classification thresholds.
4. Numerical Results and Analysis
The results are shown in both visual and numerical formats. We used the correlation function for data analysis (see Section 4.1). Then, we presented the results of all classifiers with imbalanced and balanced datasets (see Section 4.2). Following that, we discussed the explainability of the proposed AI system (see Section 4.3). Python packages and libraries were used to design our model because they are free and open-source.
4.1. Analysis for Dataset
This study uses normalization to scale the data from 0 to 1. The normalized value of the dataset is presented in Table 1. After normalization, we used Pearson’s correlation coefficient to comprehend the strength of the linear relationship between two variables. The coefficient value can determine the relationship strategy in terms of positive and negative values. Figure 2 depicts the correlation matrix heat map for the male fertility dataset.
The r lies between −1 to 1, where −1 indicates a perfect negative correlation, and +1 signifies a positive correlation. In Figure 2, the orange color indicates positive relation, and dark violet indicates negatively correlated features.
4.2. Performance Evalutaion
The total experiment was performed in multiple steps. In the first step, we deal with the original dataset, and the hold-out validation approach is considered. The original dataset consists of 100 samples (normal—88 and 12—altered). This dataset has training and testing modules, where 80% of the data is used for training and 20% for testing. Many ML algorithms are currently being used for disease diagnosis. Here, we have selected the conventional XGB algorithm, and 80% of the training data is used to train the model. After training, 20% of the data is used to evaluate the model performance. In the next step, SMOTE is applied to the training dataset, and we generate synthetic data to sample the minority classes (altered). Now, the training module contained 140 samples which are balanced (normal—70 and altered—70), whereas the testing module has 20 samples (normal—18 and altered—2). Finally, Table 2 provides the performance metrics, including ACC, SEN, SPEC, F1 score, and AUC using XGB with hold-out. Table 2 shows that 90.00% and 94.05% accuracies are obtained by XGB with original and balanced datasets, respectively. Therefore, the algorithm performed well in terms of accuracy and provided a good AUC value. At that point, XGB is chosen to proceed with further investigation.
In this stage, a comparative study is performed along with the most popular algorithms, SVM and ADA. Based on the literature survey, these two algorithms provided optimal performance with SMOTE technique. The same experimental strategy we followed is discussed above. All the performance matrices values are listed in Table 3. The maximum accuracy of 94.05% is obtained by XGB, which is better than SVM and ADA. Hence, XGB performed best under SMOTE technique and hold-out cv (after comparison with Table 2).
For a fine selection of the final algorithm, again, we have selected two ensemble algorithms, RF and ET, previously used in male fertility analysis. The experimental results are shown in Table 4, followed by the same experimental strategy. From Table 4, we can observe that RF and ET have achieved accuracies of 91.17% and 84.09%, respectively, for imbalanced datasets. Similarly, 92.45% and 85.87% accuracies were obtained by RF and ET with SMOTE. In both cases, RF and ET provide satisfactory accuracy, whereas AUC is fair at 71% to 86%. From Table 2, we obtained the AUC for XGB, which is better than ET and RF. After performing all these experiments in different stages, we selected XGB as our primary classifier and proceeded to the next level of the experiment.
After selecting the primary classifier, we have applied k-fold cv and evaluated the XGB model with the default parameter setting. In this situation, the data is divided into training and testing samples by k value. Based on the previous literature, most researchers have taken the value of k as 5. Hence, in our study, we have chosen a five-fold cv technique. With the help of this validation, we can understand the statistical robustness of our proposed system.
Table 5 depicts the outcome of our model in terms of ACC, SEN, SPEC, F1-score, and AUC in each fold with their mean (µ) and standard deviation (σ). In this context, it is identified that our proposed model has achieved mean accuracy of 93.22% using five-fold cross-validation, which is lesser as compared to the hold-out validation outcome. In addition to this analysis, the obtained AUC value is 0.98, which is remarkable compared to other existing AI systems. Hence, our AI system provides satisfactory results for male fertility prediction.
4.3. Explainability of Male Fertility Prediction
An approach known as the XAI technique is applied to unboxing the AI system. Each XAI method identified local and global explainability for further research. To test our system’s explainability, we located 11 libraries. These libraries have good documentation, explanations, and tabular data for XAI. However, we have chosen the ELI5 and SHAP libraries to explain the proposed model’s global explainability. Similarly, for local explainability, LIME and SHAP were identified.
- Global explainability
Numerous libraries using various feature significance metrics were located. These techniques rely on scoring input features according to the predictive value they contribute to the system. Our overview focused on global system explainability and showcasing explainability outcomes. Two libraries, ELI5 and SHAP, have been utilized for in-depth analysis.
ELI5 tool is used to identify special features via permutation importance. It allows for extraction and visualization of features that help to identify the contribution towards the system as global explanations. A tabular list view of the features and their weights provided a framework for the visualization. Table 6 depicts the ELI5 library’s implementation of feature importance by score. This tabular data shows that the high fever in the last year ( is the most critical feature. On the other hand, no features have a negative score, which signifies that each feature positively influences the proposed system.
The SHAP library allows for global model analysis and provides an interpretation of the AI system. The system interpretation has been performed by calculating feature importance concerning feature influence on a prediction about the input data (shown in Figure 3 and Figure 4). The importance of features is shown along the x-axis; the most significant features are listed at the top. From Figure 3 and Figure 4, we can conclude that age ( is the most important determinant, and childhood diseases (polio, measles, and pox) have little impact on male seminal quality. Similarly, SHAP provides a global interpretation for specific classes. The contributions of specific features are plotted along the x-axis, which can positively or negatively affect the prediction of this class. Each data point stacked vertically within this visualization represents the contribution of a specific instance. The color gradient encodes the raw values, with blue and red representing the lowest and highest values, respectively.
- Local explainability
Global explainability elaborates in detail on the ways in which an AI system works, but local explainability does not try to do the same. It shows the way in which the system outcome changes as the values of certain features change within given intervals. For this reason, the user gains the trust of individual predictions and the whole system. Additionally, globally essential features may be insignificant locally and vice versa. The two most frequent approaches, LIME and SHAP, are utilized for local interpretation. LIME is an innovative approach that describes any AI system’s prediction process and provides insights into the prediction strategy and feature correlations. On the other hand, SHAP offers a force plot for explaining the local interpretation of the model. This plot helps to visualize each feature’s effect on the prediction model for a given observation.
Figure 5 shows the local feature importance using SHAP values which explains individual prediction. Red color indicates the higher value of a feature, and blue indicates a lower value of a feature, along with its magnitude. Five features, the number of sitting hours per day, age, alcohol intake, fever, and smoking, have higher values. Four features, accident, surgical intervention, season, and child diseases, have lower values. Other features, such as smoking habit and child disease, have the same positive value. Figure 6 provides the local explanation of black box prediction outcomes where the most significant features, such as age, alcohol intake, and the number of sitting hours in a day, have been moved towards the positive class. The remaining three features, accident, surgical intervention, and season, move towards the negative class. All features compete against each other; finally, the highlighted value is a prediction for that observation.
We have applied LIME to enhance the interpretability of our proposed system. Figure 7 shows the outcome of the LIME approach for the XGB-SMOTE system. The result reflects the contribution of each feature to the instance prediction as follows:
LIME visualization is divided into three parts: a class description with an accurate prediction for each class, a plot showing the impact of features, and a table with actual values in the instances. The prediction probabilities are displayed in the section on the left. There are two colors for two-class classification tasks: orange (altered semen quality/infertile) and blue (normal semen quality/fertile). The middle part summarizes the crucial aspects. The impact of features assists the user in determining which feature values support class prediction (left side). Figure 7 shows that features such as surgical intervention, child disease, and smoking habit, supporting (positive) in relation to an instance, are predicted as normal. At the same time, the orange bar indicates the contradicting (negative) scores in relation to the prediction.
In this study, we have used SHAP, LIME, and ELI5 libraries under the XAI approach. A comparison study is a must to comprehend each process overview in terms of global and local explainability since there are three distinct XAI processes. Three criteria can be used in global explainability: computational overhead, implemented visualization, and interactivity.
From the perspective of computational overhead, ELI5 provides the most lightweight solution, implemented visualization, and interactivity. Feature importance alongside other implemented functionality of ELI5 can be convenient during the model development process. Similarly, increased interactivity and visualization options come with the additional computational overhead in the SHAP library.
Next, in terms of local explainability, the SHAP and LIME approaches yield different results. SHAP outperformed the others regarding computational resources and provided an interactive way to explore the various model predictions. The SHAP force plot is advantageous if focuses on exploring the features, providing more refined explainability and analytical experience. In other words, LIME has its speed advantage and provides an intuitive example explanation.
4.4. Comparision with Existing Systems
Table 7 compares our results with existing approaches in the literature for further assessment of the performance of the proposed XGB-SMOTE system. In previous research, Multilayer perceptron (MLP), SVM, support vector machine-particle swarm optimization (SVM-PSO), decision tree (DT), Nave Bayes (NB), Clustering based decision forest (CBDF), ESLSMOTE-BPNN, ESLSMOTE-ADA, and ESLMOTE-SVM were used for male fertility prediction. Table 7 shows that feature selection and data balancing approaches significantly impact accuracy. As a result, XGB-SMOTE is a better solution for detecting male fertility.
5. Conclusions and Future Work
In this study, we have presented an AI system for predicting male fertility. The proposed model is created using conventional XGB with SMOTE data balancing method. We obtained 93.22% mean accuracy and 0.98 AUC, which is promising. Furthermore, the proposed model result has been implemented using XAI approaches. These methods produce reliable and understandable results for male fertility prediction. Three libraries, SHAP, LIME, and ELI5, are investigated to explain the global and local explainability of the XGB-SMOTE system. This investigation is beneficial for physicians or healthcare experts and patients to understand the decision-making process. Several scopes may be present for future research, which includes model optimization with the use of hyper-parameter tuning [41] and comparing the performance with other ensemble AI learners (CatBoost and LightGBM) [42,43]. Additionally, data balancing can be achieved using a variety of oversampling techniques [44], and model explainability can be investigated by different XAI methods. Finally, the presented approach, using publicly available data and showing the application of XAI, can significantly contribute to human society and reproductive science.
Author Contributions
Conceptualization, D.G. and K.S.; methodology, D.G. and K.S.; software, D.G.; validation, D.G. and K.S.; formal analysis, P.A.A.; investigation, K.S. and P.A.A.; resources, K.S. and P.A.A.; data curation, D.G. and K.S.; writing—original draft preparation, D.G., K.S. and P.A.A. writing—review and editing, K.S.; visualization, D.G. and K.S.; supervision, P.A.A. and K.S.; project administration, D.G., P.A.A. and K.S. funding acquisition, K.S. All authors have read and agreed to the published version of the manuscript.
Funding
The work has been supported by Applied AI research lab, USA.
Data Availability Statement
https://archive.ics.uci.edu/ml/datasets/Fertility (accessed on 10 December 2022).
Conflicts of Interest
The authors declare no conflict of interest.
References
- Bongaarts, J. A method for the estimation of fecundability. Demography 1975, 12, 645–660. [Google Scholar] [CrossRef] [PubMed]
- Kumar, N.; Singh, A.K. Trends of male factor infertility, an important cause of infertility: A review of literature. J. Hum. Reprod. Sci. 2015, 8, 191–196. [Google Scholar] [CrossRef] [PubMed]
- Agarwal, A.; Mulgund, A.; Hamada, A.; Chyatte, M.R. A unique view on male infertility around the globe. Reprod. Biol. Endocrinol. 2015, 13, 37. [Google Scholar] [CrossRef] [PubMed] [Green Version]
- Durairajanayagam, D. Lifestyle causes of male infertility. Arab. J. Urol. 2018, 16, 10–20. [Google Scholar] [CrossRef] [Green Version]
- Yap, M.; Johnston, R.L.; Foley, H.; MacDonald, S.; Kondrashova, O.; Tran, K.A.; Nones, K.; Koufariotis, L.T.; Bean, C.; Pearson, J.V.; et al. Verifying explain-ability of a deep learning tissue classifier trained on RNA-seq data. Sci. Rep. 2021, 11, 2641. [Google Scholar] [CrossRef] [PubMed]
- Shah, M.; Naik, N.; Somani, B.K.; Hameed, B.M.Z. Artificial intelligence (AI) in urology-Current use and future directions: An iTRUE study. Turk. J. Urol. 2020, 46, S27–S39. [Google Scholar] [CrossRef] [PubMed]
- Wang, R.; Pan, W.; Jin, L.; Li, Y.; Geng, Y.; Gao, C.; Chen, G.; Wang, H.; Ma, D.; Liao, S. Artificial intelligence in reproductive medicine. Reproduction 2019, 158, R139–R154. [Google Scholar] [CrossRef]
- Azodi, C.B.; Tang, J.; Shiu, S.-H. Opening the Black Box: Interpretable Machine Learning for Geneticists. Trends Genet. 2020, 36, 442–455. [Google Scholar] [CrossRef]
- Moncada-Torres, A.; van Maaren, M.C.; Hendriks, M.P.; Siesling, S.; Geleijnse, G. Explainable machine learning can outperform Cox regression predictions and provide insights in breast cancer survival. Sci. Rep. 2021, 11, 6968. [Google Scholar] [CrossRef]
- Gadaleta, M.; Radin, J.M.; Baca-Motes, K.; Ramos, E.; Kheterpal, V.; Topol, E.J.; Steinhubl, S.R.; Quer, G. Passive detection of COVID-19 with wearable sensors and explainable machine learning algorithms. NPJ Digit. Med. 2021, 4, 166. [Google Scholar] [CrossRef]
- El-Sappagh, S.; Alonso, J.M.; Islam, S.M.R.; Sultan, A.M.; Kwak, K.S. A multilayer multimodal detection and prediction model based on explainable artificial intelligence for Alzheimer’s disease. Sci. Rep. 2021, 11, 2660. [Google Scholar] [CrossRef] [PubMed]
- Han, H.; Liu, X. The challenges of explainable AI in biomedical data science. BMC Bioinform. 2022, 22, 1–3. [Google Scholar] [CrossRef]
- Loh, H.W.; Ooi, C.P.; Seoni, S.; Barua, P.D.; Molinari, F.; Acharya, U.R. Application of Explainable Artificial Intelligence for Healthcare: A Systematic Review of the Last Decade (2011–2022). Comput. Methods Programs Biomed. 2022, 226, 107161. [Google Scholar] [CrossRef] [PubMed]
- Ma, J.; Afolabi, D.O.; Ren, J.; Zhen, A. Predicting Seminal Quality via Imbalanced Learning with Evolutionary Safe-Level Synthetic Minority Over-Sampling Technique. Cogn. Comput. 2019, 13, 833–844. [Google Scholar] [CrossRef]
- Yibre, A.M.; Koçer, B. Semen quality predictive model using Feed Forwarded Neural Network trained by Learn-ing-Based Artificial Algae Algorithm. Eng. Sci. Technol. Int. J. 2021, 24, 310–318. [Google Scholar]
- Dash, S.R.; Ray, R. Predicting Seminal Quality and its Dependence on Life Style Factors through Ensemble Learning. Int. J. E-Health Med. Commun. 2020, 11, 78–95. [Google Scholar] [CrossRef]
- Ahmed, M.T.; Imtiaz, M.N. Prediction of Seminal Quality Based on Naïve Bayes Approach. PUST 2020, 4. [Google Scholar]
- Engy, E.L.; Ali, E.L.; Sally, E.G. An optimized artificial neural network approach based on sperm whale optimization algorithm for predicting fertility quality. Stud. Inform. Control 2018, 27, 349–358. [Google Scholar]
- Candemir, C. Estimating the Semen Quality from Life Style Using Fuzzy Radial Basis Functions. Int. J. Mach. Learn. Comput. 2018, 8, 44–48. [Google Scholar] [CrossRef] [Green Version]
- Soltanzadeh, S.; Zarandi, M.H.F.; Astanjin, M.B. A Hybrid Fuzzy Clustering Approach for Fertile and Unfertile Analysis. In Proceedings of the 2016 Annual Conference of the North American Fuzzy Information Processing Society (NAFIPS), El Paso, TX, USA, 13 February 2016; pp. 1–6. [Google Scholar]
- Simfukwe, M.; Kunda, D.; Chembe, C. Comparing naive bayes method and artificial neural network for semen quality categorization. Int. J. Innov. Sci. Eng. Technol. 2015, 2, 689–694. [Google Scholar]
- Mendoza-Palechor, F.E.; Ariza-Colpas, P.P.; Sepulveda-Ojeda, J.A.; De-la-Hoz-Manotas, A.; Piñeres Melo, M. Fertility analysis method based on supervised and unsupervised data mining techniques. Int. J. Appl. Eng. Res. 2016, 11, 10374–10379. [Google Scholar]
- Rhemimet, A.; Raghay, S.; Bencharef, O. Comparative Analysis of Classification, Clustering and Regression Techniques to Explore Men’s Fertility. In Proceedings of the Mediterranean Conference on Information & Communication Technologies, Paphos, Cyprus, 4–6 September 2016; Springer: Cham, Switzerland, 2016; pp. 455–462. [Google Scholar]
- Bidgoli, A.A.; Komleh, H.E.; Mousavirad, S.J. Seminal Quality Prediction Using Optimized Artificial Neural Network with Genetic Algorithm. In Proceedings of the 9th International Conference on Electrical and Electronics Engineering (ELECO), Bursa, Turkey, 26–28 November 2015; pp. 695–699. [Google Scholar]
- Sahoo, A.J.; Kumar, Y. Seminal quality prediction using data mining methods. Technol. Health Care 2014, 22, 531–545. [Google Scholar] [CrossRef] [PubMed]
- Girela, J.L.; Gil, D.; Johnsson, M.; Gomez-Torres, M.J.; De Juan, J. Semen parameters can be predicted from environmental factors and lifestyle using artificial intelligence methods. Biol. Reprod. 2013, 88, 99–100. [Google Scholar] [CrossRef] [PubMed]
- Gil, D.; Girela, J.L.; De Juan, J.; Gomez-Torres, M.J.; Johnsson, M. Predicting seminal quality with artificial intelligence methods. Expert Syst. Appl. 2012, 39, 12564–12573. [Google Scholar] [CrossRef]
- Wang, H.; Xu, Q.; Zhou, L. Seminal Quality Prediction Using Clustering-Based Decision Forests. Algorithms 2014, 7, 405–417. [Google Scholar] [CrossRef]
- Roy, D.G.; Alvi, P.A. Detection of Male Fertility Using AI-Driven Tools. In International Conference on Recent Trends in Image Processing and Pattern Recognition; Springer: Cham, Switzerland, 2022; pp. 14–25. [Google Scholar]
- Chawla, N.V.; Bowyer, K.W.; Hall, L.O.; Kegelmeyer, W.P. SMOTE: Synthetic Minority Over-sampling Technique. J. Artif. Intell. Res. 2002, 16, 321–357. [Google Scholar] [CrossRef]
- Ijaz, M.F.; Alfian, G.; Syafrudin, M.; Rhee, J. Hybrid Prediction Model for Type 2 Diabetes and Hypertension Using DBSCAN-Based Outlier Detection, Synthetic Minority Over Sampling Technique (SMOTE), and Random Forest. Appl. Sci. 2018, 8, 1325. [Google Scholar] [CrossRef] [Green Version]
- Javale, D.P.; Desai, S.S. Machine learning ensemble approach for healthcare data analytics. Indones. J. Electr. Eng. Comput. Sci. 2022, 28, 926–933. [Google Scholar]
- Cohen, S. Artificial Intelligence and Deep Learning in Pathology; Elsevier Health Sciences: Amsterdam, The Netherlands, 2020. [Google Scholar]
- Freund, Y.; Schapire, R.E. A Decision-Theoretic Generalization of On-Line Learning and an Application to Boosting. J. Comput. Syst. Sci. 1997, 55, 119–139. [Google Scholar] [CrossRef] [Green Version]
- Ogunleye, A.; Wang, Q.G. XGBoost model for chronic kidney disease diagnosis. IEEE/ACM Trans. Comput. Biol. Bioinform. 2019, 17, 2131–2140. [Google Scholar] [CrossRef]
- Yang, G.; Ye, Q.; Xia, J. Unbox the black-box for the medical explainable AI via multi-modal and multi-centre data fusion: A mini-review, two showcases and beyond. Inf. Fusion 2022, 77, 29–52. [Google Scholar] [CrossRef] [PubMed]
- Gong, H.; Wang, M.; Zhang, H.; Elahe, F.; Jin, M. An Explainable AI Approach for the Rapid Diagnosis of COVID-19 Using Ensemble Learning Algorithms. Front. Public Health 2022, 10, 874455. [Google Scholar] [CrossRef] [PubMed]
- Kerasidou, A. Ethics of artificial intelligence in global health: Explainability, algorithmic bias and trust. J. Oral Biol. Craniofacial Res. 2021, 11, 612–614. [Google Scholar] [CrossRef] [PubMed]
- Petch, J.; Di, S.; Nelson, W. Opening the Black Box: The Promise and Limitations of Explainable Machine Learning in Cardiology. Can. J. Cardiol. 2021, 38, 204–213. [Google Scholar] [CrossRef]
- Novakovsky, G.; Dexter, N.; Libbrecht, M.W.; Wasserman, W.W.; Mostafavi, S. Obtaining genetics insights from deep learning via explainable artificial intelligence. Nat. Rev. Genet. 2022, 1–13. [Google Scholar] [CrossRef]
- Guo, H.; Zhuang, X.; Chen, P.; Alajlan, N.; Rabczuk, T. Stochastic deep collocation method based on neural architecture search and transfer learning for heterogeneous porous media. Eng. Comput. 2022, 38, 5173–5198. [Google Scholar] [CrossRef]
- Ke, G.; Meng, Q.; Finley, T.; Wang, T.; Chen, W.; Ma, W.; Ye, Q.; Liu, T.Y. Lightgbm: A highly efficient gradient boosting decision tree. Adv. Neural Inf. Process. Syst. 2017, 30, 1–9. [Google Scholar]
- Dorogush, A.V.; Ershov, V.; Gulin, A. CatBoost: Gradient boosting with categorical features support. arXiv 2018, arXiv:1810.11363. [Google Scholar]
- Santos, M.S.; Soares, J.P.; Abreu, P.H.; Araujo, H.; Santos, J. Cross-Validation for Imbalanced Datasets: Avoiding Overoptimistic and Overfitting Approaches. IEEE Comput. Intell. Mag. 2018, 13, 59–76. [Google Scholar] [CrossRef]
Figure 1.
Methodology of the proposed system via XAI.
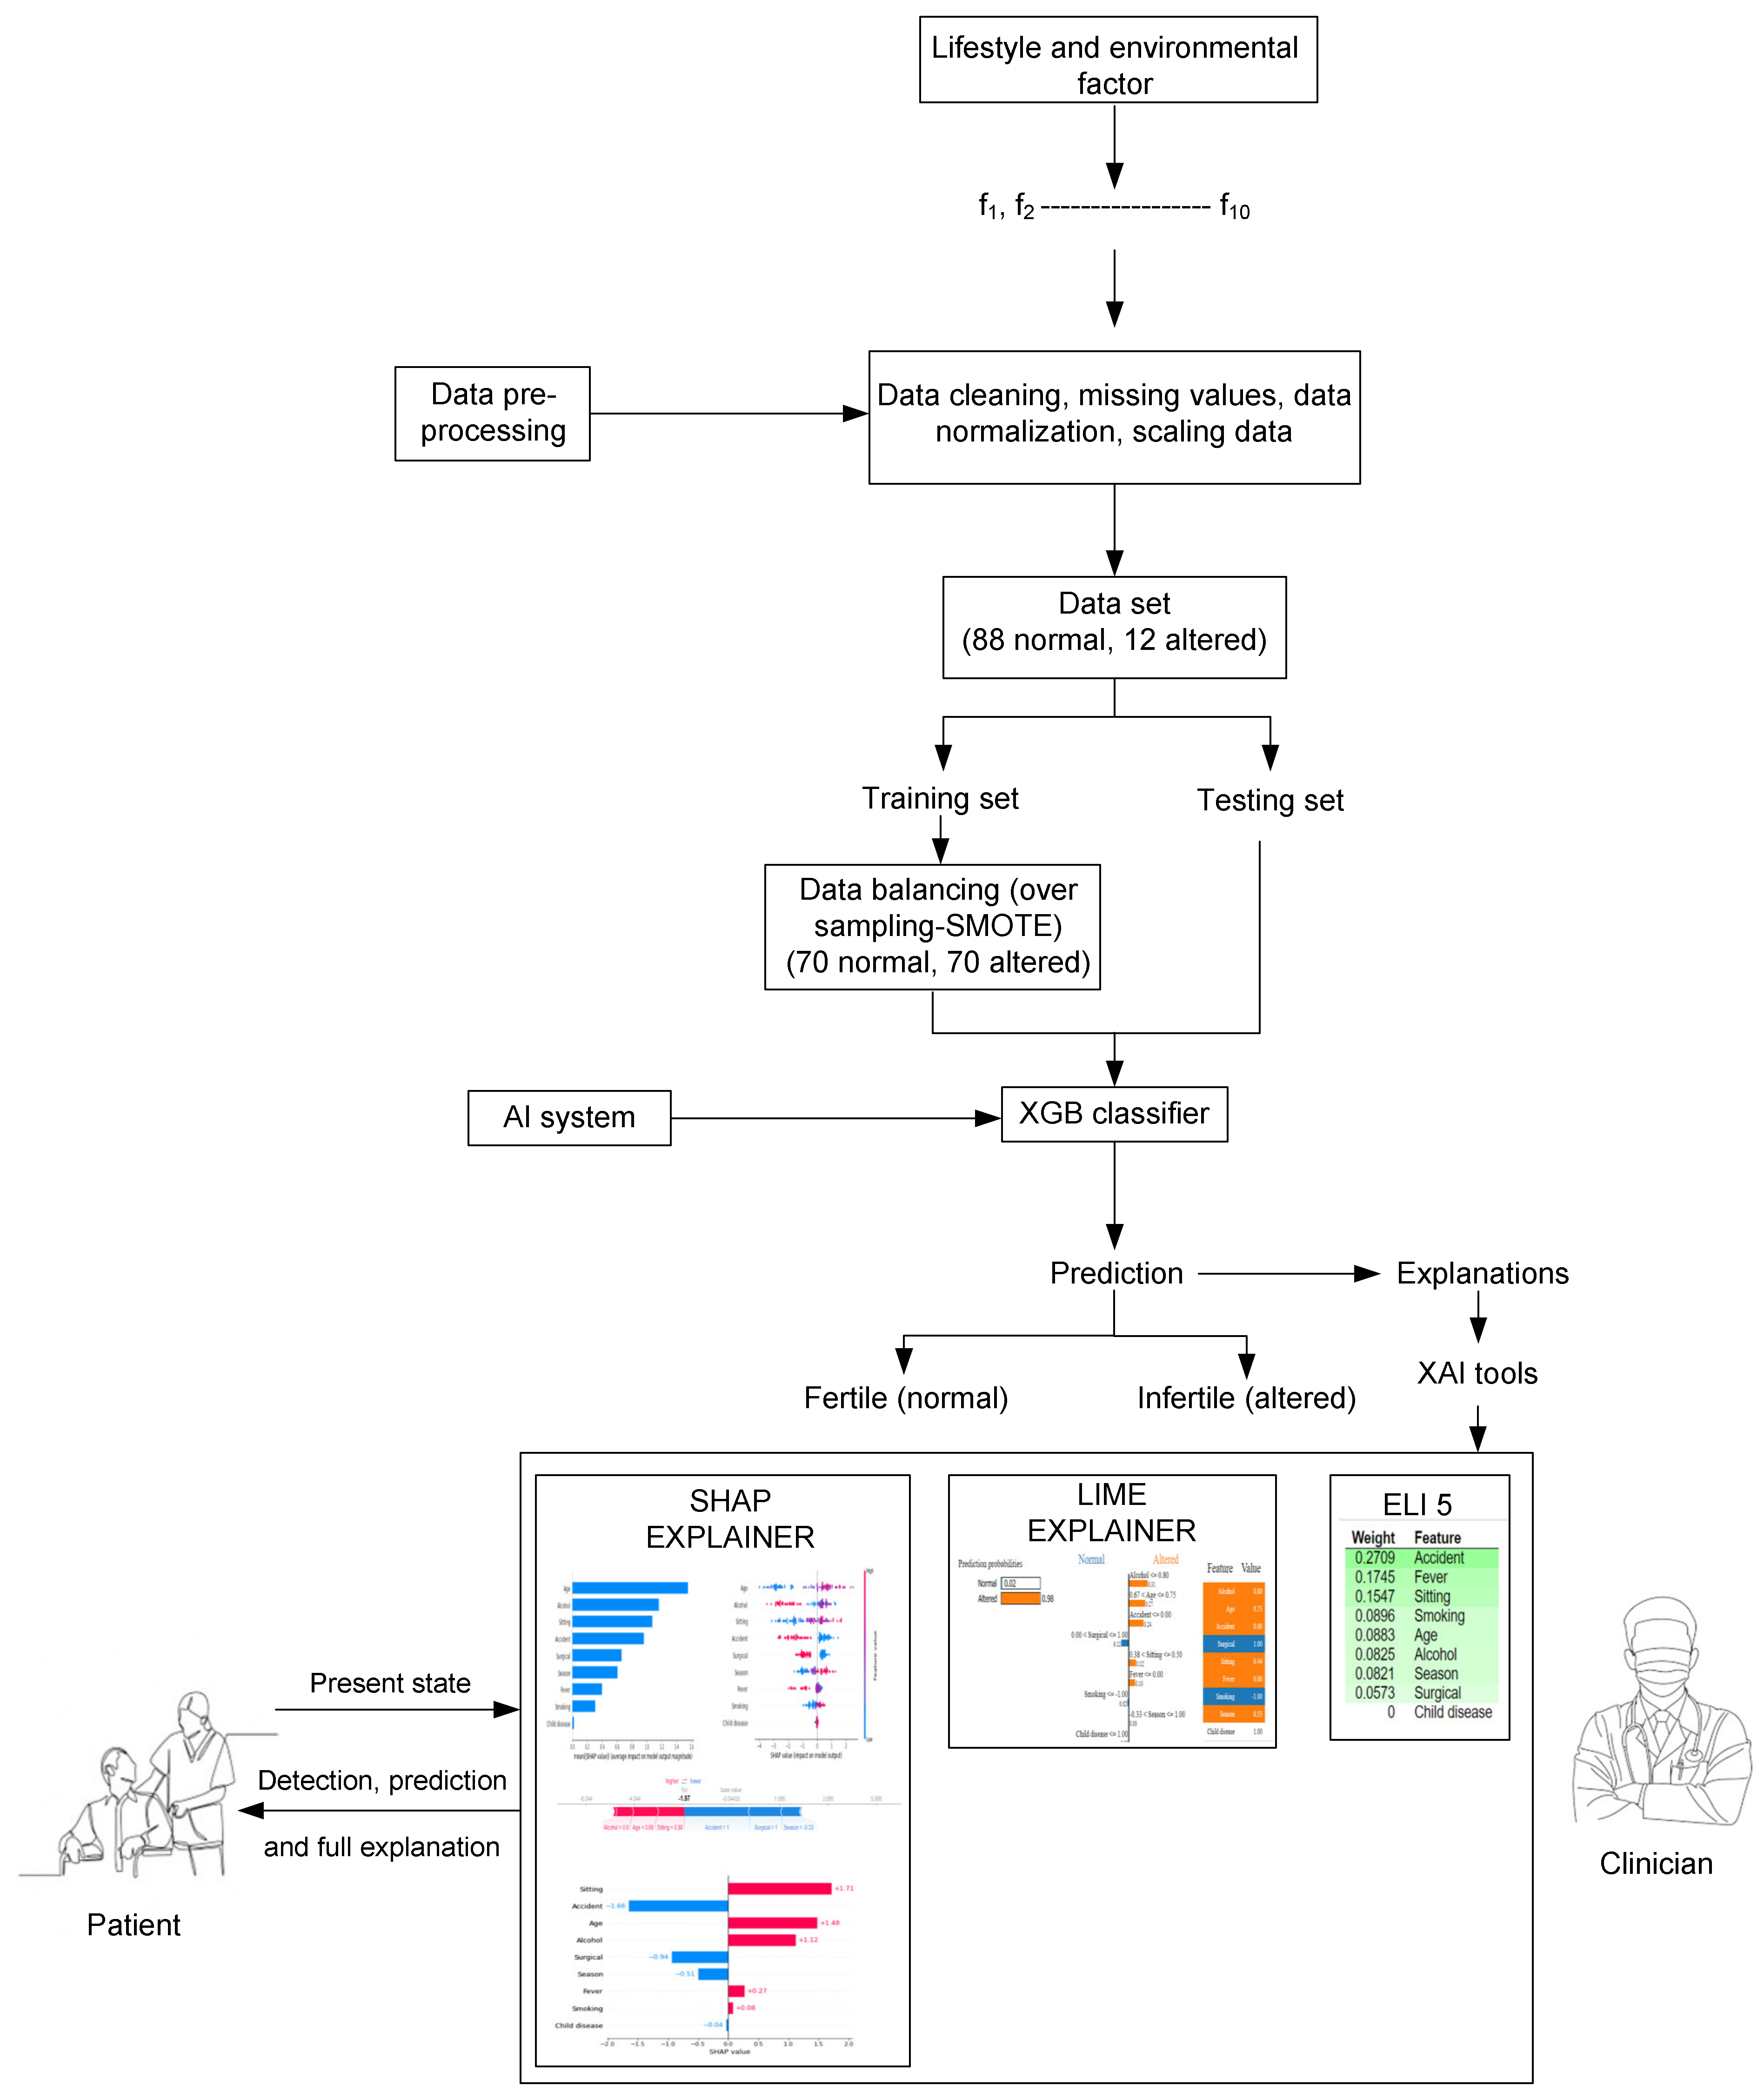
Figure 2.
Correlation coefficient interpretation.

Figure 3.
Global visualization of the impact of different features in the proposed model.

Figure 4.
Global visual explanation of proposed system via SHAP.

Figure 5.
Local visual explanation of the proposed system using SHAP.

Figure 6.
Local visual explanation of the proposed system.

Figure 7.
Local visualization of the proposed system.


Table 1.
Features with their detailing.
| Features. No | Feature’s Name | Values Range | Normalized |
|---|---|---|---|
| Season | winter, spring, summer, and fall | (−1, −0.33, 033, 1) | |
| Age | 18–36 | (0, 1) | |
| Childhood Disease | yes or no | (0, 1) | |
| Accident /Trauma | yes or no | (0, 1) | |
| Surgical Interventional | yes or no | (0, 1) | |
| High Fever | less than 3 months ago, more than 3 months ago, no | (−1, 0, 1) | |
| Alcohol Intake | several times a day, every day, several times in a week, and hardly ever or never | (0, 1) | |
| Smoking Habit | never, occasional, and daily | (−1, 0, 1) | |
| Sitting Hours/day | 1–16 | (0, 1) | |
| Target Class | normal, altered | (1, 0) |
Table 2.
Performance analysis using XGB using hold-out cv.
| Algorithm | Performance (in %) | ||||
|---|---|---|---|---|---|
| ACC | SEN | SPEC | F1-Score | AUC | |
| XGB | 90.00 | 86.12 | 84.93 | 90.06 | 91.49 |
| XGB-SMOTE | 94.05 | 91.79 | 90.02 | 95.97 | 97.00 |
Table 3.
Performance of popular AI systems using hold out cv.
| Algorithms | Performance (in %) | ||||
|---|---|---|---|---|---|
| ACC | SEN | SPEC | F1-Score | AUC | |
| SVM | 84.28 | 87.04 | 82.91 | 82.75 | 81.90 |
| SVM-SMOTE | 85.71 | 87.47 | 86.96 | 86.63 | 83.89 |
| ADA | 88.57 | 83.45 | 87.45 | 86.12 | 89.60 |
| ADA-SMOTE | 90.8 | 88.31 | 86.98 | 89.26 | 88.43 |
Table 4.
Performance of existing ensemble AI systems using hold-out cv.
| Algorithms | Performance (in %) | ||||
|---|---|---|---|---|---|
| ACC | SEN | SPEC | F1-Score | AUC | |
| RF | 91.17 | 96.00 | 100.00 | 98.00 | 79.67 |
| RF-SMOTE | 92.45 | 95.00 | 83.00 | 91.00 | 86.79 |
| ET | 84.09 | 90.00 | 80.00 | 83.00 | 71.35 |
| ET-SMOTE | 85.87 | 88.00 | 83.00 | 84.00 | 76.85 |
Table 5.
Average ACC in %, SEN, SPEC, F1-Score, and AUC using five-fold cv with XGB-SMOTE.
| Dataset Fold | ACC | SEN | SPEC | F1-Score | AUC |
|---|---|---|---|---|---|
| F-1 | 92.91 | 0.89 | 0.91 | 0.93 | 1.0 |
| F-2 | 94.05 | 0.91 | 0.90 | 0.95 | 0.97 |
| F-3 | 93.78 | 0.98 | 0.96 | 0.89 | 1.0 |
| F-4 | 91.55 | 1.0 | 0.98 | 0.91 | 0.96 |
| F-5 | 93.81 | 0.98 | 1.0 | 0.93 | 1.0 |
| µ | 93.22 | 0.95 | 0.95 | 0.92 | 0.98 |
| σ | 0.92 | 0.04 | 0.03 | 0.02 | 0.01 |
Table 6.
Feature weights and their impact on the proposed model.
| Weights | Features |
|---|---|
| 0.2861 | |
| 0.1758 | |
| 0.1697 | |
| 0.0929 | |
| 0.0846 | |
| 0.0706 | |
| 0.0587 | |
| 0.0475 | |
| 0.0143 |
Table 7.
Comparative study between proposed AI system to existing predictive systems on UCI dataset (according to year).
Table 7.
Comparative study between proposed AI system to existing predictive systems on UCI dataset (according to year).
| Authors [Ref] (Year) | Data Pre-Processing | AI Methods | Performance | |||
|---|---|---|---|---|---|---|
| ACC (in %) | SEN | SPEC | AUC | |||
| Gil et al. [27] (2012) | - | SVM, MLP, DT | 86, 86 and 84 (sperm concertation) 69, 69, 67 (sperm morphology) | 0.94, 0.97, 0.96 (Sperm concertation) 0.72, 0.73, 0.71 (Sperm morphology) | 0.4, 0.2, 0.13 (Sperm concentration) 0.25, 0.12, 0.12 (Sperm morphology) | - |
| Girela et al. [26] (2013) | - | ANN1, ANN2 | 97 (on training dataset) | 0.954, 0.892 | 0.5, 0.437 | - |
| Sahoo and Kumar [25] (2014) | Feature selection | DT, MLP, SVM, SVM-PSO, NB | 89, 92, 91, 94, 89 | - | - | 0.735, 0.728, 0.758, 0.932, 0.850 |
| Wang et al. [28] (2014) | - | CBDF | - | - | - | 0.80 |
| Bidgoli et al. [24] (2015) | - | Optimize MLP, NB, DT, SVM | 93.3, 73.10, 83.82, 80.88 | - | - | 0.933, 0.81, 0.858, 0.882 |
| Simfukwe et al. [21] (2015) | - | ANN, NB | 97 (on training dataset) | - | - | - |
| Soltanzadeh et al. [20] (2016) | Filtering | NB, NN, LR, Fuzzy C-means | - | - | - | 0.779, 0.7656, 0.3423, 0.73 |
| Rhemimet et al. [23] (2016) | - | DT, NB | 61.36, 88.63 | - | -- | - |
| Palechor et al. [22] (2016) | - | J48, SMO, NB, lazy IBK | 100, 100, 98.04, 100 (TP)0, 0, 1.5, 0 (FP) | - | - | - |
| Candemir et al. [19] (2018) | - | MLP, SVM, DT, FRBF | 69.0, 69.0, 67, 90 | 0.72, 0.73, 0.71, 0.92 | 0.25, 012, 0.12, 0.50 | - |
| Engy et al. [18] (2018) | - | ANN, ANN-GA, DT, SVM, ANN-SWA | 90, 95, 88, 95, 99.96 | 0.92, 0.97, 0.83 | 0.71, 0.70, 0.82, 0.72, 0.99 | - |
| Ma et al. [14] (2019) | ESLSMOTE | SVM, ADA, BPNN | 81.6, 95.1, 91.6 | - | - | - |
| Ahmed and Imtiaz [17] (2020) | - | NB | 87.75 | - | - | - |
| Dash and Ray [16] (2020) | - | soft voting, DT, NB, LR DT, DT bagged, RF, ET | 89, 78, 83, 88 88, 88, 84 (bagged) 78.80, 88.12, 89.07, 90.02 | - | - | 0.66 |
| Yibre and Kocer [15] (2021) | SMOTE | Feed forward neural network | 97.50 | 0.93 | 1 | 0.97 |
| Roy and Alvi [29] (2022) | - | KNN | 90 | - | - | - |
| Proposed | SMOTE | XGB | 93.22 | 0.95 | 0.95 | 0.98 |
Disclaimer/Publisher’s Note: The statements, opinions and data contained in all publications are solely those of the individual author(s) and contributor(s) and not of MDPI and/or the editor(s). MDPI and/or the editor(s) disclaim responsibility for any injury to people or property resulting from any ideas, methods, instructions or products referred to in the content. |
© 2022 by the authors. Licensee MDPI, Basel, Switzerland. This article is an open access article distributed under the terms and conditions of the Creative Commons Attribution (CC BY) license (https://creativecommons.org/licenses/by/4.0/).
Share and Cite
MDPI and ACS Style
GhoshRoy, D.; Alvi, P.A.; Santosh, K. Explainable AI to Predict Male Fertility Using Extreme Gradient Boosting Algorithm with SMOTE. Electronics 2023, 12, 15. https://doi.org/10.3390/electronics12010015
AMA Style
GhoshRoy D, Alvi PA, Santosh K. Explainable AI to Predict Male Fertility Using Extreme Gradient Boosting Algorithm with SMOTE. Electronics. 2023; 12(1):15. https://doi.org/10.3390/electronics12010015
Chicago/Turabian StyleGhoshRoy, Debasmita, Parvez Ahmad Alvi, and KC Santosh. 2023. "Explainable AI to Predict Male Fertility Using Extreme Gradient Boosting Algorithm with SMOTE" Electronics 12, no. 1: 15. https://doi.org/10.3390/electronics12010015
Note that from the first issue of 2016, this journal uses article numbers instead of page numbers. See further details here.