Article

Open-Source Culture Platform for Multi-Cell Type Study with Integrated Pneumatic Stimulation

by
Nicolò Cacocciola
1,*,
Simone Luigi Marasso
1,2,*,
Giancarlo Canavese
1,
Matteo Cocuzza
1,2,3,
Candido Fabrizio Pirri
1,3,4 and
Francesca Frascella
1,3
1
DISAT–Politecnico di Torino, Corso Duca degli Abruzzi 24, 10129 Turin, Italy
2
CNR-IMEM, Parco Area delle Scienze 37°, 43124 Parma, Italy
3
PolitoBIOMed Lab, Politecnico di Torino, C.so Duca degli Abruzzi 24, 10129 Turin, Italy
4
Center for Sustainable Future Technologies, Italian Institute of Technology, Via Livorno 60, 10144 Turin, Italy
*
Authors to whom correspondence should be addressed.
Electronics 2023, 12(1), 73; https://doi.org/10.3390/electronics12010073
Submission received: 9 November 2022 / Revised: 20 December 2022 / Accepted: 20 December 2022 / Published: 25 December 2022

Abstract

:
Mechanical forces can influence the structure and development of healthy and cancerous cells and tissue microenvironments, acting on their physical shape and promoting non-genetic alterations during growth. For this reason, it is interesting to investigate the role of dynamic hydrostatic compression on such cultures, to assess the role of such stimuli on key parameters, such as cell differentiation, cell stiffness and cytoskeleton rearrangements. In this work, we present a versatile Arduino-based pneumatic system for the stimulation of a cell culture performed in a standard multi-well plate, designed to work inside a CO2 incubator. The system is capable of modifying the hydrostatic pressure inside a dedicated culture chamber following the desired pattern, and, thus, providing a mechanical hydrostatic stimulus to a cell culture growing inside it. In the present work, a human respiration-like compression pattern was used, to mimic the mechanical stress conditions inside the human lung alveoli, and make the platform compatible with the development of lung tissues and organoids.

Graphical Abstract

1. Introduction

Recent studies highlighted the evidence that cancer is not only dependent on genetic mutations, but also influenced by the surrounding micro-environmental conditions [1]. Biomechanical forces can alter the conditions of tumor microenvironments, such as solid stress, high fluid pressure, increased interstitial flow, and matrix mechanics, thus, leading the cancer cells to spread to surrounding tissues and, eventually, to metastasize [2,3]. In recent years, a lot of studies analyzed the link between mechanical forces and tumorigenesis, finding correlations between changes in normal tissue architectures and the shift of such tissues to the precancerous state [1]. Collagen crosslinking, extracellular matrix (ECM) stiffening, and increased focal adhesions have also been found to be linked with breast tumorigenesis [4]. It is, thus, clear that mechanical forces and altered microenvironmental conditions play a role in tumorigenesis, and phenotypes may become more important over genotypes of the cancer cells [1]. Mechanical compression on cells can result in autolysis, promoting the recruitment of immune cells on the cancer tissues through the release of danger-associated signals during necrosis [5]. A lot of studies have been carried out highlighting the role of mechanical compression on both healthy and cancerous tissues, such as neurons [6], brain [7], fibroblasts [8,9], lung [10,11,12], breast [7,13], ovaries [14,15], and heart [16,17], resulting in inflammatory, late repair and fibrotic pathways in healthy tissues, and more invasive and metastatic forms in cancer tissues. Despite a wide typology of devices having been designed and tested to study the response and development of cell cultures under both cyclic and static compression [6,7,18,19,20], there is a lack of versatile systems that are fully compatible with standard multi-well cell culture protocols. Moreover, a lot of studies suggest that the magnitude of the applied compression stimulus could be set between 3 and 6.5 kPa, while this value could be expanded to the physiological 3.7–18.9 kPa estimated to occur in tumor environments [14,15,21,22,23]. For this reason, further studies must be carried out to assess the nature and level of mechanical compression which affects the tissue microenvironment in a noticeable way [3]. In this work, a versatile, dynamic cell culture system is presented, in which a hydrostatic compression stimulus can be applied in a controlled manner to a standard multi-well plate tissue, while working in a CO2 incubator. The plate can be placed inside a polymethyl methacrylate airtight chamber, inside which the hydrostatic pressure can be regulated through a diaphragm pump, which regulates the differential pressure level up to 12 kPa, and a proportional solenoid valve, which brings the chamber back to atmospheric pressure. The system is controlled by an Arduino Nano microcontroller, which acts on the pump and solenoid valve functioning times, and manages the feedback coming from a differential pressure sensor and a temperature sensor, acquiring environmental data inside the culture chamber. The system can be easily programmed with a laptop, through which it is possible to act on the duration of the compression stimulus, and on its duty cycle in the case of cyclic compression. Preliminary tests on cells were carried out to assess the biocompatibility of the device, ensuring the system worked in cyclic positive compression mode, trying to mimic the frequency of the human respiration rate.

2. Materials and Methods

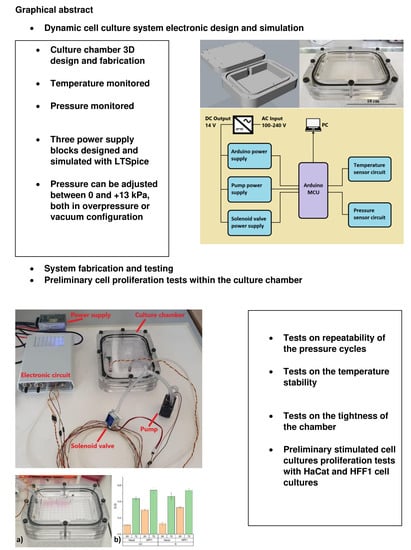
2.1. Culture Chamber Design and Fabrication

The cell culture chamber was designed through CAD software (Rhinoceros 5, Robert McNeel & Associates), and then manufactured with a numerically controlled milling machine (Benchman VMC 4000). The layout of the chamber is quite simple: it consists of a transparent box designed to contain a standard multi-well plate. Three Polymethylmethacrylate (PMMA) panels were arranged in a sandwich structure and then fixed with eight steel screws. The detailed development of the culture chamber is extensively discussed in [9].

2.2. Electronic Circuit Design and Fabrication

The block diagram of the system is shown in Figure 1. The core of the circuit is the Arduino Nano 3.0 board, which is a versatile chip based on the ATmega328 microcontroller. The board is connectable to a personal computer through a USB port, through which it is possible to upload the desired code written in C++. The board is also equipped with 8 analog input pins through which it is possible to read multiple analog signals coming from a wide variety of sensors and to convert them into a readable form, and 14 input/output digital pins, having the function to monitor their high or low state if in input mode, or to set a desired high or low state if in output mode. The system is equipped with a temperature sensor (Honeywell, Charlotte, NC, USA, HIH6130 series) to monitor the temperature inside the culture chamber during its operation, which communicates with Arduino by means of its I2C digital pins. A pressure sensor (NXP, Amsterdam, NL, MPX5100DP) is also connected to the culture chamber, to monitor the pressure reached by each cycle during its operation, communicating with Arduino through its analog pins. Both the sensors are powered by the board itself, which can provide two stable output voltages of +3 V and +5 V.
The platform is equipped with a pneumatic system to modify the pressure inside the culture chamber: a diaphragm pump (TCS Micropumps, Faversham, UK, D3K Series) increases (or decreases, depending on the application) the pressure to the desired value, while a normally closed proportional solenoid valve (255667, Burkert, Ingelfingen, DE) allows the pressure inside the chamber to go back to atmospheric pressure in a precise and controlled manner. Both the pump and the solenoid valve are each controlled by a dedicated circuit, controlled by Arduino, to set the desired timing for the pressure cycles, and in the case of the pump, the desired flow rate. The Arduino board can be powered in two different ways, either through the USB cable while connected to the PC, or with an external DC power source. This system is, thus, provided with an Arduino-dedicated DC power source, so that the PC can be eventually disconnected once the desired parameters are set. In the end, the system is powered by an AC/DC switching power supply (Mean Well, New Taipei City, TW, RS-25-12), that converts the AC main supply to 14 V DC (VDD). The complete electronic circuit, extensively discussed below, is shown in Figure 1, highlighting all the blocks described in this section. In the scheme, is an RGB LED connected to the digital pins D6, D7 and D8 of Arduino through three 220 Ω pull-up resistors, and their function is to present a different color during the pump and solenoid valve working periods, (red and blue, respectively), to better visualize the correct operation of the system.

2.3. Arduino External Power Supply

The Arduino board, as mentioned, can be powered by an external DC power source, whose voltage must fall within the range of 7–12 V. Since the switching power supply, providing energy for all the components of the circuit, has a DC output of 14 V, it was necessary to lower the value to the Arduino input range. The circuit, shown in Figure 2, was designed using a linear voltage regulator (LM317BT, STMicroelectronics, Geneva, CH). This device is maintained by default at a constant voltage of 1.25 V (VREF) between the output and the adjust pins (VOUT-VADJ), while the maximum voltage swing of the circuit is governed by the input voltage (VIN). A 100 nF bypass capacitor (C1) was used to reduce any alternating component of the input voltage, a 10 μF capacitor (C4) was placed between the adjust pin and ground to improve ripple rejection, and an output 1 μF capacitor (C9) was used to improve transient response. The circuit also had a pair of protection diodes, D1 and D2. The first one protects the regulator from the input short circuit, and the second one protects the output short circuit from capacitance discharging. The output voltage is related to the voltage divider made by the two resistors R4 and R1, and follows the ideal law:
V O U T = R 1 + R 4 R 4 · V R E F + I A D J · R 1 ,
where the second term is generally negligible, because it is generally two orders of magnitude lower than the first one, and R4 is recommended to be around 240 Ω by the manufacturer. Since a minimum output voltage close to 7 V is needed to power the Arduino board, one can easily find the desired minimum resistance value for R1. In this work, a 220 Ω resistor was used from the E12 series for R4, thus, providing a R1 value equal to 1012 kΩ, which involved a commercial 1 kΩ resistor from the E12 series.

2.4. Pump Power Supply

The circuit for the pump power supply was based on the same voltage regulator described in the previous section. The diaphragm pump has two different inlets and outlets which can be connected in series, if the application needs a higher maximum differential pressure/vacuum, together with a lower flow rate, or in parallel, if the application needs a lower maximum differential pressure/vacuum, but with a higher flow rate. In this work, the pump was connected in the parallel configuration, which provided a maximum flow rate of 3.5 l/min and a maximum differential pressure/vacuum of 0.41 Pa and −0.39 Pa, respectively.
The flow rate can be adjusted by acting on the pump voltage, which can be set from a minimum of 2 V to a maximum of 6 V. In Figure 3 the pump control circuit is shown, where the adjust resistance was replaced with a precision 1 kΩ 10-turn potentiometer (536-1-1-102, Vishay, Malvern, PA, USA) so as to have a linear variation on the output voltage. A protection diode D5 was placed across the pump connectors, to prevent any back voltage flowing during the switching-off transient phase of the pump. The VOUT pin was directly connected to the basis of a power BJT in Darlington configuration (TIP120, STMicroelectronics), and its collector was connected to VDD, together with the input pin of the voltage regulator. The emitter of the BJT was directly connected with the positive pump connection, while the negative connection was connected to the drain of an n-channel MOSFET (IRF510, Vishay), having a source directly connected to ground. The MOSFET gate was connected both to a 10 kΩ pull-down resistor, and to an Arduino digital pin D2. The BJT was used to increase the maximum current range of the circuit, thus making the current flow mainly across the BJT, instead of the voltage regulator. The MOSFET was used to act as a switch, being turned to its ON and OFF states by Arduino. The output voltage coming from the regulator, namely VOUT, dropped across the branch of the circuit, including VBE, VPUMP and VDS. When the potentiometer was set to its minimum value, the voltage regulator provided a minimum output voltage of 1.3 V. In this configuration, the BJT voltages would be VC = VDD = 14 V, VB = 1.3 V, and VE would be lower than VB, thus, making the BJT work in a forward active region. As said before, the MOSFET operated as a switch: when the digital pin D2 from Arduino provided a logic low state, and the transistor gate voltage would be VG = 0 V, thus, lower than the transistor threshold voltage (Vth), which turned out to be 4 V from the datasheet. In this condition, the MOSFET was in the OFF state, cutting off any current eventually flowing through the drain branch. When D2 provided a logic high state, the VG > Vth condition was satisfied, and the transistor switched to the ON state. More precisely, since the VDS voltage was never higher than VG-Vth during the system’s operation, the MOSFET always worked in the ohmic region during the ON state. As the potentiometer increased its resistance, VOUT increased as well, thus making the voltage across the pump reach a value sufficient to make its DC motor start to run, providing the minimum pump flow rate. In this condition, if the MOSFET was in the ON state, a current of the order of tens of milliamperes flowed in the branch, as highlighted in the LTSpice simulations of Section 3.1.

2.5. Solenoid Valve Power Supply

The solenoid valve circuit, shown in Figure 4, has the same architecture as the pump power supply, but with some slight differences. The solenoid valve had a greater DC impedance with respect to the pump, (137 Ω, compared to 10.3 Ω).
This translated into the need for a higher VOUT to get a sufficient drop in voltage across the solenoid valve (VSV) to make the minimum required current to start opening its orifice flow through it. The 1 kΩ potentiometer was, thus, no longer sufficient for this purpose and a higher resistance was needed. For this reason, a 1 kΩ resistor was connected in series with the potentiometer, thus making the resistance range vary from a minimum of 1 kΩ to a maximum of 2 kΩ, preserving the precision of the 10-turn potentiometer on the desired resistance range. In this way, the VOUT could span from a minimum of 7.23 V to a maximum of 12.46 V, as highlighted in the simulation chart in Figure 5, providing a precise current regulation on the solenoid valve current, which translates into a precise regulation on its orifice opening.

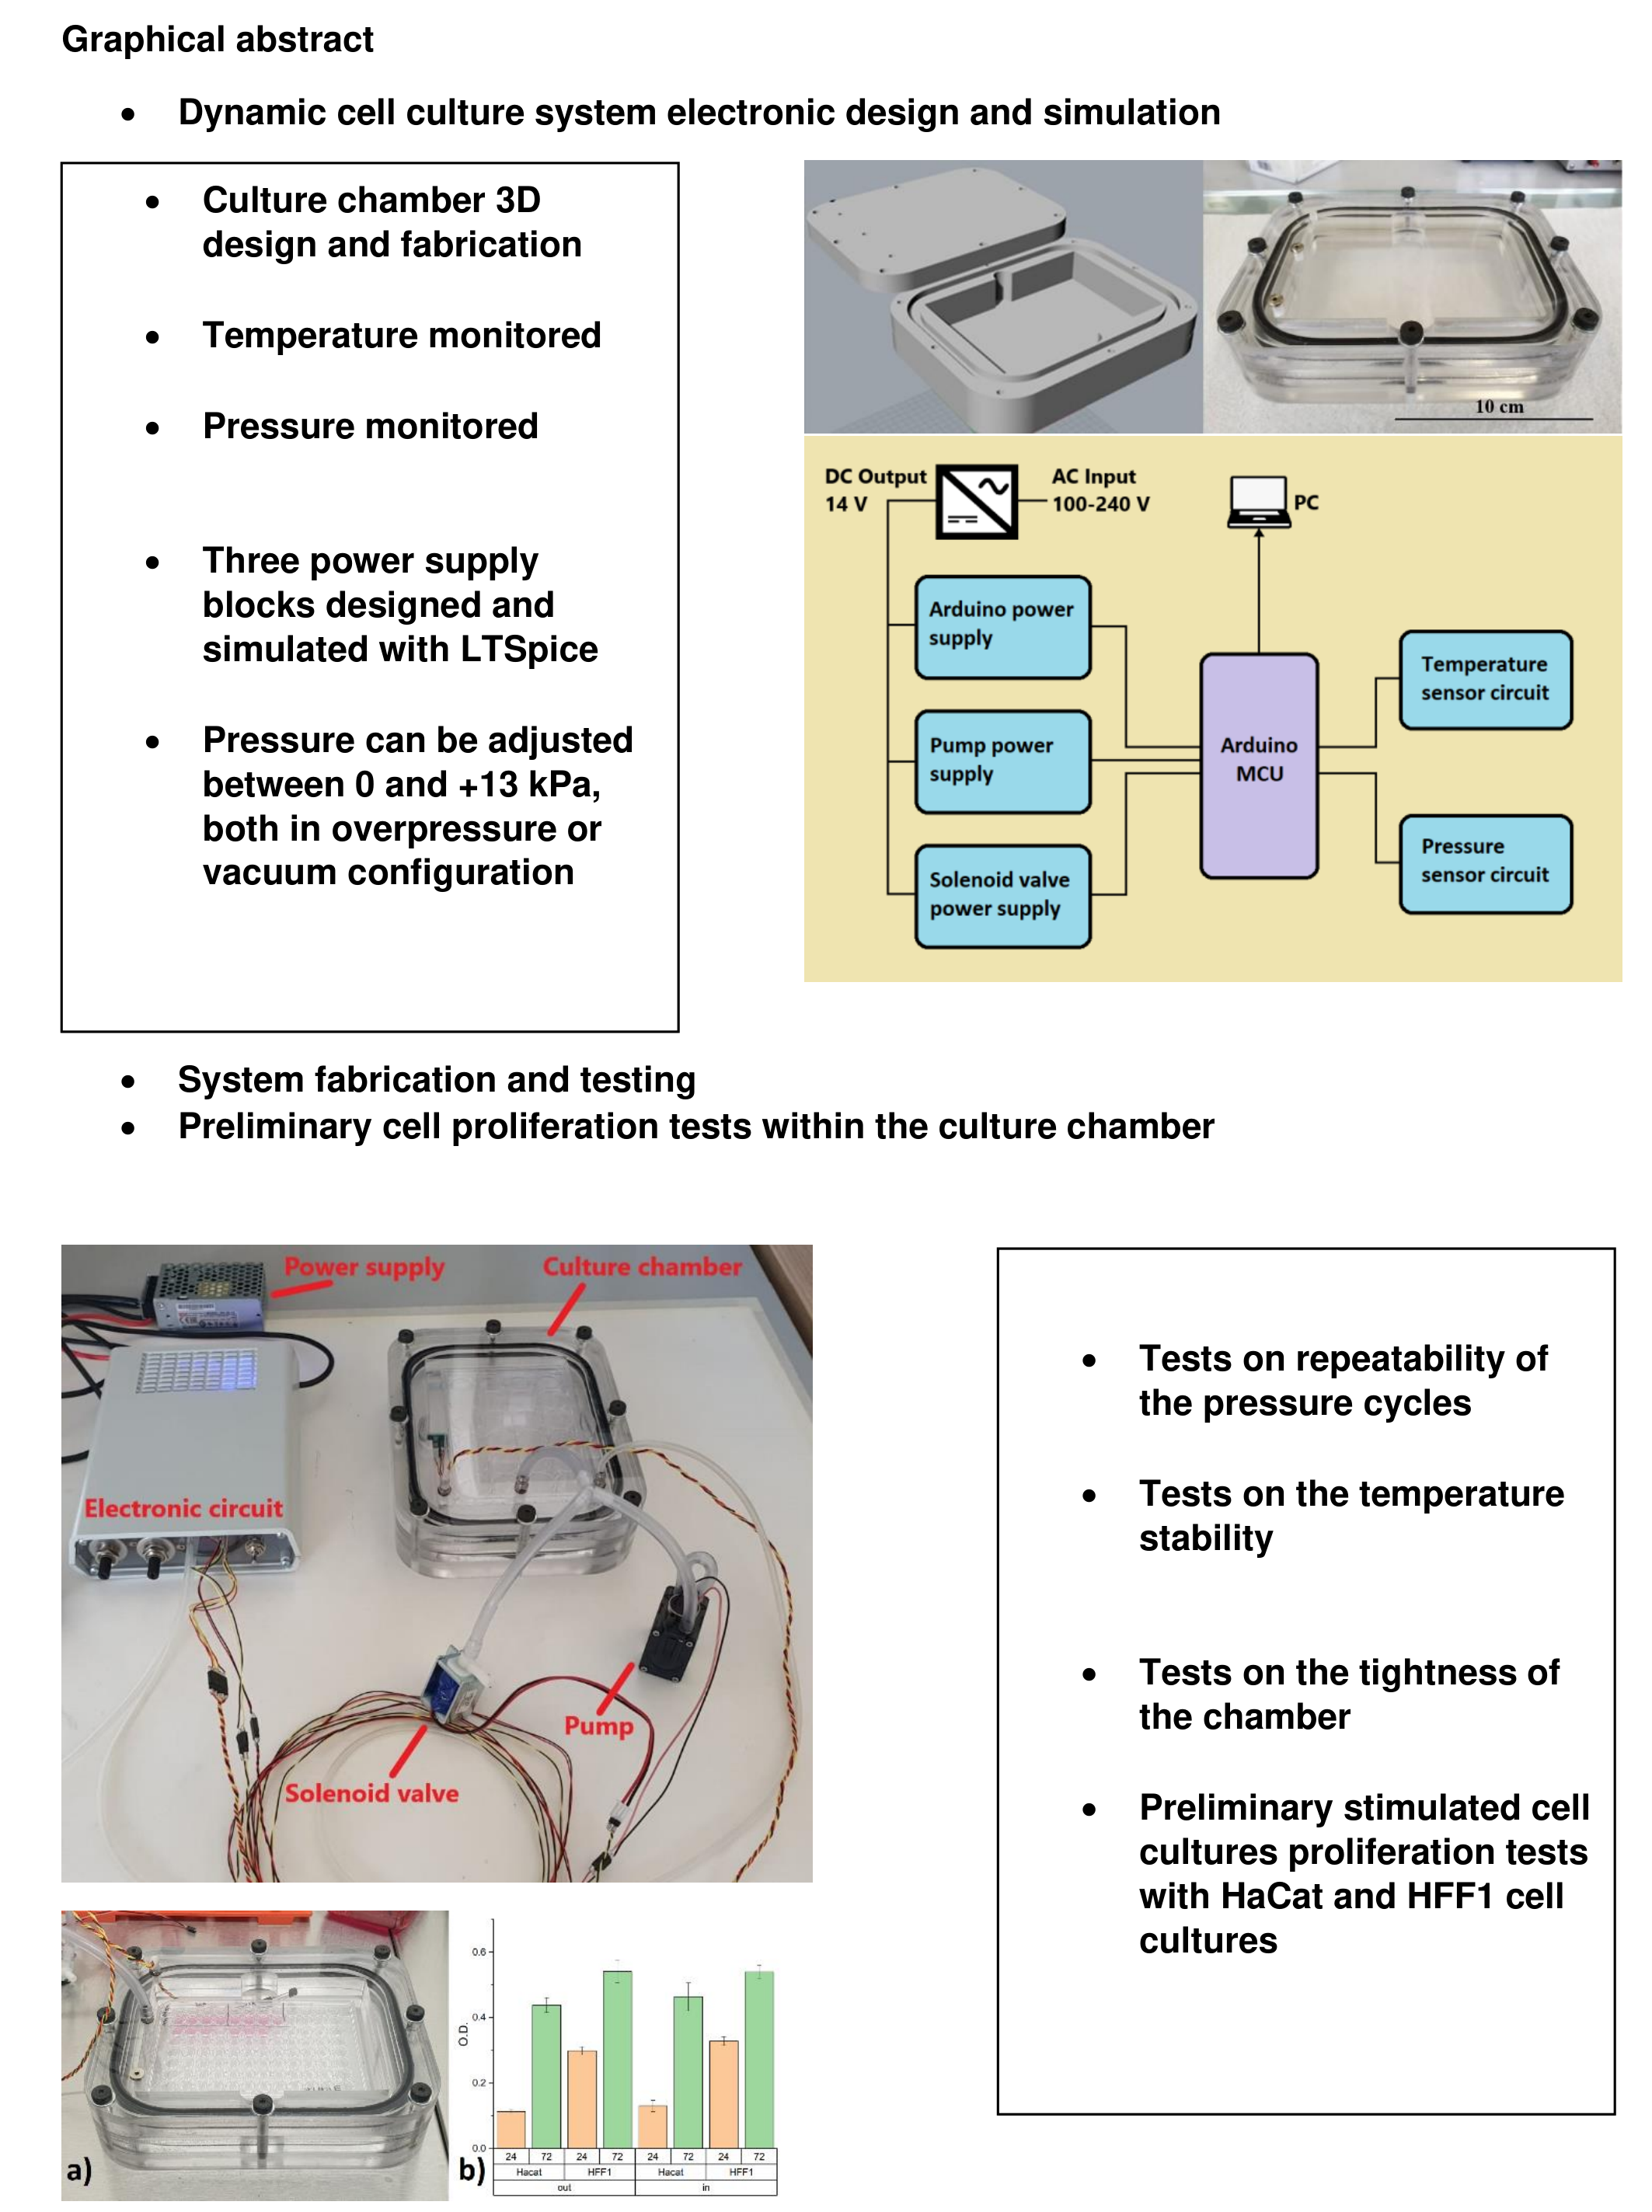
2.6. PCB Design and Fabrication
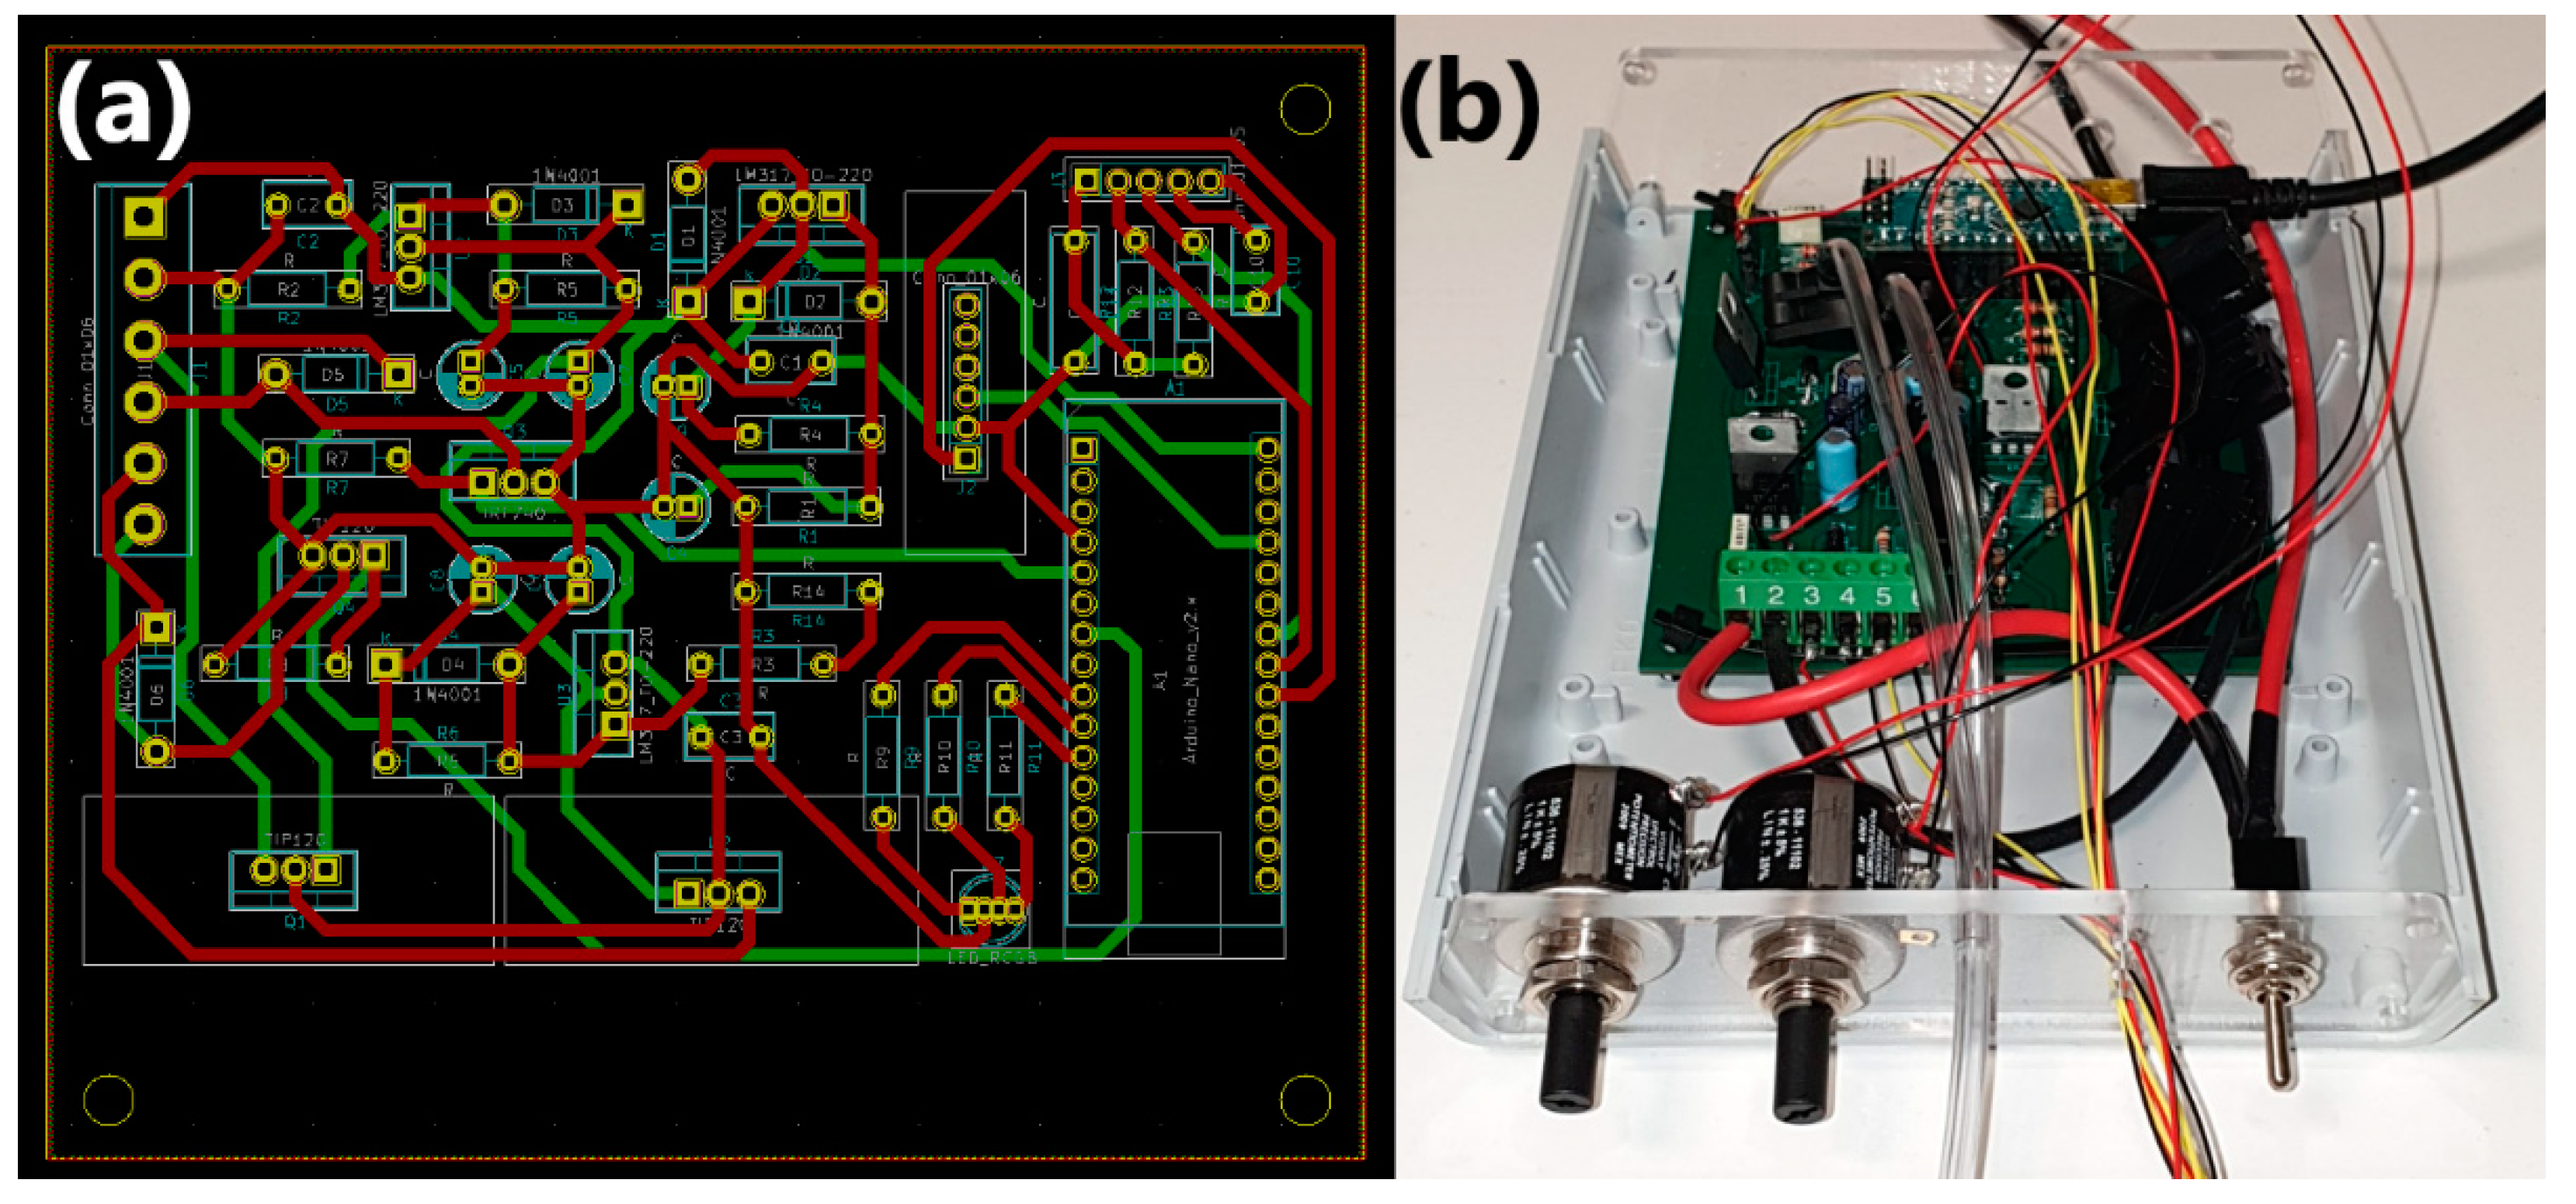
The circuit components were arranged on a PCB board, using an open-source ECAD software (KiCad v5.1.6), as shown in Figure 6a. As mentioned before, the current range of the electronic circuit was extended below the voltage regulator maximum current ratings (2.2 A, from datasheet) with the use of power BJT and MOSFET transistors, with maximum current ratings of 5 A and 5.6 A, respectively, well below both the pump and the solenoid valve maximum current ratings, which were lower than 600 mA. This choice was based on making the system open to the use of pumps demanding higher powers, with higher flow rates and maximum differential pressure capabilities.
For this reason, the thickness and width of the PCB copper tracks were chosen to be 0.89 μm and 1 mm, respectively, to sustain a continuous load current of 3.5 A, with a theoretical maximum temperature rise of 20 °C, and 5 A with a temperature rise of 50 °C, which, in both cases, was acceptable for the application.
Moreover, since the circuit was designed to make the pump and the solenoid valve work in alternating cycles, this provided an additional margin to the PCB track power rating. A heat sink was also glued with thermal paste on all the power transistors of the circuit, to further decrease the temperature rise of such components during their operation. The components were soldered on the PCB board with a soldering machine (Hot air soldering station 124-4134, RS PRO) and mounted on a compact plastic box, as shown in Figure 6b. The system could be switched on with a two-state switch mounted on the front panel of the enclosure. The system assembled is shown in Figure 7.

2.7. Arduino Sketch

The Arduino board can be openly programmed to make the pump and the solenoid valve work for the desired amount of time. The Arduino sketch, summarized in the flow chart of Figure 8, shows the loop function performed by the microcontroller. In the program setup, the two periods regarding the pumping time and the solenoid valve functioning time were set as timer_P and timer_SV, together with a generic time variable defined as t. The temperature sensor and pressure sensor libraries were included, as well in the program, to ensure the Arduino board reads the output variables coming from such sensors. The loop function began with the pump in the ON state and the solenoid valve in the OFF state. The RGB LED highlighted the state providing a red-light output, and the variable t was set to zero. The time duration of this cycle was constantly checked, and the variable t was increased until it reached the value defined in timer_P. Subsequently, the microcontroller read the analog signal coming from the pressure sensor, converting it into a readable form on the Arduino Serial Monitor, and read the I2C signal coming from the temperature sensor, printing it on the Arduino Serial Monitor as well. The pump then went into the OFF state, while the solenoid valve was turned to ON. The RGB LED now provided a blue light, and the variable t was again set to zero. As before, the time duration of this cycle was constantly checked until the variable t reached the value defined in timer_SV, when the loop function then started again. The complete sketch is available in Supplementary Material.

2.8. Cell Viability Assay

A preliminary test on cell proliferation was carried out. Two normal cell lines were selected, namely, the human epidermal keratinocyte line (HaCaT) and the human foreskin fibroblast line (HFF-1), following the protocol reported in reference [9]. The test was carried out by selecting a positive pressure cycling mode and setting the final pressure to 12 kPa. The culture chamber was placed inside a CO2 incubator, while the electronic circuit was kept outside of it.

3. Results and Discussion

3.1. LTSpice Simulations

All the power supply circuits were simulated with LTSpice (Analog Devices, Wilmington, MA, USA), to highlight the dependence of the voltage regulator output on the resistance on the adjust branch of the circuit. The results of the simulation are reported in Table 1, where the voltage regulator VOUT for five different values of the adjust resistance of the simulated circuits, ranging between 1 Ω and 1 kΩ, is shown. In the case of the Arduino Power supply, the latter resistance value provided an output voltage of 7.2 V, which fell into the Arduino input voltage range, thus confirming the choice of a fixed 1 kΩ resistor for the adjust branch of this main block. Since the pump power supply circuit was identical to the Arduino one, the VOUT sweep was identical as well, ranging from 1.3 to 7.2 V, while the solenoid valve power supply, having an additional 1 kΩ resistor placed in a series in the potentiometer branch, provided a higher output voltage, ranging from 7.2 to 12.5 V.
In Figure 5 the voltage, and the current dependence of both the pump and the solenoid valve as a function of the MOSFET gate voltage operated by Arduino, are shown. The devices were modeled with the associated DC impedances, which turned out to be 10.3 Ω for the pump and 137 Ω for the solenoid valve. As already mentioned, for both device circuits, the adjust resistance was selected by the precision 1 k Ω potentiometer. An increase in its resistance thus translated into an increase in the voltage across the two devices, as shown in the simulations, thus, making the pump vary its flow rate from minimum to maximum accordingly, and making the solenoid valve open proportionally to the current flowing through it.

3.2. Tightness of the Culture Chamber

A preliminary tightness test was carried out on the system with and without the use of the temperature sensor feed-through, to assess the change in tightness due to the permeation rate of the sealing PDMS inside it.
As shown in the charts in Figure 9, the chamber was connected with an external pump providing a maximum differential pressure of about 30 kPa, and, then, isolated, and the pressure data acquired over time. In the first case, shown in Figure 9a, the temperature sensor feed-through was replaced with a commercial sealing cap. The chamber showed a relatively slow leakage trend over time. In the chart, three main trends were highlighted with a linear fit of the curve, showing a more pronounced leakage rate of −7.2·10−2 Pa/s in the range 30–18 kPa, −2.2·10−2 Pa/s in the range 6.6–4.6 kPa and −1.1·10−2 Pa/s in the range 1.5–0.5 kPa. In the second case, shown in Figure 9b, the temperature sensor feed-through was connected, and the leakage rate showed a considerable increase. In the figure, the same three main trends were highlighted with a linear fit of the curve, showing a more pronounced leakage rate with respect to the first configuration, which turned out to be −6.8 Pa/s in the range 30 kPa–18 kPa, −7.7·10−1 Pa/s in the range 6.6–4.6 kPa and −8.2·10−2 Pa/s in the range 1.5–0.5 kPa. All the leakage trends are highlighted in Table 2.
Considering the system’s functioning time, which in our case was programmed to make pressure cycles with a pumping time of 2.5 s and an evacuation time of 2.5 s, reaching a selectable final pressure in the order of tens of kPa, the leakage rate of the chamber was, thus, negligible for the application.

3.3. Stability of the Pressure Cycles

Tests on the repeatability of the final differential pressure reached inside the chamber per cycle over time were carried out in two configurations. In the first one, the pump was connected in overpressure mode, thus, making the pressure inside the chamber increase to a value set to 10.7 kPa. The results are highlighted in the chart in Figure 10a, showing a stable trend over time, with a standard deviation σ = 94.1 Pa and a maximum absolute pressure oscillation of 310 Pa. In the second case, the pump was connected in vacuum mode, thus, making the differential pressure inside the chamber decrease.
The result is highlighted in Figure 10b, showing a constant trend, with a standard deviation of maximum pressure oscillation of σ = 93.5 Pa and a maximum absolute pressure oscillation of 410 Pa. The Arduino board analog to digital converter (ADC) had a 10-bit resolution, which meant that the map function of the Arduino sketch was able to detect 5V/1024 bits = 4.88 mV of variation on the analog pins. The pressure sensor also had a sensitivity of 4.5 mV/Pa. For this reason, a 100 Pa oscillation was expected in the data read by Arduino from the chamber pressure. Additional pressure variations could be induced in long-term measurements, due to intraday barometric pressure variations, which could add an additional 100 Pa shift [24].

3.4. Temperature Stability

The culture chamber has to have a stable temperature, compatible with the growth of a cell culture, which is typically performed inside a CO2 incubator with a controlled temperature set to 37 °C. For this reason, temperature stability tests were conducted on the system to highlight any temperature changes induced both by the heating of the pump and the solenoid valve during their operation and also by the pressure cycles themselves. The system was installed to work in a CO2 incubator (ThermoFisher Scientific, Waltham, MA, USA, Heracell® 150i), and a second identical temperature sensor was placed in the surrounding environment to monitor both the temperature inside and outside the chamber. The resulting temperature profiles are highlighted in Figure 11, showing a mean temperature of 37.3 °C with a standard deviation σ = 2.6·10−2 °C and a maximum absolute temperature shift of 7.0·10−2 °C in the case of the measured temperature inside the chamber. Outside the chamber there was a mean temperature of 37.4 °C, with a standard deviation of σ = 3.4·10−2 °C and a maximum absolute temperature shift of 0.1 °C for the measured temperature, This demonstrated that neither the operation of the system nor the pressure cycles affected the temperature inside the chamber significantly. Moreover, both the standard deviation and the maximum absolute temperature shift were way smaller than the temperature sensor precision (±0.5 °C), thus further reinforcing the case.

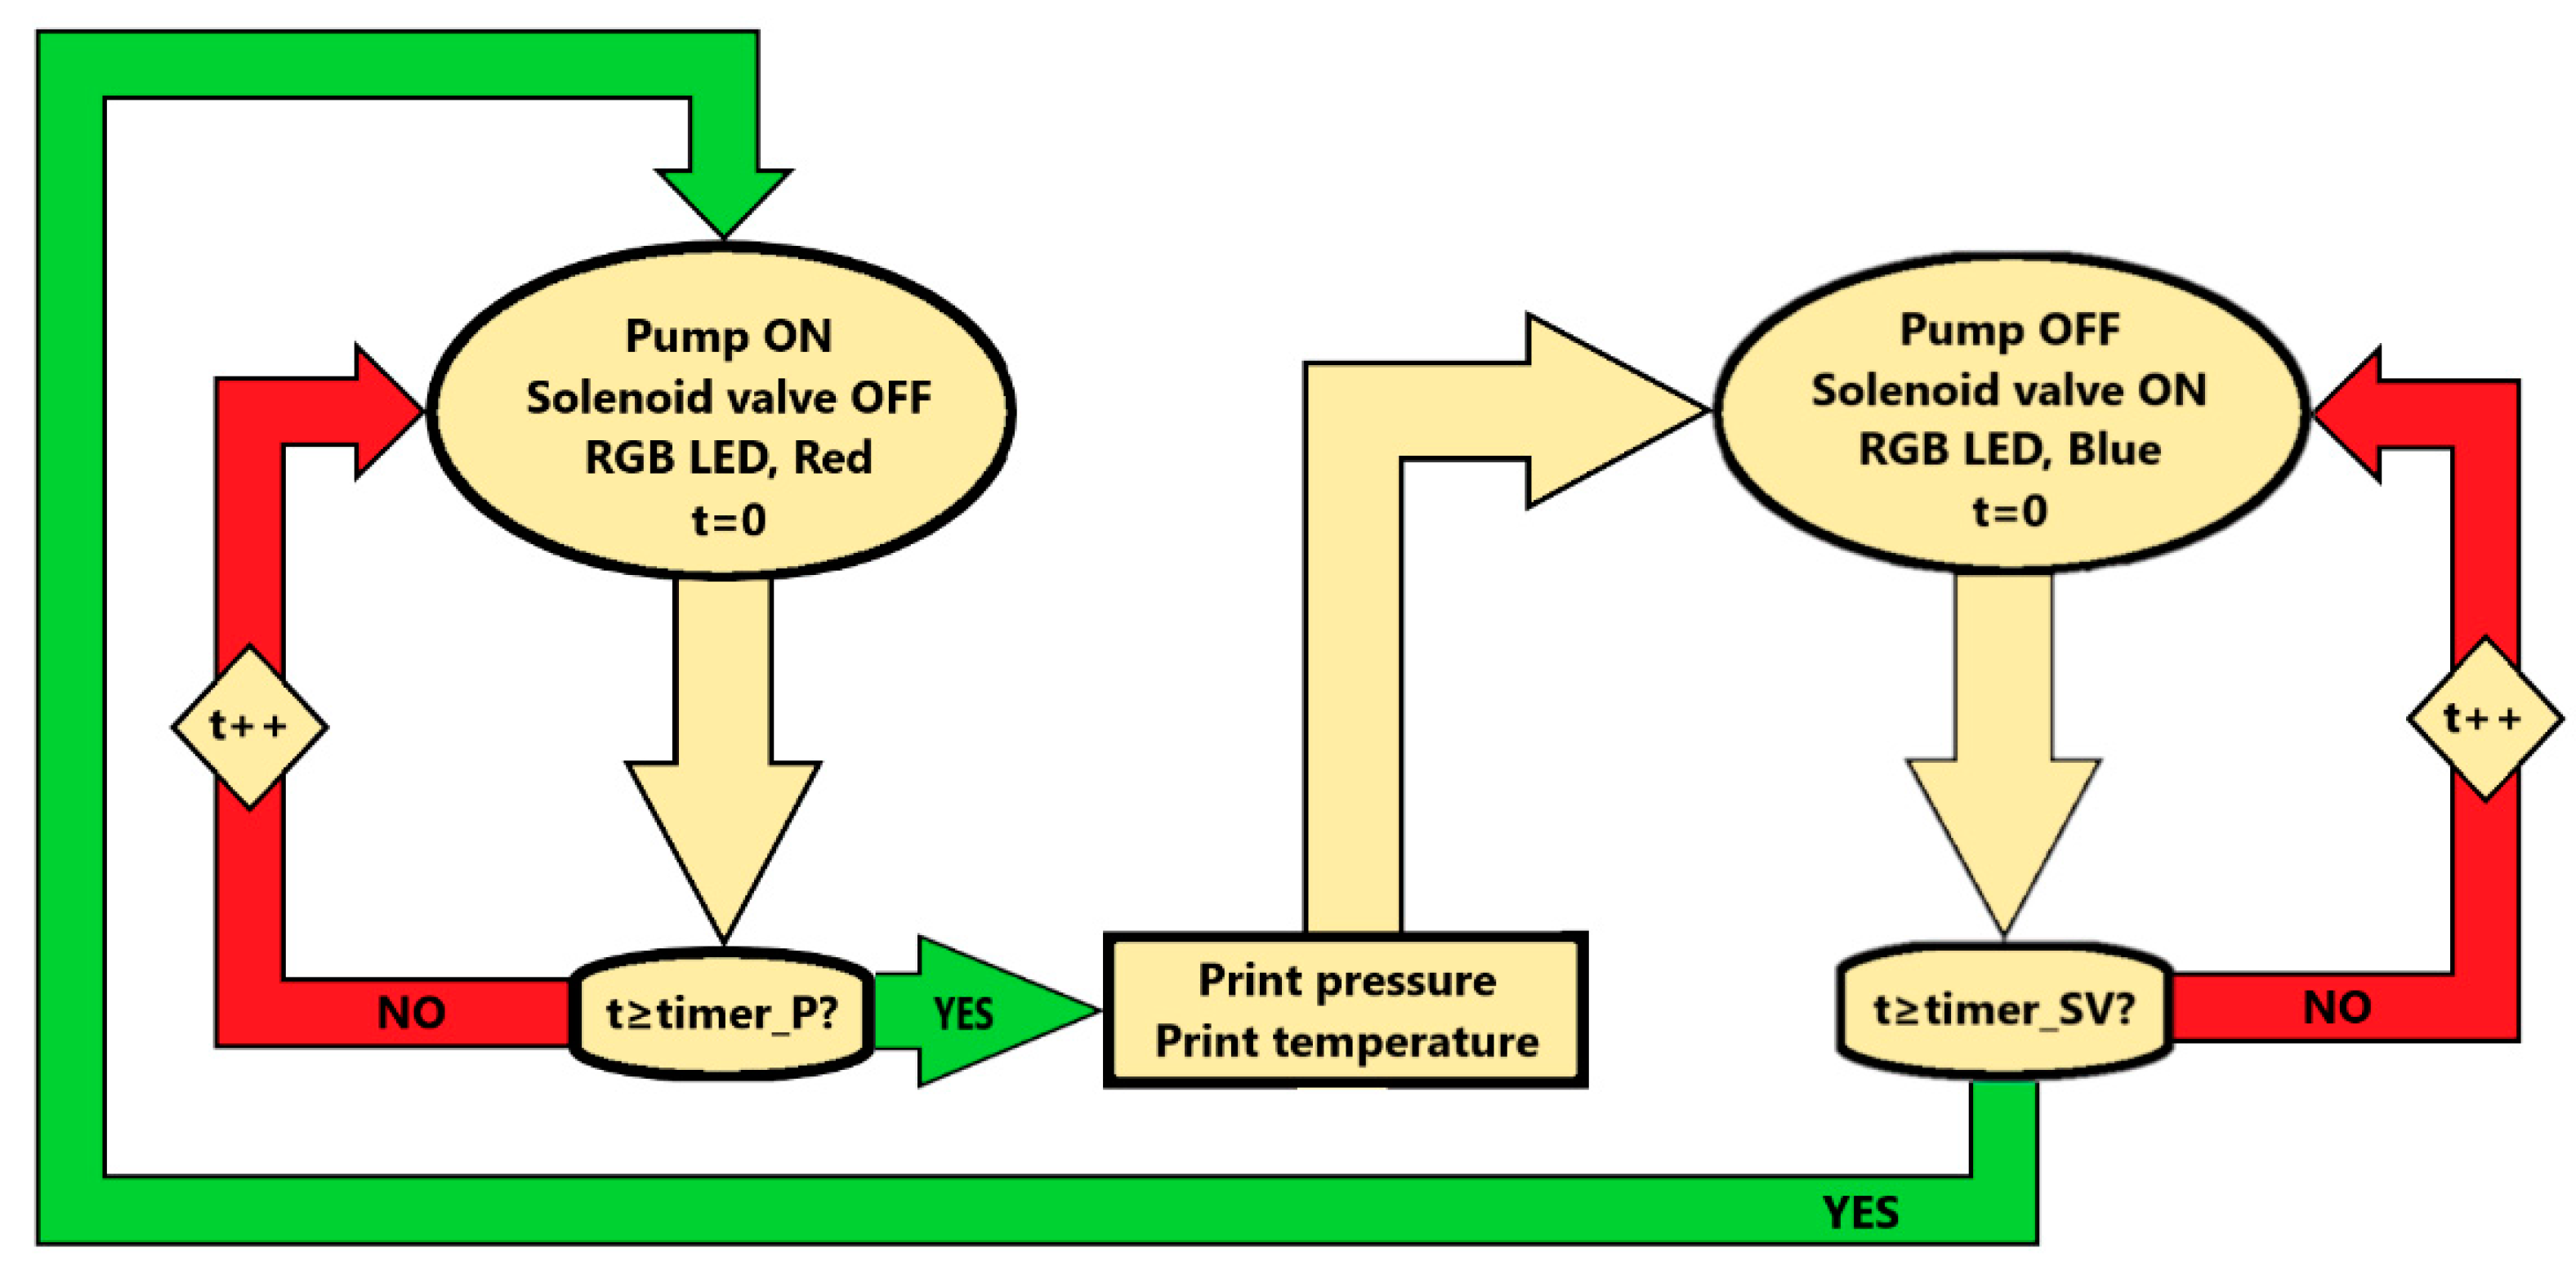
3.5. HaCaT and HFF-1 Proliferation Test

As previously mentioned, preliminary tests on cells were performed using the system in overpressure cycling configuration, reaching a maximum differential pressure of 12 kPa per cycle, and a period of 5 s. Further details about the tests performed are extensively discussed in [9].

4. Conclusions

This work showed the possibility of designing and implementing, with cheap and easily programmable components, a system capable of mechanically stimulating a cell culture by varying the hydrostatic pressure inside the culture chamber. The system showed very good repeatability of the pressure cycles when used, both in positive and negative differential pressure configurations, and an excellent tightness for the application for which it was intended. No substantial variations in the temperature inside the culture chamber were observed during its operation, thus showing that the system is suitable for hosting a cell culture without altering the normal temperature conditions of a standard CO2 incubator. As highlighted in [9], the system also showed the feasibility of applying a cyclic increase of the hydrostatic pressure without causing damage to the cells. Given the absence of effects on cell proliferation, the cyclic increase of the hydrostatic pressure would probably not affect this parameter, but could influence cytoskeletal stiffness/rearrangements, which will be monitored in future tests. Furthermore, cell migration and wound healing will be analyzed to assess the effects of cytoskeletal changes on these features. Future experiments will be performed using different values of hydrostatic pressure, involving culture experiments of human alveolar epithelial cells and human adenocarcinomic alveolar epithelial cells (A549 cell line) inside the chamber, studying key parameters related to their growth. The versatility of the circuit makes it suitable for working at higher pressure values or flow rates, simply by replacing the pump used in this work with a higher powered one with the same voltage characteristics.

Supplementary Materials

The following supporting information can be downloaded at: https://www.mdpi.com/article/10.3390/electronics12010073/s1.

Author Contributions

Conceptualization, F.F. and S.L.M.; Supervision, F.F., G.C., S.L.M. and M.C.; Project administration, C.F.P.; Funding acquisition, C.F.P.; Writing of the manuscript, N.C.; Review and editing, F.F., G.C., S.L.M. and M.C.; Experimental activities and data analysis, N.C. All authors wrote the manuscript and gave approval to the final version of the manuscript. All authors have read and agreed to the published version of the manuscript.

Funding

The work was coordinated by M.C. and C.F. Pirri, and was performed in the framework of, and financed by, the POLITO BIOMed LAB. It was also financed by the Politecnico di Torino, DEFLeCT (“Advanced platform for the early detection of not small cells lung cancer”) project, and the Piedmont Region in the framework of the “Health and WellBeing” Platform project.

Data Availability Statement

Not applicable.

Conflicts of Interest

The authors declare no conflict of interest.

References

  1. Bissell, M.J.; Hines, W.C. Why don’t we get more cancer? A proposed role of the microenvironment in restraining cancer progression. Nat. Med. 2011, 17, 320–329. [Google Scholar] [CrossRef] [PubMed] [Green Version]
  2. Polacheck, W.J.; Li, R.; Uzel, S.G.M.; Kamm, R.D. Microfluidic platforms for mechanobiology. Lab Chip 2013, 13, 2252. [Google Scholar] [CrossRef] [PubMed] [Green Version]
  3. Wang, K.; Cai, L.-H.; Lan, B.; Fredberg, J.J. Hidden in the mist no more: Physical force in cell biology. Nat. Methods 2016, 13, 124–125. [Google Scholar] [CrossRef] [PubMed] [Green Version]
  4. Levental, K.R.; Yu, H.; Kass, L.; Lakins, J.N.; Egeblad, M.; Erler, J.T.; Fong, S.F.; Csiszar, K.; Giaccia, A.; Weninger, W.; et al. Matrix Crosslinking Forces Tumor Progression by Enhancing Integrin Signaling. Cell 2009, 139, 891–906. [Google Scholar] [CrossRef] [Green Version]
  5. Takao, S.; Taya, M.; Chiew, C. Mechanical stress-induced cell death in breast cancer cells. Biol. Open 2019, 8, bio.043133. [Google Scholar] [CrossRef] [Green Version]
  6. Hosmane, S.; Fournier, A.; Wright, R.; Rajbhandari, L.; Siddique, R.; Yang, I.H.; Ramesh, K.T.; Venkatesan, A.; Thakor, N. Valve-based microfluidic compression platform: Single axon injury and regrowth. Lab Chip 2011, 11, 3888. [Google Scholar] [CrossRef]
  7. Tse, J.M.; Cheng, G.; Tyrrell, J.A.; Wilcox-Adelman, S.A.; Boucher, Y.; Jain, R.K.; Munn, L.L. Mechanical compression drives cancer cells toward invasive phenotype. Proc. Natl. Acad. Sci. USA 2012, 101, 911–916. [Google Scholar] [CrossRef] [Green Version]
  8. Kalli, M.; Papageorgis, P.; Gkretsi, V.; Stylianopoulos, T. Solid Stress Facilitates Fibroblasts Activation to Promote Pancreatic Cancer Cell Migration. Ann. Biomed. Eng. 2018, 46, 657–669. [Google Scholar] [CrossRef]
  9. Parmeggiani, M.; Villata, S.; Baruffaldi, D.; Marasso, S.L.; Canavese, G.; Cocuzza, M.; Pirri, C.F.; Frascella, F. A programmable culture platform for hydrostatic stimulation and in situ pH sensing of lung cancer cells with organic electrochemical transistors. Micro Nano Eng. 2022, 16, 100147. [Google Scholar] [CrossRef]
  10. Lan, B.; Mitchel, J.A.; O’Sullivan, M.J.; Park, C.Y.; Kim, J.H.; Cole, W.C.; Butler, J.P.; Park, J.A. Airway epithelial compression promotes airway smooth muscle proliferation and contraction. Am. J. Physiol. -Lung Cell. Mol. Physiol. 2018, 315, L645–L652. [Google Scholar] [CrossRef]
  11. Marozkina, N.; Bosch, J.; Cotton, C.; Smith, L.; Seckler, J.; Zaman, K.; Rehman, S.; Periasamy, A.; Gaston, H.; Altawallbeh, G.; et al. Cyclic compression increases F508 Del CFTR expression in ciliated human airway epithelium. Am. J. Physiol. -Lung Cell. Mol. Physiol. 2019, 317, L247–L258. [Google Scholar] [CrossRef] [PubMed]
  12. Kılıç, A.; Ameli, A.; Park, J.A.; Kho, A.T.; Tantisira, K.; Santolini, M.; Cheng, F.; Mitchel, J.A.; McGill, M.; O’Sullivan, M.J.; et al. Mechanical forces induce an asthma gene signature in healthy airway epithelial cells. Sci Rep. 2020, 10, 966. [Google Scholar] [CrossRef] [PubMed] [Green Version]
  13. Luo, M.; Ho, K.K.; Tong, Z.; Deng, L.; Liu, A.P. Compressive Stress Enhances Invasive Phenotype of Cancer Cells via Piezo1 Activation. Cell Biol. 2019. Preprint. [Google Scholar] [CrossRef] [Green Version]
  14. Novak, C.M.; Horst, E.N.; Lin, E.; Mehta, G. Compressive Stimulation Enhances Ovarian Cancer Proliferation, Invasion, Chemoresistance, and Mechanotransduction via CDC42 in a 3D Bioreactor. Cancers 2020, 12, 1521. [Google Scholar] [CrossRef] [PubMed]
  15. Asem, M.; Young, A.; Oyama, C.; ClaureDeLaZerda, A.; Liu, Y.; Ravosa, M.; Gupta, V.; Jewell, A.; Khabele, D.; Stack, M.S. Ascites-induced compression alters the peritoneal microenvironment and promotes metastatic success in ovarian cancer. Sci Rep. 2020, 10, 11913. [Google Scholar] [CrossRef] [PubMed]
  16. Carlos-Oliveira, M.; Lozano-Juan, F.; Occhetta, P.; Visone, R.; Rasponi, M. Current strategies of mechanical stimulation for maturation of cardiac microtissues. Biophys. Rev. 2021, 13, 717–727. [Google Scholar] [CrossRef] [PubMed]
  17. Lui, C.; Chin, A.F.; Park, S.; Yeung, E.; Kwon, C.; Tomaselli, G.; Chen, Y.; Hibino, N. Mechanical stimulation enhances development of scaffold-free, 3D-printed, engineered heart tissue grafts. J. Tissue Eng. Regen. Med. 2021, 15, 503–512. [Google Scholar] [CrossRef]
  18. Kim, Y.C.; Kang, J.H.; Park, S.J.; Yoon, E.S.; Park, J.K. Microfluidic biomechanical device for compressive cell stimulation and lysis. Sens. Actuators B Chem. 2007, 128, 108–116. [Google Scholar] [CrossRef]
  19. Lee, D.; Erickson, A.; You, T.; Dudley, A.T.; Ryu, S. Pneumatic microfluidic cell compression device for high-throughput study of chondrocyte mechanobiology. Lab Chip 2018, 18, 2077–2086. [Google Scholar] [CrossRef]
  20. Hsieh, H.Y.; Camci-Unal, G.; Huang, T.W.; Liao, R.; Chen, T.J.; Paul, A.; Tseng, F.G.; Khademhosseini, A. Gradient static-strain stimulation in a microfluidic chip for 3D cellular alignment. Lab Chip 2014, 14, 482–493. [Google Scholar] [CrossRef]
  21. Klymenko, Y.; Wates, R.B.; Weiss-Bilka, H.; Lombard, R.; Liu, Y.; Campbell, L.; Kim, O.; Wagner, D.; Ravosa, M.J.; Stack, M.S. Modeling the effect of ascites-induced compression on ovarian cancer multicellular aggregates. Dis. Model. Mech. 2018, 11, dmm034199. [Google Scholar] [CrossRef] [PubMed] [Green Version]
  22. Bregenzer, M.E.; Horst, E.N.; Mehta, P.; Novak, C.M.; Repetto, T. The Role of Cancer Stem Cells and Mechanical Forces in Ovarian Cancer Metastasis. Cancers 2019, 11, 1008. [Google Scholar] [CrossRef] [PubMed] [Green Version]
  23. Jain, R.K.; Martin, J.D.; Stylianopoulos, T. The Role of Mechanical Forces in Tumor Growth and Therapy. Annu. Rev. Biomed. Eng. 2014, 16, 321–346. [Google Scholar] [CrossRef] [PubMed] [Green Version]
  24. Hintz, K.S.; Vedel, H.; Kaas, E. Collecting and processing of barometric data from smartphones for potential use in numerical weather prediction data assimilation. Meteorol. Appl. 2019, 26, 733–746. [Google Scholar] [CrossRef]
Figure 1. Electronic diagram of the system.
Electronics 12 00073 g001
Figure 2. Voltage regulator circuit for Arduino power supply.
Electronics 12 00073 g002
Figure 3. Pump power supply and control circuit operated by Arduino digital pin D2.
Electronics 12 00073 g003
Figure 4. Solenoid valve power supply and control circuit operated by Arduino digital pin D4.
Electronics 12 00073 g004
Figure 5. LTSpice simulation output data. (a) Arduino digital pin D2 and D4 voltage over time. (b) Pump (solid) and solenoid valve (dashed) voltage over time as a function of the adjust resistance. (c,d) Pump and solenoid valve current over time as a function of the adjust resistance.
Electronics 12 00073 g005
Figure 6. (a) PCB tracks designed through KiCad. The red tracks are arranged on the top layer, while the green ones are arranged on the bottom layer. (b) PCB assembled and mounted on a plastic box.
Electronics 12 00073 g006
Figure 7. Complete system mounted, with all its main parts.
Electronics 12 00073 g007
Figure 8. Arduino sketch showing the program loop function.
Electronics 12 00073 g008
Figure 9. (a) Chamber leakage as a function of time without temperature PDMS feed-through. (b) Chamber leakage with temperature feed-through plugged on the chamber lid.
Electronics 12 00073 g009
Figure 10. (a) Differential pressures reached by each cycle inside the chamber over time, with the pump mounted in overpressure configuration. (b) The same experiment, with the pump mounted in vacuum configuration.
Electronics 12 00073 g010
Figure 11. Temperature profiles of the system while working in a CO2 incubator set to 37 °C. The black line shows the temperature over time inside the culture chamber, while the red one shows the temperature of the surrounding air.
Electronics 12 00073 g011
Table 1. LTSpice simulation data, showing the voltage regulator output voltage for all three main blocks of the electronic circuit.
ADJ ResistanceVOUT, Arduino
Power Supply
(R1)
VOUT, Pump
Power Supply
(R2)
VOUT, Valve
Power Supply
(R3)
1 Ω1.3 V1.3 V7.2 V
200 Ω2.49 V2.49 V8.4 V
400 Ω3.7 V3.7 V9.6 V
600 Ω4.7 V4.7 V10.8 V
800 Ω
1 kΩ
6.1 V
7.2 V
6.1 V
7.2 V
12.0 V
12.5 V
Table 2. Leakage rates of the chamber with and without temperature sensor feed-through.
Pressure RangeLeakage Rate without T
Sensor
Leakage Rate with T
Sensor
30–18 kPa−7.2·10−2 Pa/s−6.8 Pa/s
6.6–4.6 kPa−2.2·10−2 Pa/s−7.7·10−1 Pa/s
1.5–0.5 kPa−1.1·10−2 Pa/s−8.2·10−2 Pa/s
Disclaimer/Publisher’s Note: The statements, opinions and data contained in all publications are solely those of the individual author(s) and contributor(s) and not of MDPI and/or the editor(s). MDPI and/or the editor(s) disclaim responsibility for any injury to people or property resulting from any ideas, methods, instructions or products referred to in the content.

