

Wafer Surface Defect Detection Based on Feature Enhancement and Predicted Box Aggregation
1
School of Computer Science and Technology, Soochow University, Suzhou 215006, China
2
School of Computer Science and Engineering, Changshu Institute of Technology, Suzhou 215500, China
3
ENGITIST CORPORATION, Suzhou 215533, China
*
Author to whom correspondence should be addressed.
Electronics 2023, 12(1), 76; https://doi.org/10.3390/electronics12010076
Submission received: 2 December 2022
/
Revised: 20 December 2022
/
Accepted: 21 December 2022
/
Published: 25 December 2022
(This article belongs to the Special Issue Deep Learning for Computer Vision)
Abstract
:For wafer surface defect detection, a new method based on improved Faster RCNN is proposed here to solve the problems of missing detection due to small objects and multiple boxes detection due to discontinuous objects. First, focusing on the problem of small objects missing detection, a feature enhancement module (FEM) based on dynamic convolution is proposed to extract high-frequency image features, enrich the semantic information of shallow feature maps, and improve detection performance for small-scale defects. Second, for the multiple boxes detection caused by discontinuous objects, a predicted box aggregation method is proposed to aggregate redundant predicted boxes and fine-tune real predicted boxes to further improve positioning accuracy. Experimental results show that the mean average precision of the proposed method, when validated on a self-developed dataset, reached 87.5%, and the detection speed was 0.26 s per image. The proposed method has a certain engineering application value.
1. Introduction
Wafer surface defect detection is a key link in the semiconductor-manufacturing process. It can provide timely feedback of product-quality information, determine causes of defects in accordance with each defect type and location, and correct operations as early as possible to avoid huge losses [1]. Wafer surface defects can be divided into the following categories: (1) Particles: they may be caused by dust in the air that adheres to the wafer surface or impacts of external sharp objects, and they are mostly round and characterized by small scale; (2) Scratches: most of them are caused by improper instrument operation, and they are linear and exhibit large spans and discontinuity; (3) Ripples: they are mainly caused by film interference due to the coating defects of each layer, and they are characterized by wavy edges and low contrast with the background; (4) Stains: they are irregular in shape and large in area due to the residual dirt of the etching solution. These defect types are shown in Figure 1. With the rapid development of the semiconductor industry, chip structure is becoming smaller, and the wafer manufacturing process is becoming increasingly complex. Many detection methods are no longer applicable [2,3]. Therefore, wafer surface defect detection research is crucial to improvement of industrial production efficiency and meeting the development needs of the industry. How to improve detection accuracy and reduce false and missed detection has become the focus of wafer detection research at this stage.
Early wafer surface defect detection methods were mainly based on image processing technology [4,5,6,7]. In these methods, through the difference between a template image without defects and an image to be tested, each defect area is obtained using the threshold segmentation method, and the texture and shape features of the defect areas are extracted. Then, the defect areas are classified using manually designed classification criteria. Although detection methods based on image processing can detect most defects, the threshold often needs to be changed or the algorithm needs to be redesigned when the imaging environment or defect type changes.
In recent years, object-detection algorithms [8,9,10] have developed rapidly. Some methods based on deep learning have been used in wafer surface defect detection. Haddad et al. [11] proposed a three-stage wafer surface defect detection method that involves candidate area generation, defect detection, and refinement stages. It can achieve accurate detection, but it has the disadvantages of high time consumption and no end-to-end training. Kim et al. [12] proposed a detection model based on the conditional generative adversarial network. In this model, PixelGan [13] is used as a discriminator to improve the detection accuracy for small-scale defects on the wafer surface, but its adaptability to industrial environment changes is poor. Han et al. [14] presented a wafer surface defect segmentation method based on U-Net [15]. In this method, a region proposal network is used to generate potential defect areas, and a dilated convolution module was introduced to improve the U-Net network structure and enhance the model’s segmentation ability for small-scale defects. However, the model’s detection speed is slow. Yang et al. [16] proposed a quantum classical hybrid model for wafer defect detection using the quantum deep learning method. However, due to the development of quantum computing, model training is difficult.
Although detection methods based on deep learning have achieved some useful results, the following problems still exist: First, the sizes of particle defects are small, and after multiple convolution and downsampling operations, semantic information can be seriously lost, which can cause missed detection. Second, scratch defects have large spans and discontinuity, and the model easily outputs predicted results for discontinuous scratch fragments, which can result in multiple detections. To solve these problems, this study implements improvements on the basis of Faster RCNN [17], which has achieved good effects in various fields [18,19,20]. The main contributions of this work are as follows:
(1) We propose a feature enhancement module to extract high-frequency image feature information, improve the feature extraction ability of the shallow network, and resolve the problem of small objects missing detection. To avoid causing heavy computation cost, dynamic convolution [21] is used instead of ordinary convolution to achieve balance between detection accuracy and speed.
(2) A predicted box aggregation method is proposed and used to aggregate the predicted boxes of repeated multiple detections and solve the problem of multiple detections. A directed graph structure is applied to describe the dependency between predicted boxes. In the aggregation process, the location information of redundant bounding boxes is used to fine-tune a real predicted bounding box and further improve the positioning accuracy of the model.
The rest of this paper is organized as follows: Section 2 introduces the proposed method, including the general framework and the details of the improved modules. Section 3 describes the dataset and reports the experimental results. Finally, Section 4 summarizes this paper and points out future research directions.
2. Wafer Surface Defect Detection Algorithm
2.1. General Framework
The task of wafer surface defect detection requires high defect-positioning accuracy, so this study proposes an enhanced Faster RCNN model with an improved network structure. The overall framework of the improved network is shown in Figure 2, where the red boxes are improved parts. The network structure consists of four modules, which are backbone, neck, head, and postprocess.
A backbone network is used to extract features from an image. In this study, ResNet50 [22] was selected as the backbone network. ResNet50 has a powerful feature extraction capability and is composed of four residual modules. Each time the feature map passes through a residual module, the scale is reduced to half of the original, and the receptive field is enlarged so semantic information becomes increasingly abundant. When the input image size is 640 × 640 and the sizes of the characteristic maps outputted by the four residual modules are 160 × 160, 80 × 80, 40 × 40, and 20 × 20, the downsampling steps are 4, 8, 16, and 32, respectively. To improve the model-detection performance for small objects, this study added a feature enhancement module to the backbone network to extract high-frequency image features and uses dynamic convolution in the module to improve the feature extraction capability of that module.
The feature pyramid network (FPN) [23], as the neck network, takes the feature maps of the four residual modules as input and uses the convolution kernel of 1 × 1 to unify the number of channels. Then, the deep-layer feature map is superimposed on the shallow-layer feature map via upsampling. The shallow feature map has many details, and its loss of small-object information is less; hence, it is suitable for small-object detection. After multiple convolution and downsampling operations, the deep feature map achieves a large receptive field and extracted semantic information is abundant, which are favorable for detecting large objects.
The head network is used for prediction based on the information processed from the neck network. The multiple feature maps outputted by the neck network are sent to the regional proposal network (RPN) to generate proposal boxes, and the RoI pooling method is used to extract the corresponding feature maps for prediction. The prediction part of the model flattens the feature maps and uses two full-connection layers for further feature extraction; afterward, it inputs the maps to the classification and regression branches for final prediction. The output results include predicted-box width and height, center-point coordinates, confidence level, and the probability of each category.
The role of the postprocess module is to refine the prediction results. All predicted boxes are post-treated; this includes softmax processing of category results, removal of low-probability and out-of-bounds bounding boxes, and nonmaximum suppression. This study added a predicted box aggregation method to the postprocess module, determined the dependency between predicted boxes by constructing a directed graph structure, removed redundant predicted boxes, and used the location information of redundant boxes to update the location information of effective predicted boxes. Thus, the positioning accuracy of the predicted results was effectively improved.
2.2. Feature Enhancement Module
The convolutional neural network usually increases the depth of a model to increase the receptive field. However, small-scale objects have low resolution and small proportions of pixels, and semantic information is easily lost after multiple downsampling operations; thus, transferring to the deep network is difficult. The key to detecting small-scale defects lies in the shallow network, but that network has a few convolution operations, has weak feature extraction ability, and only obtains limited semantic information, so the defect may be confused with the background in the prediction process. To effectively detect small-scale defects, this study added a feature enhancement module to the shallow network to improve the shallow network’s feature extraction ability for small objects while avoiding any considerable increase in computing cost.
The feature enhancement module aims to extract high-frequency information from a feature map. High-frequency features, such as the edges and textures of defects, can help in defect detection [24]. The structure of the feature enhancement module is shown in Figure 3. Given an input feature map, F, a pooling kernel with a size of 5 × 5 and a stride of 5 are used for average pooling processing. Then, the size of the pooled feature map is adjusted to the original size via upsampling to obtain the low-frequency feature description, Flow, of feature map F. Feature map F and low-frequency feature map Flow are used in the difference operation to obtain the high-frequency feature information, Fhigh, of feature map F. The mathematical description thereof is as follows:
To make the network focus on effective defect-feature information and suppress invalid background information, the high-frequency feature map needs to be convolved, and useful information must be extracted from it. The use of a dense convolution module increases the computational overhead considerably because of the large scale of the high-frequency feature map. Therefore, this study introduces dynamic convolution to replace ordinary convolution; the former can effectively reduce the number of layers of ordinary convolution and demonstrate the same feature extraction capability. The high-frequency feature map, Fhigh, is fed into two ordinary convolutions and one dynamic convolution to extract useful feature information.
Dynamic convolution can adaptively adjust convolution-kernel parameters in accordance with the content of an input image. It is robust to changes in environment and product type in industrial scenes, and it neither increases the depth of the network model nor incurs too much computation cost. Dynamic convolution is composed of an attention module and a convolution module. The convolution module has K convolution kernels (Wk) and corresponding weights (πk). The attention module adopts the squeeze-and-extraction attention mechanism [25], extracts global spatial information through global average pooling, and calculates K attention weights (πk) through the full connected layer and the softmax layer. The K convolution kernels (Wk) in the convolution module are multiplied by the corresponding weight (πk) to form a new convolution kernel, W, and the new convolution kernel is used for the convolution operation. The mathematical expression of the dynamic convolution process is as follows:
where Attention represents the attention module; πk is the weight calculated by the attention module; Wk and bk are the parameter and the bias of the Kth convolution kernel, respectively; W(x) and b(x) are the convolution-kernel parameter and bias after weight aggregation, respectively; and g represents activation function. Dynamic convolution makes the weight of the convolution kernel relevant to the input through the attention mechanism and aggregates multiple convolution kernels in a nonlinear manner, which increases the feature extraction ability of the model at a small cost. Thus, the feature enhancement module can enrich the feature information of shallow feature maps, reduce information loss and data corruption, and help retain the features of small-scale defects.
2.3. Predicted Box Aggregation
Scratch defects are characterized by large spans and discontinuity due to image background interference, console failure, and other reasons. The object-detection model detects not only complete scratches but also discontinuous scratches, which reduce the accuracy of the model and affect the subsequent operation of the industrial production process. The reason for this phenomenon is related to the FPN structure of the model. To improve multiscale object-detection ability, object-detection models usually integrate the FPN to extract multiscale features, adopt shallow feature maps to detect small-scale objects, and apply deep feature maps to detect large-scale objects. As shown in Figure 4, feature maps with different depths are extracted and visualized in the Faster RCNN network model. Figure 4 shows that the receptive field of the deep feature map is large, and it can capture information from a long distance. In addition, the preset anchor-box scale is also large, so complete scratch defects can be easily detected. In a shallow feature map, the receptive field and preset anchor-box scale are both small, so only part of any defect can be detected. In addition, the semantic information of a deep feature map is rich, but its detail information is insufficient, leading to low position accuracy of predicted boxes. Meanwhile, shallow feature maps are rich in detail information, so bounding boxes predicted via a shallow feature map are highly accurate.
To solve the problem of multiple detections caused by discontinuous scratches, this study proposes an aggregation method of predicted boxes. First, a directed graph structure was constructed to represent the dependency between predicted boxes. Second, adjacent nodes were aggregated in accordance with the hierarchical relationship of the graph structure. Lastly, to make full use of the location information of the predicted boxes, the real predicted box was fine-tuned based on the confidence level and relative distance of the redundant boxes in the aggregation process to further improve the positioning accuracy.
2.3.1. Constructing a Directed Graph Structure
To describe the relationship between predicted boxes, all predicted boxes were divided into multiple graph structures in accordance with their categories and each intersection over union (IoU). IoU is a value that quantifies the degree of overlap between two boxes. The IoU value can be calculated via the following equation:
where ∩ represents the intersection area of two boxes and ∪ represents the union area of those two boxes.
β = {b1, b2, b3, …} is defined as a set of predicted boxes after nonmaximum suppression processing. It is classified based on predicted category and arranged in ascending order in accordance with the areas of the predicted boxes to derive βi = {bi,1, bi,2, bi,3, …}, where i represents the ith category. Dividing based on category can prevent aggregation of predicted boxes between different categories. For predicted box bi,j, an attempt is made to find the predicted box, bi,k, with the largest IoU; the area of bi,k is bigger than the area of bi,j in set βi. If the IoU value exceeds the set threshold, T (0.15 in this study), a directed edge from bi,j, will be connected to bi,k. As indicated in Figure 5a, the Faster RCNN model outputs four predicted boxes (β = {A, B, C, D}) for a scratch defect, where A is the effective predicted box of the defect and the rest refers to the partial-content predicted boxes of the defect. In accordance with directed-graph-structure construction rules, the directed graph structure in Figure 5b was obtained. Figure 5b shows that no corresponding edge exists between the predicted boxes without intersection (between B and C, D), so they will not affect each other in the subsequent aggregation process. The transfer order of the directed graph is based on area size, and the node with an in-degree of 0 is used as the starting node. From C to D and finally to A, the area of the predicted boxes increases in turn.
2.3.2. Fine Adjustment of the Predicted Box
In the directed graph, the node with an out-degree of 0 is the real predicted box, and the rest of the nodes are redundant predicted boxes with multiple repeated detections. If only the redundant predicted boxes were removed, the prediction information of the model would not be fully utilized. Redundant predicted boxes are mostly generated via the shallow feature map. The shallow feature map is rich in detail information, and the position of a bounding box predicted by the shallow feature map is usually accurate. Therefore, using the shallow bounding boxes to adjust the deep bounding boxes can increase the positioning accuracy of the bounding boxes and effectively improve prediction-information utilization. From the node with an in-degree of zero in the directed graph structure, the position of the bounding box for the subsequent nodes is adjusted in turn, and some compensation is made for confidence. Specifically, bs and be are defined as the start node and the end node of a directed edge, and the position information of bs is used to fine-tune be. The specific steps are as follows:
(1) Select the coordinate position (x, y) to be adjusted: The coordinate position to be adjusted is determined based on the center positions (cs, ce) of predicted boxes bs and be. The corresponding adjustment position is selected based on the position of cs relative to ce. For example, if cs is in the upper-left corner from ce, then the upper-left corner of the predicted box will be chosen to be adjusted.
(2) Adjust the coordinate of the bounding box, be: Take the x-coordinate, for example; the coordinate adjustment distance is defined as |xs−xe|. In consideration of the influences of the distance and confidence between predicted boxes on coordinate adjustment, the adjustment distance should be multiplied by a correlation coefficient. If the confidence level of bs is high, a large adjustment range should be provided; otherwise, the adjustment range should be reduced. Therefore, the square of be’s confidence level is introduced as the constraint factor (scoree2). If the boundary distance between bs and be is large, bs may be a predicted box of the object center position and therefore cannot provide the location information of the boundary, so the adjustment range should be reduced. The result of dividing the boundary distance by the center distance is utilized as the distance constraint and normalized to the range of (0–1) via the tanh function. Euclidean distance is used to calculate center distance. The specific calculation formula of coordinate adjustment is as follows:
(3) Confidence compensation: The high-confidence prediction box represents highly accurate and reliable location information. After the location information adjustment is received, be should improve the corresponding confidence. This study uses the following formula to compensate for the confidence of be. In this formula, γ represents the degree of compensation (in this study, γ is set to 0.25).
(4) Remove redundant box: Predicted box bs is removed, and be is utilized as a new starting node to adjust the subsequent nodes.
In Algorithm 1, the aggregation method of predicted boxes is summarized.
| Algorithm 1 Predicted Box Aggregation |
| Inputs: Predicted box set β 1. Classify β as βi by the predicted category 2. For i in category do 3. Construct a directed graph set G from βi 4. For all graphs, g, in G, do 5. Select the node with an in-degree of 0 as start node bs 6. Adjust the subsequent node, be, using Equation (3) 7. Compensate for the confidence of be using Equation (4) 8. Remove bs and the corresponding box from β 9. End for 10. End for |
3. Experiments and Result Analysis
3.1. Experimental Environment
The operating system used in this experiment was Ubuntu 16.04.7 and the graphics card used was NVIDIA Tesla P100 PCIE 16G. Python 3.7 was used to implement the experiments, and the deep learning framework used was PyTorch 1.7.0. The number of model training rounds (epochs) was 300, and the batch size was 8. Stochastic gradient descent was selected as the model parameter optimizer; the initial learning rate was 0.005, the momentum factor was 0.9, and the weight attenuation coefficient was 0.0005. Every 50 rounds of training, the learning rate was adjusted to half of the original. The K-means algorithm was used to obtain the size of the anchor.
3.2. Dataset and Evaluation Indexes
The experimental dataset came from actual data collected from a wafer fabrication factory and included four types of defects: particle, scratch, ripple, and stain. The total number of images was 1000. Each image size was 1500 × 1500. The image annotation tool used was LabelImg, and the annotation format used was VOC2007. The distribution of the various defects was as follows: 559 particles, 706 scratches, 405 ripples, and 336 stains. The entire dataset was randomly divided into training and test sets at a ratio of 4:1. In the training phase, images were scaled to 1472 × 1472 for a downsampling effect and expanded via horizontal and vertical flipping.
This study adopted precision (P), recall (R), average precision (AP), mean average precision (mAP), and frames per second (FPS) to evaluate the detection performance of the model. P represents the reliability of the predicted results of the model. R was used to measure whether the model would miss detection. The calculation formula is as follows:
where TP is the number of objects with a correct predicted category or when the IoU value calculated from the prediction and annotation is less than 0.5, FP is the number of objects with a wrongly predicted category or when the IoU value calculated from the prediction and annotation is less than 0.5, and FN is the number of objects in which the background area is predicted as a defect. The P-R curve can be obtained via changing the confidence threshold and calculating the accuracy and recall under different confidence thresholds. The average of precision on the P-R curve is AP, which was used to measure the detection accuracy of a single category. mAP is the average value of each category, AP; it was used to measure the overall detection accuracy of the model. FPS is the number of images that could be processed with the model per second, used to measure the detection speed of the model.
3.3. Analysis of Experimental Results
3.3.1. Analysis of Defect Detection Results
To verify the effectiveness and superiority of this method in wafer surface defect detection, it was compared with mainstream object-detection methods. The models used in the comparative experiment included the proposed method, RetinaNet [26], Faster RCNN [17], Sparse RCNN [27], and YOLOv7 [28]. The experimental results are shown in Table 1, which indicates that the proposed method is superior to the other methods in terms of accuracy, but its detection speed is poor. The proposed method is a two-stage network structure. The bounding boxes are classified and regressed twice, and the feature enhancement module is introduced, resulting in poor detection speed and a small FPS value. Compared with Faster RCNN, although the detection speed of the proposed method decreased by 0.58 frames/s after addition of the feature enhancement module and the predicted box aggregation method, the accuracy for each category greatly improved; in particular, the average precision for scratch defects increased by 15.8%. Sparse RCNN uses parameter learning to replace preset anchor boxes. Its detection performance for small objects, such as particles, is poor, which may be due to wide distribution of particle defects. One hundred groups of learned anchor box parameters are insufficient to cover all possible positions. For improved inference, YOLOv7 selects no feature map with a sampling ratio of 4, so it demonstrates poor performance in particle defects. In our method, five scale feature maps were selected, and feature enhancement modules were added to improve the feature description ability of the network model for various types of defects. The accuracy for each category increased. In conclusion, compared with other object-detection models, the proposed method has a higher detection accuracy and can effectively detect different types of defects, but its detection efficiency is poor. For wafer surface defect detection, which requires special attention to accuracy, the proposed method has obvious advantages.
In addition to the quantitative results, we also display some qualitative results in Figure 6, which indicates that the proposed method can effectively detect various types of defects and has high positioning accuracy. For discontinuous scratch defects, the proposed method can successfully detect complete scratches through predicted box aggregation processing while Faster RCNN figures out the defect with multipredicted boxes. For small particles and stains with complex textures, the method extracts high-frequency features through the feature enhancement module, which can effectively enrich semantic information and obtain accurate detection results. Several missed detections occurred with YOLOv7 and Sparse RCNN. The proposed method showed better performance in the cases above, as shown in Figure 6.
3.3.2. Ablation Study
To verify the effectiveness of the feature enhancement module and the predicted box aggregation method, ablation experiments were conducted on the method in this study, and the results thereof are shown in Table 2. This table indicates that the feature enhancement module greatly improves accuracy for each category, thereby proving that the feature enhancement module enriches multiscale features, especially the shallow network feature map. Adding the feature enhancement module to the shallow network can enrich the semantic information of the multiscale feature map and improve the model-detection performance by 5.0%, but it increases the number of parameters and reduces the model’s inference speed. Table 2 shows that after addition of the feature enhancement module, the FPS of the model was reduced by 0.48, which means that the FEM increases computational complexity. The predicted box aggregation method considerably improved the detection results for scratches, proving that this method can effectively filter out redundant predicted boxes and reduce the number of false positives. The time taken for this method is related to the number of predicted boxes. The increase in complexity with this model is small and has little effect on the inference speed. After application of this method, the FPS of the detection model was reduced by 0.16. When two optimization methods were used simultaneously, the final detection accuracy reached 87.5%, which is 8.2% higher than the detection accuracy of the original Faster RCNN algorithm. This finding reveals the effectiveness of combining two optimization methods.
Figure 7 presents the influence of the feature enhancement module on the multiscale feature map. Figure 7a is the input image; Figure 7b,d are the P2 and P3 layer feature maps (the downsampling ratios were 4 and 8), respectively, of the original Faster RCNN; and Figure 7c,e are the P2 and P3 layer feature maps, respectively, of the model after addition of the feature enhancement module. Figure 7 suggests that after the addition of the feature enhancement module, the high-frequency information of the feature map was enhanced, defects and the background could be easily distinguished, and information about particles and scratches could be effectively transferred to the next layer, thereby reducing the loss of information and improving detection accuracy.
Figure 8 shows the results before and after the aggregation of the predicted boxes. Before aggregation, the model outputted multiple predicted boxes for the same defect. The small-scale predicted box contained part of the defect content, with highly accurate location and high confidence. The large-scale predicted box detected the overall content of the defect, but its location accuracy and confidence were low. Through the algorithm of predicted box aggregation, redundant predicted boxes were filtered, and the effective predicted boxes were fine-tuned to correct their location information and improve their confidence. The downside of the algorithm is that it will not work well in object-dense scenarios. When the overlap degree of predicted boxes of two different objects is greater than the set threshold, T, the algorithm will output that one box contains two objects.
4. Conclusions
To solve the problems of missing small-scale defects and multiple detections of discontinuous defects, this study proposes an improved Faster RCNN algorithm for wafer surface defect detection. A feature enhancement module based on high-frequency features and dynamic convolution was employed to improve the feature extraction abilities of shallow networks and enrich the semantic information of multiscale feature maps without greatly increasing computation burden. Through addition of a predicted box aggregation method to the postprocessing stage, repeated and multidetected predicted boxes were aggregated to generate highly accurate predicted boxes, which improved the model-detection accuracy. The experimental results showed that compared with the mAP value of the original Faster RCNN algorithm, the mAP value of the improved algorithm in this study increased by 8.2%. The detection performance of the proposed algorithm was also better than that of other object-detection models, but the inference speed of this algorithm was relatively poor. Our future work will further optimize the network structure, use a lightweight backbone network, reduce the number of parameters and the computation cost, increase the detection speed, and ensure detection accuracy.
Author Contributions
Conceptualization, T.Z. and J.D.; methodology, J.Z.; software, J.Z. and T.Z.; validation, J.Z. and T.Z.; formal analysis, J.Z.; data curation, J.D. and T.Z.; writing—original draft preparation, J.Z.; writing—review and editing, T.Z. and J.D. All authors have read and agreed to the published version of the manuscript.
Funding
This research was funded by the National Natural Science Foundation of China (NSFC), grant number 62072057.
Data Availability Statement
The data presented in this study are available on request from the corresponding authors.
Conflicts of Interest
The authors declare no conflict of interest.
References
- Cheng, K.; Chen, L.; Li, J.; Li, K.; Tsai, N.; Wang, S.; Huang, A.; Chou, L.; Lee, C.; Chen, J.; et al. Machine learning-based detection method for wafer test induced defects. IEEE Trans. Semicond. Manuf. 2021, 34, 161–167. [Google Scholar] [CrossRef]
- Batool, U.; Shapiai, M.; Tahir, M.; Ismail, Z.; Zakaria, N.; Elfakharany, A. A systematic review of deep learning for silicon wafer defect recognition. IEEE Access 2021, 9, 116572–116593. [Google Scholar] [CrossRef]
- Frittoli, L.; Carrera, D.; Rossi, B.; Fragneto, P.; Boracchi, G. Deep open-set recognition for silicon wafer production monitoring. Pattern Recognit. 2022, 124, 108488. [Google Scholar] [CrossRef]
- Wang, J.; Yu, Z.; Duan, Z.; Lu, G. A sub-region one-to-one mapping (SOM) detection algorithm for glass passivation parts wafer surface low-contrast texture defects. Multimed. Tools Appl. 2021, 19, 28879–28896. [Google Scholar] [CrossRef]
- Yang, J.; Xu, Y.; Rong, H.; Du, S.; Zhang, H. A method for wafer defect detection using spatial feature points guided affine iterative closest point algorithm. IEEE Access 2020, 8, 79056–79068. [Google Scholar] [CrossRef]
- Hafer, R.; Patterson, O.; Hahn, R.; Xiao, H. Full-wafer voltage contrast inspection for detection of BEOL defects. IEEE Trans. Semicond. Manuf. 2015, 28, 461–468. [Google Scholar] [CrossRef]
- Li, K.; Liao, P.; Cheng, K.; Chen, L.; Wang, S.; Huang, A.; Chou, L.; Han, G.; Chen, J.; Liang, H.; et al. Hidden wafer scratch defects projection for diagnosis and quality enhancement. IEEE Trans. Semicond. Manuf. 2021, 34, 9–15. [Google Scholar] [CrossRef]
- Girshick, R. Fast R-CNN. In Proceedings of the IEEE International Conference on Computer Vision, Santiago, Chile, 13–16 December 2015; pp. 1440–1448. [Google Scholar]
- Mahto, P.; Garg, P.; Seth, P.; Panda, J. Refining yolov4 for vehicle detection. Int. J. Adv. Res. Eng. Technol. 2020, 11, 409–419. [Google Scholar]
- Liu, W.; Anguelov, D.; Erhan, D.; Szegedy, C.; Reed, S.; Fu, C.; Berg, A. SSD: Single shot multibox detector. In Proceedings of the European Conference on Computer Vision, Amsterdam, The Netherlands, 10–16 October 2016; pp. 21–37. [Google Scholar]
- Haddad, B.; Dodge, S.; Karam, L.; Patel, N.; Braun, M. Locally adaptive statistical background modeling with deep learning-based false positive rejection for defect detection in semiconductor units. IEEE Trans. Semicond. Manuf. 2020, 33, 357–372. [Google Scholar] [CrossRef]
- Kim, J.; Nam, Y.; Kang, M.; Kim, K.; Hong, J.; Lee, S.; Kim, D. Adversarial defect detection in semiconductor manufacturing process. IEEE Trans. Semicond. Manuf. 2021, 34, 365–371. [Google Scholar] [CrossRef]
- Isola, P.; Zhu, J.; Zhou, T.; Efros, A. Image-to-image translation with conditional adversarial networks. In Proceedings of the IEEE Conference on Computer Vision and Pattern Recognition, Honolulu, HI, USA, 22–25 July 2017; pp. 5967–5976. [Google Scholar]
- Han, H.; Gao, C.; Zhao, Y.; Liao, S.; Tang, L.; Li, X. Polycrystalline silicon wafer defect segmentation based on deep convolutional neural networks. Pattern Recognit. Lett. 2020, 130, 234–241. [Google Scholar] [CrossRef]
- Ronneberger, O.; Fischer, P.; Brox, T. U-Net: Convolutional networks for biomedical image segmentation. In Proceedings of the International Conference on Medical Image Computing and Computer-assisted Intervention, Munich, Germany, 5–9 October 2015; pp. 234–241. [Google Scholar]
- Yang, Y.; Sun, M. Semiconductor defect detection by hybrid classical-quantum deep learning. In Proceedings of the IEEE Conference on Computer Vision and Pattern Recognition, New Orleans, LA, USA, 21–24 June 2022; pp. 2313–2322. [Google Scholar]
- Ren, S.; He, K.; Girshick, R.; Jian, S. Faster R-CNN: Towards real-time object detection with region proposal networks. IEEE Trans. Pattern Anal. Mach. Intell. 2017, 39, 1137–1149. [Google Scholar] [CrossRef] [PubMed] [Green Version]
- Wang, X.; Jia, X.; Jiang, C.; Jiang, S. A wafer surface defect detection method built on generic object detection network. Digit. Signal Process. 2022, 130, 103718. [Google Scholar] [CrossRef]
- Khasawneh, N.; Fraiwan, M.; Fraiwan, L. Detection of K-complexes in EEG waveform images using faster R-CNN and deep transfer learning. BMC Med Inf. Decis Mak 2022, 22, 297. [Google Scholar] [CrossRef] [PubMed]
- Xu, X.; Zhao, M.; Shi, P.; Ren, R.; He, X.; Wei, X.; Yang, H. Crack detection and comparison study based on Faster R-CNN and mask R-CNN. Sensor 2022, 22, 1215. [Google Scholar] [CrossRef] [PubMed]
- Chen, Y.; Dai, X.; Liu, M.; Chen, D.; Yuan, L.; Liu, Z. Dynamic convolution: Attention over convolution kernels. In Proceedings of the IEEE Conference on Computer Vision and Pattern Recognition, Virtual, 14–19 June 2020; pp. 11030–11039. [Google Scholar]
- He, K.; Zhang, X.; Ren, S.; Sun, J. Deep residual learning for image recognition. In Proceedings of the IEEE Conference on Computer Vision and Pattern Recognition, Las Vegas, NV, USA, 26–30 June 2016; pp. 770–778. [Google Scholar]
- Lin, T.; Dollar, P.; Girshick, R.; He, K.; Hariharan, B.; Belongie, S. Feature pyramid networks for object detection. In Proceedings of the IEEE Conference on Computer Vision and Pattern Recognition, Honolulu, HI, USA, 22–25 July 2017; pp. 936–944. [Google Scholar]
- Gomez-Sirvent, J.; Rose, F.; Sanchez-Reolid, R.; Fernandez-Caballero, A.; Morales, R. Optimal feature selection for defect classification in semiconductor wafers. IEEE Trans. Semicond. Manuf. 2022, 35, 324–330. [Google Scholar] [CrossRef]
- Hu, J.; Shen, L.; Albanie, S.; Sun, G.; Wu, E. Squeeze-and-excitation networks. IEEE Trans. Pattern Anal. Mach. Intell. 2020, 42, 2011–2023. [Google Scholar] [CrossRef] [PubMed]
- Lin, T.; Goyal, P.; Girshick, R.; He, K.; Dollar, P. Focal loss for dense object detection. IEEE Trans. Pattern Anal. Mach. Intell. 2017, 99, 2999–3007. [Google Scholar]
- Sun, P.; Zhang, R.; Jiang, Y.; Kong, T.; Xu, C.; Zhan, W.; Tomizuka, M.; Li, L.; Yuan, Z.; Wang, C.; et al. Sparse R-CNN: End-to-end object detection with learnable proposals. In Proceedings of the IEEE Conference on Computer Vision and Pattern Recognition, Virtual, 19–25 June 2021; pp. 14449–14458. [Google Scholar]
- Wang, C.; Bochkovskiy, A.; Liao, H. YOLOv7: Trainable bag-of-freebies sets new state-of-the-art for real-time object detectors. arXiv 2022, arXiv:2207.02696. [Google Scholar]
Figure 1.
Classification of wafer surface defects.
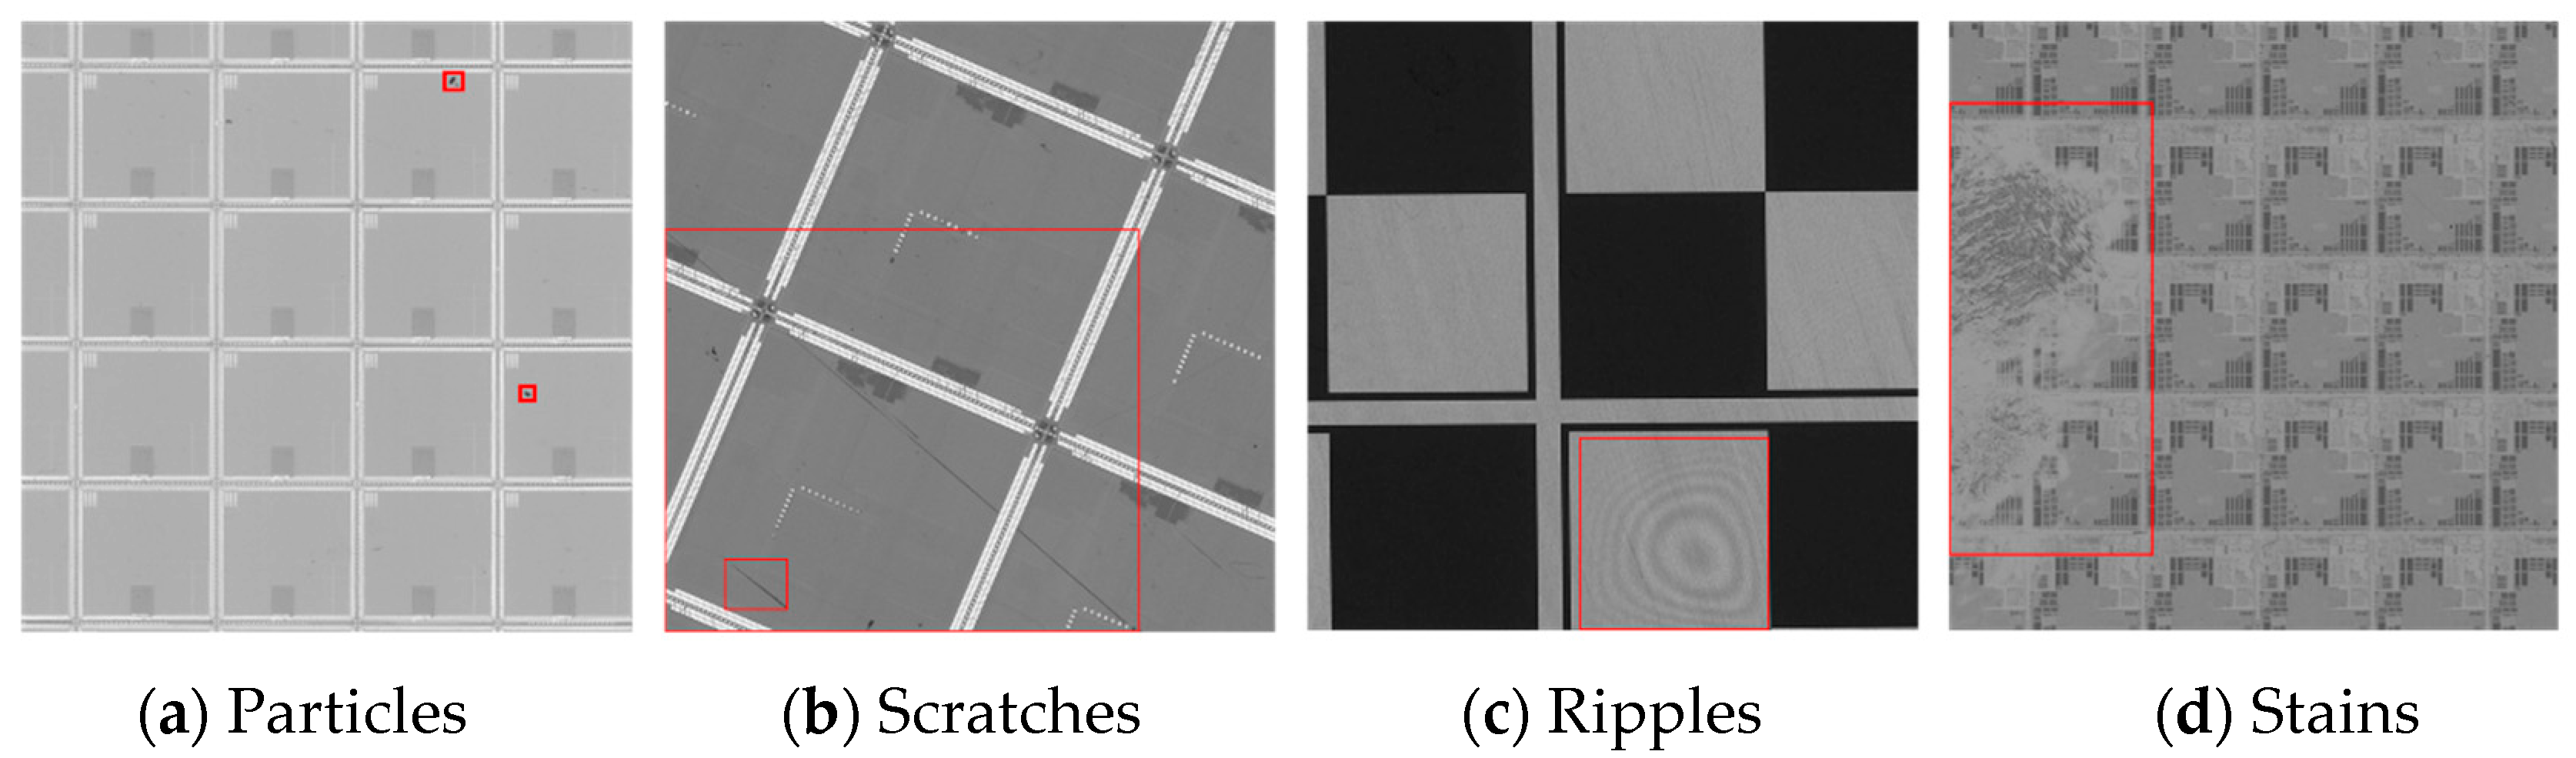
Figure 2.
Improved Faster RCNN network framework.

Figure 3.
Structure of the feature enhancement module.

Figure 4.
Multiple-detection problem caused by discontinuous defects.

Figure 5.
Example of directed-graph-structure construction.

Figure 6.
Qualitative results of different models.

Figure 7.
Visualization of feature maps: (a) input image, (b) P2 feature map, (c) P2 FEM feature map, (d) P3 feature map, and (e) P3 FEM feature map.
Figure 7.
Visualization of feature maps: (a) input image, (b) P2 feature map, (c) P2 FEM feature map, (d) P3 feature map, and (e) P3 FEM feature map.

Figure 8.
Comparison of predicted boxes before and after aggregation: (a) raw detection results, (b) bounding boxes after predicted box aggregation, and (c) annotation.
Figure 8.
Comparison of predicted boxes before and after aggregation: (a) raw detection results, (b) bounding boxes after predicted box aggregation, and (c) annotation.


Table 1.
Comparison of the test results of different models.
| Model | Backbone Network | AP/% | mAP/% | FPS | |||
|---|---|---|---|---|---|---|---|
| Particles | Scratches | Ripples | Stains | ||||
| RetinaNet | ResNet50 | 80.3 | 63.9 | 79.5 | 70.3 | 73.5 | 5.58 |
| Faster RCNN | ResNet50 | 83.8 | 68.7 | 88.7 | 76.0 | 79.3 | 4.41 |
| Sparse RCNN | ResNet50 | 77.9 | 68.0 | 82.7 | 74.1 | 75.6 | 3.70 |
| YOLOv7 | CBS + ELAN | 75.9 | 64.5 | 84.0 | 71.8 | 74.0 | 10.3 |
| Proposed Method | ResNet50 + FEM | 88.2 | 84.5 | 93.4 | 83.9 | 87.5 | 3.83 |
Table 2.
Impact of the FEM and predicted box aggregation on the detection results.
| Model | FEM | Predicted Box Aggregation | AP/% | mAP/% | FPS | |||
|---|---|---|---|---|---|---|---|---|
| Particles | Scratches | Ripples | Stains | |||||
| Faster RCNN | 83.8 | 68.7 | 88.7 | 76.0 | 79.3 | 4.41 | ||
| √ | 87.3 | 76.6 | 92.4 | 80.9 | 84.3 | 3.93 | ||
| √ | 84.0 | 74.4 | 88.8 | 78.4 | 81.4 | 4.25 | ||
| √ | √ | 88.2 | 84.5 | 93.4 | 83.9 | 87.5 | 3.83 | |
Disclaimer/Publisher’s Note: The statements, opinions and data contained in all publications are solely those of the individual author(s) and contributor(s) and not of MDPI and/or the editor(s). MDPI and/or the editor(s) disclaim responsibility for any injury to people or property resulting from any ideas, methods, instructions or products referred to in the content. |
© 2022 by the authors. Licensee MDPI, Basel, Switzerland. This article is an open access article distributed under the terms and conditions of the Creative Commons Attribution (CC BY) license (https://creativecommons.org/licenses/by/4.0/).
Share and Cite
MDPI and ACS Style
Zheng, J.; Dang, J.; Zhang, T. Wafer Surface Defect Detection Based on Feature Enhancement and Predicted Box Aggregation. Electronics 2023, 12, 76. https://doi.org/10.3390/electronics12010076
AMA Style
Zheng J, Dang J, Zhang T. Wafer Surface Defect Detection Based on Feature Enhancement and Predicted Box Aggregation. Electronics. 2023; 12(1):76. https://doi.org/10.3390/electronics12010076
Chicago/Turabian StyleZheng, Jiebing, Jiangtao Dang, and Tao Zhang. 2023. "Wafer Surface Defect Detection Based on Feature Enhancement and Predicted Box Aggregation" Electronics 12, no. 1: 76. https://doi.org/10.3390/electronics12010076
Note that from the first issue of 2016, this journal uses article numbers instead of page numbers. See further details here.