
Photoplethysmography in Wearable Devices: A Comprehensive Review of Technological Advances, Current Challenges, and Future Directions


1
Digital Health Care R&D Department, Korea Institute of Industrial Technology (KITECH), Cheonan 31056, Republic of Korea
2
Department of Biomedical Engineering, Soonchunhyang University, Asan 31538, Republic of Korea
*
Author to whom correspondence should be addressed.
Electronics 2023, 12(13), 2923; https://doi.org/10.3390/electronics12132923
Submission received: 1 June 2023
/
Revised: 21 June 2023
/
Accepted: 25 June 2023
/
Published: 3 July 2023
(This article belongs to the Special Issue Bioelectronics in Korea - Emerging Medical Electronics and Digital Healthcare Technologies)
Abstract
:Photoplethysmography (PPG) is an affordable and straightforward optical technique used to detect changes in blood volume within tissue microvascular beds. PPG technology has found widespread application in commercial medical devices, enabling measurements of oxygen saturation, blood pressure, and cardiac output; the assessment of autonomic nerve function; and the diagnosis of peripheral vascular disease. Recently, the growing demand for non-invasive, portable, cost-effective technology, along with advancements in small semiconductor components, has led to the integration of PPG into various wrist-worn wearable devices. Multiple sensor structures have been proposed and, through appropriate signal processing and algorithmic application, these wearable devices can measure a range of health indicators during daily life. This paper begins by addressing the market status of wrist-worn wearable devices, followed by an explanation of the fundamental principles underlying light operation and its interaction with living tissue for PPG measurements. Moving on to technological advancements, the paper addresses the analog front end for the measurement of the PPG signal, sensor configurations with multiple light emitters and receivers, the minimum sampling rate required for low-power systems, and the measurement of stress, sleep, blood pressure, blood glucose, and activity using PPG signals. Several challenges in the field are also identified, including selecting the appropriate wavelength for the PPG sensor’s light source, developing low-power interpolation methods to extract high-resolution inter-beat intervals at a low sampling rate, and exploring the measurement of physiological phenomena using multi-wavelength PPG signals simultaneously collected at the same location. Lastly, the paper presents future research directions, which encompass the development of new, reliable parameters specific to wearable PPG devices and conducting studies in real-world scenarios, such as 24-h long-term measurements.
1. Introduction
In the past, healthcare mostly focused on hospital-oriented care, where patients were treated in hospitals by healthcare professionals. However, in recent years, there has been a paradigm shift towards individual-oriented care, where patients are encouraged to take a more active role in managing their own health [1,2,3]. Wearable healthcare devices are playing an important role in this paradigm shift. The need for wearable healthcare devices is driven by the desire for the continuous monitoring of vital signs and health metrics in a non-invasive and convenient way, which can help to improve health outcomes and quality of life for individuals. Wearable healthcare devices can help to detect and monitor a range of health conditions, such as heart disease, diabetes, and sleep disorders [4,5,6]. By providing continuous monitoring of vital signs, wearable devices can help individuals to detect potential health issues early on and take appropriate steps to manage them. Wearable healthcare devices allow individuals to track their health metrics on a daily basis, providing valuable insights into their health status and helping them to make informed decisions about their lifestyles and habits. This tracking can be particularly useful for individuals with chronic conditions or those looking to improve their overall health and wellness. They can help to improve patient outcomes by providing real-time monitoring of vital signs, allowing healthcare providers to quickly detect and respond to changes in a patient’s condition. Among the various types of available wearable healthcare devices, wrist-worn wearables have emerged as the most popular, with a wide variety of products now on the market [7]. The prospects of future wrist-worn health management devices are promising, with ongoing advancements in sensor technology, signal processing algorithms, and data analysis techniques. These devices have potential for personalized health monitoring, disease detection and prevention, and remote patient monitoring. These developments could lead to improved healthcare outcomes and greater accessibility to healthcare for individuals.
Wrist-wearable devices typically include several sensors that enable them to track various aspects of the wearer’s health and fitness. Inertial measurement unit (IMU) sensors are often included in wrist-wearable devices for healthcare applications to track the movement and orientation of the device in three-dimensional space. An IMU typically includes a combination of accelerometers, gyroscopes, and magnetometers. Together, these sensors provide valuable information about the wearer’s physical activity and movement patterns, which can be used for healthcare applications, such as steps taken, distance traveled, calories burned, and fall detection [8,9,10]. Recently, photoplethysmographic sensors (PPG) have been widely implemented. PPG is a non-invasive optical technology that measures changes in blood volume in tissue by detecting changes in the amount of light absorbed by the tissue [11]. In the context of wrist-wearable devices, PPG sensors are used to measure the pulsatile blood flow in the arteries of the wrist. The PPG sensor consists of a light source, typically an LED, and a photodetector. The LED emits light that is absorbed by the tissue in the wrist, and the photodetector measures the amount of light that is transmitted through or reflected from the tissue. As blood flows through the arteries, it absorbs more light, causing a decrease in the amount of light that reaches the photodetector, resulting in a pulsatile waveform that corresponds to the cardiac cycle. PPG sensors can be used to measure a variety of physiological parameters, including the heart rate, heart rate variability, blood pressure, blood oxygen saturation, and sleep quality [12,13]. To measure these parameters, the PPG sensor typically collects data continuously or intermittently over a period of time, and the data are then processed using algorithms to extract the desired information. While PPG technology has many benefits for wearable applications due to its non-invasive and convenient nature, there are also several challenges and limitations associated with PPG in wearable applications. The movement of the wearer can cause motion artifacts in the PPG signal, which can lead to inaccurate measurements of the heart rate and other physiological parameters [14,15], which is particularly problematic for applications where the wearer may be engaging in physical activity. While wearable PPG can provide valuable information on the heart rate, oxygen saturation, and other physiological parameters, its accuracy may be limited for certain measurements. For example, wearable PPG may not be as accurate as electrocardiography (ECG), even as a finger-clip-type transmittance-mode PPG to measure heart rate variability. Wearable PPG devices rely on batteries, which limits their operating time. Frequent charging or battery replacement may be necessary, especially for continuous monitoring applications. These limitations have been addressed through the development of new sensor designs, algorithms, and data processing techniques that aim to improve the accuracy and reliability of PPG measurements.
Wearable PPG technology has been accessible for several decades, but it was not until the early 2010s that it became more widely commercialized and popularized. This phenomenon was largely due to the development of more accurate and reliable PPG sensors, as well as advances in miniaturization and wireless connectivity that made the incorporation of PPG sensors into small, wearable devices practicable. The first commercially available wrist-wearable device with a PPG sensor, the Mio Alpha, was released in 2012, followed shortly thereafter by other popular devices, such as the Fitbit Charge HR and the Basis B1 Band. In the smartwatch product line, after the first PPG sensor was introduced in the Samsung Galaxy Gear2 in 2014, the PPG sensor was also installed in the Apple Watch in 2015. Since then, wearable PPG technology has continued to evolve and improve, with many new devices incorporating more advanced sensors and algorithms to monitor a wider range of physiological parameters. Today, wearable PPG technology is broadly used in a variety of applications, including health and fitness monitoring, clinical research, and medical diagnostics. In early 2010, as wrist-wearable devices with PPG sensors began to be commercialized, a review of wearable PPG systems was published in the journal Electronics [16]. In the review paper, various wearable form factors, such as rings and earphones, as well as wrist-worn devices, were discussed, and motion noise cancellation methods were carefully reviewed. The functionality of PPG sensors in wrist-wearable devices has evolved significantly over the subsequent years. The earliest function of PPG sensors in wrist wearables was to solely measure the heart rate, which has since become a standard feature in most wrist-wearable devices. More advanced PPG technologies are now being used to monitor various other health metrics. This functionality is still relatively new and requires more rigorous testing and validation, but it has the potential to greatly enhance the capabilities of wrist-wearable devices as health monitoring tools. As the last comprehensive review of wearable PPG technology was published a decade ago, this article aims to review the latest research developments that have enabled various health monitoring functions through PPG sensors.
2. Working Principle
Human tissue exhibits a significant degree of light scattering [17]. When photons emitted from a light source impinge on tissue, they can take several different paths [18]. As shown in Figure 1a, some photons are absorbed into the tissue (p1), and some pass through the tissue through several pathways to reach the photodetector located on the opposite side of the light source across the tissue (p2). In addition, some photons pass through the tissue but do not reach the photodetector, resulting in a loss of light (p3), and some are scattered and reflected (p4). Transmissive PPG, widely used in clinical practice for pulse oximetry, involves measuring p2. This type of PPG sensor is typically placed on the fingertip, with the light source and detector positioned on opposite sides of the finger. When properly positioned and secured, finger-based PPG can yield high-quality signals with a good signal-to-noise ratio. However, it may cause discomfort or restrict hand movement during usage. Reflective PPG, used in wearable devices, records p4. In this setup, both the light source and the detector are located on the same side of the biological tissue. Consequently, reflectance PPG sensors can be easily integrated into wearable devices such as smartwatches or fitness trackers, allowing continuous monitoring without the need for specific sensor placement on opposite sides of the tissue.
As represented by p4 in Figure 1a, some of the scattered photons emitted from the light source return to the tissue surface and reappear for detection. This phenomenon of scattered photons suggests that the light reflected by the tissue back to the detector has partially undergone a combination of scattering and absorption. Therefore, by measuring the change in the intensity of the reflected light as a function of the wavelength, the relative change within the tissue can be determined. According to the Beer–Lambert law, the path of most photons encountered by the detector generally follows an arc shape, as shown in Figure 1b [19,20]. The wavelength of the light source and the size of the curve have a proportional relationship. In other words, the longer the wavelength, the deeper into the skin the light penetrates. Photons emitted from the light source undergo processes of scattering and absorption in human tissue, blood vessel walls, and blood and are attenuated along a curved path according to the wavelength, while the total reflectance, , can be simplified as the absorbance, , through Equation (1) [21].
The term is defined as the total photon flow emitted from the light source, and is the total photon flow entering the detector. Typically, reflectance measurements are calculated for standard reflective surfaces, known as relative reflectance. This measurement, expressed in Equation (2), is the ratio of the reflectance of the tissue to the reflectance of the white reflectance standard or background, such as a reference surface or instrument calibrator.
As shown in Figure 1b, the light source and detector are separated such that the average path of light in the tissue follows a curved trajectory before reaching the detector. From these reflectance arrays with different source–detector spacing, the penetration depth of light becomes approximately one third to one half of the separation distance into the tissue.
Photoplethysmography measures the effect of arterial blood in tissue on the intensity of the transmitted or reflected light [11]. As shown in Figure 2, the volume of blood in the tissue is a function of the arterial pulse, the AC component, with a greater volume present at the systole and a smaller volume present at the diastole, which is the DC component. Because the blood absorbs most of the light passing through the tissue, the intensity of the light emerging from the tissue is inversely proportional to the volume of blood present in the tissue. The measurement principle of PPG can be explained by the modified Beer–Lambert law, expressed in Equations (1) and (3), where is the detected light intensity, is the incident light intensity, is the molar extinction coefficient, is the molar concentration, is the average path length, and is an appropriate factor describing the measurement geometry [22,23]. The signal that records changes in due to pulsatile cardiac activity is called photoplethysmography (PPG). Here, assuming that the absorbing material of the initial incident light is a tissue-related component including blood or skin, the amplitude of the AC component of the PPG signal can be expressed as in Equation (4). Subscripts b and t denote blood and tissue. Tissue does not change the length of the light travel path with time, but, in the case of blood, the travel path changes according to the contraction and relaxation of the heart. Therefore, in the case of blood with subscript b, the systolic period is indicated by sys and the diastolic period by subscript dia.
According to Equations (3) and (4), the light intensity detected by the photodetector of the reflectance-mode PPG sensor depends on the intensity of the incident light, the blood volume in the vascular bed, absorption by the skin, reflection by the bone, and tissue backscattering.
3. Technological Advances
3.1. Sensor
Optical heart rate monitoring sensors have progressively developed to become smaller, more efficient, and more accurate [24,25,26,27,28,29,30,31,32,33]. One of the key trends in sensor development in the early 2010s, as wearable healthcare devices such as smartwatches began to become popular, was the integration of the LED and photodiode (PD) into a single package with an integrated analog front end. An integrated LED–PD sensor module is smaller and more compact than a conventional optical sensor with separate LED and PD components, which makes integration into wearable devices or other small-form-factor products more straightforward. Moreover, the combined module consumes less power than a conventional optical sensor with separate LED and PD components. Furthermore, this type of LED–PD optopair system features an analog front-end IC (AFE). An AFE is an electronic circuit that processes the analog signal generated by the LED–PD sensor, amplifying and filtering the signal to remove noise and interference. As a result, the trend in optical heart rate sensor development has been towards smaller, integrated solutions with an AFE, which are more accurate, reliable, and power-efficient than previous generations of sensors. Table 1 shows representative, commercially available AFEs that feature an integrated LED–PD optopair system.
While integrated LED–PD sensors offer many advantages for PPG monitoring, there are also some potential disadvantages when compared to traditional sensors that use separate LEDs and PDs. Integrated LED–PD sensors are designed to be a one-size-fits-all solution, which means that they may not be optimal for every use. Customizing the sensor to specific requirements may not be possible, which could limit its usefulness in certain applications. In addition, due to the compact design of integrated LED–PD sensors, it can be challenging to optimize the spacing and positioning of the LED and photodiode, which can lead to a decrease in signal quality and make it more difficult to detect subtle changes in blood flow and oxygen saturation [34]. This issue is less common with traditional sensors that use separate LEDs and photodiodes because the spacing and positioning can be more easily adjusted to optimize the signal quality. As illustrated in Figure 3a, an integrated LED–PD sensor module typically includes an optical barrier that separates the light-emitting LED and receiving PD parts with the LEDs and PDs either exposed on the surface of the sensor or coated with transparent epoxy. Although the light-emitting and receiving parts are completely separated within the sensor module, a gap is formed between the module and the device when it is mounted. Additionally, in some cases, crosstalk can occur due to the cover glass, as shown in Figure 3b. As a result, unlike conventional sensors, the light-receiving part of the optical sensor may measure photons that are directly coupled to the inside of the sensor or reflected from the skin surface without passing through the human body. Signals that do not pass through biological tissue are considered uninteresting and result in an unnecessary increase in the DC component of the PPG signal. Manufacturing a sensing unit that blocks the direct path from the light source to the light-receiving unit is essential, as an increase in the DC signal can lead to errors in measuring oxygen saturation, especially due to the effect of skin color. The pulse oximeter’s theoretical equation expresses the ratio of amplitude (AC) to baseline (DC) obtained from the photoplethysmographic signal of two wavelengths. This ratio cancels out the difference in light absorption due to skin color, as the AC value is normalized to the DC value of each wavelength. Thus, theoretically, the skin color does not affect the accuracy of the oxygen saturation measurement. However, if the light-emitting unit has a direct path to the light-receiving unit without passing through the body, the amount of light reflected by the skin surface varies depending on the skin color. Consequently, the amount of crosstalk that depends on the skin color affects the ratio of AC to DC, leading to errors in calculating oxygen saturation values.
In the early 2010s, the popularity of wrist-worn wearables led to the widespread use of sensor modules that included an integrated LED–PD pair and AFE. Figure 4a provides an expanded view of the Samsung Galaxy Gear Fit product, which was released in 2014. The sensor module for the LED–PD optopair is situated at the center, with a case and glass cover. However, the lack of a perfect barrier rib structure between the LED and PD results in crosstalk. More recent wrist-wearable devices have moved towards using separate sensors for LEDs and PDs. Figure 4b shows the Samsung Galaxy Watch 3, released in 2020, which has a pulse oximeter function. On the back of the watch, the central multi-wavelength LED used to measure the PPG signals is physically separated from the AFE, with several surrounding PDs. Additionally, a partition wall separates the LED and PD.
To obtain a robust PPG signal, various sensor configurations have been attempted. The initial approach was to increase the LED operating current and the number of LEDs to enhance the radiation power and incident light, as shown in Figure 5a. However, the amplitude of the PPG signal may not increase significantly if the active area of the PD does not cover the radiation pattern of the light source. Therefore, multiple PDs were sometimes utilized to increase the active area of the PD (Figure 5b). With advancements in sensor packaging technology, illustrated in Figure 5c, it has become feasible to create a sensor of comparable size to the one depicted in Figure 5b using multi-wavelength LEDs, instead of a single-wavelength LED. Moreover, as exhibited in Figure 5d, the efficiency can be improved by augmenting the number of PDs. In wearable devices, increasing the number of PDs is more beneficial than increasing the number of LEDs, as it reduces power consumption and heat generation. Upon analyzing commercial smartwatches that utilize such designs, it was found that the Gear S3 uses two green LEDs and one photodiode (Figure 5e), whereas the Galaxy Watch incorporates one green LED and four photodiodes (Figure 5f). Additionally, the Garmin Fenix 5 combines three green LEDs with a larger photodiode (Figure 5g), and the Apple Watch employs a pair of green LEDs with two photodiodes (Figure 5h).
3.2. Low-Power-Consumption System
Low power consumption is a critical aspect of wearable technology, as these devices are designed to be worn continuously and must have a long battery life that can last for days or even weeks on a single charge. Additionally, wearable devices must be comfortable to wear since they are meant to be worn on the body for extended periods. To date, most of the attention has focused on low power consumption in hardware components for the development of low-power systems. An example of such a microcontroller is the NXP Semiconductor’s Cortex M0-Based Kinetis KL03 microcontroller, which has ultra-low power consumption and supports low-power wireless communication protocols such as Bluetooth Low Energy (BLE) [35]. Researchers are also exploring new battery technologies, such as solid-state batteries, which offer higher energy density and a longer lifespan than traditional lithium-ion batteries [36]. In addition to conventional components such as microprocessors and displays that are used in wearable devices, PPG signal measurement chips have also been developed as low-power systems and are already commercially available [37,38,39]. These chips exhibit low power consumption in standard operating mode and even lower power consumption in power save mode. However, it is important to note that the power consumption of PPG AFE chips can vary significantly depending on the specific implementation. For instance, incorporating additional sensors or processing algorithms may result in increased power consumption. As a result, research efforts are being directed towards minimizing the power consumption through the use of various embedded software methods.
There are various approaches to extending the battery life of wearable systems other than developing low-power hardware components. Power management software is a representative example [40,41,42] that can be used to optimize the power consumption of a system by controlling the power states of various components, such as the microcontroller, sensors, and communication modules. By using power management software, the system can dynamically adjust the power consumption of these components based on the system’s operating conditions and power requirements, which can help to conserve power. For the microcontroller, there are low-power modes, which can be activated through software to reduce power consumption [43,44]. These low-power modes include sleep mode, idle mode, and standby mode, among others. Using these low-power modes, the system can reduce the power consumption of components when they are not actively performing tasks, thus conserving power. Duty cycling is a technique that involves turning on and off system components in a controlled manner to reduce the average power consumption. For example, in a wireless sensor network, the sensor node may turn on the radio periodically to transmit data, and then turn it off again to conserve power. With duty cycling, the system can reduce the power consumption of the components without sacrificing their functionality. For wearable systems, adaptive algorithms can be used to optimize the power consumption of the system by adapting to changing system conditions and adjusting the system’s behavior accordingly [45,46]. For example, adaptive algorithms can be used to adjust the sampling rate based on the user’s activity level, conserving power when the user is not moving. In recent wearable healthcare systems, it is not appropriate to apply an adaptive algorithm to the PPG sensor because it provides the function of continuously measuring the heart rate for 24 h without being aware of the measurement. Therefore, the trend is to lower the sample rate of PPG signal measurement.
Choi and Shin conducted an investigation in which they generated down-sampled photoplethysmograms (PPGs) at frequencies of 5000, 2500, 1000, 500, 250, 100, 50, 25, 20, 15, 10, and 5 Hz from PPGs sampled at 10 kHz [47]. The researchers then extracted time- and frequency-domain variables of pulse rate variability (PRV) from the down-sampled PPGs and statistically compared these variables with the heart rate variability (HRV) derived from simultaneously recorded 10-kHz-sampled electrocardiograms. The results indicated that there was no significant difference for any PRV variable when the sampling rate was greater than 25 Hz, without any interpolation. In another study, Béres and Hejjel investigated the minimum sampling rate required for PRV analysis [48]. The researchers abbreviated the PPG signal sampled at 1 kHz with a range of sampling rates (2, 5, 10, 20, 50, 100, 200, and 500 Hz) and derived PRV variables using cubic spline and parabola approximation methods after interpolation. These variables were then compared with the PRV variables obtained from the original 1-kHz signal. The results showed that a sampling rate of 5 Hz was sufficient to calculate the pulse rate without applying the interpolation method, but a sampling rate of at least 50 Hz or higher was required for variables in the time and frequency domains of the PRV without applying the interpolation method. However, when applying any of the interpolation methods, the minimum sampling rate for PRV increased to 10–20 Hz. Peláez-Coca et al. conducted a similar investigation by obtaining PRV variables from down-sampled PPG signals (125, 100, 50, and 25 Hz) created from 1-kHz-sampled PPG signals, and they compared them with HRV variables obtained from simultaneously recorded electrocardiograms [49]. The researchers used the medium interpolate point obtained by linear interpolation as a fiducial point to calculate the inter-beat interval of the PPG signal. Results indicated that a sampling frequency of 50 Hz could be used without causing a significant change in the time and frequency variables of PRV.
A low sampling rate can reduce the amount of data that needs to be collected and processed by the microcontroller, which can in turn reduce the power consumption of the system. By lowering the sampling rate, the system reduces the amount of data transmitted wirelessly and stored in memory. A lower sampling rate can also reduce the processing requirements of the microcontroller. By lowering the sampling rate, the system can reduce the number of calculations and data processing tasks that need to be performed, which helps to reduce the power consumption of the system. However, it is important to note that a lower sampling rate may also result in reduced signal quality, which could impact the accuracy of the biosignal monitoring system. Therefore, when selecting a sampling rate for a wearable biosignal monitoring system, it is important to achieve a balance between power consumption and signal quality to ensure that the system meets the desired performance requirements. To enhance the accuracy of inter-bit interval (IBI) extraction in the context of low-sample-rate signals, it is necessary to employ interpolation to improve the reference point of the signal.
3.3. PPG Signal Applications
The most common application of the PPG signal measured from the wrist is for continuous heart rate measurement. Due to its non-invasive nature, continuous measurement capability, and portability, the PPG signal can be used to measure the heart rate continuously for up to 24 h while the device is worn on the wrist. In fact, many commercial wrist-worn wearable devices already include continuous heart rate measurement as a basic function. In a study conducted by Fuller et al. in 2020, the heart rate measurement accuracy of commercial wearable devices was investigated by analyzing data from 158 publications [50]. The study found that in a controlled environment, wearable devices from Apple, Fitbit, and Garmin reported heart rate measurement errors within ±3%. Furthermore, the study confirmed that these devices also measured continuous heart rates within ±10% error, even in free-living environments. It should be noted that the papers analyzed in this study were published before May 2019, and it is expected that the continuous heart rate measurement accuracy of the latest wearable devices has improved even further.
Pulse rate variability (PRV) measurement is a commonly used parameter in addition to pulse rate measurement [51,52]. PRV is considered a valid substitute for heart rate variability, which is typically obtained through electrocardiogram readings. Similar to heart rate variability, PRV is a non-invasive marker derived from PPG signals, reflecting the activity of the sympathetic and parasympathetic branches of the autonomic nervous system at the sinus node of the heart. Unlike pulse rate measurement, PRV provides additional information on the regulation of the heart rate (HR) by the ANS, and due to its clinical significance, PRV is widely used to efficiently monitor the human body and evaluate the ANS through its sympathetic and parasympathetic components. In recent years, algorithm research has been actively conducted to derive health parameters related to the autonomic nervous system using various PRV parameters. The most representative application example is the development of an algorithm to quantify stress states.
Zubair and Yoon conducted a study to explore the effectiveness of a multilevel stress detection system in identifying different states of mental stress using ultra-short-term recordings from PPG sensors. The study involved 14 graduate students who underwent acute stress-inducing protocols, including the Mental Arithmetic Task (MAT) and Stroop Color Word Tasks [53]. PPG signals were collected and analyzed to extract various features related to the beat-to-beat intervals derived from 60-s segments of the PPG signal. These features encompassed time-domain, frequency-domain, and nonlinear characteristics of the pulse rate variability (PRV) based on reliability. Additionally, a novel indicator called the Point Transition Measure (PTM) was introduced by the authors to quantify the time variation at the point-to-point level of the Poincare plot, which was utilized as a feature in the analysis. Feature selection was then performed using the Sequential Forward Floating Selection (SFFS) algorithm to eliminate features with low class correlation and redundant features with high intercorrelation. The classification model employed was the support vector machine (SVM), which achieved accuracy of 94.33% in identifying five different levels of mental stress.
Pugliese et al. developed a rule-based algorithm that detects the onset of drowsiness by analyzing the change in LF/HF, a frequency-domain parameter of PRV, over time using PPG [54]. The algorithm’s performance was assessed in two different scenarios: a sleep testing setting and a driving simulator environment. In both settings, the algorithm’s determination of the onset of drowsiness was compared with the drowsiness onset point obtained through sleep behavior analysis performed by a sleep specialist using data from a polysomnography device. The results demonstrated that the algorithm detected the onset of drowsiness, on average, approximately 9 min before the onset of actual sleep. Wulterkens et al. developed and evaluated a long short-term memory (LSTM) recurrent neural network model for sleep stage classification [55]. The model used PRV parameters from PPG signals and body movements from acceleration signals as inputs to a classifier consisting of an input dense layer, three bidirectional LSTM layers, and two dense layers. The last output layer generated posterior probabilities for each of the four sleep stages (wake, N1 + N2, N3, and REM), and the final classification was determined by the class with the highest posterior probability for each epoch. The algorithm was validated against reference polysomnography in a clinical population of 244 adults and 48 children/adolescents with various sleep disorders. The LSTM classifier demonstrated substantial agreement for the four sleep stages, with an average Cohen kappa of 0.62 and accuracy of 76.4%. For children/adolescents, the agreement was higher, with an average kappa of 0.66 and accuracy of 77.9%.
Active research is ongoing to develop methods for non-invasive blood pressure measurement using photoplethysmography (PPG) signals acquired from the wrist without pressurization [56,57]. Various approaches have been investigated in previous studies, with the most commonly used methods being the pulse transit time (PTT), pulse arrival time (PAT), pulse wave velocity (PWV), and pulse wave analysis (PWA). These parameters have a correlation with blood pressure and can be converted into BP values using appropriate algorithms. However, it is difficult to apply these parameters to a wrist-worn wearable device because two devices are required to simultaneously measure the parameters at a certain distance apart. Therefore, the PWA method has emerged as the most prevalent approach for cuffless blood pressure measurement using PPG signals acquired from the wrist. This technique involves extracting various features from the PPG signal and training machine learning models, such as linear regression, support vector machines, and neural networks, to estimate blood pressure values. Yao et al. recently presented a cuffless blood pressure measurement method using the PWA approach [58]. They extracted 12 time-domain features, 53 morphological features, and 3 statistical features from the entire data set, as well as five demographic features (age, height, weight, body mass index, and gender). These features were fused to create six composite features, which were then fed into a two-layer feedforward artificial neural network algorithm for regression. The proposed method passed the European Society of Hypertension International Protocol Revision 2010 (ESP-IP2) and demonstrated good accuracy across various populations, with a mean absolute error of 3.23 ± 4.47 mmHg for SBP and 2.73 ± 3.61 mmHg for DBP. The reflectance-type sensor used to measure the PPG signal on the wrist typically exhibits a lower signal-to-noise ratio (SNR) compared to the transmittance-type sensor used on the finger. Consequently, studies focusing on PWA have often encountered limitations in performance when utilizing a reflective sensor. Shi et al. proposed a hybrid mathematical model for continuous blood pressure monitoring, specifically investigating the relationship between transmissive PPG signals obtained from the finger and radial arterial blood pressure signals [59]. To account for potential attenuation factors and wave propagation/reflection within the blood circulation, they combined an electrical network model with a tube load model. By employing a system identification method, they determined the optimal parameter range for the model, thereby enabling personalized continuous blood pressure measurement. Experimental results demonstrated that the reconstructed arterial blood pressure (ABP) waveform, achieved through the hybrid model, exhibited a strong correlation (average correlation coefficient of 0.96) with the reference waveform. The mean absolute errors and standard deviations for the estimated SBP and DBP were 3.0/4.4, 2.1/3.0, and 2.1/3.2 mmHg, respectively. These findings confirm that the performance of the hybrid model proposed by Shi et al. surpasses the results obtained by Yao et al. [58].
Diabetes status has been shown to impact hemodynamics and HRV, leading to growing interest in the use of spectrum analysis of photoplethysmogram (PPG) signals for non-invasive blood glucose level prediction [60,61,62]. Among the methods employed for PPG signal analysis, the Mel frequency cepstral coefficient (MFCC) function, which is widely used in speech signal processing and was inspired by human auditory perception, holds significant relevance [63]. Prabha et al. introduced a novel Mel frequency cepstral coefficient feature derived from 5-s wristband photoplethysmogram signals, incorporating physiological parameters such as age, weight, and height. They proposed a non-invasive blood glucose estimation system utilizing extreme gradient boost regression (XGBR) [64]. To validate their model, they utilized a dataset comprising 217 participants from the hospital, reporting a standard prediction error (SEP) of 9.78 mg/dL. The accuracy of the predicted glucose values was assessed through standard Clarke error grid analysis and Bland–Altman analysis. These evaluations revealed that the estimated blood glucose levels fell within the clinically acceptable region, indicating the clinical accuracy of the majority of the estimated values.
Boukhechba et al. proposed a novel method for the extraction of meaningful features from PPG signals to predict human activity [65]. While most technologies that use PPG signals attempt to remove motion artifacts caused by human activity, their approach leverages the sensitivity of the PPG signal to motion-induced damage to predict the type of activity performed by the user. To predict daily activities, such as walking, running, and jumping, they deconstructed the PPG signal into three components, namely cardiac, respiratory, and motion artifact signals, and applied convolutional and iterative layers in an end-to-end deep neural network. Although their experimental results did not reach the performance level of activity recognition using inertial measurement units, such as accelerometers and gyroscopes, their approach detected five types of activity (standing, walking, jogging, jumping, and sitting) at a reasonable level using only the PPG signal. In summary, the approach proposed by [65] has significance in expanding the application of PPG signals measured using wearable devices. Their method could potentially be used to recognize a wider range of activities with improved accuracy, making it an important contribution to the field of activity recognition.
4. Current Challenges
4.1. Sensor: LED Wavelength
The performance of PPG sensing is influenced by various factors, and one of the most significant factors is the choice of wavelength for skin illumination. The skin comprises water, hemoglobin, and melanin, which have distinctive light-absorbing characteristics based on the wavelength and chemical bonding [66,67,68,69]. Water, a primary constituent of the skin, exhibits high absorption of infrared (IR) light but shows minimal absorption of visible light. Melanin, which is closely related to skin color, demonstrates increased absorption as the wavelength decreases. These elements contribute to the DC component of the PPG signal since their amounts are not easily altered within short time intervals. Similarly, the absorption properties of hemoglobin decrease with increasing wavelength. However, when bound with oxygen, hemoglobin exhibits a significant reduction in absorption within the range of red (570–700 nm), and it becomes more absorbent at longer wavelengths such as IR compared to non-oxygenated hemoglobin [11,70]. Unlike water or melanin, the amount of hemoglobin varies with changes in blood flow, corresponding to the heartbeat at the measurement site. Therefore, hemoglobin’s light absorption contributes to the AC component, representing the pulsating element of the PPG signal. Scattering phenomena can occur through two mechanisms: surface effects such as reflection and refraction, or interactions with compounds in the skin that possess unique optical properties. Research suggests that around 4–7% of incident light is reflected from the skin surface, irrespective of the wavelength [69]. Generally, within the skin, the scattering coefficients demonstrate a decreasing pattern as the wavelength of light increases. During reflectance-mode PPG sensing, the path followed by photons within the skin is hypothesized to resemble an arc shape, as illustrated in Figure 1b. This path has a maximum depth referred to as the penetration depth, which relies on the absorption and scattering coefficients specific to the skin. As described in the working principle, the penetration depth tends to increase as the wavelength of light falls within the visible and IR range. It is important to account for variations in the penetration depth across different measurement sites when considering reflectance-mode PPG sensing.
Historically, in clinical environments, PPG signals with IR and red wavelengths were predominantly used to measure oxygen saturation. This choice was based on the significant difference in light absorption between oxyhemoglobin (HbO2) and deoxyhemoglobin (Hb) at these two wavelengths [22,71,72]. For this reason, early PPG systems primarily utilized light sources emitting IR or red wavelengths [73,74,75,76]. On the other hand, wrist-worn wearable devices mainly use green light (492–577 nm) for heart rate measurement [35,77]. Hemoglobin is the primary molecule that absorbs light in the blood. Green light (peak wavelength around 520 nm) is well absorbed by hemoglobin and the absorption is relatively constant over a wide range of oxygen saturation levels [36,37,78,79,80]. This characteristic makes green light a suitable choice for wearable PPG measurements, as it allows for accurate and consistent monitoring of changes in blood volume. In addition, green light also has an advantage regarding motion artifacts. Motion artifacts can be a major challenge in PPG measurements, especially in wrist-worn devices, where there can be significant movement. Several studies have presented evidence indicating that shorter wavelengths can enhance the signal-to-noise ratio (SNR) by reducing the susceptibility to motion-induced noise. This effect can be attributed to the relatively shorter path length and depth of penetration associated with shorter wavelengths [79,81]. Green light, which has shallower tissue penetration compared to wavelengths such as red or infrared [38,82], is less susceptible to motion artifacts. This characteristic makes it a practical choice for wrist-worn wearables. However, even when utilizing green light with a shorter wavelength, motion-induced noise contamination can still affect the acquired PPG signal in wearable systems. To mitigate such artifacts, a commonly employed approach involves the application of adaptive filter technologies, utilizing the acceleration signal as a motion reference [83,84,85]. Nevertheless, recent research has introduced an alternative technique that employs PPG signals within the infrared wavelength range as a motion reference for adaptive filtering [86,87]. This multi-wavelength approach takes advantage of the inherent vulnerability of long-wavelength PPG to motion-induced noise, as previously mentioned.
Shorter wavelengths, such as green light, have limited penetration depths, which restrict the collection of physiological information from deeper tissue layers. To address this limitation, there has been an increasing trend towards utilizing light sources of multiple wavelengths for photoplethysmography (PPG) measurements [88,89,90]. This approach capitalizes on the distinct interactions between light and tissue to enhance the physiological insights derived from PPG signals. Utilizing multiple wavelengths of light enables the acquisition of more comprehensive information about the cardiovascular system and other physiological processes. Several studies have conducted comprehensive investigations into the potential benefits of employing multi-wavelength PPG to estimate a wide range of health parameters. The specific advantages resulting from these studies will be thoroughly reviewed in Section 4.3.
4.2. Low-Power-Consumption System: Parabola Approximation
As mentioned in Section 3.2, the strategy of reducing the sampling rate of the PPG signal is being implemented to minimize power consumption. However, when working with PPG signals at a low sampling rate, an appropriate interpolation method becomes crucial in order to accurately extract the inter-bit interval required for PRV analysis. In one study [91], a simple and minimally computational interpolation method using parabolic approximation was applied to a PPG signal with a low sampling rate of 20 Hz. This method uses a generic parabola to estimate the true peak position and height by generating a curve fit through the three highest samples of the peak. The general vertex form of a quadratic function can be expressed as
To explain the parabolic interpolation approach, let us assume that the parabola has its three highest points at (−1, α), (0, β), and (1, γ). In this case, the interpolated peak position p and the peak amplitude b can be determined using the quadratic function.
Specifically, the three highest sample points are substituted into the general vertex form of a quadratic function, resulting in the following expression:
Hence, we can derive that , which implies that . From the expression for described secondly, the expression can also be obtained.
By substituting the expressions for and into the first expression for , we obtain , which implies that . Then, substituting the expressions for into the equation of yields the following expression for interpolated peak location:
Finally, the location of the peak on the x-axis can be determined by adding to the x-axis value of the central sample that has the highest amplitude.
The issue of peak detection in PPG signals at low sampling rates is illustrated in Figure 6. The background graph in gray represents the original 250-Hz PPG signal, while the round marker graph depicts the down-sampled signal at 30 Hz, 20 Hz, and 10 Hz. Lowering the sampling rate results in the detection of an incorrect peak position, leading to a substantial error in inter-beat interval measurement for PRV extraction. To mitigate this effect, parabolic approximation with the three largest samples per pulse of each low-sampling-rate signal can be used, as indicated by the dotted lines in Figure 6b,d,f. The peak of the parabola significantly reduces the error in peak detection, as evident in the figure, when compared to the peak obtained from the original 250-Hz PPG signal. Based on the assumption that the PPG signal is maximally parabolic, parabolic approximation using the three highest points provides an efficient and accurate method of identifying the true peak or very close peaks in a single step. Unlike traditional interpolation methods, such as cubic spline interpolation, this method only requires the location of the maximum point of the parabola and does not rely on a fully formed quadratic function. As a result, the computation is much simpler, particularly for low-power wearable applications. Therefore, the parabolic approximation remains the recommended interpolation method for the evaluation of trends in HRV measurements.
4.3. Multi-Wavelength PPG Signal Applications
Multi-wavelength PPG sensing technology is widely recognized as a robust method for the measurement of PPG signals [92,93]. Depending on an individual’s skin color, PPG-sensing light sources with various wavelengths can be selected to acquire the most robust PPG signal [94]. Furthermore, studies have indicated that the use of an optimal wavelength can enhance the signal-to-noise ratio (SNR), even in scenarios where reduced blood perfusion at low temperatures leads to a decrease in the SNR [95,96]. Blood pressure measurement is a notable application field for multi-wavelength PPG. As discussed in Section 4.1, multi-wavelength PPG signals provide blood pulsation information from various blood vessels located at different depths within the skin. Therefore, the time difference observed between PPG signals of different wavelengths acquired from the same body site can be considered as a localized pulse transit time (PTT), reflecting the characteristics of a specific segment of blood vessels beneath the skin. The PTT can serve as an indicator of systemic vascular resistance (SVR). As SVR directly influences the mean blood pressure (MBP), Liu et al. propose a PTT-based approach for continuous and cuffless BP measurement, and this method utilizes a single-site multi-wavelength PPG (blue (470 nm), green (570 nm), yellow (591 nm), and red (635 nm)) [97]. In their study, the artery is conceptualized as a bilateral elastic tube filled with blood. The MBP of this elastic tube depends on two factors: the cardiac output, which represents the flow rate at the inlet, and the SVR, which represents the resistance to blood flow at the outlet of the elastic tube. To establish their approach, the researchers employed physiological models that considered the relationship between the blood pressure, heart rate, stroke volume, and SVR. They also incorporated the electrical representation of the two-element arterial Windkessel model. The experimental findings demonstrated a strong correlation coefficient (r = 0.91) and a mean absolute difference (MAD) of 2.72 mm Hg between the predicted MBP and the invasively measured MBP. They also presented an enhanced algorithm to estimate blood pressure by deciphering the combined multi-wavelength PPG signals, which include diverse physiological information and motion artifacts. The algorithm utilizes principal component analysis (PCA) to extract the motion artifact component from the multi-wavelength PPG signal, allowing for the identification and exclusion of segments affected by motion. The results demonstrate the effectiveness of the PCA-based approach in improving the accuracy of blood pressure estimation, yielding errors of 1.44 ± 6.89 mm Hg for systolic blood pressure and −1.00 ± 6.71 mm Hg for diastolic blood pressure [98]. Multi-wavelength PPG is widely employed for the quantitative assessment of various blood parameters. In a study conducted by Hossain et al., PPG signals at three specific wavelengths (465 nm, 525 nm, and 615 nm) were utilized to estimate the levels of glycated hemoglobin in vivo [99]. The researchers proposed that blood consists of oxygenated hemoglobin (HbO), deoxyhemoglobin (HHb), and glycated hemoglobin (HbA1c). They further hypothesized that the HbA1c component remains consistent in the blood, comprising a mixture of 98% oxygenated HbA1c and 2% deoxygenated HbA1c. By applying the Beer–Lambert law to the PPG signal, they were able to estimate the quantity of glycated hemoglobin present in the blood. The study findings indicated that the estimation errors for HbA1c were not influenced by the oxygen saturation levels (SpO2) and were found to be within the magnitude of 10−14%. Rachim et al. conducted a study to estimate blood glucose levels through the measurement of multi-wavelength PPG signals obtained from the wrist. The wavelengths used for measurement were 950, 850, 660, and 530 nm. The researchers employed an ensemble averaging algorithm based on the PPG peak to obtain the average signal. Subsequently, they extracted a total of 24 features from the average signal: three features were obtained from the difference in optical density between the amplitudes of the pulsatile and non-pulsatile components, and three features were obtained from the Teager–Kaiser energy operator for each wavelength. The extracted features were then used in combination with the partial least squares (PLS) algorithm to establish a relationship between changes in feature data and variations in baseline glucose concentrations obtained from blood samples of the subjects. For the experimental validation, 12 volunteers consumed a modified carbohydrate-rich meal for 2 h, and the estimated blood glucose concentrations were compared with the baseline values. The results demonstrated a mean correlation coefficient (R) of 0.86 between the estimated and baseline blood glucose concentrations, with a standard error of prediction (SPE) of 6.16 mg/dL [100].
5. Future Directions
Since the previous literature review on wearable photoplethysmography (PPG) signals published in 2014 in the journal Electronics [16], wearable PPG technology has been rapidly developed. The principle of signal measurement is widely recognized and it has become a commonly used sensor technology in the latest wearable devices, such as wristbands and smartwatches. However, acquiring high-quality PPG signals during daily life remains challenging due to external light interference, which is often caused by subjects not wearing the wrist device sufficiently tightly. Motion noise caused by hand movements is also a factor. Most studies have not evaluated the robustness of PPG signals and the accuracy of health and wellness index monitoring in a 24-h free-living situation. While continuous heart rate measurements have been reported to be accurate in a free-living environment, the same cannot be said for other PPG-derived health and wellness parameters [101,102].
Considering the unavoidable presence of motion noise inherent in such devices, it is imperative to explore and develop new parameters that can be extracted from wearable PPG systems. Despite the utilization of advanced signal processing techniques, accurately restoring the phase and amplitude of a signal contaminated by motion artifacts remains challenging. Consequently, the implementation of many of the application fields listed in Table 2 for continuous 24-h monitoring becomes difficult. For instance, cuffless blood pressure measurement technology based on the pulse wave analysis (PWA) method still faces technical limitations in operating continuously for 24-h measurements. Similarly, techniques such as stress measurement using heart rate variability (HRV) may result in phase changes in the PPG waveform due to motion artifacts, making it impossible to accurately measure the inter-beat interval and leading to errors in deriving HRV parameters. In addressing this issue, one study [103] introduced a novel index that incorporated heart rate variability (HRV) information. The algorithm employed an adaptive notch-filter-based frequency tracking algorithm, optimized to better reflect the instantaneous heart rate variability by adjusting the filter’s bandwidth and the forgetting factor of the adaptation mechanism. The standard deviation of the extracted heart rate was introduced as a novel HRV index calculated from wearable PPG signals. The study reported that the proposed method enabled the monitoring of statistically significant changes in HRV during different sleep stages. Furthermore, when subjects were exposed to stress during a socially evaluated speaking task, the proposed method also demonstrated a significant decrease in HRV. These findings highlight the potential of the proposed method to monitor health and wellness-related indicators, even in the presence of motion noise. To achieve the continuous monitoring of the health and wellness-related indicators presented in Table 2 using PPG signals obtained during daily activities, it is crucial to conduct research focused on developing novel analysis parameters that move beyond traditional methods. Such endeavors will contribute to enhancing the accuracy and reliability of wearable PPG systems in real-world scenarios.
Table 2 presents findings demonstrating the significant monitoring of various health indicators through photoplethysmography (PPG) measurements using wrist-wearable devices. While these studies have provided valuable insights, a significant limitation exists in the current literature. Most of these investigations have primarily focused on evaluating the accuracy of the algorithm at the time of its development and creation. However, it is crucial to acknowledge that human physiology is subject to change over time. Wearable devices are designed to be used in diverse real-world environments rather than controlled laboratory conditions. As a result, there is a need to investigate the algorithm’s accuracy and performance in such daily scenarios. Evaluating the sustained accuracy of these algorithms becomes imperative to ensure their reliability and effectiveness in practical applications. One aspect that warrants attention is the short-term accuracy assessment, involving monitoring periods as short as 24 h. This evaluation provides insights into the algorithm’s stability over a brief duration. Within this timeframe, factors such as daily activities, physiological variations, and external influences may impact the algorithm’s performance. By examining the accuracy over a 24-h period, potential deviations or inconsistencies that may arise during typical daily routines can be identified. Furthermore, it is also essential to investigate the long-term accuracy of these algorithms over several months. Human physiology undergoes gradual changes over time due to factors such as aging, lifestyle modifications, or underlying health conditions. Additionally, wearable devices are subject to environmental factors such as temperature, humidity, and motion artifacts that can affect the measurement accuracy. Evaluating the algorithm’s performance over an extended period provides insights into its robustness and ability to maintain accuracy amidst changing physiological and environmental conditions. Assessing the sustained accuracy of these algorithms is crucial for their practical implementation in healthcare settings and ensures that they remain reliable and effective beyond their initial development stages. By evaluating their accuracy in real-world scenarios over extended periods, healthcare professionals can have confidence in utilizing these algorithms for continuous health monitoring and timely interventions.
While there have been instances where users have worn photoplethysmography (PPG) systems for extended periods without experiencing any skin burns or allergic reactions, it is important to highlight that reports of burns or skin irritation in areas where the system is worn have been documented within the internet community [104,105,106]. PPG sensors typically use LEDs to emit light into the skin. LEDs emit a certain amount of heat as a byproduct of their operation. If the LEDs are not properly calibrated or they generate excessive heat, localized heating of the skin can occur, increasing the risk of burns or discomfort. In addition, prolonged contact and repetitive movement during physical activity can create friction between the device and the skin. Friction generates heat, which, when trapped between the device and the skin, can cause thermal injuries or burns. This heating is especially relevant if the device fits tightly or if the user engages in intense physical exercise that leads to excessive sweating and reduced heat dissipation. Nevertheless, there is currently a lack of comprehensive research addressing the occurrence of skin burns, specifically in relatively low-temperature environments, resulting from the prolonged use of PPG sensors. Therefore, it is crucial to investigate which users may be more susceptible to low-temperature burns and to explore strategies aimed at developing sensors and systems that effectively prevent such occurrences.
Author Contributions
Conceptualization, K.B.K. and H.J.B.; methodology and formal analysis, K.B.K. and H.J.B.; investigation, K.B.K. and H.J.B.; writing—original draft preparation, K.B.K.; writing—review and editing, H.J.B.; visualization, K.B.K. and H.J.B.; supervision, H.J.B. All authors have read and agreed to the published version of the manuscript.
Funding
This article was supported by the “Regional Innovation Strategy (RIS)” administered through the National Research Foundation of Korea (NRF), funded by the Ministry of Education (MOE) (2021RIS-004). This work was also supported by the Soonchunhyang University Research Fund.
Data Availability Statement
Not applicable.
Conflicts of Interest
The authors declare no conflict of interest.
References
- Xie, Y.; Lu, L.; Gao, F.; He, S.-J.; Zhao, H.-J.; Fang, Y.; Yang, J.-M.; An, Y.; Ye, Z.-W.; Dong, Z. Integration of artificial intelligence, blockchain, and wearable technology for chronic disease management: A new paradigm in smart healthcare. Curr. Med. Sci. 2021, 41, 1123–1133. [Google Scholar] [CrossRef] [PubMed]
- Chu, E.C.-P.; Mok, S.T.K.; Chow, I.S.W.; Chin, W.L. The opportunity to unlock the architecture of healthcare model: Chiropractic care-at-home. J. Contemp. Chiropr. 2022, 5, 44–49. [Google Scholar]
- Lim, Y.G.; Hong, K.H.; Kim, K.K.; Shin, J.H.; Lee, S.M.; Chung, G.S.; Baek, H.J.; Jeong, D.-U.; Park, K.S. Monitoring physiological signals using nonintrusive sensors installed in daily life equipment. Biomed. Eng. Lett. 2011, 1, 11–20. [Google Scholar] [CrossRef]
- Lee, S.M.; Lee, D. Healthcare wearable devices: An analysis of key factors for continuous use intention. Serv. Bus. 2020, 14, 503–531. [Google Scholar] [CrossRef]
- Ahmed, A.; Aziz, S.; Abd-alrazaq, A.; Farooq, F.; Sheikh, J. Overview of Artificial Intelligence–Driven Wearable Devices for Diabetes: Scoping Review. J. Med. Internet Res. 2022, 24, e36010. [Google Scholar] [CrossRef]
- Miller, D.J.; Sargent, C.; Roach, G.D. A Validation of Six Wearable Devices for Estimating Sleep, Heart Rate and Heart Rate Variability in Healthy Adults. Sensors 2022, 22, 6317. [Google Scholar] [CrossRef]
- Cho, J. Current status and prospects of health-related sensing technology in wearable devices. J. Healthc. Eng. 2019, 2019, 3924508. [Google Scholar] [CrossRef]
- Steven Eyobu, O.; Han, D.S. Feature Representation and Data Augmentation for Human Activity Classification Based on Wearable IMU Sensor Data Using a Deep LSTM Neural Network. Sensors 2018, 18, 2892. [Google Scholar] [CrossRef] [Green Version]
- Fotouhi-Ghazvini, F.; Abbaspour, S. Wearable Wireless Sensors for Measuring Calorie Consumption. J. Med. Signals Sens. 2020, 10, 19–34. [Google Scholar] [CrossRef]
- Pham, T.T.; Duong, H.T.; Suh, Y.S. Opportunistic Calibration Method for Walking Distance Estimation Using a Waist-Mounted Inertial Sensor. IEEE Trans. Instrum. Meas. 2020, 69, 7906–7913. [Google Scholar] [CrossRef]
- Allen, J. Photoplethysmography and its application in clinical physiological measurement. Physiol. Meas. 2007, 28, R1–R39. [Google Scholar] [CrossRef] [Green Version]
- Castaneda, D.; Esparza, A.; Ghamari, M.; Soltanpur, C.; Nazeran, H. A review on wearable photoplethysmography sensors and their potential future applications in health care. Int. J. Biosens. Bioelectron. 2018, 4, 195–202. [Google Scholar]
- Loh, H.W.; Xu, S.; Faust, O.; Ooi, C.P.; Barua, P.D.; Chakraborty, S.; Tan, R.-S.; Molinari, F.; Acharya, U.R. Application of photoplethysmography signals for healthcare systems: An in-depth review. Comput. Methods Programs Biomed. 2022, 216, 106677. [Google Scholar] [CrossRef]
- Biswas, D.; Simões-Capela, N.; Van Hoof, C.; Van Helleputte, N. Heart Rate Estimation from Wrist-Worn Photoplethysmography: A Review. IEEE Sens. J. 2019, 19, 6560–6570. [Google Scholar] [CrossRef]
- Maity, A.K.; Veeraraghavan, A.; Sabharwal, A. PPGMotion: Model-based detection of motion artifacts in photoplethysmography signals. Biomed. Signal Process. Control 2022, 75, 103632. [Google Scholar] [CrossRef]
- Tamura, T.; Maeda, Y.; Sekine, M.; Yoshida, M. Wearable Photoplethysmographic Sensors—Past and Present. Electronics 2014, 3, 282–302. [Google Scholar] [CrossRef]
- Schmitt, J.M. Simple photon diffusion analysis of the effects of multiple scattering on pulse oximetry. IEEE Trans. Biomed. Eng. 1991, 38, 1194–1203. [Google Scholar] [CrossRef]
- Rolfe, P. In Vivo Near-Infrared Spectroscopy. Annu. Rev. Biomed. Eng. 2000, 2, 715–754. [Google Scholar] [CrossRef]
- Kumar, G.; Schmitt, J.M. Optimal probe geometry for near-infrared spectroscopy of biological tissue. Appl. Opt. 1997, 36, 2286–2293. [Google Scholar] [CrossRef]
- McCully, K.; Hamaoka, T. Near-infrared spectroscopy: What can it tell us about oxygen saturation in skeletal muscle. Exerc. Sport Sci. Rev. 2000, 28, 123–127. [Google Scholar]
- Maikala, R.V. Modified Beer’s Law—Historical perspectives and relevance in near-infrared monitoring of optical properties of human tissue. Int. J. Ind. Ergon. 2010, 40, 125–134. [Google Scholar] [CrossRef]
- Wukitsch, M.W.; Petterson, M.T.; Tobler, D.R.; Pologe, J.A. Pulse oximetry: Analysis of theory, technology, and practice. J. Clin. Monit. Comput. 1998, 4, 290–301. [Google Scholar] [CrossRef] [PubMed]
- Brown, W.E.L.; Hill, A.V. The oxygen-dissociation curve of blood, and its thermodynamical basis. Proc. R. Soc. Lond. Ser. B 1923, 94, 297–334. [Google Scholar]
- Maxim Integrated. MAX30101 Data Sheet. 2020. Available online: https://www.analog.com/media/en/technical-documentation/data-sheets/MAX30101.pdf (accessed on 18 May 2023).
- Maxim Integrated. MAX86150 Data Sheet. 2018. Available online: https://www.analog.com/media/en/technical-documentation/data-sheets/MAX86150.pdf (accessed on 18 May 2023).
- Maxim Integrated. MAX86916 Data Sheet. 2019. Available online: https://www.analog.com/media/en/technical-documentation/data-sheets/MAX86916.pdf (accessed on 18 May 2023).
- Analog Devices. ADPD144RI Data Sheet. 2019. Available online: https://www.analog.com/media/en/technical-documentation/data-sheets/ADPD144RI.pdf (accessed on 18 May 2023).
- Analog Devices. ADPD188GG Data Sheet. 2018. Available online: https://www.analog.com/media/en/technical-documentation/data-sheets/adpd188gg.pdf (accessed on 18 May 2023).
- Osram Opto Semiconductors. SFH 7051 Data Sheet. 2016. Available online: https://look.ams-osram.com/m/1bc51f319852c566/original/SFH-7051.pdf (accessed on 18 May 2023).
- Osram Opto Semiconductors. SFH 7072 Data Sheet. 2022. Available online: https://look.ams-osram.com/m/682b32d8c8dd3713/original/SFH-7072.pdf (accessed on 18 May 2023).
- Osram Opto Semiconductors. SFH 7050 Data Sheet. 2016. Available online: https://look.ams-osram.com/m/470e18924403347a/original/SFH-7050.pdf (accessed on 18 May 2023).
- AMS AG. AS7024 Data Sheet. 2018. Available online: https://ams.com/documents/20143/36005/AS7024_DS000469_4-00.pdf (accessed on 18 May 2023).
- AMS AG. AS7-26GG Data Sheet. 2021. Available online: https://look.ams-osram.com/m/6615cb0b344731f0/original/AS7026GG-DS000622.pdf (accessed on 18 May 2023).
- Baek, H.J.; Shin, J.; Cho, J. The Effect of Optical Crosstalk on Accuracy of Reflectance-Type Pulse Oximeter for Mobile Healthcare. J. Healthc. Eng. 2018, 2018, 3521738. [Google Scholar] [CrossRef] [Green Version]
- NXP Semiconductors. Kinetis KL03 Data Sheet. 2022. Available online: https://www.nxp.com/docs/en/data-sheet/KL03P24M48SF0.pdf (accessed on 18 May 2017).
- Zhang, D.; Liu, Z.; Wu, Y.; Ji, S.; Yuan, Z.; Liu, J.; Zhu, M. In Situ Construction a Stable Protective Layer in Polymer Electrolyte for Ultralong Lifespan Solid-State Lithium Metal Batteries. Adv. Sci. 2022, 9, 2104277. [Google Scholar] [CrossRef]
- Ownby, N.B.; Flynn, K.A.; Calhoun, B.H. Modeling Energy Aware Photoplethysmography for Personalized Healthcare Applications. IEEE Trans. Biomed. Circuits Syst. 2022, 16, 570–579. [Google Scholar] [CrossRef]
- Lee, E.; Lee, C. PPG-Based Smart Wearable Device with Energy-Efficient Computing for Mobile Health-Care Applications. IEEE Sens. J. 2021, 21, 13564–13573. [Google Scholar] [CrossRef]
- Lin, B.; Ma, Z.; Atef, M.; Ying, L.; Wang, G. Low-Power High-Sensitivity Photoplethysmography Sensor for Wearable Health Monitoring System. IEEE Sens. J. 2021, 21, 16141–16151. [Google Scholar] [CrossRef]
- Ortegón-Aguilar, J.; Castillo-Atoche, A.; Becerra-Nuñez, G.; Estrada-López, J.J.; Osorio-de-la-Rosa, E.; Carrasco-Alvarez, R.; Datta, A.; Vázquez-Castillo, J. Multimodal Power Management Based on Decision Tree for Internet of Wearable Things Systems. Appl. Sci. 2023, 13, 4351. [Google Scholar] [CrossRef]
- Ghasemzadeh, H.; Amini, N.; Saeedi, R.; Sarrafzadeh, M. Power-Aware Computing in Wearable Sensor Networks: An Optimal Feature Selection. IEEE Trans. Mob. Comput. 2015, 14, 800–812. [Google Scholar] [CrossRef]
- Kalantarian, H.; Sideris, C.; Mortazavi, B.; Alshurafa, N.; Sarrafzadeh, M. Dynamic Computation Offloading for Low-Power Wearable Health Monitoring Systems. IEEE Trans. Biomed. Eng. 2017, 64, 621–628. [Google Scholar] [CrossRef]
- Liang, J.M.; Chen, J.J.; Cheng, H.H.; Tseng, Y.C. An energy-efficient sleep scheduling with QoS consideration in 3GPP LTE-advanced networks for Internet of things. IEEE J. Emerg. Sel. Topics Circuits Syst. 2013, 3, 13–22. [Google Scholar] [CrossRef]
- Wu, H.; Chen, C.; Weng, K. An Energy-Efficient Strategy for Microcontrollers. Appl. Sci. 2021, 11, 2581. [Google Scholar] [CrossRef]
- Rezaie, H.; Ghassemian, M. An Adaptive Algorithm to Improve Energy Efficiency in Wearable Activity Recognition Systems. IEEE Sens. J. 2017, 17, 5315–5323. [Google Scholar] [CrossRef]
- Covi, E.; Donati, E.; Liang, X.; Kappel, D.; Heidari, H.; Payvand, M.; Wang, W. Adaptive Extreme Edge Computing for Wearable Devices. Front. Neurosci. 2021, 15, 611300. [Google Scholar] [CrossRef]
- Choi, A.; Shin, H. Photoplethysmography sampling frequency: Pilot assessment of how low can we go to analyze pulse rate variability with reliability? Physiol. Meas. 2017, 38, 586. [Google Scholar] [CrossRef]
- Béres, S.; Hejjel, L. The minimal sampling frequency of the photoplethysmogram for accurate pulse rate variability parameters in healthy valunteers. Biomed. Signal Process. Control 2021, 68, 102589. [Google Scholar] [CrossRef]
- Peláez-Coca, M.D.; Hernando, A.; Lázaro, J.; Gil, E. Impact of the PPG Sampling Rate in the Pulse Rate Variability Indices Evaluating Several Fiducial Points in Different Pulse Waveforms. IEEE J. Biomed. Health Inform. 2022, 26, 539–549. [Google Scholar] [CrossRef]
- Fuller, D.; Colwell, E.; Low, J.; Orychock, K.; Tobin, M.A.; Simango, B.; Buote, R.; Van Heerden, D.; Luan, H.; Cullen, K.; et al. Reliability and Validity of Commercially Available Wearable Devices for Measuring Steps, Energy Expenditure, and Heart Rate: Systematic Review. JMIR mHealth uHealth 2020, 8, e18694. [Google Scholar] [CrossRef]
- Schäfer, A.; Vagedes, J. How accurate is pulse rate variability as an estimate of heart rate variability? A review on studies mhealth comparing photoplethysmographic technology with an electrocardiogram. Int. J. Cardiol. 2013, 166, 15–29. [Google Scholar] [CrossRef]
- Gil, E.; Orini, M.; Bailón, R.; Vergara, J.M.; Mainardi, L.; Laguna, R. Photoplethysmography pulse rate variability as a surrogate measurement of heart rate variability during non-stationary conditions. Physiol. Meas. 2010, 31, 1271. [Google Scholar] [CrossRef] [PubMed]
- Zubair, M.; Yoon, C. Multilevel mental stress detection using ultra-short pulse rate variability series. Biomed. Signal Process. Control 2020, 57, 101736. [Google Scholar] [CrossRef]
- Pugliese, L.; Violante, M.; Groppo, S. A Novel Algorithm for Detecting the Drowsiness Onset in Real-Time. IEEE Access 2022, 10, 42601–42606. [Google Scholar] [CrossRef]
- Wulterkens, B.M.; Fonseca, P.; Hermans, L.W.; Ross, M.; Cerny, A.; Anderer, P.; Long, X.; van Dijk, J.P.; Vandenbussche, N.; Pillen, S.; et al. It is all in the wrist: Wearable sleep staging in a clinical population versus reference polysomnography. Nat. Sci. Sleep 2021, 13, 885–897. [Google Scholar] [CrossRef]
- Mukkamala, R.; Stergiou, G.S.; Avolio, A.P. Cuffless Blood Pressure Measurement. Annu. Rev. Biomed. Eng. 2022, 24, 203–230. [Google Scholar] [CrossRef]
- Islam, S.M.S.; Chow, C.K.; Daryabeygikhotbehsara, R.; Subedi, N.; Rawstorn, J.; Tegegne, T.; Karmakar, C.; Siddiqui, M.U.; Lambert, G.; Maddison, R. Wearable cuffless blood pressure monitoring devices: A systematic review and meta-analysis. Eur. Heart J. Digit. Health 2022, 3, 323–337. [Google Scholar] [CrossRef]
- Yao, P.; Xue, N.; Yin, S.; You, C.; Guo, Y.; Shi, Y. Multi-Dimensional Feature Combination Method for Continuous Blood Pressure Measurement Based on Wrist PPG Sensor. IEEE J. Biomed. Health Inform. 2022, 26, 3708–3719. [Google Scholar] [CrossRef]
- Shi, W.; Zhou, C.; Zhang, Y.; Li, K.; Ren, X.; Liu, H.; Ye, X. Hybrid modeling on reconstitution of continuous arterial blood pressure using finger photoplethysmography. Biomed. Signal Process. Control 2023, 85, 104972. [Google Scholar] [CrossRef]
- Monte-Moreno, E. Non-invasive estimation of blood glucose and blood pressure from a photoplethysmography by means of machine learning techniques. Artif. Intell. Med. 2011, 53, 127–128. [Google Scholar] [CrossRef]
- Tsai, C.; Li, C.; Lam, R.; Li, C.; Ho, S. Diabetes Care in Motion: Blood Glucose Estimation Using Wearable Devices. IEEE Consum. Electron. Mag. 2020, 8, 30–34. [Google Scholar] [CrossRef]
- Islam, T.; Ahmed, M.; Hassanuzzaman, M.; Amir, S.B.; Rahman, T. Blood Glucose Level Regression for Smartphone PPG Signals Using Machine Learning. Appl. Sci. 2021, 11, 618. [Google Scholar] [CrossRef]
- Prabha, A.; Yadav, J.; Rani, A.; Singh, V. Design of intelligent diabetes mellitus detection system using hybrid feature selection based on XGBoost classifier. Comput. Biol. Med. 2021, 136, 104664. [Google Scholar] [CrossRef]
- Prabha, A.; Yadav, J.; Rani, A.; Singh, V. Intelligent estimation of blood glucose level using wristband PPG signal and physiological parameters. Biomed. Signal Process. Control 2022, 78, 103876. [Google Scholar] [CrossRef]
- Boukhechba, M.; Cai, L.; Wu, C.; Barnes, L.E. ActiPPG: Using deep neural networks for activity recognition from wrist-worn photoplethysmography (PPG) sensors. Smart Health 2019, 14, 100082. [Google Scholar] [CrossRef]
- Zonios, G.; Dimou, A.; Bassukas, I.; Galaris, D.; Tsolakidis, A.; Kaxiras, E. Melanin absorption spectroscopy: New method for noninvasive skin investigation and melanoma detection. J. Biomed. Opt. 2008, 13, 014017. [Google Scholar] [CrossRef] [Green Version]
- Bashkatov, A.N.; Genina, E.A.; Kochubey, V.I.; Tuchin, V.V. Optical properties of human skin subcutaneous and mucous tissues in the wavelength range from 400 to 2000 nm. J. Phys. D Appl. Phys. 2005, 38, 2543–2555. [Google Scholar] [CrossRef]
- Lemay, M.; Bertschi, M.; Sola, J.; Renevey, P.; Parak, J.; Korhonen, I. Application of optical heart rate monitoring. In Wearable Sensors: Fundamentals Implementation and Applications; Academic Press: Cambridge, MA, USA, 2014; pp. 105–129. [Google Scholar]
- Lister, T.; Wright, P.A.; Chappell, P.H. Optical properties of human skin. J. Biomed. Opt. 2012, 17, 909011. [Google Scholar] [CrossRef] [Green Version]
- Taroni, P.; Pifferi, A.; Torricelli, A.; Comelli, D.; Cubeddu, R. In vivo absorption and scattering spectroscopy of biological tissues. Photochem. Photobiol. Sci. 2003, 2, 124–129. [Google Scholar] [CrossRef]
- Mannheimer, P.D.; Cascini, J.R.; Fein, M.E.; Nierlich, S.L. Wavelength selection for low-saturation pulse oximetry. IEEE Trans. Biomed. Eng. 1997, 44, 148–158. [Google Scholar] [CrossRef]
- Sinex, J.E. Pulse oximetry: Principle and limitations. AM J. Emerg. Med. 1999, 17, 59–66. [Google Scholar] [CrossRef]
- Baek, H.J.; Chung, G.S.; Kim, K.K.; Park, K.S. A smart health monitoring chair for nonintrusive measurement of biological signals. IEEE Trans. Inform. Technol. Biomed. 2012, 16, 150–158. [Google Scholar] [CrossRef] [PubMed]
- Naschitz, J.E.; Bezobchuk, S.; Mussafia-Priselac, R.; Sundick, S.; Dreyfuss, D.; Khorshidi, I.; Karidis, A.; Manor, H.; Nagar, M.; Peck, E.R.; et al. Pulse Transit Time by R-Wave-Gated Infrared Photoplethysmography: Review of the Literature and Personal Experience. J. Clin. Monit. Comput. 2004, 18, 333–342. [Google Scholar] [CrossRef] [PubMed]
- Stojanovic, R.; Karadaglic, D. A LED-LED-based photoplethysmography sensor. Physiol. Meas. 2007, 28, N19. [Google Scholar] [CrossRef] [PubMed]
- Teng, X.F.; Zhang, Y.T. The effect of contacting force on photoplethysmographic signals. Physiol. Meas. 2004, 25, 1323. [Google Scholar] [CrossRef]
- Maeda, Y.; Sekine, M.; Tamura, T. The Advantages of Wearable Green Reflected Photoplethysmography. J. Med. Syst. 2011, 35, 829–834. [Google Scholar] [CrossRef]
- Mainster, M.A. Wavelength Selection in Macular Photocoagulation: Tissue Optics, Thermal Effects, and Laser Systems. Ophthalmology 1986, 93, 952–958. [Google Scholar] [CrossRef]
- Matsumura, K.; Rolfe, P.; Lee, J.; Yamakoshi, T. iPhone 4s photoplethysmography: Which light color yields the most accurate heart rate and normalized pulse volume using the iPhysioMeter application in the presence of motion artifact? PLoS ONE 2014, 9, e91205. [Google Scholar] [CrossRef]
- Shao, D.; Liu, C.; Tsow, F.; Yang, Y.; Du, Z.; Iriya, R.; Yu, H.; Tao, N. Noncontact Monitoring of Blood Oxygen Saturation Using Camera and Dual-Wavelength Imaging System. IEEE Trans. Biomed. Eng. 2016, 63, 1091–1098. [Google Scholar] [CrossRef]
- Wijshoff, R.W.C.G.R.; Veen, J.; Van der Lee, A.M.; Mulder, L.; Stijnen, M.; Van Tuijl, S.; Aarts, R.M. PPG motion artifact handling using a self-mixing interferometric sensor. Proc. SPIE 2011, 7894, 78940F. [Google Scholar]
- Lee, J.; Matsumura, K.; Yamakoshi, K.I.; Rolfe, P.; Tanaka, S.; Yamakoshi, T. Comparison between red, green and blue light reflection photoplethysmography for heart rate monitoring during motion. Conf. Proc. IEEE Eng. Med. Biol. Soc. 2013, 2013, 1724–1727. [Google Scholar]
- Lee, B.; Han, J.; Baek, H.J.; Shin, J.H.; Park, K.S.; Yi, W.J. Improved elimination of motion artifacts from a photoplethysmographic signal using a Kalman smoother with simultaneous accelerometry. Physiol. Meas. 2010, 31, 1585. [Google Scholar] [CrossRef]
- Ram, M.R.; Madhav, K.V.; Krishna, E.H.; Komalla, N.R.; Reddy, K.A. A Novel Approach for Motion Artifact Reduction in PPG Signals Based on AS-LMS Adaptive Filter. IEEE Trans. Instrum. Meas. 2012, 61, 1445–1457. [Google Scholar] [CrossRef]
- Chowdhury, S.S.; Hyder, R.; Hafiz, M.S.B.; Haque, M.A. Real-Time Robust Heart Rate Estimation from Wrist-Type PPG Signals Using Multiple Reference Adaptive Noise Cancellation. IEEE J. Biomed. Health Inform. 2018, 22, 450–459. [Google Scholar] [CrossRef]
- Zhang, Y.; Song, S.; Vullings, R.; Biswas, D.; Simões-Capela, N.; van Helleputte, N.; van Hoof, C.; Groenendaal, W. Motion Artifact Reduction for Wrist-Worn Photoplethysmograph Sensors Based on Different Wavelengths. Sensors 2019, 19, 673. [Google Scholar] [CrossRef] [Green Version]
- Wang, C.Y.; Tang, K.T. Active noise cancellation of motion artifacts in pulse oximetry using isobestic wavelength light source. In Proceedings of the 2011 IEEE International Symposium of Circuits and Systems, Rio de Janeiro, Brazil, 15–18 May 2011; pp. 1029–1032. [Google Scholar]
- Ray, D.; Collins, T.; Wolley, S.I.; Ponnapalli, P.V.S. A Review of Wearable Multi-Wavelength Photoplethysmography. IEEE Rev. Biomed. Eng. 2023, 16, 136–158. [Google Scholar] [CrossRef]
- Liu, J.; Yan, B.P.; Dai, W.-X.; Ding, X.-R.; Zhang, Y.-T.; Zhao, N. Multi-wavelength photoplethysmography method for skin arterial pulse extraction. Biomed. Opt. Express 2016, 7, 4313–4326. [Google Scholar] [CrossRef] [Green Version]
- Lee, J.; Kim, M.; Park, H.-K.; Kim, I.Y. Motion Artifact Reduction in Wearable Photoplethysmography Based on Multi-Channel Sensors with Multiple Wavelengths. Sensors 2020, 20, 1493. [Google Scholar] [CrossRef] [Green Version]
- Baek, H.J.; Shin, J.; Jin, G.; Cho, J. Reliability of the Parabola Approximation Method in Heart Rate Variability Analysis Using Low-Sampling-Rate Photoplethysmography. J. Med. Syst. 2017, 41, 189. [Google Scholar] [CrossRef]
- Asare, L.; Kviesis-Kipge, E.; Grabovskis, A.; Rubins, U.; Erts, R.; Spigulis, J. Multi-spectral photoplethysmography biosensor. Proc. SPIE 2011, 8073, 374–379. [Google Scholar]
- Kumar, M.; Veeraraghavan, A.; Sabharwal, A. DistancePPG: Robust non-contact vital signs monitoring using a camera. Biomed. Opt. Express 2015, 6, 1565–1588. [Google Scholar] [CrossRef] [Green Version]
- Yan, L.; Hu, S.; Alzahrani, A.; Alharbi, S.; Blanos, P. A multi-wavelength opto-electronic patch sensor to effectively detect physiological changes against human skin types. Biosensors 2017, 7, 22. [Google Scholar] [CrossRef] [PubMed] [Green Version]
- Jeong, C.; Yoon, H.; Kang, H.; Yeom, H. Effects of skin surface temperature on photoplethysmography. J. Healthc. Eng. 2014, 5, 429–438. [Google Scholar] [CrossRef] [PubMed] [Green Version]
- Spigulis, J.; Gailite, L.; Lihachev, A.; Erts, R. Simultaneous recording of skin blood pulsations at different vascular depths by multiwavelength photoplethysmography. Appl. Opt. 2007, 46, 1754–1759. [Google Scholar] [CrossRef] [PubMed] [Green Version]
- Liu, J.; Yan, B.P.; Zhang, Y.T.; Ding, X.R.; Su, P.; Zhao, N. Multi-Wavelength Photoplethysmography Enabling Continuous Blood Pressure Measurement with Compact Wearable Electronics. IEEE Trans. Biomed. Eng. 2019, 66, 1514–1525. [Google Scholar] [CrossRef]
- Liu, J.; Qiu, S.; Luo, N.; Lau, S.K.; Yu, H.; Kwok, T.; Zhang, Y.T.; Zhao, N. PCA-Based Multi-Wavelength Photoplethysmography Algorithm for Cuffless Blood Pressure Measurement on Elderly Subjects. IEEE J. Biomed. Health Inform. 2021, 25, 663–673. [Google Scholar] [CrossRef]
- Hossain, S.; Haque, C.A.; Kim, K.-D. Quantitative Analysis of Different Multi-Wavelength PPG Devices and Methods for Noninvasive In-Vivo Estimation of Glycated Hemoglobin. Appl. Sci. 2021, 11, 6867. [Google Scholar] [CrossRef]
- Rachim, V.P.; Chung, W.-Y. Wearable-band type visible-near infrared optical biosensor for non-invasive blood glucose monitoring. Sens. Actuators B Chem. 2019, 286, 173–180. [Google Scholar] [CrossRef]
- Gorny, A.W.; Liew, S.J.; Tan, C.S.; Müller-Riemenschneider, F. Fitbit Charge HR Wireless Heart Rate Monitor: Validation Study Conducted Under Free-Living Conditions. JMIR mHealth uHealth 2017, 5, e157. [Google Scholar] [CrossRef]
- Nelson, B.W.; Allen, N.B. Accuracy of Consumer Wearable Heart Rate Measurement During an Ecologically Valid 24-Hour Period: Intraindividual Validation Study. JMIR mHealth uHealth 2019, 7, e10828. [Google Scholar] [CrossRef]
- Baek, H.J.; Cho, J. Novel heart rate variability index for wrist-worn wearable devices subject to motion artifacts that complicate measurement of the continuous pulse inverval. Physiol. Meas. 2019, 40, 105010. [Google Scholar]
- Daily Mail. Samsung Galaxy Watch User Claims Wearable Burned Their Wrist When Left on While They Were Sleeping. September 2022. Available online: https://www.dailymail.co.uk/sciencetech/article-11232191/Samsung-Galaxy-Watch-user-claims-wearable-BURNED-wrist-left-sleeping.html (accessed on 22 May 2023).
- 7 News Miami. Fort Lauderdale Woman Says Apple Watch Left Burn on Her Arm. April 2022. Available online: https://wsvn.com/news/local/fort-lauderdale-woman-says-apple-watch-left-burn-on-her-arm/ (accessed on 22 May 2023).
- ABC 7 News. Fitbit Smartwatch Recalled for Burn Risk 8 Years after Previous Tracker Recall. March 2022. Available online: https://abc7news.com/fitbit-ionic-recall-smartwatch-tracker-burn/11615270/ (accessed on 22 May 2023).
Figure 1.
(a) Absorbed and reflected light in living tissue for PPG model. (b) the measurement model of reflectance type PPG through the skin microvascular layer, with emphasis on the role of wavelength. The amount of absorbed light correlates with the pulsation of arterial blood. In the systolic phase, the diameter of the arterial vessels is maximal and therefore the absorbance due to arterial hemoglobin is also maximal and the amount of detected light is low, which corresponds to a sensor peak.
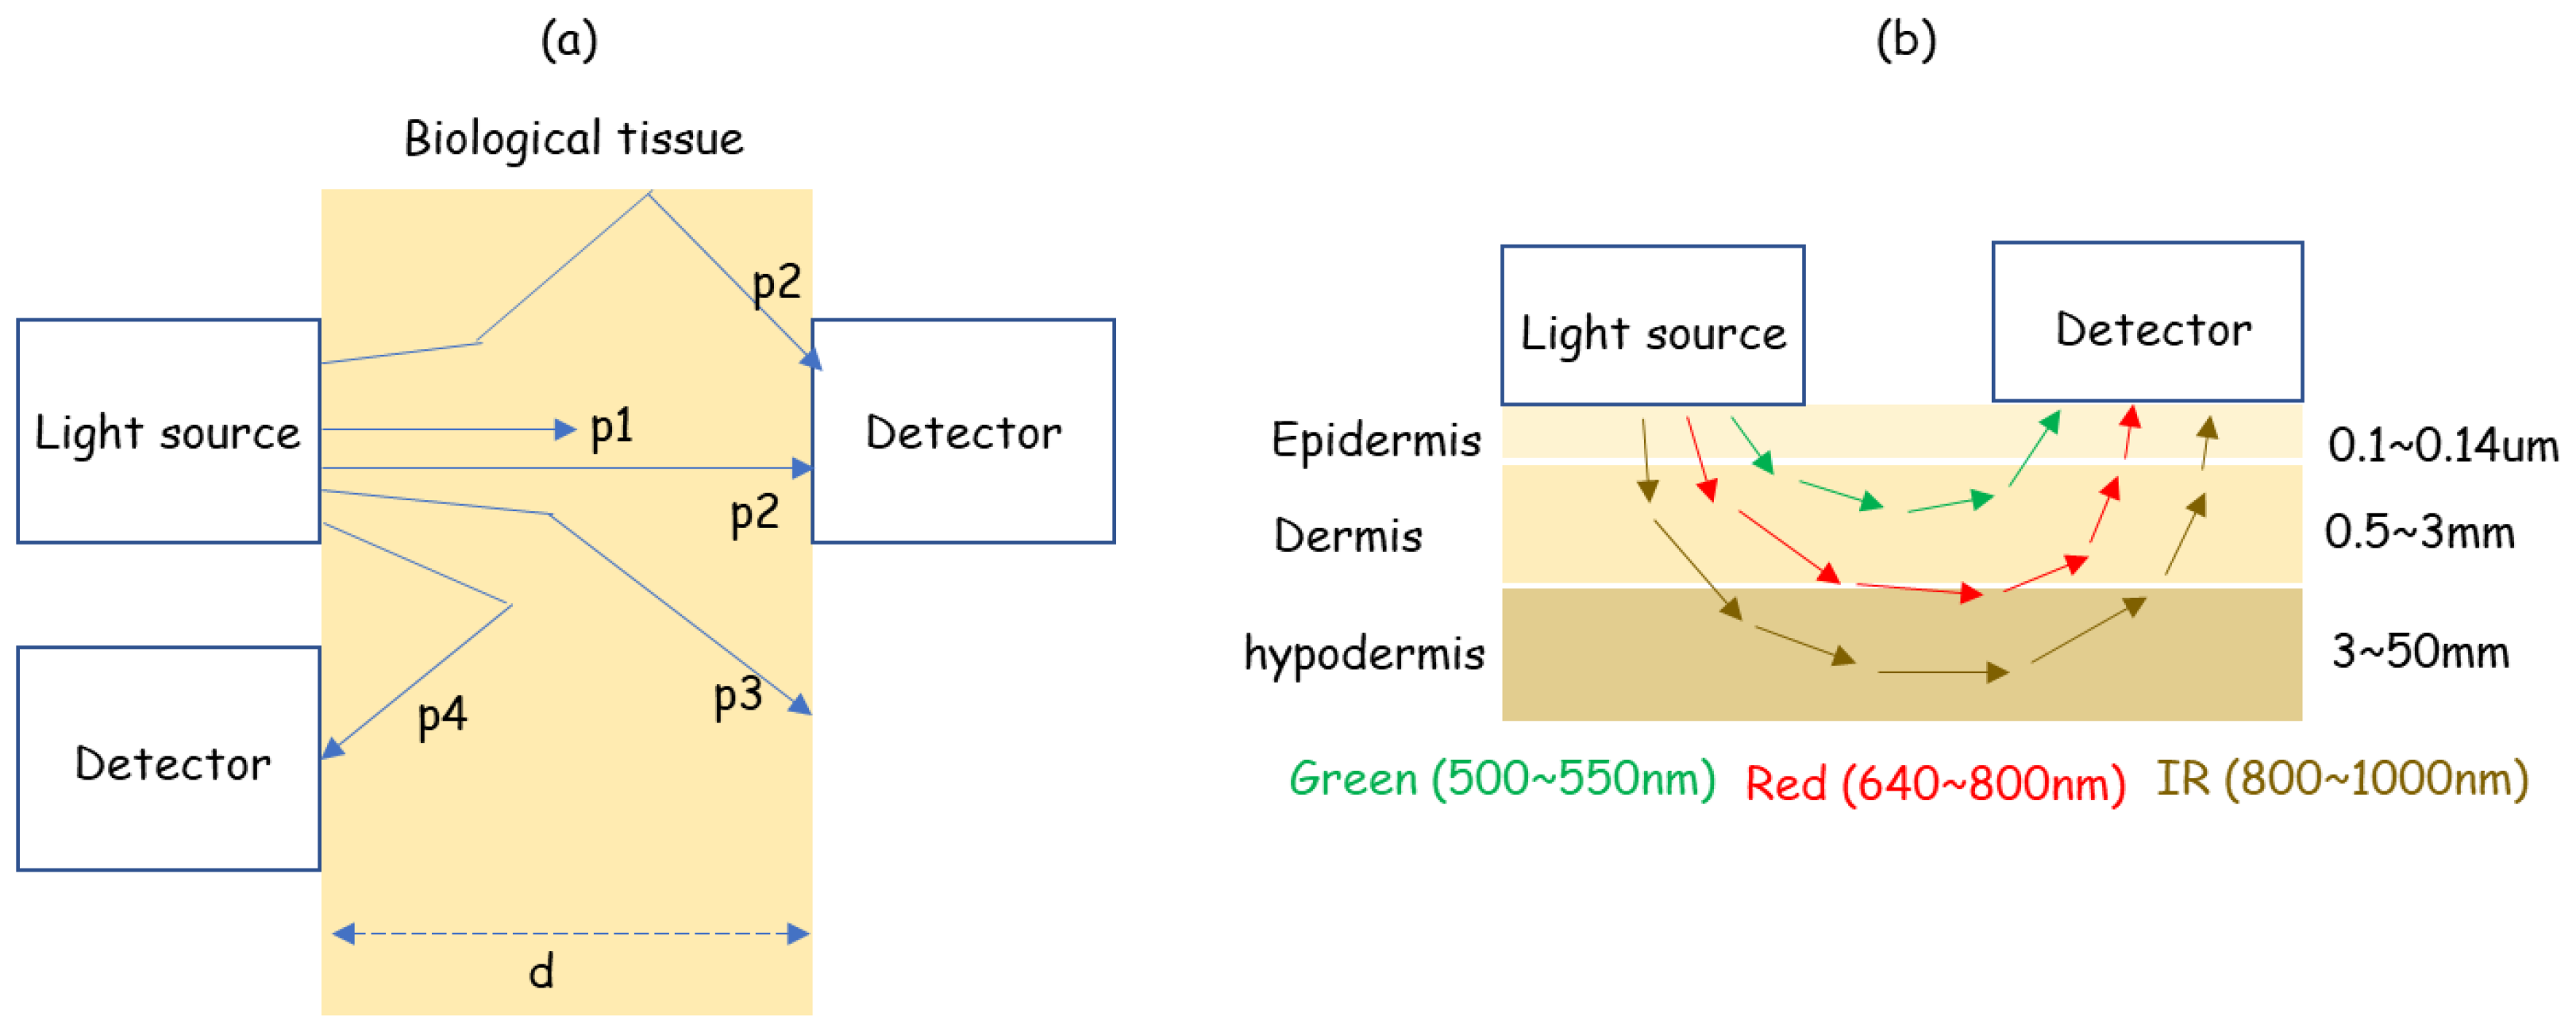
Figure 2.
Absorbed and reflected light in living tissue for PPG model. The amount of absorbed light correlates with the pulsation of arterial blood. In the systolic phase, the diameter of the arterial vessels is maximal and therefore the absorbance due to arterial hemoglobin is also maximal and the amount of detected light is low, which is displayed as a peak.

Figure 3.
Conceptual diagram of a PPG sensor module with an embedded LED–PD pair. The diagram illustrates two scenarios: (a) when the integrated sensor module is in direct contact with the wrist and (b) when the sensor module is embedded in a device and covered with a glass surface. In the diagram, the red solid line represents incident light from the LED entering skin tissue, while the green solid line indicates light causing various reactions inside the tissue. The blue solid line represents light entering the PD from skin tissue and being detected. Additionally, the red dotted line in the diagram illustrates light reflected inside the sensor module that does not enter the skin, some of which directly enters the light-receiving unit. The blue dotted line represents the light that is reflected back by the cover glass among the light entering towards the PD.

Figure 4.
Representative examples of PPG sensor systems applied to commercial wrist-worn wearable devices: (a) the Samsung Galaxy Gear Fit, released in 2014, utilizes a sensor module with an embedded LED–PD optopair, and (b) the Samsung Galaxy Watch 3, released in 2020, uses separate LEDs and PDs as a sensor. An analog front end (AFE) is employed in both devices to measure the PD output as a PPG signal.

Figure 5.
Examples of PPG sensor configurations that use multiple LEDs and PDs, and their application to commercial smartwatches. (a–d) illustrate different PPG sensor structures, while (e) through (h) present examples of these structures in use: (e) structure (a) applied to the Samsung Galaxy Gear s3; (f) structure (d) applied to the Samsung Galaxy Watch; (g) shows the sensor structure of the Garmin Fenix 5 with three LEDs and one PD in the center, and (h) shows the sensor structure of the Apple Watch with two LEDs and two PDs.
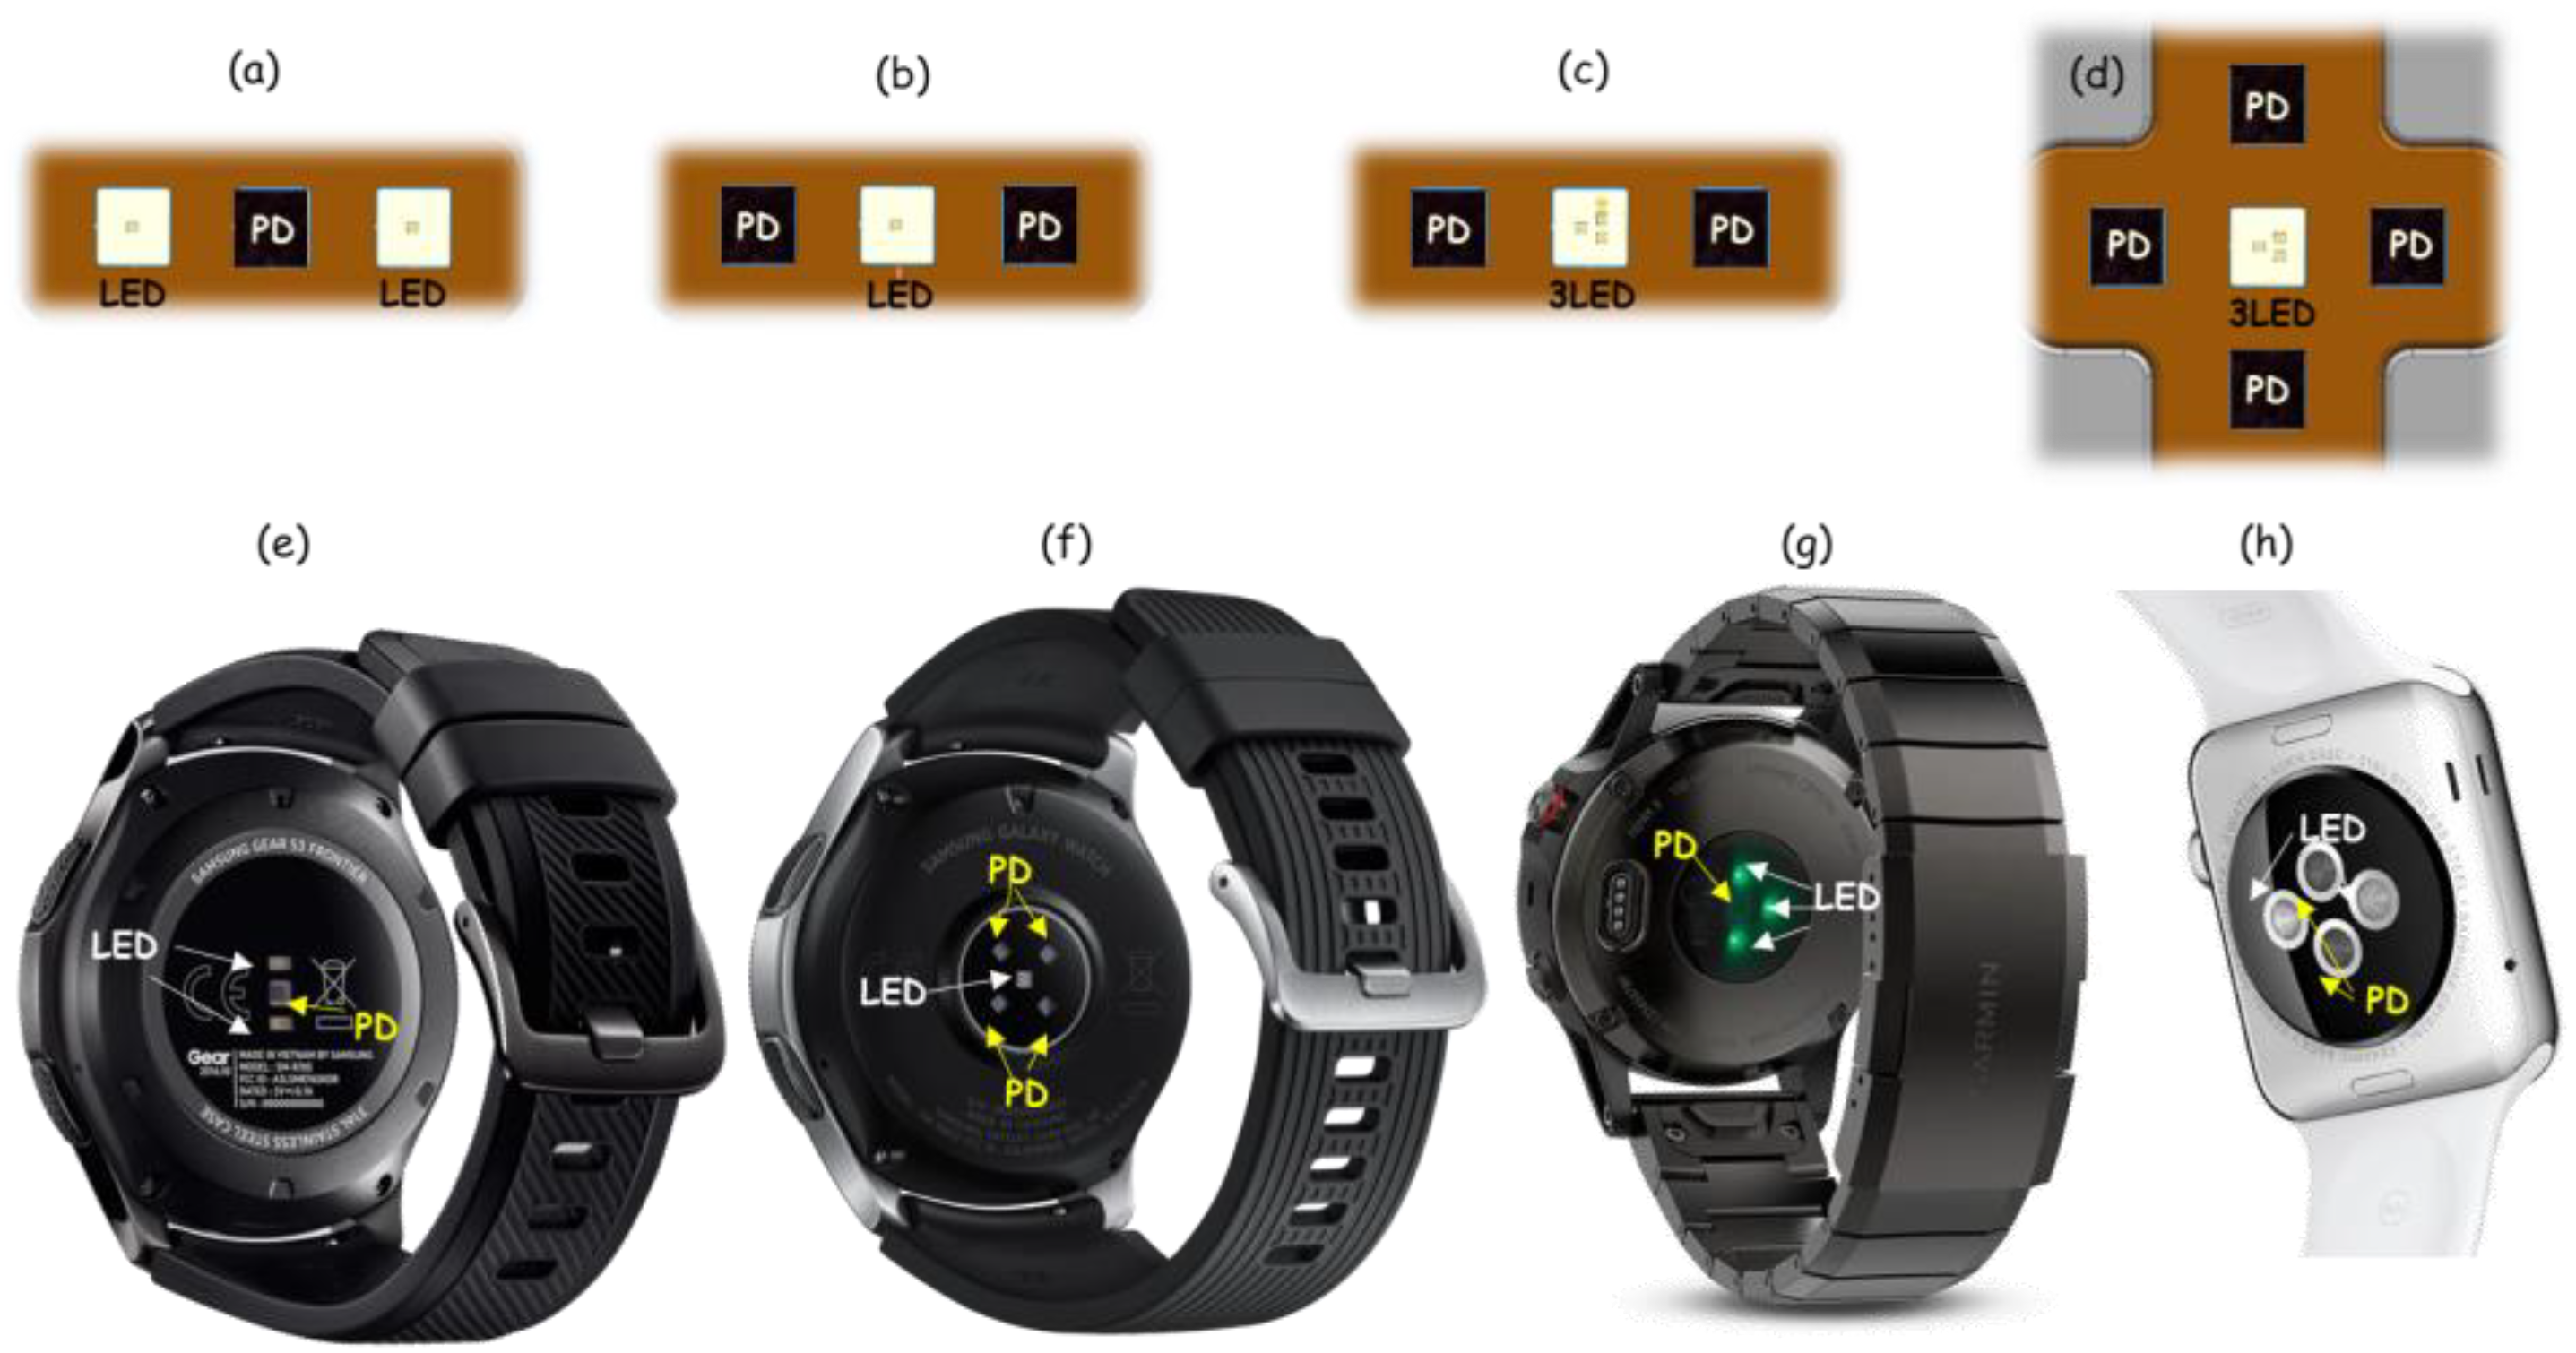
Figure 6.
Examples of the low sampling rate problem in pulse rate variability analysis using PPG signals. The gray background line represents the PPG signal at 250 Hz, while the circular marker line represents the PPG signal at a lower sampling rate. The dotted line shows the parabolic approximation, which was estimated using the three largest samples in each pulse of the low-sampling-rate signal. Specifically, the 250-Hz PPG signal was down-sampled to (a) 30 Hz, (c) 20 Hz, and (e)10 Hz, respectively. (b,d,f) are enlarged view of the second peak area of (a,c,e).


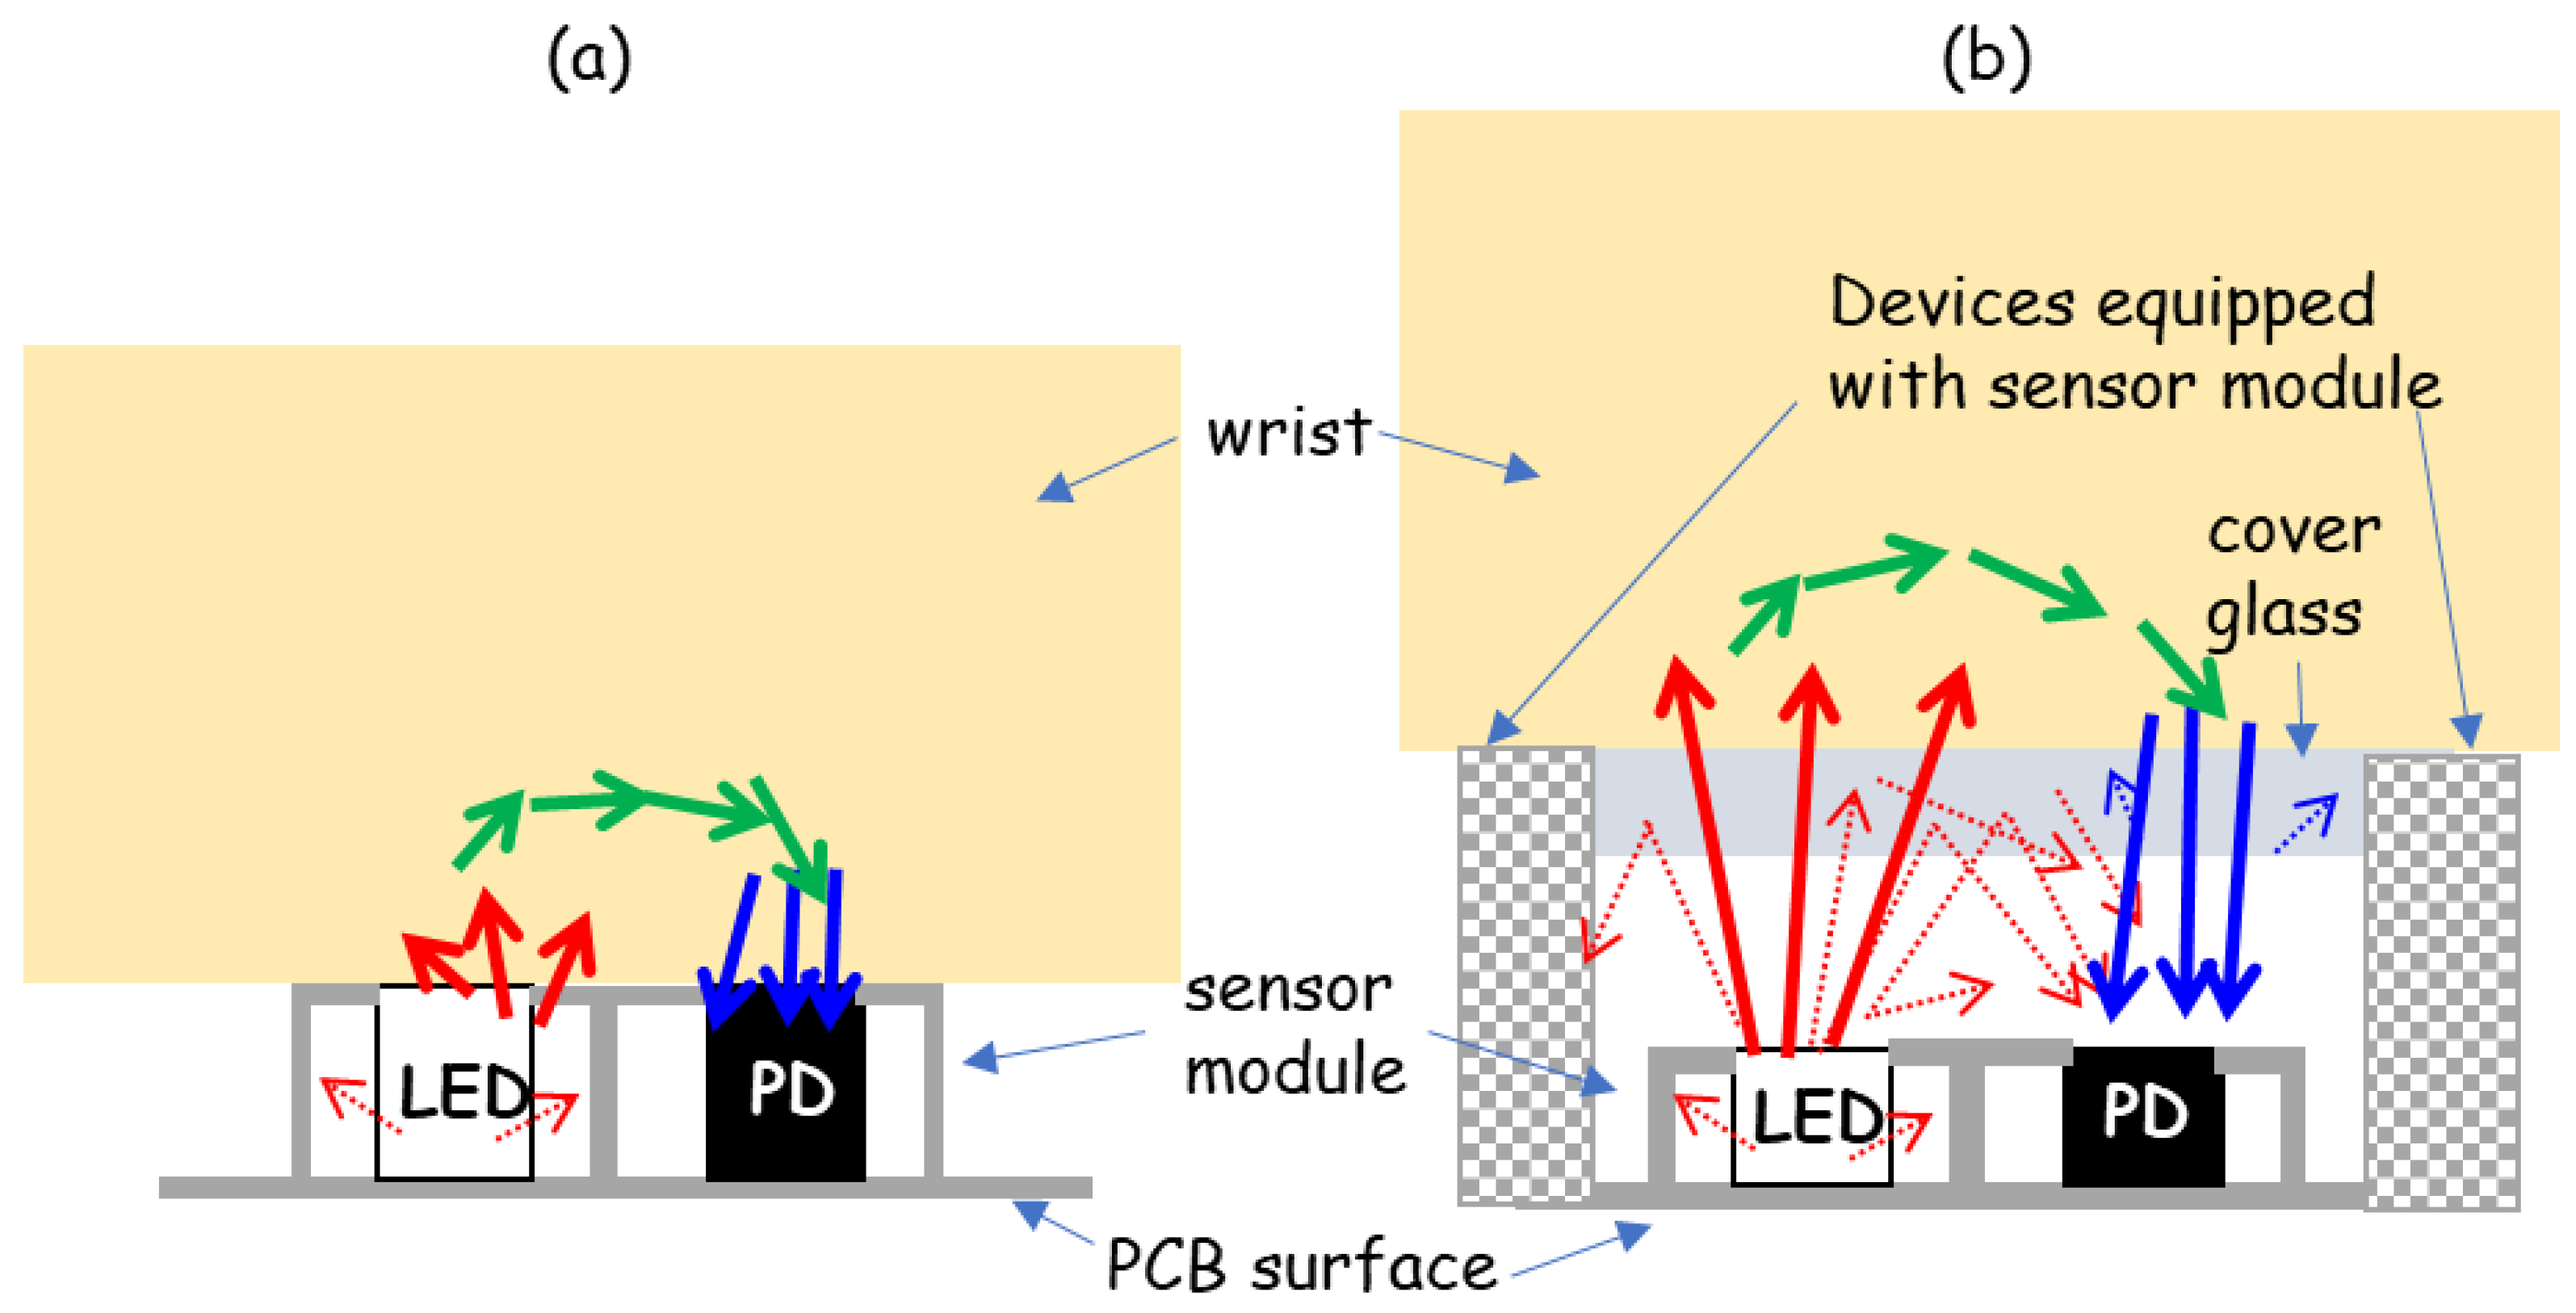
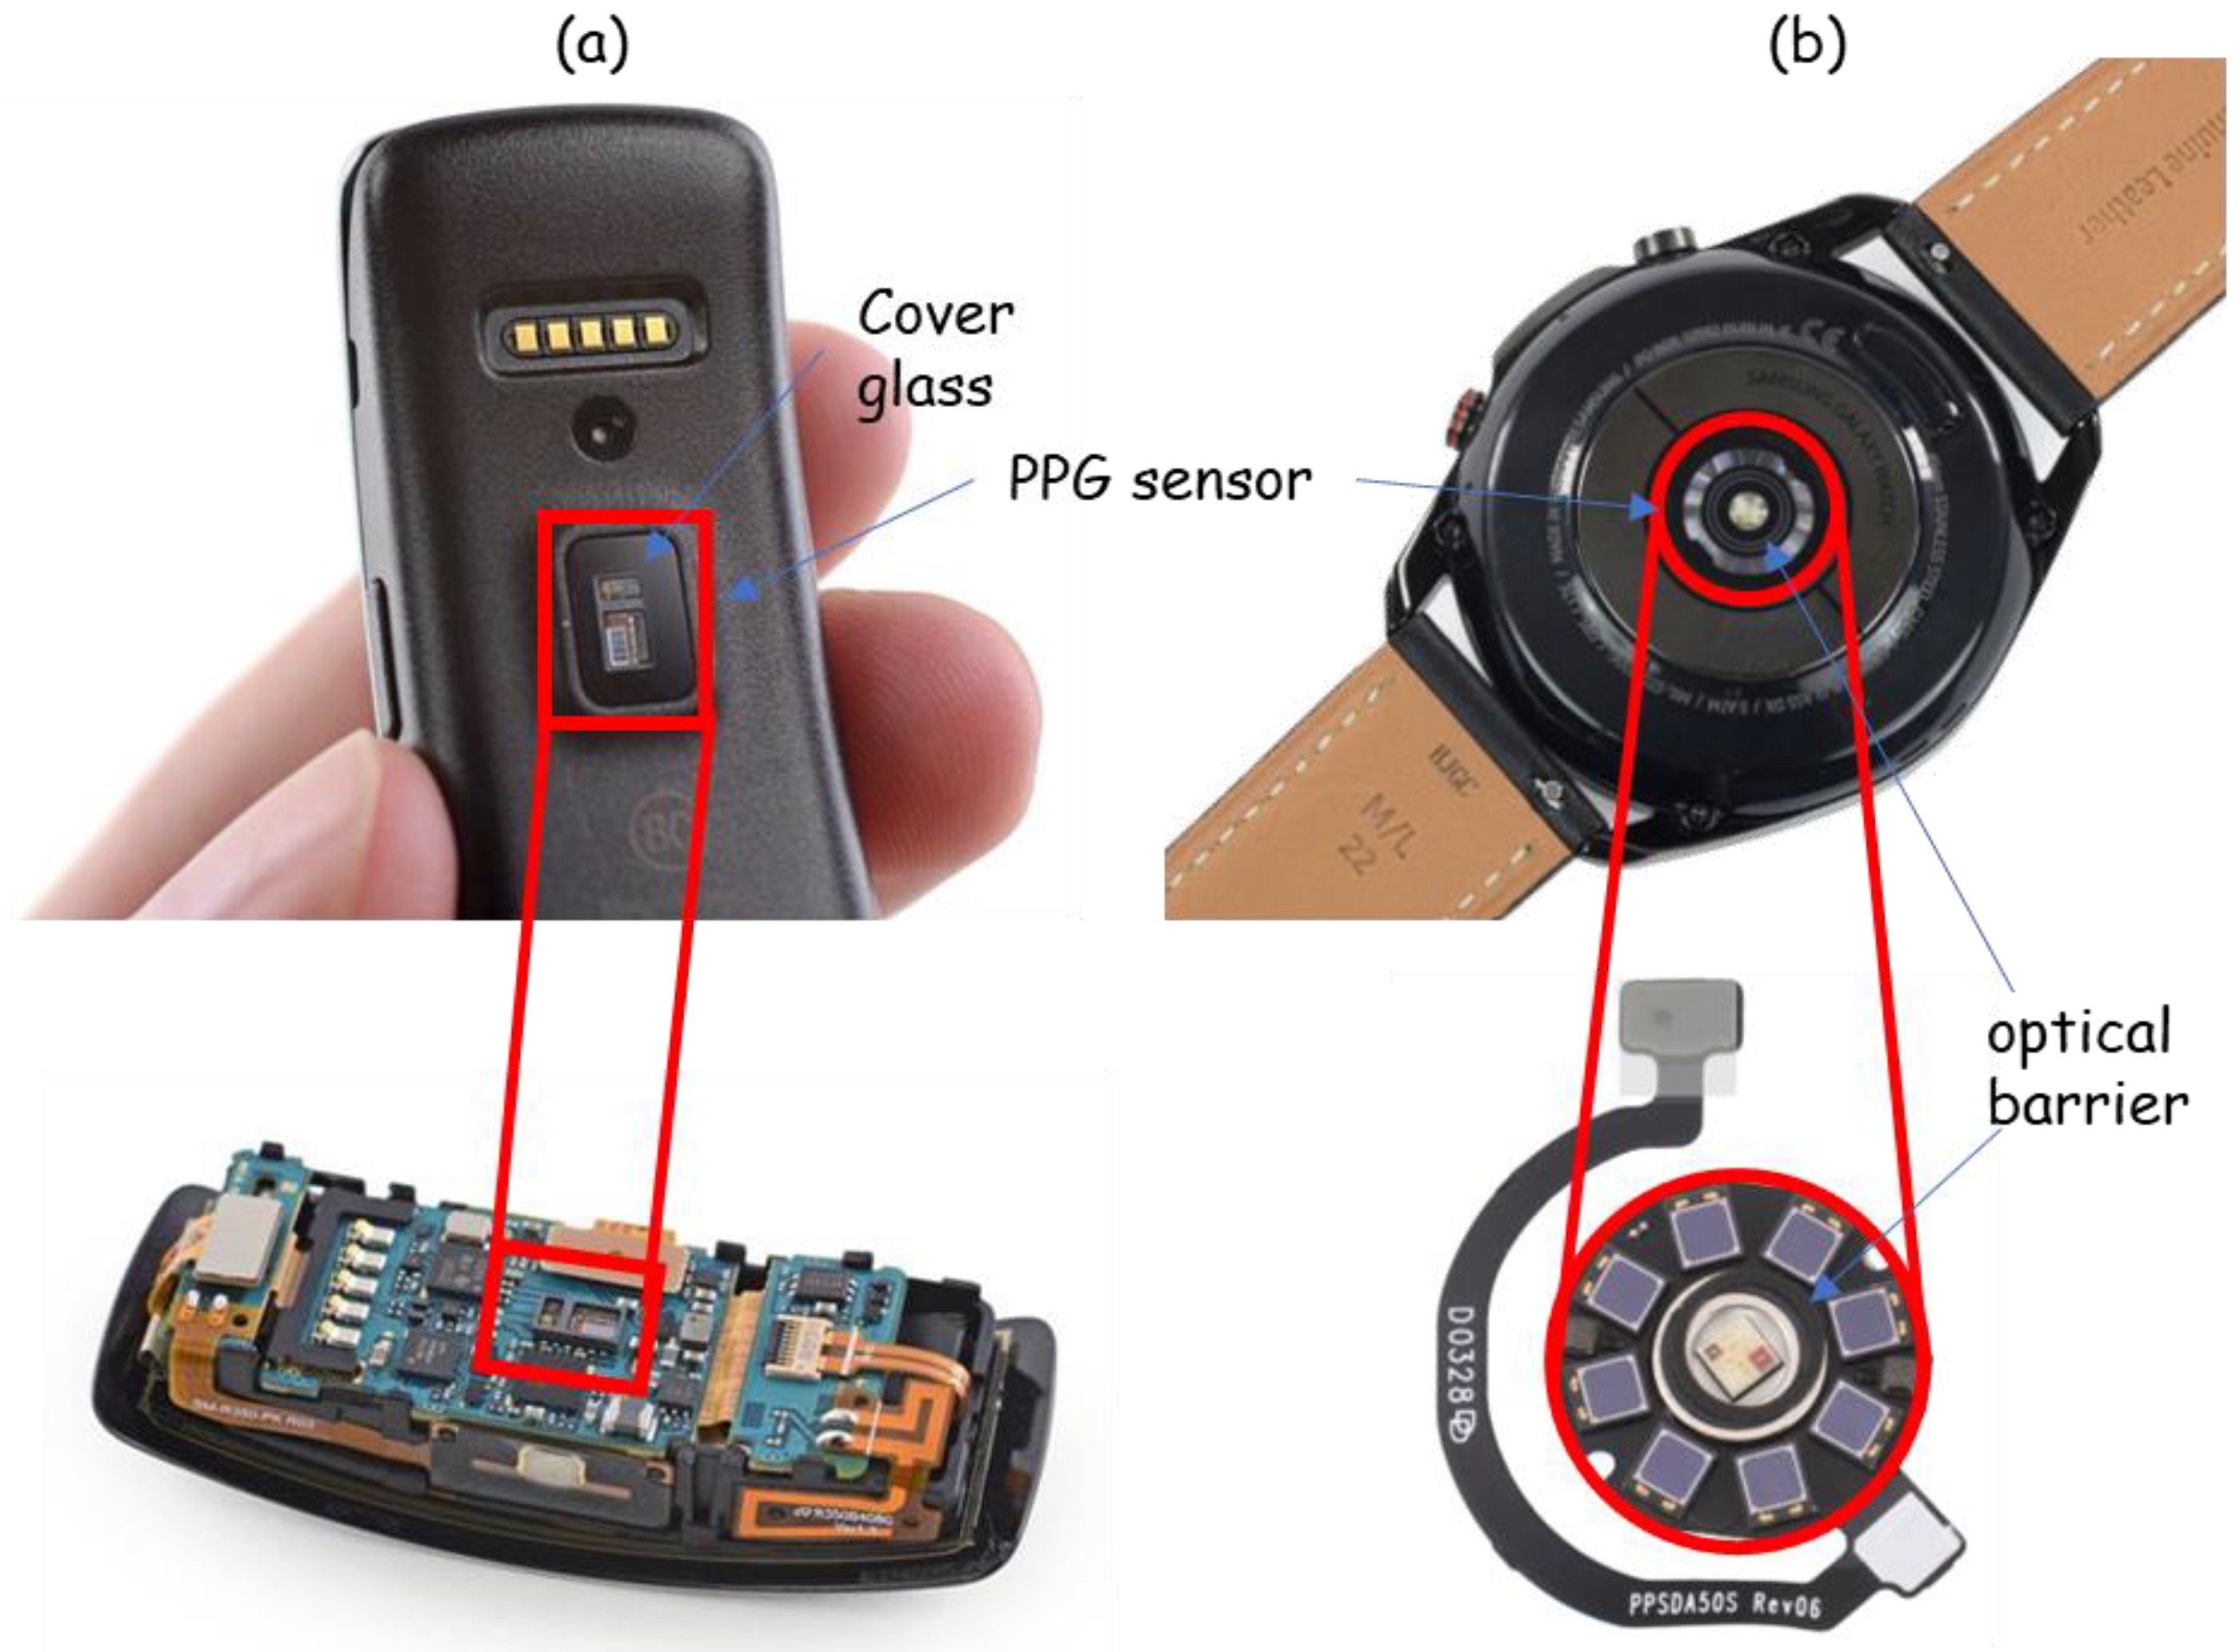
Table 1.
Analog front-end (AFE) modules for PPG measurement with a built-in sensor system composed of LED–PD pairs on the market.
Table 1.
Analog front-end (AFE) modules for PPG measurement with a built-in sensor system composed of LED–PD pairs on the market.
| AFE Module | Manufacturer | LED | PD | Size (mm) (L × W × H) | AFE | Unit Price (1) |
|---|---|---|---|---|---|---|
| MAX30101 [24] | Maxim Integrated | 1 Green, 1 Red, 1 IR | 1 PD | 5.6 × 3.3 × 1.55 | Pulse oximetry and heart rate monitor module | USD 11.21 |
| MAX86150 [25] | 1 Red, 1 IR | 1 PD | 5.6 × 3.3 × 1.3 | ECG, pulse oximetry, heart rate monitor module | USD 7.47 | |
| MAX86916 [26] | 1 Blue, 1 Green, 1 Red, 1 IR | 1 PD | 7.0 × 3.5 × 1.5 | Optical sensor module for PPG, proximity and color | USD 8.95 (2) | |
| ADPD144RI [27] | Analog Devices | 1 Red, 1 IR | 4 PD | 5.0 × 2.8 × 1.35 | Pulse oximetry and heart rate monitor module | USD 11.88 |
| ADPD188GG [28] | 2 Green | 2 PD | 5.0 × 3.8 × 0.9 | Heart rate monitor module | USD 11.8 | |
| SFH 7051 [29] | OSRAM | 3 Green | 1 PD | 4.7 × 2.5 × 0.9 | Heart rate monitor module | N.A (3) |
| SFH 7072 [30] | 2 Green, 1 Red, 1 IR | 2 PD | 7.5 × 3.9 × 0.9 | Pulse oximetry and heart rate monitor module | USD 3.47 | |
| SFH 7050 [31] | 1 Green, 1 Red, 1 IR | 1PD | 4.7 × 2.5 × 0.9 | Pulse oximetry and heart rate monitor module | N.A (3) | |
| AS7024 [32] | ams AG | 2 Green, 1 IR | 4 PD | 2.7 × 6.1 × N.A (4) | PPG and ECG | N.A (3) |
| AS7026GG [33] | 2 Green 1 IR | 4 PD | 2.75 × 6.2 × N.A (4) | PPG and ECG | USD 3.11 |
(1) The unit prices mentioned were obtained from digikey.com on 14 June 2023. Please note that prices may vary over time and are subject to change. (2) The price stated is for each individual piece when a quantity of 2500 pieces is ordered. (3) The product has been discontinued, and the price is no longer available. (4) The height information is not provided in the data sheet; only the length and width dimensions are specified.
Table 2.
Summary of recent PPG signal applications for mobile healthcare.
| Ref. | Application | Subjects | Data | Input | Algorithm | Results |
|---|---|---|---|---|---|---|
| [53] | Stress | 74 participants (72 M, 2 F) | PPG signal collected using pulse sensor amped on the index finger of the left-hand under mental arithmetic tasks and Stroop experimental design. | Selected features among time-domain, frequency-domain, nonlinear and point transition measure (PTM) parameters of PRV extracted from PPG. | Support vector machine (SVM) model | (5 levels of stress) Accuracy: 94.33% Sensitivity: 86.01% Specificity: 96.46% |
| [54] | Sleep (Drowsiness) | (At home) 17 participants (7 M, 10 F) Mean age: 44.3 (For driving simulator) 9 participants | (At home) EEG, EOG, EMG, ECG, respiration and PPG signals recorded continuously for 12 h, including nighttime sleep, using polysomnographic device. (For driving simulator) Polysomnographic device during pre-defined driving mission. | LF/HF ratio extracted PPG signal acquired with sampling rate of 50 Hz for the duration of one 2048 sample window. | Rule-based heuristic algorithm | (Drowsiness prediction) 6 m 39 s prior to the actual onset of sleep for at-home data, and 9 m 9 s prior to the actual onset of sleep for driving simulator data. |
| [55] | Sleep (Sleep Stage) | 292 participants (244 adults and 48 children) Mean age: 42.3 ± 19.7 | PPG and accelerometry signal measured from non-dominant wrist during sleep (SOMNIA dataset). Reference sleep measurement: clinical polysomnography. | PPG-derived PRV features combined with a measure of gross body movement for each 30-s epoch based on accelerometer signal. | Long short-term memory (LSTM) recurrent neural network | (4 stages of sleep) Accuracy: 76.4 ± 7.3 Kappa: 0.62 ± 0.12 |
| [58] | Blood Pressure | 33 participants (21 M, 12 F) Mean age: 41.1 ± 16.8 |
PPG signal collected using wrist-wearable device of their own design under the protocol in IEEE Standard for Wearable Cuffless BP. Reference blood pressure measurements: cuff electronic sphygmomanometer. | Feature sets derived by feature fusion with time-domain, morphological, statistical, and demographic features (gender, age, height, weight, and body mass index (BMI)). | A two-layer feed-forward artificial neural network | (SBP/DBP) ME = −0.07/0.00 mmHg MAE = 3.23/2.73 mmHg SDE = 4.47/3.61 mmHg |
| [63] | Blood Glucose Level |
217 participants (90 M, 127 F) Mean age: 49 ± 11 |
PPG signal collected using Empatica E4 wristband. Features extracted from 5-s segments. Reference blood glucose level measurements: laboratory test. | MFCC features of wristband PPG signal and physiological parameters (age, weight, and height) (total of 5 features) | Extreme gradient boost regression (XGBR) | R2 = 0.995 MAE = 1.76 mg/dL SEP = 5.53 mg/dL Accuracy = 98.24% |
| [65] | Activity | 12 participants (6 M, 6 F) | PPG signal collected using Huawei Watch 2 under 5 activities (standing, walking, jogging, jumping, sitting). Each activity lasted around 90 s. with around 1-min gap between two consecutive activities. | Cardiac, respiratory, and motion artifact signals extracted from PPG signal using bandpass filter. | Combination of convolutional and recurrent neural networks | (5 types of activity) F1 score = 0.78 |
Disclaimer/Publisher’s Note: The statements, opinions and data contained in all publications are solely those of the individual author(s) and contributor(s) and not of MDPI and/or the editor(s). MDPI and/or the editor(s) disclaim responsibility for any injury to people or property resulting from any ideas, methods, instructions or products referred to in the content. |
© 2023 by the authors. Licensee MDPI, Basel, Switzerland. This article is an open access article distributed under the terms and conditions of the Creative Commons Attribution (CC BY) license (https://creativecommons.org/licenses/by/4.0/).
Share and Cite
MDPI and ACS Style
Kim, K.B.; Baek, H.J. Photoplethysmography in Wearable Devices: A Comprehensive Review of Technological Advances, Current Challenges, and Future Directions. Electronics 2023, 12, 2923. https://doi.org/10.3390/electronics12132923
AMA Style
Kim KB, Baek HJ. Photoplethysmography in Wearable Devices: A Comprehensive Review of Technological Advances, Current Challenges, and Future Directions. Electronics. 2023; 12(13):2923. https://doi.org/10.3390/electronics12132923
Chicago/Turabian StyleKim, Kwang Bok, and Hyun Jae Baek. 2023. "Photoplethysmography in Wearable Devices: A Comprehensive Review of Technological Advances, Current Challenges, and Future Directions" Electronics 12, no. 13: 2923. https://doi.org/10.3390/electronics12132923
Note that from the first issue of 2016, this journal uses article numbers instead of page numbers. See further details here.