
Improvement of DBSCAN Algorithm Based on K-Dist Graph for Adaptive Determining Parameters
1
School of Software, Dalian Jiaotong University, Dalian 116028, China
2
College of Electronic Information and Automation, Civil Aviation University of China, Tianjin 300300, China
3
State Key Laboratory of Traction Power, Southwest Jiaotong University, Chengdu 610031, China
4
School of Computer Science, China West Normal University, Nanchong 637002, China
*
Author to whom correspondence should be addressed.
Electronics 2023, 12(15), 3213; https://doi.org/10.3390/electronics12153213
Submission received: 2 June 2023
/
Revised: 17 July 2023
/
Accepted: 20 July 2023
/
Published: 25 July 2023
(This article belongs to the Special Issue Artificial Intelligence Based on Data Mining)
Abstract
:For the shortcomings of an unstable clustering effect and low accuracy caused by the manual setting of the two parameters Eps and MinPts of the DBSCAN (density-based spatial clustering of applications with noise) algorithm, this paper proposes an adaptive determination method for DBSCAN algorithm parameters based on the K-dist graph, noted as X-DBSCAN. The algorithm uses the least squares polynomial curve fitting method to fit the curve in the K-dist graph to generate a list of candidate Eps parameters and uses the mathematical expectation method and noise reduction threshold to generate the corresponding MinPts parameter list. According to the clustering results of each group of parameters in the Eps and MinPts parameter lists, a stable range of cluster number changes is found, and the MinPts and Eps corresponding to the maximum K value in the stable range are selected as the optimal algorithm parameters. The optimality of this parameter was verified using silhouette coefficients. A variety of experiments were designed from multiple angles on the artificial dataset and the UCI real dataset. The experimental results show that the clustering accuracy of X-DBSCAN was 21.83% and 15.52% higher than that of DBSCAN on the artificial and real datasets, respectively. The X-DBSCAN algorithm was also superior to other algorithms through comprehensive evaluation and analysis of various clustering indicators. In addition, experiments on four synthetic Gaussian datasets of different dimensions showed that the average clustering indices of the proposed algorithm were above 0.999. The X-DBSCAN algorithm can select parameters adaptively in combination with the characteristics of the dataset; the clustering effect is better, and clustering process automation is realized.
1. Introduction
With the massive application of computers and the rapid growth of data volume, data mining [1] is playing an increasingly important role. Data mining is the process of extracting hidden, unknown, and potentially valuable information from the vast amounts of data in a database. Cluster analysis [2] is an important task in data mining. Cluster analysis is abbreviated as clustering, which is a process of dividing data objects (or observations) into subsets. Clustering algorithms can be divided into five categories: partition-based methods, hierarchical-based methods, density-based methods, grid-based methods, and model-based methods [3]. Division and hierarchical methods aim to discover spherical clusters, and arbitrary shape clusters are hard to find. Density-based clustering methods can be used to discover non-spherical clusters. Typical density-based methods include DPC (density peaks clustering) [4], OPTICS (ordering points to identify the clustering structure) [5], and DBSCAN (Density-based spatial clustering of applications with noise) [6]. Rodriguez et al. (2014) proposed clustering by fast search and discovery of density peaks, referred to as the DPC algorithm. DPC is a newly proposed clustering algorithm based on density and distance that can automatically find cluster centers and realize efficient clustering of arbitrary shape data. Because of its simple principle, no need for iteration, and ability to process arbitrary shape datasets, it is widely used in the field of data mining. The OPTICS algorithm does not explicitly produce a cluster, but instead computes an enhanced clustering order for automated interactive cluster analysis. The OPTICS algorithm is suggested to assist the DBSCAN algorithm in selecting the proper parameters and lessening the sensitivity of the DBSCAN algorithm’s input parameters.
The DBSCAN algorithm performs clustering by growing regions of sufficiently high density; from noisy spatial databases, it can find clusters of any shape. The advantage of DBSCAN in clustering datasets of arbitrary shapes has attracted a large number of scholars to conduct research on it. The DBSCAN algorithm needs to input two parameters, Eps and MinPts. If these two parameters are manually set incorrectly, the clustering quality of the algorithm will be reduced. Many scholars have researched and improved the parameter selection of the DBSCAN algorithm, improved the performance of the algorithm, and achieved good research results [7,8,9,10,11]. Liu et al. proposed a variable density clustering algorithm (VDBSCAN) [12], which selects parameter values under different densities through the K-dist graph, and which can reasonably cluster different clusters. Li et al. proposed an algorithm for adaptively determining the parameters of the DBSCAN algorithm (KANN-DBSCAN) [13]; the algorithm determines the algorithm parameters on the basis of the parameter optimization strategy to achieve a high-precision clustering process. In order to improve the clustering accuracy of the KANN-DBSCAN algorithm, Wan et al. proposed a multi-density adaptive algorithm for determining the parameters of the DBSCAN algorithm (MDA-DBSCAN) [14]; the algorithm adds attenuation coefficients in the process of calculating the parameter list to reduce the noise generated in the clustering process. Zhou et al. proposed the density clustering algorithm with parameter adaptation and fast region query (AF-DBSCAN) [15], which performs polynomial fitting on the K-dist curve and calculates the optimal Eps and MinPts parameters through the inflection point of the curve. However, the fixed selection of K-dist curve with K = 4 in this algorithm limits the selection of algorithm parameters, and the parameters adaptively selected by the AF-DBSCAN algorithm do not change with the change of distribution characteristics of different datasets. Wang et al. proposed an adaptive multi-density DBSCAN algorithm (AMD-DBSCAN) [16], which uses the variance of the domain number (VNN) to measure the density difference between each cluster. The algorithm only needs one hyperparameter, can avoid complex repeated operations, and has better clustering performance on multi-density datasets. Pakdehi et al. proposed a DBSCAN-based hierarchical clustering (DBHC) method to determine the MinPts and Eps parameters of the DBSCAN algorithm, which has a good clustering effect on real datasets [17].
With the improvement of data processing requirements, the classic DBSCAN algorithm can no longer meet the needs of data mining. In order to solve specific problems, different algorithms can be combined with DBSCAN algorithm, and the structure of DBSCAN algorithm can be improved. Research on DBSCAN combination algorithms has been conducted, and great progress in parameter adaptive selection, data partitioning, multi-density data clustering, and multi-objective optimization has been made [18,19,20,21,22]. Targeted improvements to the structure of the DBSCAN algorithm have been made, which improved the operating efficiency of the algorithm and the clustering effect under multi-density data [23,24,25,26]. With the development of data mining and artificial intelligence, the improvement of DBSCAN has been extended to many algorithms [27,28,29,30,31,32] and application domains [33,34,35,36,37,38,39]. The improved DBSCAN algorithm has also been applied in many fields with good application performance [40,41,42,43,44]: quantum computing [45,46,47,48,49,50], data field [51,52,53,54,55], maritime industry [56,57,58,59], traffic trajectory [51,60,61,62], urban architecture [63,64], geology [65], and others [66,67].
In summary, the manual selection of MinPts and Eps parameters has a serious impact on the clustering results of the DBSCAN algorithm. In order to overcome the defect of poor clustering effects caused by manual selection of parameters in the DBSCAN algorithm, the adaptive selection of DBSCAN parameters has been studied [12,13,14,15,16,17]. However, some methods do not take into account the characteristics of the dataset, the stability of the algorithm is not good, and the clustering quality is not high. There are relatively few studies on the adaptive selection of DBSCAN algorithm parameters based on the K-dist curve, and most of the related research used a fixed K-dist curve for analysis (i.e., a fixed K-dist parameter K), such as in [15]. On some datasets, the parameters selected adaptively by this method cannot adapt to the distribution characteristics of the dataset itself, resulting in an unsatisfactory clustering effect. Aiming at the above deficiencies, this paper proposes a K-dist graph-based X-DBSCAN algorithm that adaptively selects the parameters of the DBSCAN algorithm. The algorithm adopts the idea of parameter optimization to determine the optimal K value and generate the corresponding K-dist graph. According to the K-dist curve adaptive generation algorithm parameters, the noise generated in the clustering process is reduced by adding a noise reduction threshold.
The main contributions of this paper are as follows:
1. On the basis of the distance matrix, the K-dist curve corresponding to different K values is taken to generate a K-dist graph, and the rough point of the initial K-dist curve is removed using the least squares polynomial curve fitting method. The maximum curvature method to select the inflection point of the fitted curve as the parameter value corresponding to this K-dist curve is used, and the above operation is repeated to generate the Eps parameter list Epslist. For each obtained Eps parameter, the MinPts undetermined parameter using the mathematical expectation method is generated, and a noise reduction threshold to this undetermined parameter to generate the MinPtsK parameter is added. The above operation is repeated to generate the MinPts parameter list MinPtslist.
2. The Eps and MinPts parameters are inputted one by one into the DBSCAN algorithm in turn to perform cluster analysis on the dataset. The optimal K value under a stable interval of the cluster number of the clustering results is found, and the optimal Eps and MinPts parameters are determined accordingly. The parameter optimization strategy is used to verify the validity and rationality of the optimal parameters through the value of the silhouette coefficient.
3. The X-DBSCAN algorithm is compared with other algorithms on the artificial two-dimensional dataset and the UCI real dataset, and the clustering results are analyzed with different clustering effect evaluation indices to determine the superiority of the X-DBSCAN algorithm. The X-DBSCAN algorithm is applied to the high-dimensional dataset synthesized by a Gaussian distribution to verify the clustering effect and algorithm stability of the X-DBSCAN algorithm in the case of high-dimensional data.
The structure of this paper is as follows: Section 2 introduces a brief overview of the classic DBSCAN algorithm, including relevant definitions and algorithm steps. Section 3 introduces the algorithm steps of the proposed X-DBSCAN algorithm, algorithm pseudocode, and algorithm complexity. Section 4 presents the experimental results and experimental analysis of the X-DBSCAN algorithm, testing the performance of X-DBSCAN using artificial 2D datasets and UCI real datasets. The experimental results are analyzed and discussed in terms of accuracy, clustering effect, and running time. The clustering ability of X-DBSCAN algorithm in the face of high-dimensional data and large-scale data is verified by four synthetic datasets of different dimensions. Lastly, Section 5 concludes the paper and suggests directions for future research work.
2. Preliminary Knowledge
A cluster is the largest collection of closely spaced points according to DBSCAN [6]. It can group areas of sufficient density into clusters and find clusters of any shape in cluttered spatial databases. DBSCAN uses two parameters: density threshold MinPts and neighborhood radius Eps; the relevant definitions and steps of the algorithm are given below.
2.1. Related Definition
1. (Eps neighborhood) For a given object dataset D, there exists p ∈ D, the neighborhood with the object p as the center, and the Eps neighborhood of the object p defined by the radius Eps given. , where dist(p,q) represents the distance between two data objects p and q in D; contains the data all objects in set D whose distance from the object is not greater than Eps.
2. (Density threshold MinPts) For a given object dataset D, there exists p ∈ D, and the density threshold MinPts is the density limit value that makes the object p a core point.
3. (Core object) For a given object dataset D, there exists p ∈ D, ∈ D, where i ∈ [1, n], and is in the Eps neighborhood of object p; if the number n of objects in is greater than the density threshold MinPts, then p is the core object.
4. (Density) For a given object dataset D, there exists p ∈ D, with the object p as the center and the number of objects in the neighborhood with the given radius Eps as the radius defined as the density of the object p.
5. (Direct density reachability) For a given object dataset D, there exists p ∈ D, q ∈ D, and q in the Eps neighborhood of p, i.e., q ∈ ; if p is the core object, then object q is said to be directly density reachable from object p.
6. (Density reachable) For a given object dataset D, there are ∈ D, = p, and = q; if the object is directly density reachable from the object , then object q is said to be density reachable from the object p, and the density reachability is asymmetric.
7. (Density interconnection) For a given object dataset D, there exists p ∈ D and q ∈ D; if there is o ∈ D, such that object p and object q are density reachable from object o, then object p and object q is densely interconnected.
8. (Cluster) Starting from any core point object, all objects that are densely reachable from this object form a cluster.
9. (Noise) For a given object dataset D, there is p ∈ D; if the object p does not belong to any cluster, then p is noise.
2.2. DBSCAN Algorithm Steps
DBSCAN searches the dataset for areas of high data density by looking at the Eps neighborhood of each object; if a data object’s Eps neighborhood has more objects than the MinPts density threshold, the data object serves as the core object of a new cluster that is formed. DBSCAN repeatedly finds objects for which these core objects are directly density reachable, and then marks these data objects as a class. When no new data objects can be added to any clusters, the data objects without categories are marked as noise points, and the clustering process ends.
The specific steps of the DBSCAN algorithm are as follows:
Step1: Specify the appropriate Eps and MinPts.
Step2: Select a point arbitrarily, and then find all points whose distance to this point is less than or equal to Eps. If the number of data points within Eps distance from the starting point is less than MinPts, then this point is marked as noise. If the number of data points within the Eps distance is greater than MinPts, this point is marked as a core point and assigned a new cluster label.
Step3: Visit all directly density-reachable objects (within Eps distance) of this core point. If they have not been assigned a cluster, they are assigned the new cluster label just created. If they are core points, then visit their directly density-reachable objects in turn, and so on. The cluster grows until there are no more core points within the Eps distance of the cluster.
Step4: Select another point that has not been visited, and then repeat the same process until all core points have been visited.
Step5: Output clustering results.
3. X-DBSCAN
The X-DBSCAN algorithm’s fundamental idea and the process for choosing the parameters are introduced in this section. At the same time, the algorithm steps and pseudocode of the X-DBSCAN algorithm are provided, and the X-DBSCAN algorithm’s time and spatial complexity is analyzed.
3.1. The Basic Idea of X-DBSCAN
The neighborhood radius Eps and the density threshold MinPts are the two parameters used by the DBSCAN algorithm. There are two issues with the classic DBSCAN algorithm’s method for determining these two parameters, as outlined below.
The Eps parameter selection method of the traditional DBSCAN algorithm is determined according to the K-dist curve sorted in descending order, and the curve change threshold point determined through the maximum curvature point is treated as the Eps parameter. However, the K value is generally set to 4, and the 4-dist curve is usually selected for analysis. In some datasets, due to the fixed K value, the generated parameters have certain errors. On a small dataset, the 4-dist curve characterizes the dataset, according to which appropriate Eps parameters can be selected. However, when working with large datasets, the parameter K of the K-th nearest neighbor distance curve is more important. If the selected K value is small, the selected Eps value is also small, which results in more noise points in relatively low-density clusters. These noise points are not used for the further expansion of the clusters, and eventually the clusters with lower densities are divided into multiple clusters with similar properties, which reduces the quality and accuracy of clustering. If the selected K value is very large, the opposite effect occurs, and the large neighborhood radius leads to different clusters being merged, which also affects the accuracy of the clustering results.
The MinPts selection method is MinPts ≥ dim + 1, where dim is the dimension of the data that need to be clustered. Since the DBSCAN algorithm is mainly aimed at two-dimensional data clustering, the MinPts value is generally fixed at 4, which reduces the consistency between the parameters and the dataset. It cannot have a corresponding change trend as the dataset’s characteristics change, resulting in errors in the quantity of clusters generated and the quantity of noises [68].
Aiming at the above two defects of DBSCAN, this paper proposes the X-DBSCAN algorithm. This algorithm’s fundamental idea is described below.
For the first problem, in order to select the appropriate Eps parameters more accurately, the K-dist curves corresponding to different K values in the K-dist graph are first traversed. Then, the least squares polynomial curve fitting method is used to fit each curve, along with the maximum curvature method to determine the inflection point of the fitted curve, applying the ordinate value of this point as the Eps parameter corresponding to the K-dist curve. After repeating the above operations for all curves, the Eps parameter list is generated.
For the second question, in order to select the appropriate density threshold MinPts parameter, the number of objects contained in the Eps neighborhood of each object is first calculated. Then, the average number of objects contained in the Eps neighborhood of all objects is obtained by the method of mathematical expectation, and this value is used as the undetermined MinPts parameter. In order to reduce the noise data generated due to excessive MinPts parameter values, the noise reduction threshold is added to the undetermined MinPts parameter values to obtain optimized MinPts parameters, and the corresponding MinPts parameter list is generated.
In order to determine the optimal algorithm parameters, the parameter values in the Eps and MinPts parameter lists are sequentially input into the DBSCAN algorithm for clustering. According to the clustering results, the relationship curve between the number of clusters and the K value is generated, and the stable interval of the number of clusters is found in the curve. The maximum K value under this stable interval is the optimal K value, and the Eps and MinPts parameters corresponding to the optimal K value are the optimal algorithm parameters.
3.2. Selection of X-DBSCAN Parameters
The selection of X-DBSCAN algorithm parameters includes four steps: adaptively generating the Eps parameter list, adaptively generating the MinPts parameter list, adaptively determining the optimal K value and parameters, and verifying the optimal parameters. The steps of parameter selection of the X-DBSCAN algorithm are described in detail below through specific examples.
In order to better describe the selection of parameters, the dataset in Figure 1 is taken as an example for specific analysis. The dataset in Figure 1 is a two-dimensional dataset that is artificially synthesized and contains 500 data objects in five categories. Figure 1 shows the original distribution of the dataset in two-dimensional space.
3.2.1. Adaptively Generate Eps Parameter List
The K-nearest neighbor algorithm [69] and the K-dist curve are utilized by the X-DBSCAN algorithm to generate the Eps parameter list. The steps to create the Eps parameter list are as follows.
Step 1: Determine the object’s distance from other objects in the dataset D using the Euclidean distance formula, and generate the distance distribution matrix [70]. The distance distribution matrix is shown in Equation (1).
where is the distance matrix, the distance between object i and object j in the dataset is called , and n is the number of objects in the datasets D.
Step 2: Sort the elements in the distance matrix in ascending row order. After sorting, the distance matrix’s first column’s elements are all zero, which is the distance from each object to itself.
Step 3: Sort the elements in the K-th (1 ≤ K ≤ n) column of the sorted matrix in ascending order as the ordinate of each point on the K-dist curve. The amount of data X (1 ≤ X ≤ n) is used as the abscissa of each point on the K-dist curve. The meaning of each point on the K-dist curve is that the abscissa is the number of the point in the dataset, and the ordinate is the distance between the point and the nearest K-th point. According to this, a K-dist curve is generated. When the parameter K takes different values, different K-dist curves are generated, and all K-dist curves form a K-dist graph.
Step 4: Use the least squares method [71] to perform curve fitting for each K-dist curve in the K-dist graph. The calculation process of the least square method is shown in Equation (2).
Find the function that best matches the original data distribution by minimizing the sum of squares of errors [72] (in order to fit the K-dist curve more accurately, the fitting order of the algorithm in this paper is set to 15); the least squares polynomial curve fitting is expressed as follows:
where n is the order of the polynomial, and is the coefficient of each term of the polynomial.
Step 5: Calculate the point with the largest curvature in the sudden change region after the fitted K-dist smooth curve rises steadily, which is also the inflection point where the smooth curve rises sharply. The curvature is calculated using Equation (4).
where K is the curvature of the fitted curve, is the second derivative of the fitted curve, and is the fitted curve’s first derivative.
The distance value (ordinate) corresponding to the inflection point is used as the Eps parameter . After the calculation of all K-dist curves is completed, the Eps parameter list is generated, as shown in Equation (5).
Figure 2 shows all the K-dist (1 ≤ K ≤ n) curves generated by the dataset in Figure 1, and each curve corresponds to a different K value. It can be observed that, when the parameter K selects different values, the corresponding K-dist curves will be very different, which will lead to the selected the inflection point being different, i.e., the generated Eps parameters are also different; hence, it is necessary to select an appropriate K value for the determination of the Eps parameters.
The below example illustrates the process of adaptively selecting the Eps parameter and generating the Eps parameter list through the K-dist curve. The 81-dist curve in Figure 2 is shown in Figure 3. After analyzing the 81-dist curve, it can be observed from Figure 3a that the curve is relatively rough, and individual points fluctuate greatly, which will affect the selection of the inflection point to a certain extent. Therefore, curve fitting is required. Figure 3b shows the fitted 81-dist curve. It can be observed that, compared with the original 81-dist curve, rough points are removed from the curve, making the curve smoother.
Figure 4 is a comparison diagram of the initial 81-dist curve and the fitted 81-dist curve. The fitted curve not only removes the rough points, but also has the same shape as the initial curve. It can be observed that curve fitting can successfully preserve the initial curve’s shape characteristics and eliminate the rough points, in order to reduce the error brought on by the choice of the rough curve’s inflection point. The inflection point selected for the fitted 81-dist curve is shown in Figure 5; when K = 81, the corresponding Eps parameter value is the ordinate of the inflection point.
The above steps and processes are performed for all K-dist (1 ≤ K ≤ n) curves, and the Eps parameters obtained from each K-dist curve form an Eps parameter list . Figure 6 illustrates how the generated Eps parameter value and K value relate to one another. It can be observed that, as K increases, the value of the Eps parameter gradually rises. When the K value is around 100, the curve is obviously steep, and the Eps parameter value increases sharply. This means that the K-th nearest neighbor object of each data object in the dataset belongs to other categories; thus, it is judged that the optimal parameter K of the dataset is in the range of 1–100 (the relationship between the Eps parameter value and the K value of different datasets will be different; thus, the judgment of the range of the optimal parameter K is only for the dataset in Figure 1), and the specific optimal parameter K value needs to be further verified and determined in the subsequent steps.
3.2.2. Adaptively Generate MinPts Parameter List
The X-DBSCAN algorithm calculates the number of data objects contained in the Eps neighborhood radius and uses the noise reduction threshold to find the mathematical expectation to generate the MinPts parameter list. The formula is as follows:
where β is the noise reduction threshold value, 0 ≤ β ≤ 1 (the algorithm in this paper sets β as 0.8), the number of objects in the dataset D as a whole is n, and is the quantity of objects in the i-th object’s Eps neighborhood. After the calculation of each parameter is completed, the list of MinPts parameters is produced, as expressed in Equation (7).
The relationship between the parameter value of MinPts and the value of K is shown in Figure 7. It can be observed that, as the value of K increases, the parameter value of MinPts also increases gradually, showing a tortuous upward trend.
3.2.3. Adaptively Determine the Optimal Parameters
The parameters in the Eps and MinPts parameter lists are input one by one into the DBSCAN algorithm to cluster the dataset, and the relationship curve between the number of clusters and the K value is generated according to the clustering results. If K (1 ≤ K ≤ n) is set to different values, the corresponding number of clusters is obtained. When the number of clusters is the same for Y consecutive times (the algorithm in this paper takes Y as 5), the clustering result is considered to be stable. The number of clusters X under the stable clustering result is selected as the optimal number of clusters. The algorithm in this paper defines the interval with the number of clusters as X as the stable interval of the number of clusters, and then selects the maximum K value in this interval as the optimal K value.
If the number of clusters that are the same for Y consecutive times cannot be found in the clustering results, then the clusters that are the same for Y − 1 (Y − 1 ≥ 3) consecutive times are evaluated. If there is no case in which the number of clusters is the same for three consecutive times in the clustering results, the stable interval is defined as the fluctuation range of the number of clusters within 1 [14], and the maximum K value in this interval is selected as the optimal K value.
This article defines and corresponding to the optimal K value as the optimal Eps and MinPts parameter values.
The above steps and operations are performed on the dataset in Figure 1 to analyze and obtain the relationship between the number of clusters and the K value. As shown in Figure 8, it can be observed that, when K is equal to 3, the number of clusters enters the stable interval in the clustering result, and, when K is equal to 81, the stable interval ends; hence, K = 81 is the optimal K value. The optimal Eps parameter is determined by the inflection point chosen by the 81-dist curve corresponding to K = 81, and the Eps parameter is used to generate the best MinPts parameter. The optimal Eps = 3.019 and the optimal MinPts = 77 can be obtained by calculation.
3.2.4. Verify the Optimal Parameters
An efficient index to measure the clustering effect is the silhouette coefficient [73]. The silhouette coefficient measures the similarity of the cluster where a sample point is located compared to other clusters, which is used to describe the silhouette clarity of each category after clustering; it is made up of two components: cohesion and separation. The degree of cohesion indicates how closely a sample point is related to the elements in the cluster, while the degree of separation indicates a sample point’s proximity to out-of-cluster elements. The silhouette coefficient [56] is calculated using Equation (8).
where a(i) denotes the sample point’s cohesion, or the average distance between the i-th object and the cluster’s other objects; the average distance between the i-th object and objects in clusters other than the one to which it belongs, as represented by b(i), is the degree of separation of sample points; the cluster count is represented by . The value range of the silhouette coefficient S is [−1, 1]. The closer the value is to 1, the more reasonable the clustering effect is.
In this paper, the silhouette coefficient is used to verify the clustering effect of the adaptively selected optimal parameters. Figure 9 is the relationship curve between the silhouette coefficient and the K value (when K is greater than 89, the number of clusters in the clustering results of the corresponding Eps and MinPts parameters is 1, which does not constitute the basic condition for calculating the silhouette coefficient; therefore, the curve of the relationship between the silhouette coefficient and the K value in Figure 9 stops at K = 89). It can be seen from the figure that the clustering result of the optimal parameter (Eps = 3.019 and MinPts = 77) adaptively selected in this paper is better, and the value of the silhouette coefficient is the highest compared with other parameters. Therefore, the optimal K value (K = 81) selected in this paper is effective, and the Eps and MinPts parameters corresponding to the optimal K value are optimal.
The obtained optimal Eps and MinPts parameters are input into the DBSCAN algorithm to cluster the dataset in Figure 1. The clustering results are shown in Figure 10. Each color represents a cluster, and there are five colors in total, so a total of 5 clusters are generated, which is consistent with the clustering results given by the dataset. It can be seen that the X-DBSCAN algorithm proposed in this paper can adaptively generate appropriate Eps and MinPts parameters according to the characteristics of the dataset itself, effectively cluster the dataset, and accurately divide each density area.
3.3. The Overall Steps of X-DBSCAN
The X-DBSCAN algorithm is divided into five steps: generating the distance distribution matrix, generating the Eps parameter list, generating the MinPts parameter list, selecting the optimal K value, and determining the optimal Eps and MinPts parameters. The overall implementation steps and algorithm flowchart of the X-DBSCAN algorithm are as follows:
Step 1: Calculate the Euclidean distance between each data object and other objects in the dataset, generate a distance distribution matrix , and arrange the elements in the distance distribution matrix in ascending row order.
Step 2: Generate the K-dist graph according to the distance matrix, use the least squares polynomial fitting method to fit each K-dist curve, use the maximum curvature method to select the inflection point of the K-dist curve as the corresponding Eps parameter EpsK, and generate the Eps parameter list.
Step 3: Generate MinPts parameters MinPtsK corresponding to each Eps parameter according to the given noise reduction threshold and mathematical expectation formula, and then obtain the MinPts parameter list.
Step 4: Input each EpsK and MinPtsK parameter in the Eps and MinPts parameter lists into the DBSCAN algorithm for clustering. According to the clustering results, the relationship curve between the cluster number and K value is established, and the maximum K value within the stable interval of the cluster number is selected as the optimal K value.
Step 5: The Eps and MinPts parameters corresponding to the optimal K value are the optimal parameters. The optimal Eps and MinPts parameters are input into the DBSCAN algorithm for clustering, and the optimal clustering results are obtained.
3.4. The Pseudocode of X-DBSCAN
The pseudocode used by the X-DBSCAN algorithm to generate the parameter list is provided in Algorithm 1.
| Algorithm 1: Generate parameter list | |
| Input: Dataset D Output: Eps parameter list Epslist, MinPts parameter list MinPtslist | |
| 1 | S = read(D) // Read data into S |
| 2 | Zscore(S) // data normalization |
| 3 | for s0 to sn |
| 4 | Calculate the distance of each point to other points dist(si,sj) |
| 5 | Generate a distance matrix matrix |
| 6 | Matrix[i].sort() // Sort the elements in the distance matrix in //ascending row order |
| 7 | end for |
| 8 | for k to n |
| 9 | KList.append(Matrix[i][k]) // Add the kth column elements of all //rows of the matrix to the KList list |
| 10 | KList.sort() // Sort the elements in the KList list to generate a K-dist //curve |
| 11 | Y_pred = Polyfit(KList) // Fitting a K-dist curve |
| 12 | Calculate the point with the largest curvature in the abrupt region after the fitted K- dist smooth curve rises steadily, denoted as the curve inflection point q |
| 13 | The ordinate of q as the Eps parameter EpsK |
| 14 | Epslist.append(EpsK) // Add the parameter EpsK to the Eps //parameter list |
| 15 | end for |
| 16 | for s0 to sn |
| 17 | Calculate the mathematical expectation of the number of objects in the Eps neighborhood of each object in the dataset D as the MinPts undetermined parameter M |
| 18 | MinPtsK = M × β // Add a noise reduction threshold to the MinPts //pending parameter to generate the parameter //MinPtsK |
| 19 | MinPtslist.append(MinPtsK) // Add the parameter MinPtsK to the //MinPts parameter list |
| 20 | end for |
| 21 | return Epslist, MinPtslist |
The pseudocode of X-DBSCAN algorithm to generate optimal parameters and clustering process is provided in Algorithm 2.
| Algorithm 2: X-DBSCAN Clustering | |
| Input: Eps parameter list Epslist, MinPts parameter list MinPtslist Output: Clustering results | |
| 1 | for i to n |
| 2 | Cluster.append(DBSCAN(Epslist[i], MinPtslist[i])) |
| 3 | Generate a relationship curve with the abscissa as ClusterNumber and the ordinate as K Value |
| 4 | end for |
| 5 | While(y >= 2) // y = 5 |
| 6 | if ClusterNumber is X consecutively y times then |
| 7 | When the number of clusters is selected as X, the maximum K value is the optimal parameter K |
| 8 | break |
| 9 | else if y = 2 |
| 10 | The maximum K value in the interval where the fluctuation range of the number of clusters is within 1 is selected as the optimal parameter K |
| 11 | else |
| 12 | y = y − 1 |
| 13 | continue |
| 14 | end if |
| 15 | DBSCAN(EpsK, MinPtsK) |
| 16 | return clusters |
3.5. The Time Complexity Analysis of X-DBSCAN
For two-dimensional datasets, The traditional DBSCAN algorithm has an O() time complexity [74], where n denotes the dataset’s total number of objects. The X-DBSCAN algorithm is based on DBSCAN, and the iterative operation is performed on the basis of the DBSCAN algorithm; the number of dataset objects n determines the number of iterations. The time complexity of the X-DBSCAN algorithm to generate the distance matrix during operation is O(). The time complexity of the process of curve fitting using least squares is O(). Therefore, the total time complexity of the X-DBSCAN algorithm is O().
In conclusion, the X-DBSCAN algorithm effectively increases the clustering accuracy and has a better clustering effect in general scenarios, despite having a marginally higher time complexity than the traditional DBSCAN algorithm.
4. Experiment and Result Analysis
The experiment was implemented with Python3.9 and ran under the Windows10 system environment of 64-bit system. The hardware configuration was as follows: Intel Corei7-7500U, [email protected] GHz dual-core, 8 GB memory. In order to verify the clustering accuracy and effectiveness of the algorithm in this paper, experiments and clustering analysis were carried out on two-dimensional artificial datasets of various shapes and UCI real datasets. At the same time, four multidimensional synthetic datasets constructed by Gaussian distribution were used to verify the clustering performance and algorithm stability of the X-DBSCAN algorithm for high-dimensional data and large-scale data.
4.1. Dataset
In this paper, three different types of datasets were used to test the X-DBSCAN algorithm: two-dimensional artificial datasets, UCI multidimensional real datasets, and synthetic datasets of different dimensions constructed using Gaussian distribution.
4.1.1. Two-Dimensional Artificial Dataset
In the experiment, five two-dimensional artificial datasets were selected for cluster analysis, as shown in Figure 11. Aggregation is a 2D dataset with 788 data objects in seven categories [75]; Compound is a 2D dataset with 399 data objects in six categories [76]; Jain is a 2D dataset with 373 data objects in two categories; Flame is a 2D dataset with 240 data objects in two categories; R15 is a 2D dataset with 600 data objects in 15 categories.
4.1.2. UCI Real Dataset
In the experiment, eight kinds of UCI real datasets were selected for cluster analysis, and Table 1 displays the detailed information of the data.
4.1.3. Synthetic Datasets of Different Dimensions Constructed Using Gaussian Distribution
In the experiment, Gaussian distribution was used to construct four synthetic datasets of different dimensions for cluster analysis of X-DBSCAN algorithm on high-dimensional data and large-scale data. The specific information of the data is shown in Table 2.
4.2. Experiment on Artificial Two-Dimensional Datasets
Experiments were performed using the X-DBSCAN algorithm, MDA-DBSCAN, KANN-DBSCAN, AF-DBSCAN, and DBSCAN on five two-dimensional artificial datasets, and Figure 12, Figure 13, Figure 14, Figure 15 and Figure 16 illustrate the clustering effect, the purple points represent outliers, and other points of the same color represent points of the same cluster. Table 3 shows the running time of each algorithm on the five different datasets.
The experiment adopted the supervised F-score [77], accuracy rate (ACC) [78], adjusted mutual information (AMI) [79], and adjusted rand index (ARI) [80] as the external evaluation indicators of the clustering algorithm. The F-score combines the precision and recall rate with a value range of [0, 1]; a closer value to 1 denotes a better clustering effect. The value range of AMI and ARI is [−1, 1]; a closer value to 1 denotes more consistent clustering results with the real situation. The experiment used the running time of the algorithm on each dataset to test the efficiency of the algorithm. The evaluation index F-score, ACC, AMI, ARI, and time consumption obtained by the five clustering algorithms are shown in Table 4.
It can be observed from Figure 12, Figure 13, Figure 14, Figure 15 and Figure 16 that the X-DBSCAN algorithm could effectively cluster on datasets with uniform density (Aggregation, Flame, and R15) and divide the number of clusters correctly, and the clustering results were consistent with the number of categories given in the dataset. The clustering results on datasets with large differences in density distribution (Compound and Jain) were also more reasonable, and the clustering results were better than those obtained using other algorithms. MDA-DBSCAN and KANN-DBSCAN could also effectively cluster on five datasets.
From Table 3, it can be observed that the running time of the X-DBSCAN algorithm on datasets with a small amount of data was almost the same as the other algorithms; the running time on datasets with a large amount of data was slightly higher than the other algorithms. This situation is mainly due to the increased time consumption of the X-DBSCAN algorithm in the curve fitting process. In this paper, the least square method is used to fit the K-dist curve to remove the rough points of the original K-dist curve. In order to ensure that the fitted curve is basically consistent with the shape characteristics of the original K-dist curve and does not lose the information characteristics of the original K-dist curve, a higher number of fitting times is adopted. A higher number of fittings leads to a longer duration of the curve fitting process. Therefore, as the number of datasets increases, the running time of the X-DBSCAN algorithm increases. Although the running time of the X-DBSCAN algorithm on the dataset is relatively long, the algorithm improves the accuracy of clustering, and the clustering results are more reasonable.
Each cluster evaluation index of the artificial two-dimensional datasets is provided in Table 4. The X-DBSCAN algorithm generated a more accurate number of clusters, but it could not identify all the clusters in the Compound and Jain datasets due to the uneven density distribution and large density variance of the datasets. When the X-DBSCAN algorithm clusters the datasets with uneven density distribution, there are certain errors, which lead to inconsistency between the number of clusters in the clustering result and the number of categories in the dataset, and the clustering effect is not good. This is because the traditional DBSCAN algorithm is mainly aimed at datasets with uniform density, and the clustering quality is poor on datasets with large density differences, which is the limitation of the DBSCAN algorithm itself.
4.3. Experiment on UCI Real Dataset
In order to better verify the clustering effect and clustering stability of the algorithm proposed in this paper on a real dataset, X-DBSCAN was compared with the MDA-DBSCAN, KANN-DBSCAN, AF-DBSCAN, and DBSCAN algorithms on eight UCI real datasets. Table 5 shows the running time of each algorithm on different datasets. It can be seen that the running time of the X-DBSCAN algorithm on the cube was not much different from other algorithms, but slightly longer. The running time of the X-DBSCAN algorithm on the Pima and Banknote datasets was longer than other algorithms, because these two datasets have larger data volumes than other datasets. The curve fitting process of the X-DBSCAN algorithm consumes more time on datasets with a large amount of data. The running time of the MDA-DBSCAN and KANN-DBSCAN algorithms was almost the same, because the basic idea and algorithm flow of the two algorithms are consistent. The AF-DBSCAN algorithm had the shortest running time on each dataset, but the algorithm had poor clustering stability on datasets of different dimensions.
On real datasets, the X-DBSCAN algorithm’s clustering performance was examined. The experiment adopted ACC as its evaluation metric. The [0, 1] value range of ACC indicates that the clustering result becomes more accurate as the value approaches 1. The experiment used the running time of the algorithm on each dataset to test the efficiency of the algorithm. The evaluation index values and time consumption obtained by the five algorithms on the eight UCI real datasets are shown in Table 6.
It can be seen from Table 6 that the X-DBSCAN algorithm had the largest ACC value on the eight multidimensional UCI real datasets. This shows that the algorithm had a higher accuracy rate on the UCI real datasets, as well as better clustering performance and clustering stability. The running time of the X-DBSCAN algorithm was slightly higher than that of other algorithms, but the clustering accuracy and clustering effect were better in the case of high-dimensional data. Comprehensive evaluation indicators show that the X-DBSCAN algorithm performed well on high-dimensional data.
On the basis of the above evaluation indicators, it can be seen that the X-DBSCAN algorithm was relatively stable on high-dimensional datasets, and it showed good clustering effects on datasets of different dimensions, as well as good robustness. Although the MDA-DBSCAN algorithm showed a good clustering effect on two-dimensional datasets, in the case of high-dimensional data, the advantages of multi-clustering using density thresholds were not well utilized. The AF-DBSCAN algorithm had a good clustering effect on the Iris, Ecoli, and Glass datasets, but it was unstable on datasets with different data distributions and dimensions. Although the KANN-DBSCAN algorithm performed well on two-dimensional artificial datasets, it was not effective on high-dimensional UCI real datasets. This is because, in a high-dimensional dataset with uneven distribution, the relationship between the number of clusters and the K value is difficult to enter the defined stable interval with a constant number of clusters. The selection of the K value of the algorithm has a considerable impact on the clustering results; hence, there were large errors in the clustering results of the KANN-DBSCAN algorithm on high-dimensional datasets. According to the distribution characteristics of the dataset itself, the algorithm in this paper selected the optimal K-dist curve for analysis and algorithm parameter determination. A noise reduction threshold was added during the generation of MinPts parameters to reduce the impact of noisy data on the clustering results. Redefining the selection strategy of the stable interval can obtain algorithm parameters that are more in line with the characteristics of the data, thus improving the clustering effect and algorithm stability.
4.4. Synthetic Dataset Experiment: Gaussian-Distributed Dimensions
The X-DBSCAN algorithm was tested on four synthetic datasets of different dimensions constructed by Gaussian distribution, and the clustering results are shown in Table 7. It can be observed that, as the data dimension increased, the X-DBSCAN algorithm could maintain the stability of the accuracy of the clustering results, and it had stable clustering performance under datasets of different dimensions. The X-DBSCAN algorithm had better clustering results in the face of high-dimensional data.
On synthetic datasets of different dimensions, the clustering performance of the X-DBSCAN algorithm in the face of high-dimensional data was tested. The experiment used F-score, ACC, AMI, and ARI as clustering evaluation indices. At the same time, the experiment also used the running time of the X-DBSCAN algorithm on each dataset to test the operating efficiency of the algorithm. The clustering evaluation index and time consumption obtained by X-DBSCAN algorithm on the four synthetic datasets constructed by Gaussian distribution are shown in Table 7.
It can be seen from Table 7 that the clustering evaluation indices of F-score, ACC, AMI, and ARI of the X-DBSCAN algorithm on the four multidimensional synthetic datasets constructed by Gaussian distribution were all higher than 0.99. This shows that the clustering results generated by the X-DBSCAN algorithm were almost consistent with the actual categories, and the accuracy and rationality of the clustering results were better. The X-DBSCAN algorithm had the shortest running time on the X-1 dataset, which had the lowest number of categories. This shows that the running time of the algorithm in the case of high-dimensional data is related to the number of categories given in the dataset. The running time of the X-DBSCAN algorithm on the X-2, X-3, and X-4 datasets had a small difference, while the data size of the X-2, X-3, and X-4 datasets did not change greatly. This shows that the running time of the X-DBSCAN algorithm in high-dimensional datasets has no obvious relationship with the dimension of the dataset.
On the basis of the above evaluation indicators, it can be seen that the X-DBSCAN algorithm had stable clustering accuracy and clustering performance on high-dimensional datasets (D = 64, 128, and 256), and it showed good performance on datasets of different dimensions, with a good clustering effect.
5. Conclusions
Aiming at the defects caused by artificial selection of two parameters using the DBSCAN algorithm, this paper proposed an X-DBSCAN algorithm with parameter self-adaptive selection. On the basis of the curves in the K-dist graph, a list of candidate Eps parameters was generated. The mathematical expectation method and the noise reduction threshold were used to generate the corresponding MinPts parameter list. According to the clustering results of each group of parameters in the Eps and MinPts parameter lists, the optimal MinPts and Eps were found, and the adaptive determination of algorithm parameters and the automation of the clustering process were realized. Comparative experiments of five algorithms (X-DBSCAN, MDA-DBSCAN, KANN- DBSCAN, AF-DBSCAN, and DBSCAN) were carried out on five artificial 2D datasets and eight multidimensional UCI datasets. The experimental results showed that the clustering accuracy of X-DBSCAN was 21.83% and 15.52% higher than that of DBSCAN on the artificial and UCI datasets respectively; from the perspective of clustering indicators F-score, AMI, and ARI, the X-DBSCAN algorithm was also better than other algorithms. In addition, X-DBSCAN was experimented on four datasets of different dimensions synthesized by Gaussian distribution. The experimental results showed that the clustering indices F-score, AMI, and ARI were all above 0.999 on average, and X-DBSCAN also had stable clustering performance in high-dimensional situations. The X-DBSCAN algorithm realizes the adaptive selection of parameters, and it improves the clustering performance of the algorithm and the clustering accuracy in high-dimensional datasets. However, there are still deficiencies in this algorithm, and further research is needed:
- (1)
- The clustering results of the X-DBSCAN algorithm on datasets with large density differences and multiple densities still have certain errors, and the idea of data partitioning can be used to solve this problem. Firstly, data blocks with the same density can be divided into one area, and, after the different density areas in the dataset are effectively separated, each area can be clustered and merged.
- (2)
- The X-DBSCAN algorithm has high time complexity. On the one hand, we can improve the data structure of the X-DBSCAN algorithm by using the KD tree structure to retrieve all points within a given distance of a specific point. On the other hand, we can use the distributed big data platform to parallelize the X-DBSCAN algorithm. This method can effectively and reasonably reduce the time complexity of the algorithm and improve the execution efficiency of the algorithm.
Author Contributions
Conceptualization, L.Y. and H.H.; methodology, L.Y. and H.H.; software, L.Y., Y.Q. and H.H; validation, L.Y., K.L. and H.H.; formal analysis, H.H.; resources, L.Y. and G.Z.; data curation, H.H; writing—original draft preparation, H.H.; writing—review and editing, H.C. and G.Z.; visualization, Y.Q. and K.L.; funding acquisition, L.Y. All authors have read and agreed to the published version of the manuscript.
Funding
This work was supported by the Natural Science Foundation of Sichuan Province under Grant 2022NSFSC0536, the Project of Wenzhou Key Laboratory Foundation, China under Grant 2021HZSY0071.
Data Availability Statement
Not applicable.
Conflicts of Interest
The authors declare no conflict of interest.
References
- Tan, P.-N.; Steinbach, M.S.; Kumar, V. Introduction to Data Mining. In Data Mining and Machine Learning Applications; Wiley: Hoboken, NJ, USA, 2022. [Google Scholar]
- Han, J.; Kamber, M. Data Mining: Concepts and Technology; China Machine Press: Beijing, China, 2012. [Google Scholar]
- Chen, Y.; Tang, S.; Bouguila, N.; Wang, C.; Du, J.; Li, H. A fast clustering algorithm based on pruning unnecessary distance computations in DBSCAN for high-dimensional data. Pattern Recognit. 2018, 83, 375–387. [Google Scholar] [CrossRef]
- Rodriguez, A.; Laio, A. Clustering by fast search and find of density peaks. Science 2014, 344, 1492–1496. [Google Scholar] [CrossRef] [PubMed] [Green Version]
- Bensmail, H.; Celeux, G.; Raftery, A.E.; Robert, C.P. Inference in model-based cluster analysis. Stat. Comput. 1997, 7, 1–10. [Google Scholar] [CrossRef]
- Ester, M.; Kriegel, H.-P.; Sander, J.; Xu, X. A Density-Based Algorithm for Discovering Clusters in Large Spatial Databases with Noise. In Proceedings of the KDD’96: Proceedings of the Second International Conference on Knowledge Discovery and Data Mining, Portland, OR, USA, 2–4 August 1996; pp. 226–231. [Google Scholar]
- Bechini, A.; Marcelloni, F.; Renda, A. TSF-DBSCAN: A Novel Fuzzy Density-Based Approach for Clustering Unbounded Data Streams. IEEE Trans. Fuzzy Syst. 2022, 30, 623–637. [Google Scholar] [CrossRef]
- Chen, H.; Wang, T.; Chen, T.; Deng, W. Hyperspectral Image Classification Based on Fusing S3-PCA, 2D-SSA and Random Patch Network. Remote Sens. 2023, 15, 3402. [Google Scholar] [CrossRef]
- Li, M.; Bi, X.; Wang, L.; Han, X. A method of two-stage clustering learning based on improved DBSCAN and density peak algorithm. Comput. Commun. 2021, 167, 75–84. [Google Scholar] [CrossRef]
- Chen, H.; Chen, Y.; Wang, Q.; Chen, T.; Zhao, H. A New SCAE-MT Classification Model for Hyperspectral Remote Sensing Images. Sensors 2022, 22, 8881. [Google Scholar] [CrossRef]
- Xu, J.J.; Zhao, Y.L.; Chen, H.Y.; Deng, W. ABC-GSPBFT: PBFT with grouping score mechanism and optimized consensus process for flight operation data-sharing. Inform. Sci. 2023, 624, 110–127. [Google Scholar] [CrossRef]
- Zhou, D.; Liu, P. VDBSCAN: Variable Density Clustering Algorithm. Comput. Eng. Appl. 2009, 45, 137–141. [Google Scholar]
- Li, W.; Yan, S.; Jiang, Y. Algorithm Research on Adaptive Determination of DBSCAN Algorithm Parameters. Comput. Eng. Appl. 2019, 55, 1–7. [Google Scholar]
- Wan, J.; Hu, D.; Jiang, Y. Algorithm Research on Multi-density Adaptive Determination of DBSCAN Algorithm Parameters. Comput. Eng. Appl. 2022, 58, 78–85. [Google Scholar]
- Zhou, Z.; Wang, J.; Zhu, S. An Improved Adaptive Fast AF-DBSCAN Clustering Algorithm. J. Intell. Syst. 2016, 11, 93–98. [Google Scholar]
- Wang, Z.; Ye, Z.; Du, Y.; Mao, Y.; Liu, Y.; Wu, Z.; Wang, J. AMD-DBSCAN: An Adaptive Multi-density DBSCAN for datasets of extremely variable density. In Proceedings of the 2022 IEEE 9th International Conference on Data Science and Advanced Analytics (DSAA), Shenzhen, China, 13–16 October 2022; pp. 1–10. [Google Scholar]
- Latifi-Pakdehi, A.; Daneshpour, N. DBHC: A DBSCAN-based hierarchical clustering algorithm. Data Knowl. Eng. 2021, 135, 101922. [Google Scholar] [CrossRef]
- Wang, G.; Lin, G. Improved adaptive parameter DBSCAN clustering algorithm. Comput. Eng. Appl. 2020, 56, 45–51. [Google Scholar]
- Gholizadeh, N.; Saadatfar, H.; Hanafi, N. K-DBSCAN: An improved DBSCAN algorithm for big data. J. Supercomput. 2020, 77, 6214–6235. [Google Scholar] [CrossRef]
- Bryant, A.; Cios, K. RNN-DBSCAN: A Density-Based Clustering Algorithm Using Reverse Nearest Neighbor Density Estimates. IEEE Trans. Knowl. Data Eng. 2018, 30, 1109–1121. [Google Scholar] [CrossRef]
- Falahiazar, Z.; Bagheri, A.; Reshadi, M. Determining the Parameters of DBSCAN Automatically Using the Multi-Objective Genetic Algorithm. J. Inf. Sci. Eng. 2021, 37, 157–183. [Google Scholar]
- Hou, J.; Lv, C.; Zhang, A.; Xu, E. Merging DBSCAN and Density Peak for Robust Clustering; Springer: Berlin/Heidelberg, Germany, 2019. [Google Scholar]
- Chen, W.; Shi, H. Improved DBSCAN clustering algorithm based on KD tree. Comput. Syst. Appl. 2022, 31, 305–310. [Google Scholar]
- Kim, J.-H.; Choi, J.-H.; Yoo, K.-H.; Nasridinov, A. AA-DBSCAN: An approximate adaptive DBSCAN for finding clusters with varying densities. J. Supercomput. 2018, 75, 142–169. [Google Scholar] [CrossRef]
- Ros, F.; Guillaume, S.; Riad, R.; Hajji, M.E. Detection of natural clusters via S-DBSCAN a Self-tuning version of DBSCAN. Knowl.-Based Syst. 2022, 241, 108288. [Google Scholar] [CrossRef]
- Ros, F.; Guillaume, S.; Riad, R. Path-scan: A novel clustering algorithm based on core points and connexity. Expert Syst. Appl. 2022, 210, 118316. [Google Scholar] [CrossRef]
- Zhang, X.; Shen, X.; Ouyang, T. Extension of DBSCAN in Online Clustering: An Approach Based on Three-Layer Granular Models. Appl. Sci. 2022, 12, 9402. [Google Scholar] [CrossRef]
- Unver, M.; Erginel, N. Clustering applications of IFDBSCAN algorithm with comparative analysis. J. Intell. Fuzzy Syst. 2020, 39, 6099–6108. [Google Scholar] [CrossRef]
- Ouyang, T.; Pedrycz, W.; Pizzi, N.J. Rule-Based Modeling With DBSCAN-Based Information Granules. IEEE Trans. Cybern. 2019, 51, 3653–3663. [Google Scholar] [CrossRef]
- Chen, Y.; Zhou, L.; Pei, S.; Yu, Z.; Chen, Y.; Liu, X.; Du, J.; Xiong, N. KNN-BLOCK DBSCAN: Fast Clustering for Large-Scale Data. IEEE Trans. Syst. Man Cybern. Syst. 2021, 51, 3939–3953. [Google Scholar] [CrossRef]
- Chen, Y.; Zhou, L.; Bouguila, N.; Wang, C.; Chen, Y.; Du, J. BLOCK-DBSCAN: Fast clustering for large scale data. Pattern Recognit. 2021, 109, 107624. [Google Scholar] [CrossRef]
- Li, S.-S. An Improved DBSCAN Algorithm Based on the Neighbor Similarity and Fast Nearest Neighbor Query. IEEE Access 2020, 8, 47468–47476. [Google Scholar] [CrossRef]
- Li, C.; Liu, M.; Cai, J.; Yu, Y.; Wang, H. Topic Detection and Tracking Based on Windowed DBSCAN and Parallel KNN. IEEE Access 2021, 9, 3858–3870. [Google Scholar] [CrossRef]
- Hahsler, M.; Piekenbrock, M.; Doran, D. dbscan: Fast Density-Based Clustering with R. J. Stat. Softw. 2019, 91, 1–30. [Google Scholar] [CrossRef] [Green Version]
- Zhang, L.; Lu, S.; Hu, C.-b.; Xiang, D.; Liu, T.; Su, Y. Superpixel Generation for SAR Imagery Based on Fast DBSCAN Clustering With Edge Penalty. IEEE J. Sel. Top. Appl. Earth Obs. Remote Sens. 2022, 15, 804–819. [Google Scholar] [CrossRef]
- Fu, H.; Li, H.; Dong, Y.; Xu, F.; Chen, F. Segmenting Individual Tree from TLS Point Clouds Using Improved DBSCAN. Forests 2022, 13, 566. [Google Scholar] [CrossRef]
- Sheng, D.; Deng, J.; Xiang, J. Automatic Smoke Detection Based on SLIC-DBSCAN Enhanced Convolutional Neural Network. IEEE Access 2021, 9, 63933–63942. [Google Scholar] [CrossRef]
- Sheridan, K.; Puranik, T.G.; Mangortey, E.; Pinon-Fischer, O.J.; Kirby, M.; Mavris, D.N. An Application of DBSCAN Clustering for Flight Anomaly Detection during the Approach Phase. In Proceedings of the AIAA Scitech 2020 Forum, Orlando, FL, USA, 6–10 January 2020. [Google Scholar]
- Deng, D. Application of DBSCAN Algorithm in Data Sampling. J. Phys. Conf. Ser. 2020, 1617, 042027. [Google Scholar] [CrossRef]
- Wibisono, S.R.; Anwar, M.T.; Supriyanto, A.; Amin, I.H.A. Multivariate weather anomaly detection using DBSCAN clustering algorithm. J. Phys. Conf. Ser. 2021, 1869, 012064. [Google Scholar] [CrossRef]
- Ji, Z.; Wang, C.-L. Accelerating DBSCAN Algorithm with AI Chips for Large Datasets. In Proceedings of the 50th International Conference on Parallel Processing, Lemont, IL, USA, 9–12 August 2021. Article No. 124. [Google Scholar]
- Zhu, Q.; Tang, X.; Elahi, A. Application of the novel harmony search optimization algorithm for DBSCAN clustering. Expert Syst. Appl. 2021, 178, 115054. [Google Scholar] [CrossRef]
- Mustakim; Rahmi, E.; Mundzir, M.R.; Rizaldi, S.T.; Okfalisa; Maita, I. Comparison of DBSCAN and PCA-DBSCAN Algorithm for Grouping Earthquake Area. In Proceedings of the 2021 International Congress of Advanced Technology and Engineering (ICOTEN), Virtual, 4–5 July 2021; pp. 1–5. [Google Scholar]
- Yang, Y.; Qian, C.; Li, H.; Gao, Y.; Wu, J.; Liu, C.-J. An efficient DBSCAN optimized by arithmetic optimization algorithm with opposition-based learning. Supercomputing 2022, 78, 19566–19604. [Google Scholar] [CrossRef]
- Shiba, K.; Chen, C.-C.; Sogabe, M.; Sakamoto, K.; Sogabe, T. Quantum-Inspired Classification Algorithm from DBSCAN–Deutsch–Jozsa Support Vectors and Ising Prediction Model. Appl. Sci. 2021, 11, 11386. [Google Scholar] [CrossRef]
- Xie, X.; Duan, L.-Z.; Qiu, T.; Li, J. Quantum algorithm for MMNG-based DBSCAN. Sci. Rep. 2021, 11, 6288. [Google Scholar] [CrossRef]
- Weng, S. h-DBSCAN: A simple fast DBSCAN algorithm for big data. In Proceedings of the Asian Conference on Machine Learning, Virtual, 17–19 November 2021. [Google Scholar]
- Jain, P.K.; Bajpai, M.; Pamula, R. A modified DBSCAN algorithm for anomaly detection in time-series data with seasonality. Int. Arab J. Inf. Technol. 2022, 19, 23–28. [Google Scholar] [CrossRef]
- Lee, H.-T.; Lee, J.-S.; Yang, H.; Cho, I.-S. An AIS Data-Driven Approach to Analyze the Pattern of Ship Trajectories in Ports Using the DBSCAN Algorithm. Appl. Sci. 2021, 11, 799. [Google Scholar] [CrossRef]
- Tang, X.; Liu, Y.; Chen, K. Air Traffic Trajectory Operation Mode Mining Based on Clustering. Appl. Sci. 2022, 12, 5944. [Google Scholar] [CrossRef]
- Yu, C.; Gong, B.; Song, M.; Zhao, E.; Chang, C.-I. Multiview Calibrated Prototype Learning for Few-shot Hyperspectral Image Classification. IEEE Trans. Geosci. Remote 2022, 60, 5544713. [Google Scholar] [CrossRef]
- Duan, Z.; Song, P.; Yang, C.; Deng, L.; Jiang, Y.; Deng, F.; Jiang, X.; Chen, Y.; Yang, G.; Ma, Y.; et al. The impact of hyperglycaemic crisis episodes on long-term outcomes for inpatients presenting with acute organ injury: A prospective, multicentre follow-up study. Front. Endocrinol. 2022, 13, 1057089. [Google Scholar] [CrossRef]
- Cai, J.; Ding, S.; Zhang, Q.; Liu, R.; Zeng, D.; Zhou, L. Broken ice circumferential crack estimation via image techniques. Ocean Eng. 2022, 259, 111735. [Google Scholar] [CrossRef]
- Ren, Z.; Zhen, X.; Jiang, Z.; Gao, Z.; Li, Y.; Shi, W. Underactuated control and analysis of single blade installation using a jackup installation vessel and active tugger line force control. Mar. Struct. 2023, 88, 103338. [Google Scholar] [CrossRef]
- Li, M.; Zhang, J.; Song, J.; Li, Z.; Lu, S. A clinical-oriented non severe depression diagnosis method based on cognitive behavior of emotional conflict. IEEE Trans. Comput. Soc. Syst. 2022, 10, 131–141. [Google Scholar] [CrossRef]
- Jin, T.; Zhu, Y.; Shu, Y.; Cao, J.; Yan, H.; Jiang, D. Uncertain optimal control problem with the first hitting time objective and application to a portfolio selection model. J. Intell. Fuzzy Syst. 2023, 44, 1585–1599. [Google Scholar] [CrossRef]
- Yu, Y.; Tang, K.; Liu, Y. A fine-tuning based approach for daily activity recognition between smart homes. Appl. Sci. 2023, 13, 5706. [Google Scholar] [CrossRef]
- Song, Y.; Zhao, G.; Zhang, B.; Chen, H.; Deng, W.Q.; Deng, Q. An enhanced distributed differential evolution algorithm for portfolio optimization problems. Eng. Appl. Artif. Intell. 2023, 121, 106004. [Google Scholar] [CrossRef]
- Jin, T.; Yang, X. Monotonicity theorem for the uncertain fractional differential equation and application to uncertain financial market. Math. Comput. Simul. 2021, 190, 203–221. [Google Scholar] [CrossRef]
- Xie, C.; Zhou, L.; Ding, S.; Liu, R.; Zheng, S. Experimental and numerical investigation on self-propulsion performance of polar merchant ship in brash ice channel. Ocean Eng. 2023, 269, 113424. [Google Scholar] [CrossRef]
- Huang, C.; Zhou, X.; Ran, X.; Wang, J.; Chen, H.; Deng, W. Adaptive cylinder vector particle swarm optimization with differential evolution for UAV path planning. Eng. Appl. Artif. Intell. 2023, 121, 105942. [Google Scholar] [CrossRef]
- Li, M.; Zhang, W.; Hu, B.; Kang, J.; Wang, Y.; Lu, S. Automatic assessment of depression and anxiety through encoding pupil-wave from HCI in VR scenes. ACM Trans. Multimed. Comput. Commun. Appl. 2022. [Google Scholar] [CrossRef]
- Chen, M.; Shao, H.; Dou, H.; Li, W.; Liu, B. Data augmentation and intelligent fault diagnosis of planetary gearbox using ILoFGAN under extremely limited sample. IEEE Trans. Reliab. 2022, 1–9. [Google Scholar] [CrossRef]
- Zhou, X.; Cai, X.; Zhang, H.; Zhang, Z.; Jin, T.; Chen, H.; Deng, W. Multi-strategy competitive-cooperative co-evolutionary algorithm and its application. Inf. Sci. 2023, 635, 328–344. [Google Scholar] [CrossRef]
- Sun, Q.; Zhang, M.; Zhou, L.; Garme, K.; Burman, M. A machine learning-based method for prediction of ship performance in ice: Part I. ice resistance. Mar. Struct. 2022, 83, 103181. [Google Scholar] [CrossRef]
- Chen, T.; Song, P.; He, M.; Rui, S.; Duan, X.; Ma, Y.; Armstrong, D.G.; Deng, W. Sphingosine-1-phosphate derived from PRP-Exos promotes angiogenesis in diabetic wound healing via the S1PR1/AKT/FN1 signalling pathway. Burn. Trauma 2023, 11, tkad003. [Google Scholar] [CrossRef]
- Chen, X.; Shao, H.; Xiao, Y.; Yan, S.; Cai, B.; Liu, B. Collaborative fault diagnosis of rotating machinery via dual adversarial guided unsupervised multi-domain adaptation network. Mech. Syst. Signal Process. 2023, 198, 110427. [Google Scholar] [CrossRef]
- Cai, Z.; Wang, J.; He, K. Adaptive Density-Based Spatial Clustering for Massive Data Analysis. IEEE Access 2020, 8, 23346–23358. [Google Scholar] [CrossRef]
- Sharma, A.; Sharma, A. KNN-DBSCAN: Using k-nearest neighbor information for parameter-free density-based clustering. In Proceedings of the 2017 International Conference on Intelligent Computing, Instrumentation and Control Technologies (ICICICT), Kerala, India, 6–7 July 2017; pp. 787–792. [Google Scholar]
- Zhang, W.; Tan, G.; Zhu, X. Application of spatial clustering of stops in scenic spot hot spot analysis. Comput. Eng. Appl. 2018, 54, 263–270. [Google Scholar]
- Gao, Q.; Wang, L.; Wang, R. Research on Least Squares Curve Fitting and Optimization Algorithm. Ind. Control Comput. 2021, 34, 100–101. [Google Scholar]
- Chen, X.; Xi, Q. Research and implementation of adaptive clustering algorithm based on DBSCAN. J. Huaiyin Normal Univ. (Nat. Sci. Ed.) 2021, 20, 228–234. [Google Scholar]
- Zhu, L.; Ma, B.; Zhao, X. Cluster validity analysis based on profile coefficient. Comput. Appl. 2010, 30 (Suppl. 2), 139–141. [Google Scholar]
- Feng, S.; Xiao, W. Research and improvement of DBSCAN clustering algorithm. China Univ. Min. Technol. 2008, 1, 105–111. [Google Scholar]
- Gionis, A.; Mannila, H.; Tsaparas, P. Clustering Aggregation (long version). ACM Trans. Knowl. Discov. Data 2007, 1, 1–30. [Google Scholar] [CrossRef] [Green Version]
- Zahn, C.T. Graph-Theoretical Methods for Detecting and Describing Gestalt Clusters. IEEE Trans. Comput. 1971, C-20, 68–86. [Google Scholar] [CrossRef] [Green Version]
- Steinbach, M.S.; Karypis, G.; Kumar, V. A Comparison of Document Clustering Techniques. In Proceedings of the KDD Workshop on Text Mining, Boston, MA, USA, 20 August 2000; pp. 525–526. [Google Scholar]
- Yang, X.; Zhu, Q.-P.; Huang, Y.; Xiao, J.; Wang, L.; Tong, F. Parameter-free Laplacian centrality peaks clustering. Pattern Recognit. Lett. 2017, 100, 167–173. [Google Scholar] [CrossRef]
- Yin, S.; Wang, T.; Xie, F. Cluster result evaluation method based on mutual information and profile coefficient. J. Weapon Equip. Eng. 2020, 41, 207–213. [Google Scholar]
- Qiu, B.; Tang, Y. Clustering algorithm for fast identification of density skeleton. Comput. Appl. 2017, 37, 3482–3486. [Google Scholar]
Figure 1.
A two-dimensional dataset containing five categories with a data volume of 500.

Figure 2.
All K-dist curves corresponding to the dataset in Figure 1.
Figure 2.
All K-dist curves corresponding to the dataset in Figure 1.

Figure 3.
Comparison before and after K-dist (81-dist) curve fitting: (a) K-dist (81-dist) curve; (b) K-dist (81-dist) curve after fitting.
Figure 3.
Comparison before and after K-dist (81-dist) curve fitting: (a) K-dist (81-dist) curve; (b) K-dist (81-dist) curve after fitting.

Figure 4.
K-dist (81-dist) curve comparison plot.

Figure 5.
The K-dist (81-dist) curve’s inflection point after fitting.

Figure 6.
Graph of Eps parameter value vs. K value.

Figure 7.
Graph of MinPts parameter value vs. K value.

Figure 8.
Graph of the number of clusters in clustering results versus K values.

Figure 9.
Clustering result profile coefficient vs. K value.

Figure 10.
Clustering results of the dataset in Figure 1 under the X-DBSCAN algorithm.
Figure 10.
Clustering results of the dataset in Figure 1 under the X-DBSCAN algorithm.
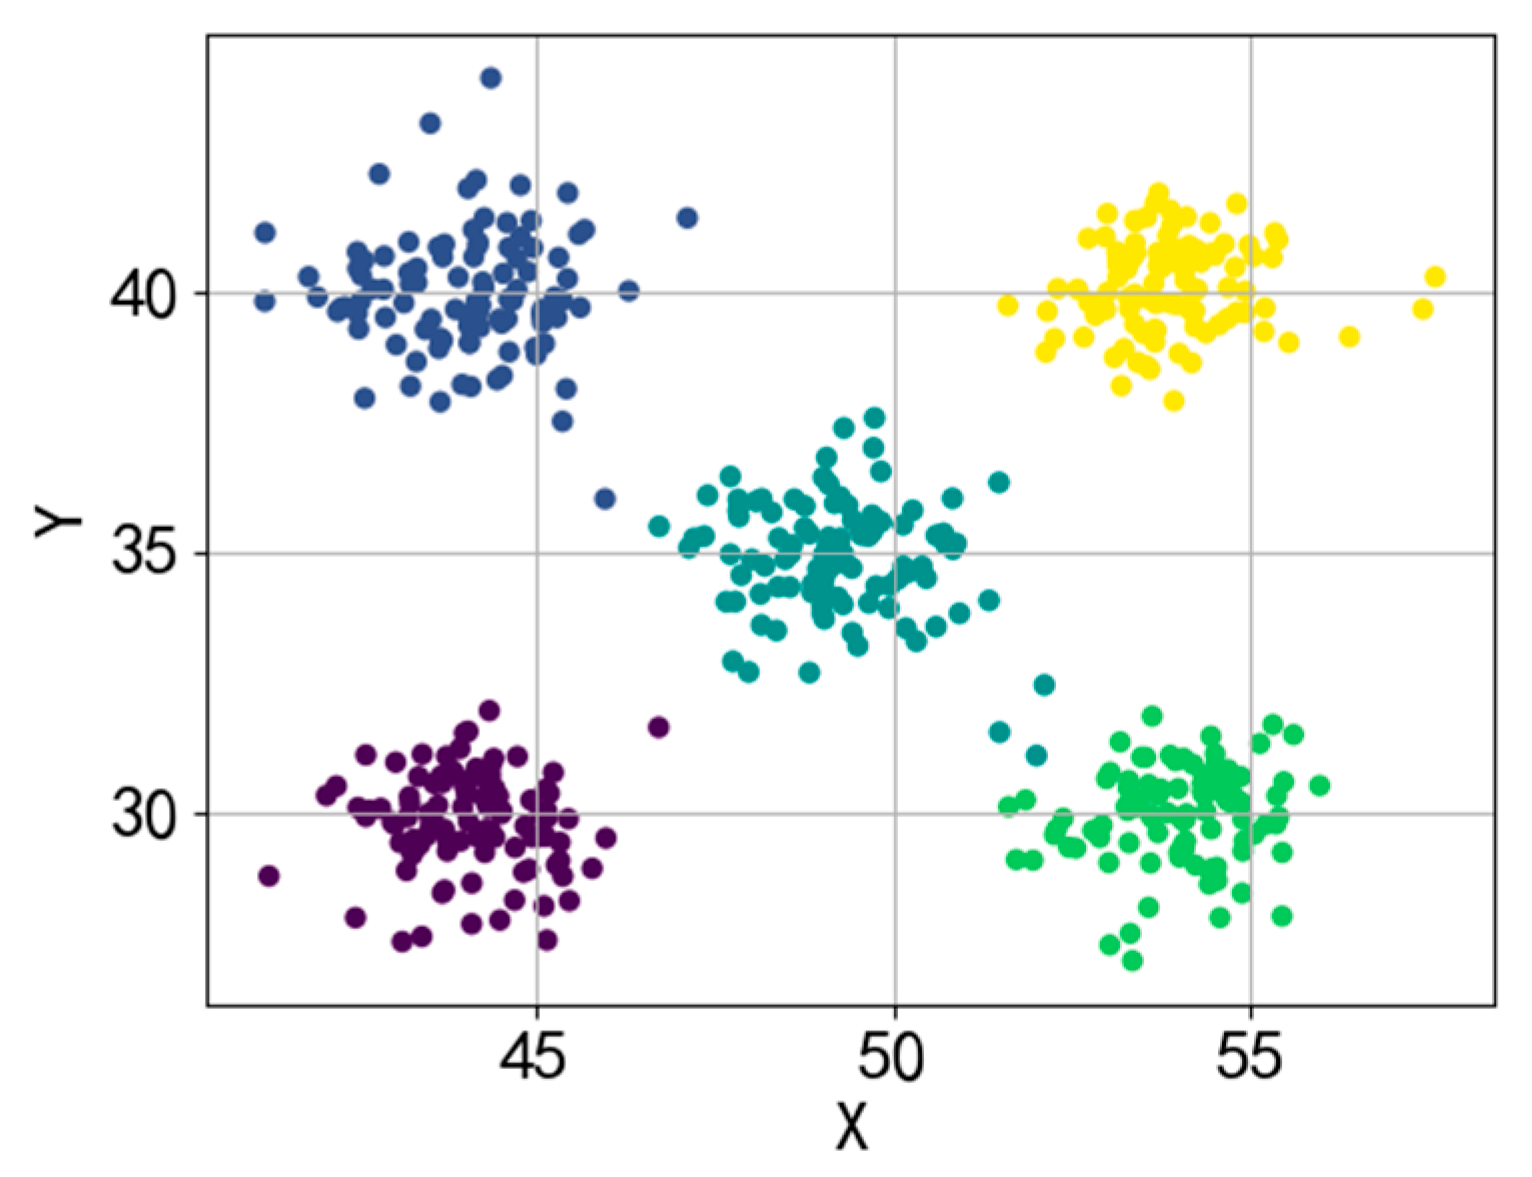
Figure 11.
Two-dimensional artificial dataset.
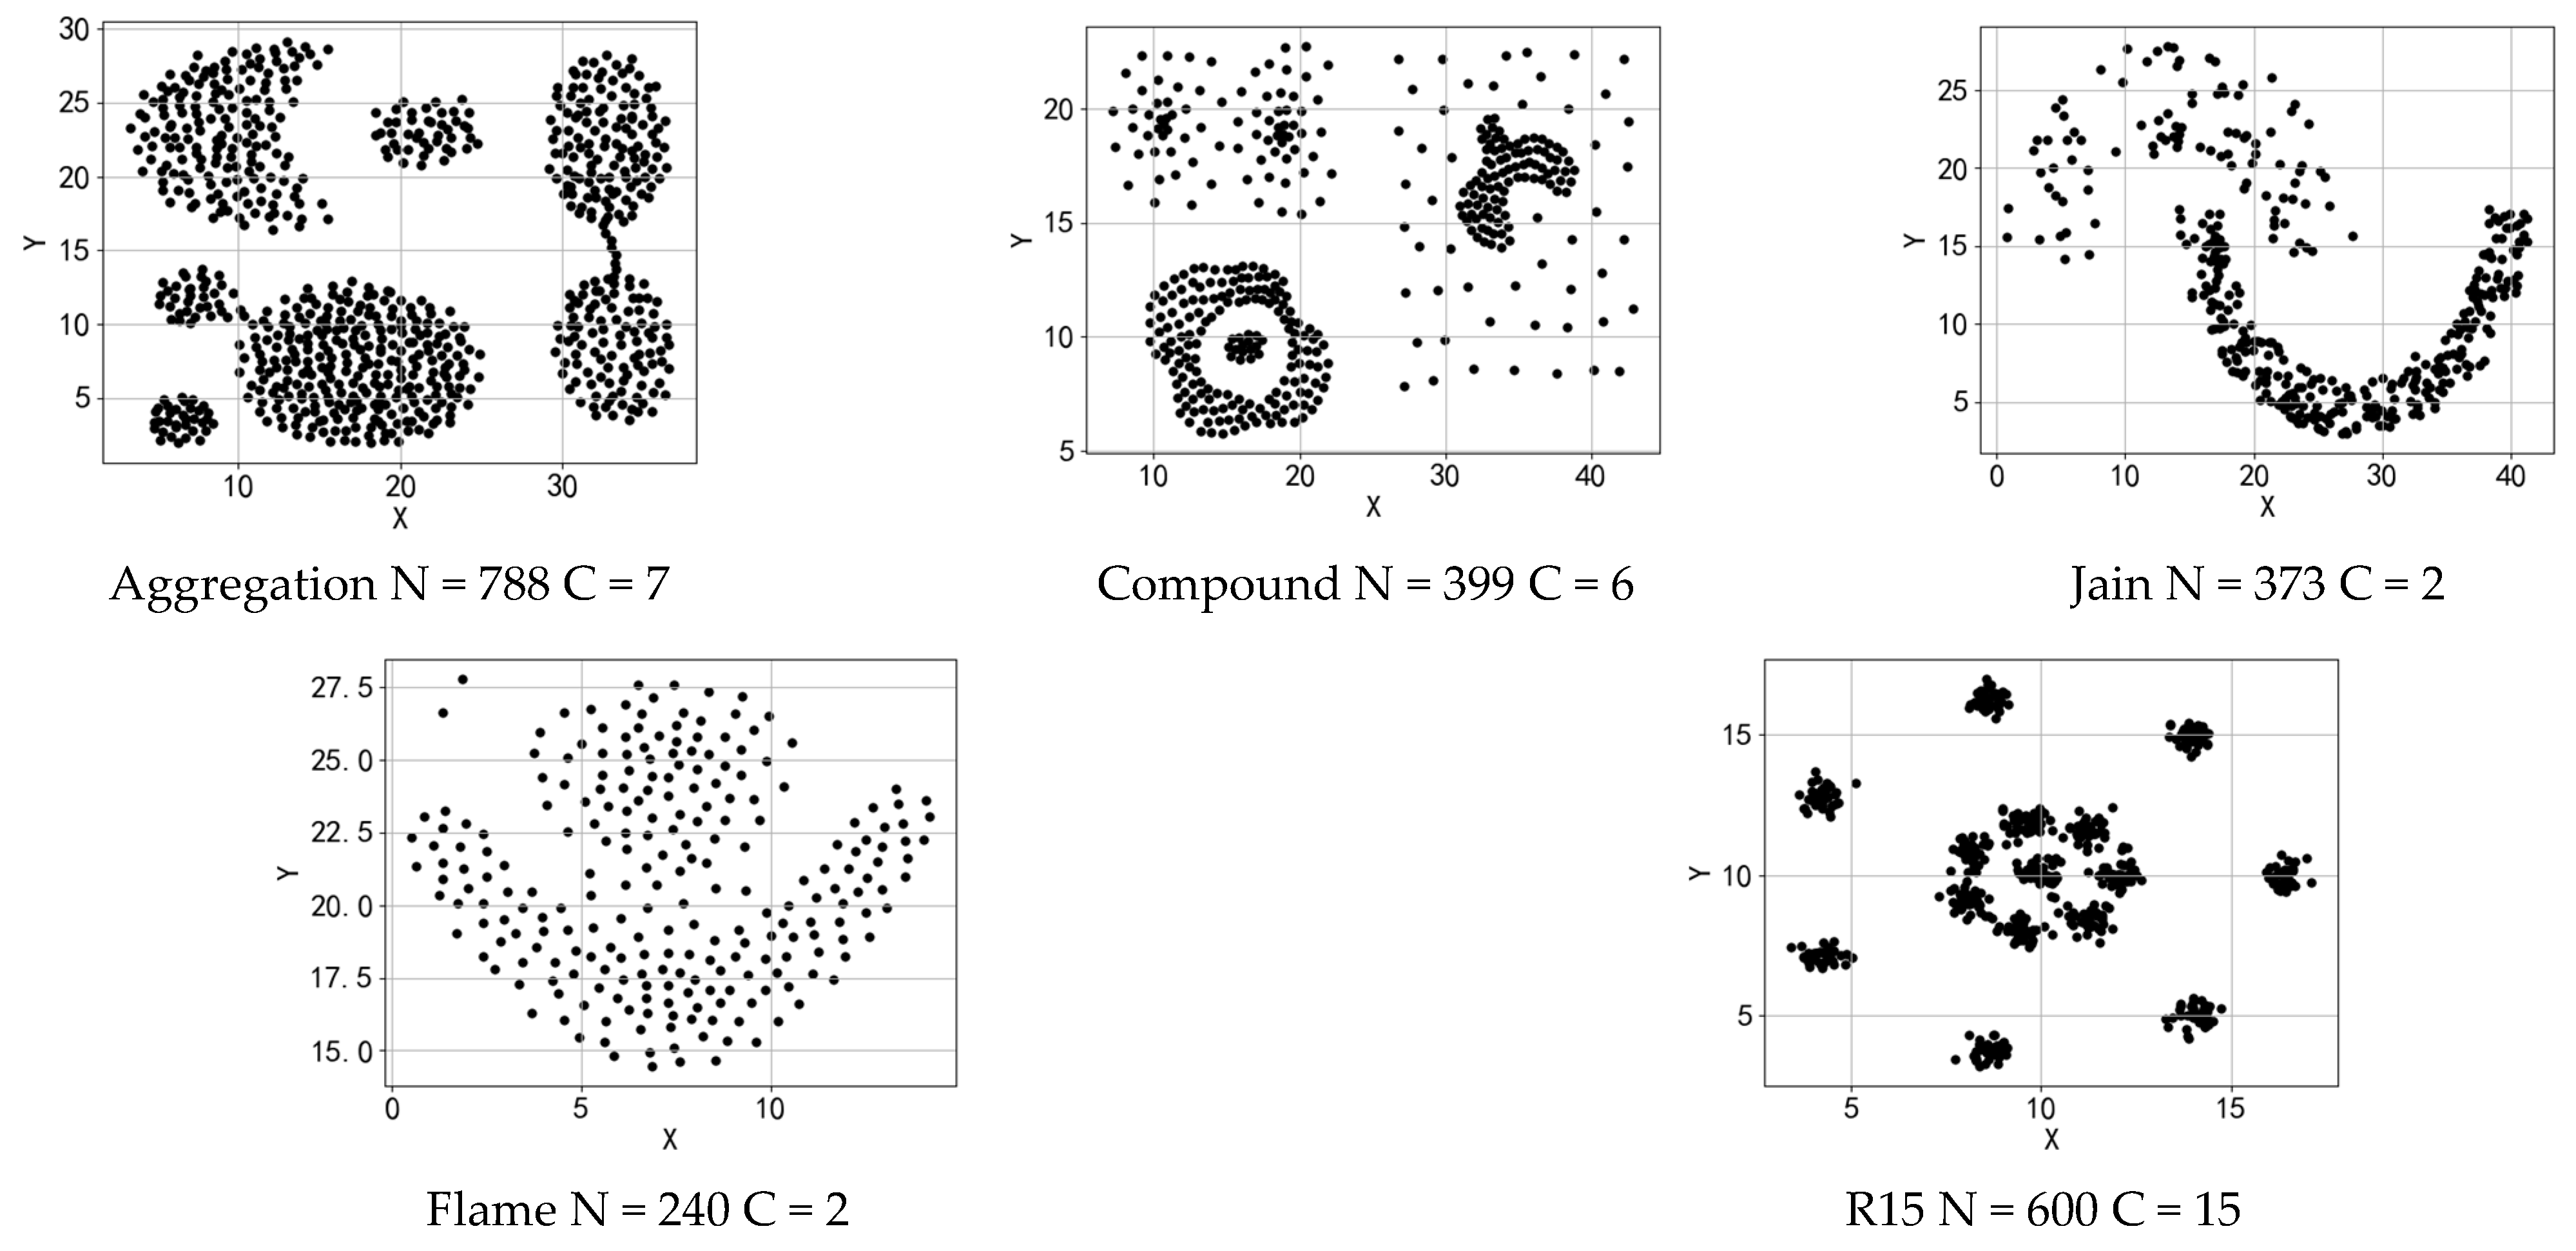
Figure 12.
Clustering effect of X-DBSCAN algorithm on five datasets: (a) Aggregation N = 788, C = 7; (b) Compound N = 399, C = 5; (c) Jain N = 373, C = 2; (d) Flame N = 240, C = 2; (e) R15 N = 600, C = 15.
Figure 12.
Clustering effect of X-DBSCAN algorithm on five datasets: (a) Aggregation N = 788, C = 7; (b) Compound N = 399, C = 5; (c) Jain N = 373, C = 2; (d) Flame N = 240, C = 2; (e) R15 N = 600, C = 15.

Figure 13.
Clustering effect of MDA-DBSCAN algorithm on five datasets: (a) Aggregation N = 788, C = 7; (b) Compound N = 399, C = 6; (c) Jain N = 373, C = 2; (d) Flame N = 240, C = 2; (e) R15 N = 600, C = 15.
Figure 13.
Clustering effect of MDA-DBSCAN algorithm on five datasets: (a) Aggregation N = 788, C = 7; (b) Compound N = 399, C = 6; (c) Jain N = 373, C = 2; (d) Flame N = 240, C = 2; (e) R15 N = 600, C = 15.

Figure 14.
Clustering effect of KANN-DBSCAN algorithm on five datasets: (a) Aggregation N = 788, C = 7; (b) Compound N = 399, C = 5; (c) Jain N = 373, C = 1; (d) Flame N = 240, C = 2; (e) R15 N = 600, C = 15.
Figure 14.
Clustering effect of KANN-DBSCAN algorithm on five datasets: (a) Aggregation N = 788, C = 7; (b) Compound N = 399, C = 5; (c) Jain N = 373, C = 1; (d) Flame N = 240, C = 2; (e) R15 N = 600, C = 15.

Figure 15.
Clustering effect of AF-DBSCAN algorithm on five datasets: (a) Aggregation N = 788, C = 10; (b) Compound N = 399, C = 5; (c) Jain N = 373, C = 4; (d) Flame N = 240, C = 2; (e) R15 N = 600, C = 20.
Figure 15.
Clustering effect of AF-DBSCAN algorithm on five datasets: (a) Aggregation N = 788, C = 10; (b) Compound N = 399, C = 5; (c) Jain N = 373, C = 4; (d) Flame N = 240, C = 2; (e) R15 N = 600, C = 20.
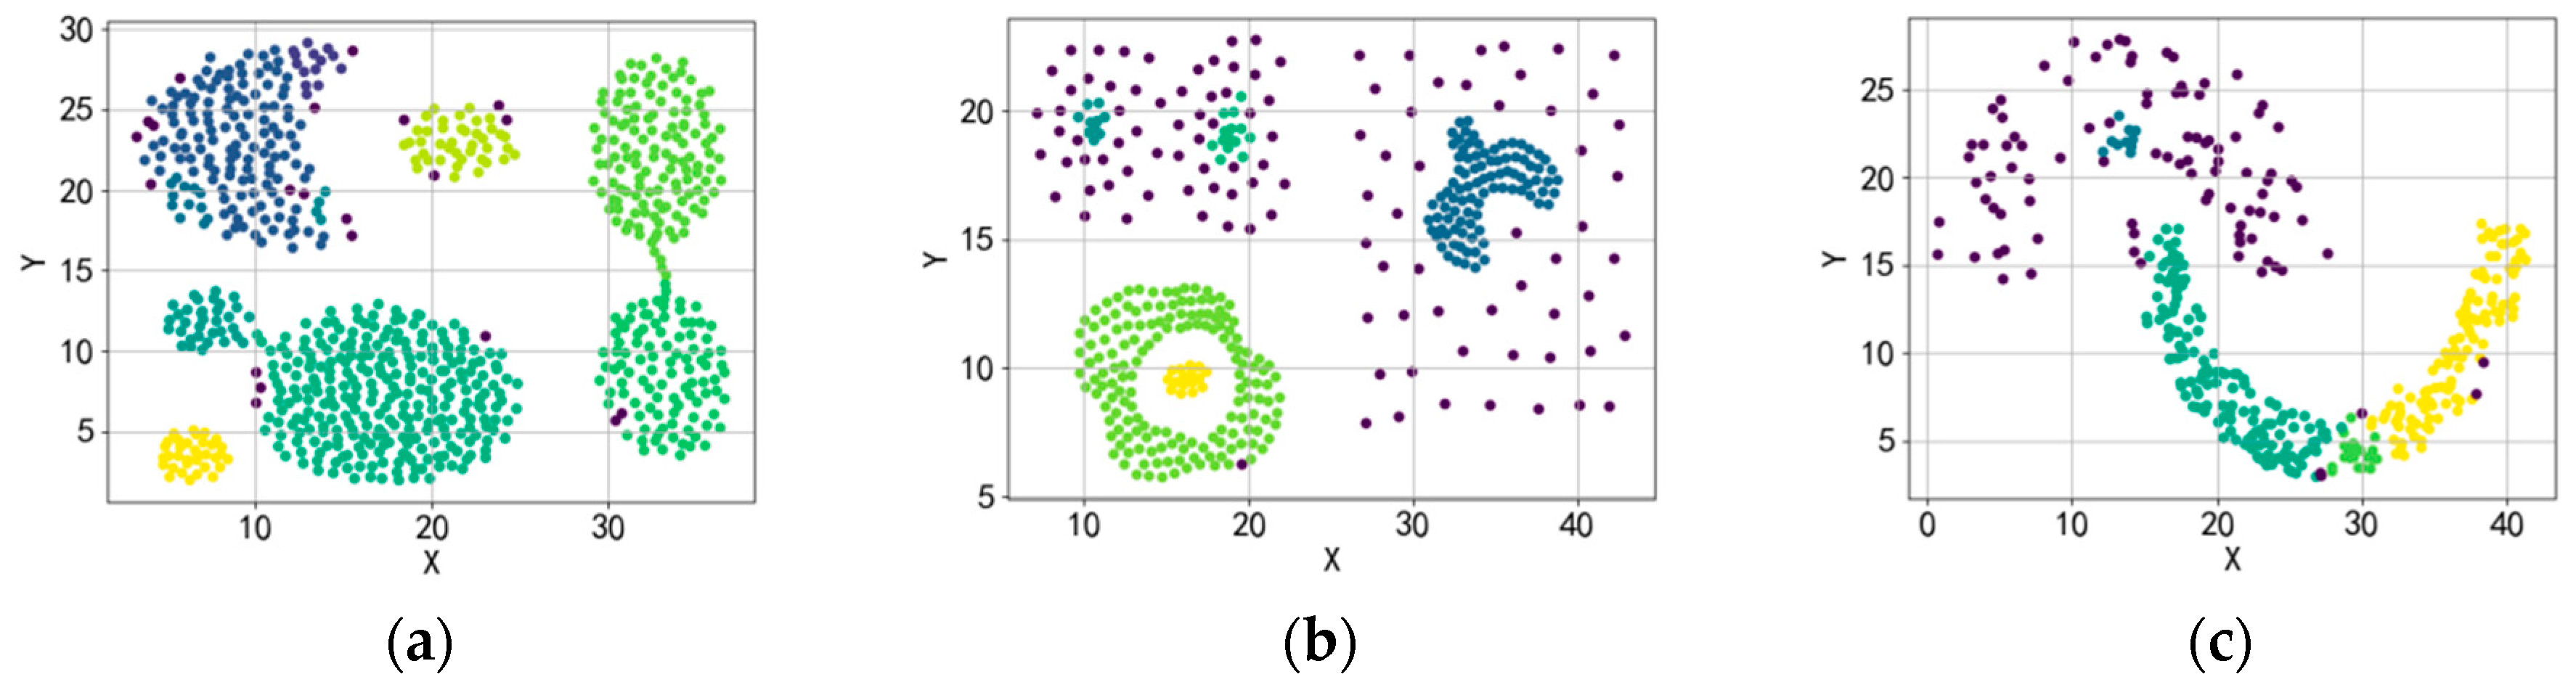
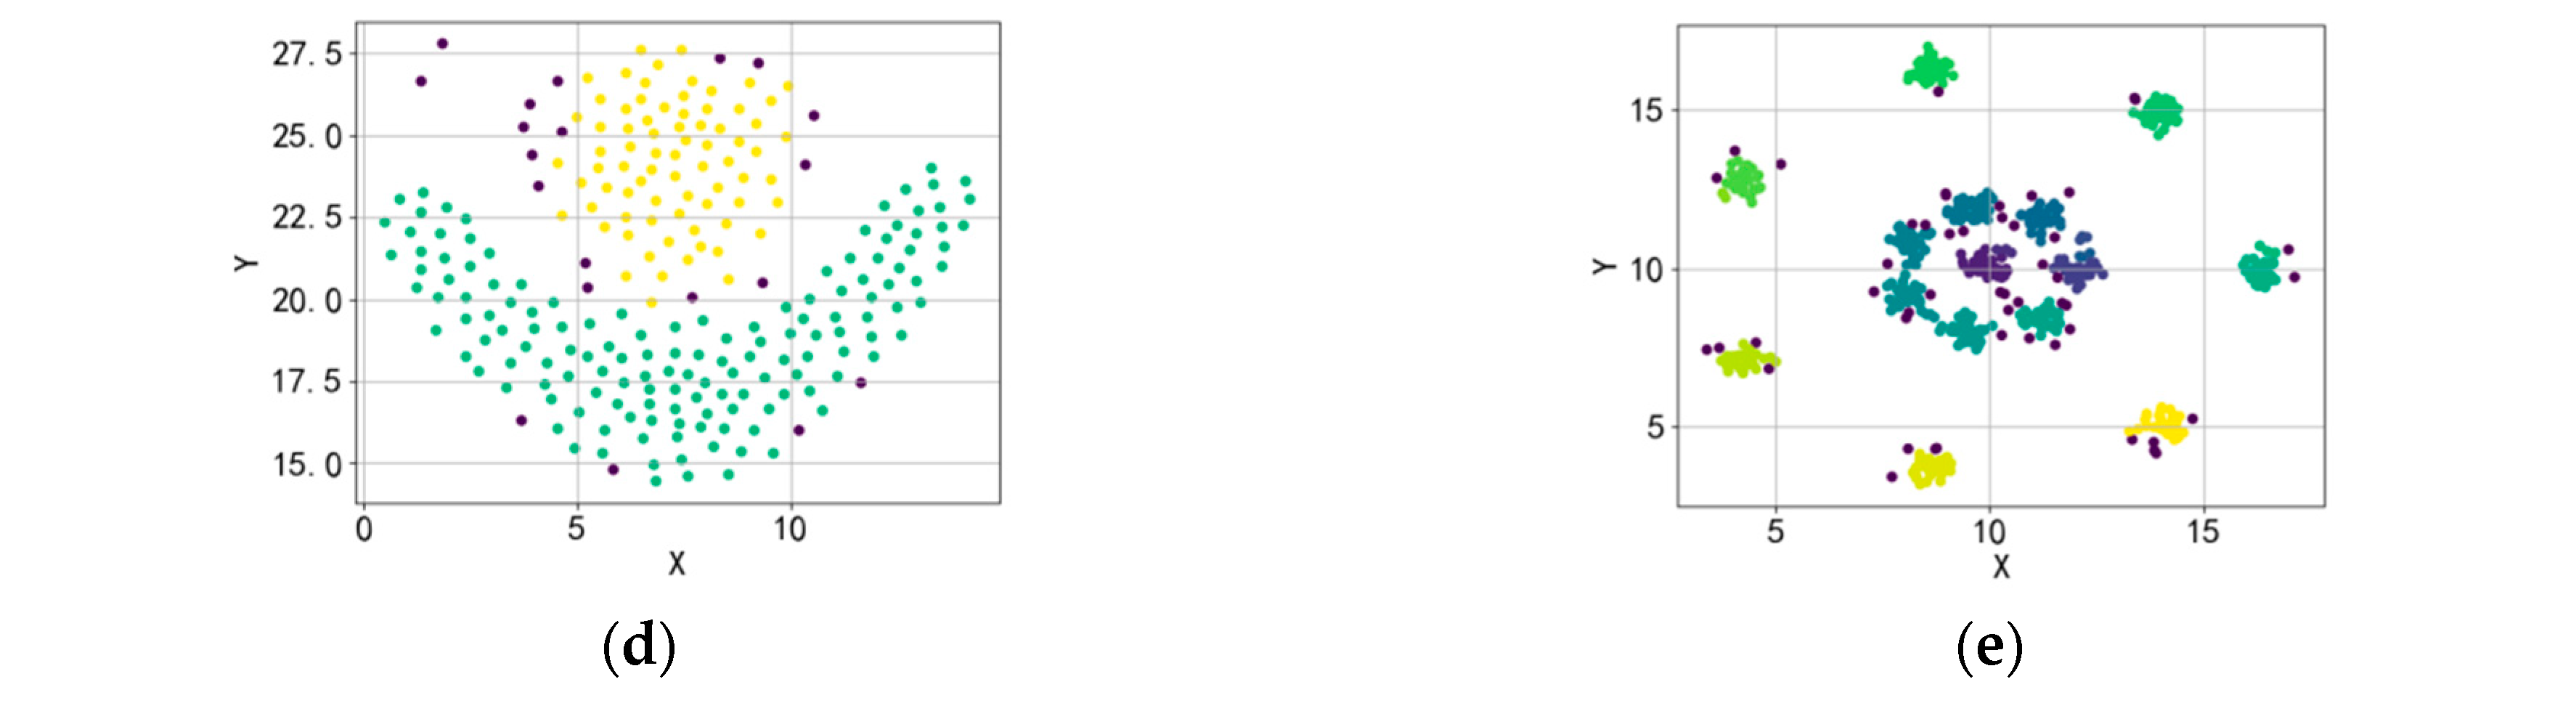
Figure 16.
Clustering effect of DBSCAN algorithm on five datasets: (a) Aggregation N = 788, C = 5; (b) Compound N = 399, C = 5; (c) Jain N = 373, C = 6; (d) Flame N = 240, C = 1; (e) R15 N = 600, C = 14.
Figure 16.
Clustering effect of DBSCAN algorithm on five datasets: (a) Aggregation N = 788, C = 5; (b) Compound N = 399, C = 5; (c) Jain N = 373, C = 6; (d) Flame N = 240, C = 1; (e) R15 N = 600, C = 14.


Table 1.
UCI real dataset.
| Dataset | Number of Objects | Dimension | Clusters |
|---|---|---|---|
| Iris | 150 | 4 | 3 |
| Wine | 178 | 13 | 3 |
| Seeds | 210 | 7 | 3 |
| Ecoli | 336 | 7 | 8 |
| Glass | 214 | 9 | 6 |
| Thyroid | 215 | 5 | 3 |
| Pima | 768 | 8 | 2 |
| Banknote | 1372 | 4 | 2 |
Table 2.
Synthetic datasets of different dimensions constructed using Gaussian distributions.
| Dataset | Number of Objects | Dimension | Clusters |
|---|---|---|---|
| X-1 | 2048 | 16 | 2 |
| X-2 | 2048 | 64 | 16 |
| X-3 | 2050 | 128 | 16 |
| X-4 | 2050 | 256 | 16 |
Table 3.
Time consumption of five algorithm on different two-dimensional datasets.
| Time(s) | Aggregation | Compound | Jain | Flame | R15 |
|---|---|---|---|---|---|
| X-DBSCAN | 86.83 | 11.91 | 4.54 | 10.09 | 26.64 |
| MDA-DBSCAN | 52.98 | 10.59 | 3.68 | 9.83 | 22.73 |
| KANN-DBSCAN | 53.59 | 8.17 | 3.51 | 7.10 | 22.67 |
| AF-DBSCAN | 4.34 | 3.65 | 2.89 | 3.41 | 3.99 |
| DBSCAN | 5.84 | 3.72 | 2.99 | 3.68 | 5.23 |
Table 4.
Evaluation index values of five algorithms on five datasets.
| Datasets | Clusters | Clustering Algorithm | Cluster Count Result | Eps | MinPts | F-Score | ACC | AMI | ARI | Time |
|---|---|---|---|---|---|---|---|---|---|---|
| Aggregation | 7 | X-DBSCAN | 7 | 2.428 | 21 | 0.9963 | 0.9962 | 0.9943 | 0.9952 | 86.83 |
| MDA-DBSCAN | 7 | 2.101 | 15 | 0.9953 | 0.9949 | 0.9912 | 0.9940 | 52.98 | ||
| KANN-DBSCAN | 7 | 2.778 | 34 | 0.9858 | 0.9848 | 0.9799 | 0.9820 | 53.59 | ||
| AF-DBSCAN | 10 | 0.941 | 3 | 0.9412 | 0.9302 | 0.9218 | 0.9261 | 4.34 | ||
| DBSCAN | 5 | 1.518 | 4 | 0.8550 | 0.7906 | 0.8858 | 0.8074 | 5.84 | ||
| Compound | 6 | X-DBSCAN | 5 | 1.551 | 10 | 0.9354 | 0.9223 | 0.8916 | 0.9135 | 11.91 |
| MDA-DBSCAN | 6 | D1 = 1.506 | D1 = 9 | 0.9498 | 0.9298 | 0.9421 | 0.9668 | 10.59 | ||
| D2 = 4.990 | D2 = 7 | |||||||||
| KANN-DBSCAN | 5 | 1.467 | 13 | 0.9137 | 0.7644 | 0.8709 | 0.8836 | 8.17 | ||
| AF-DBSCAN | 5 | 0.752 | 4 | 0.8866 | 0.7243 | 0.8463 | 0.8457 | 3.65 | ||
| DBSCAN | 5 | 1.015 | 4 | 0.9106 | 0.7594 | 0.8684 | 0.8794 | 3.72 | ||
| Jain | 2 | X-DBSCAN | 2 | 1.913 | 11 | 0.9811 | 0.7775 | 0.8851 | 0.9522 | 10.09 |
| MDA-DBSCAN | 2 | D1 = 2.429 | D1 = 15 | 0.9988 | 0.9973 | 0.9871 | 0.9971 | 9.83 | ||
| D2 = 3.739 | D2 = 10 | |||||||||
| KANN-DBSCAN | 1 | 1.646 | 12 | 0.7265 | 0.7265 | 0.8958 | 0.9443 | 7.10 | ||
| AF-DBSCAN | 4 | 1.199 | 7 | 0.6149 | 0.3968 | 0.5139 | 0.3656 | 3.41 | ||
| DBSCAN | 6 | 2.03 | 4 | 0.7655 | 0.7655 | 0.7534 | 0.9053 | 3.68 | ||
| Flame | 2 | X-DBSCAN | 2 | 1.503 | 11 | 0.9944 | 0.9917 | 0.9704 | 0.9881 | 4.54 |
| MDA-DBSCAN | 2 | 1.488 | 9 | 0.9789 | 0.9875 | 0.9079 | 0.9551 | 3.68 | ||
| KANN-DBSCAN | 2 | 1.695 | 17 | 0.9483 | 0.9583 | 0.7995 | 0.8918 | 3.51 | ||
| AF-DBSCAN | 2 | 0.901 | 5 | 0.9203 | 0.9125 | 0.7553 | 0.8408 | 2.89 | ||
| DBSCAN | 1 | 1.237 | 4 | 0.6976 | 0.6375 | 0.0164 | 0.0128 | 2.99 | ||
| R15 | 15 | X-DBSCAN | 15 | 0.701 | 24 | 0.9983 | 0.9983 | 0.9985 | 0.9982 | 26.64 |
| MDA-DBSCAN | 15 | 0.575 | 17 | 0.9913 | 0.9917 | 0.9906 | 0.9907 | 22.73 | ||
| KANN-DBSCAN | 15 | 0.760 | 33 | 0.9801 | 0.9900 | 0.9933 | 0.9887 | 22.67 | ||
| AF-DBSCAN | 20 | 0.258 | 3 | 0.8421 | 0.8432 | 0.8839 | 0.8317 | 3.99 | ||
| DBSCAN | 14 | 0.345 | 4 | 0.8875 | 0.8933 | 0.9275 | 0.8794 | 5.23 |
From the perspective of F-score and ACC evaluation index, the X-DBSCAN algorithm was better than other comparison algorithms on datasets with uniform density distribution, such as Aggregation, Flame, and R15. The X-DBSCAN algorithm and MDA-DBSCAN algorithms could better cluster various datasets. The KANN-DBSCAN algorithm had a poor clustering effect on datasets with uneven density distribution. Since the parameters of the AF-DBSCAN algorithm need to be determined subjectively, the clustering results of the dataset had large errors. Because the K-dist curve parameter K of the DBSCAN algorithm was fixed at 4 and the MinPts parameter was fixed at 4, the selected Eps parameter and MinPts parameter could not adapt to changes in different datasets; thus, the clustering effect was poor. From the two evaluation indices of AMI and ARI, the clustering results of the X-DBSCAN and MDA-DBSCAN algorithms were the most consistent with the real situation, indicating that the X-DBSCAN algorithm could effectively cluster two-dimensional artificial datasets. The MDA-DBSCAN algorithm adopts multiple clustering methods in the face of multi-density datasets; thus, the AMI and ARI evaluation indicators on the Jain and Compound datasets were higher than those of X-DBSCAN. The clustering evaluation indices of X-DBSCAN on the dataset with uniform density distribution were higher than those of MDA-DBSCAN; hence, the X-DBSCAN algorithm was better than the MDA-DBSCAN algorithm on datasets with uniform density distribution. The AMI evaluation index of KANN-DBSCAN algorithm on the Jain dataset was slightly higher than that of the X-DBSCAN algorithm, but the clustering result of the X-DBSCAN algorithm on Jain was consistent with the given number of clusters in the dataset. Combined with the accuracy of clustering results, the comprehensive evaluation of the X-DBSCAN algorithm was better than that of the KANN-DBSCAN algorithm.
Table 5.
Time consumption of five algorithms on different UCI datasets.
| Time (s) | Iris | Wine | Seed | Ecoli | Glass | Thyroid | Pima | Banknote |
|---|---|---|---|---|---|---|---|---|
| X-DBSCAN | 2.87 | 3.43 | 3.89 | 7.22 | 4.41 | 5.03 | 71.41 | 415.22 |
| MDA-DBSCAN | 2.62 | 2.86 | 3.14 | 6.49 | 3.44 | 3.38 | 45.9 | 282.24 |
| KANN-DBSCAN | 2.55 | 2.97 | 3.22 | 6.71 | 3.36 | 3.56 | 43.15 | 378.10 |
| AF-DBSCAN | 2.22 | 2.39 | 2.88 | 3.51 | 2.19 | 2.19 | 2.66 | 3.99 |
| DBSCAN | 2.35 | 2.45 | 3.05 | 3.89 | 2.98 | 2.89 | 3.88 | 6.89 |
Table 6.
Accuracy and time consumption of five algorithms on the UCI real datasets.
| Iris | Wine | Seed | Ecoli | |||||
| Clustering Algorithm | ACC | Time | ACC | Time | ACC | Time | ACC | Time |
| X-DBSCAN | 0.667 | 2.87 | 0.561 | 3.43 | 0.533 | 3.89 | 0.592 | 7.22 |
| MDA-DBSCAN | 0.320 | 2.62 | 0.354 | 2.86 | 0.509 | 3.14 | 0.408 | 6.49 |
| KANN-DBSCAN | 0.280 | 2.55 | 0.309 | 2.97 | 0.219 | 3.22 | 0.399 | 6.71 |
| AF-DBSCAN | 0.600 | 2.22 | 0.112 | 2.39 | 0.209 | 2.88 | 0.542 | 3.51 |
| DBSCAN | 0.607 | 2.35 | 0.416 | 2.45 | 0.405 | 3.05 | 0.426 | 3.89 |
| Glass | Thyroid | Pima | Banknote | |||||
| Clustering Algorithm | ACC | Time | ACC | Time | ACC | Time | ACC | Time |
| X-DBSCAN | 0.678 | 4.41 | 0.656 | 5.03 | 0.548 | 71.41 | 0.580 | 415.22 |
| MDA-DBSCAN | 0.505 | 3.44 | 0.595 | 3.38 | 0.527 | 45.90 | 0.024 | 282.24 |
| KANN-DBSCAN | 0.421 | 3.36 | 0.563 | 3.56 | 0.451 | 43.15 | 0.028 | 318.10 |
| AF-DBSCAN | 0.621 | 2.19 | 0.623 | 2.19 | 0.289 | 2.66 | 0.016 | 3.99 |
| DBSCAN | 0.481 | 2.98 | 0.648 | 2.89 | 0.639 | 3.88 | 0.546 | 6.89 |
Table 7.
Evaluation index values of X-DBSCAN on four datasets.
| Datasets | Clustering Algorithm | Cluster Count Result | Eps | MinPts | F-Score | ACC | AMI | ARI | Time |
|---|---|---|---|---|---|---|---|---|---|
| X-1 | X-DBSCAN | 2 | 93.064 | 819 | 0.9996 | 0.9996 | 0.9998 | 0.9991 | 158.35 |
| X-2 | 16 | 53.129 | 51 | 0.9990 | 0.9990 | 0.9991 | 0.9990 | 174.38 | |
| X-3 | 16 | 82.042 | 51 | 1.0 | 1.0 | 1.0 | 1.0 | 182.26 | |
| X-4 | 16 | 46.417 | 51 | 0.9980 | 0.9980 | 0.9984 | 0.9979 | 182.68 |
Disclaimer/Publisher’s Note: The statements, opinions and data contained in all publications are solely those of the individual author(s) and contributor(s) and not of MDPI and/or the editor(s). MDPI and/or the editor(s) disclaim responsibility for any injury to people or property resulting from any ideas, methods, instructions or products referred to in the content. |
© 2023 by the authors. Licensee MDPI, Basel, Switzerland. This article is an open access article distributed under the terms and conditions of the Creative Commons Attribution (CC BY) license (https://creativecommons.org/licenses/by/4.0/).
Share and Cite
MDPI and ACS Style
Yin, L.; Hu, H.; Li, K.; Zheng, G.; Qu, Y.; Chen, H. Improvement of DBSCAN Algorithm Based on K-Dist Graph for Adaptive Determining Parameters. Electronics 2023, 12, 3213. https://doi.org/10.3390/electronics12153213
AMA Style
Yin L, Hu H, Li K, Zheng G, Qu Y, Chen H. Improvement of DBSCAN Algorithm Based on K-Dist Graph for Adaptive Determining Parameters. Electronics. 2023; 12(15):3213. https://doi.org/10.3390/electronics12153213
Chicago/Turabian StyleYin, Lifeng, Hongtao Hu, Kunpeng Li, Guanghai Zheng, Yingwei Qu, and Huayue Chen. 2023. "Improvement of DBSCAN Algorithm Based on K-Dist Graph for Adaptive Determining Parameters" Electronics 12, no. 15: 3213. https://doi.org/10.3390/electronics12153213
Note that from the first issue of 2016, this journal uses article numbers instead of page numbers. See further details here.