
Machine Learning Approach towards LoRaWAN Indoor Localization

Faculty of Electrical Engineering, Mechanical Engineering and Naval Architecture in Split, University of Split, 21000 Split, Croatia
*
Author to whom correspondence should be addressed.
†
These authors contributed equally to this work.
Electronics 2023, 12(2), 457; https://doi.org/10.3390/electronics12020457
Submission received: 9 December 2022
/
Revised: 5 January 2023
/
Accepted: 12 January 2023
/
Published: 16 January 2023
(This article belongs to the Special Issue Machine Learning Based Ubiquitous Localization, Indoor Positioning and Location Based Services)
Abstract
:The growth of the Internet of Things (IoT) continues to be rapid, making it an essential part of information technology. As a result, IoT devices must be able to handle data collection, machine-to-machine (M2M) communication, and preprocessing of data, while also considering cost, processing power, and energy consumption. This paper introduces a system for device indoor localization that uses variations in the strength of the wireless signal. The proposed system addresses logistics use cases in which it is imperative to achieve reliable end-to-end delivery, such as pharmaceutic delivery, delivery of confidential documents and court exhibits, and even food, since the same is introduced into human organism and presents a potential risk of terrorist or other attack. This work proposes a concept based on low-power and low-cost LoRaWAN based system that utilizes a Machine Learning technique based on Neural Networks to achieve high accuracy in device indoor localization by measuring the signal strength of a beacon device. Furthermore, using signal strength measurements, that is, RSSI and SNR captured by LoRaWAN gateways, it is possible to estimate the location of the device point with an accuracy of up to 98.8%.
1. Introduction
The use of IoT systems and connected devices is rapidly increasing, leading to a greater need for efficient data management and communication [1,2]. These systems often utilize wireless technologies like WiFi, Bluetooth, or ZigBee for short-distance communication and low-power wide area network technology like LoRa [3], SigFox [4], or NB-IoT [5,6] for longer-distance communication with low data rates. This creates opportunities for innovative solutions that can minimize power consumption and reduce the cost of battery-operated devices, such as indoor positioning systems and machine learning-based sensing devices. The data collected from these devices can have a significant impact on the market, serving as a tool for big data research, indoor tracking [7], and localization, or as a means of delivering targeted services based on location or other user-specific data.
Improving the localization accuracy of Internet of Things (IoT) devices is a major research focus in industries, particularly in hazardous and hard-to-reach worksites with diverse environments [8,9]. Existing solutions for indoor (e.g., Wi-Fi, Bluetooth Low Energy, ultra-wideband) and outdoor (e.g., global navigation satellite system) localization are not suitable for these situations, as they are primarily designed for one environment [10,11].
Research has explored the use of WiFi-based localization and positioning techniques that utilize the combination of Time of Arrival (ToA) and Angle of Arrival (AoA) to achieve precision within 1 m [12]. These techniques have been shown to be effective in a number of applications, including the use of Recurrent Neural Networks (RNNs) and Long Short Term Memory (LSTM) models to predict device location [13]. In some cases, these models have been able to achieve up to 99.7% accuracy in predicting the floor on which a device is located, with distance errors in the 2.5–2.7 m range.
Recently, LoRaWAN technology has appeared promising as a low-energy consumption solution, which is important for wearable devices. Compared to WiFi, it is more stable in indoor environments due to its better penetration ability. While Global Navigation Satellite Systems (GNSS) and WiFi are not the best choice for outdoor or indoor environments from a power perspective, respectively, LoRaWAN presents a cost-effective solution for large worksites such as construction sites due to the low cost of the module and the ability to easily scale the infrastructure. Hence, it is believed that LoRaWAN due to its low-cost and low-power nature has the potential for indoor localization. The use of low power wide area networks (LPWANs) such as LoRa has enabled researchers to investigate the correlation between radio signal strength (RSSI) and soil moisture [14,15]. By using machine learning techniques, such as neural networks, it has been possible to use RSSI signals from LoRa and LoRaWAN devices for fingerprint-based localization. These techniques have shown promise in a number of applications, and are likely to be further developed in the future [16].
This paper presents a system for indoor device localization that uses variations in wireless signal strength of LoRaWAN device. The system is designed to address a range of logistics use cases where reliable end-to-end delivery is critical, such as pharmaceutical delivery, food delivery, and the delivery of confidential documents and court exhibits. To achieve accurate indoor device localization, the system employs existing technologies, as depicted in Figure 1. Because signal strength and distance are closely related, machine learning techniques, such as Neural Networks (NN), can be used to detect and estimate device position based on changes in signal strength with a low error rate. This allows the indoor positioning problem to be solved through software, resulting in a cost-effective sensing device that can be used as a simple beacon (without any sensors). To achieve positioning, the device sends a beacon message over the LoRaWAN channel to a centralized system via multiple gateways. By collecting LoRaWAN information from multiple surrounding gateways (RSSI, SNR, and GW ID), it is possible to estimate the device’s location with an accuracy of up to 99%.
The paper is organized as follows: Related work is introduced in Section 2, while Section 3 gives the basics of LoRaWAN message transmission in IoT devices, description of experimental setup and preliminary data analysis of the collected data. Section 4 introduces Machine Learning algorithms and models as well as evaluation techniques. The results are given in Section 5, which is followed by a discussion in Section 6. Finally, we conclude in Section 7.
2. Related Work
Localization systems using technologies such as WiFi [17,18,19,20], Bluetooth Low Energy (BLE) [21,22,23] and cellular networks can achieve sub-meter level accuracy [24,25]. However, these technologies are not suitable for low power and long range communications in IoT applications. In recent years, there has been a growing interest in using LPWAN technologies for both low power and long range communications and localization. Some approaches have achieved good results, such as a multi-band backscatter system that can achieve subcentimeter accuracy with specialized devices [26,27,28], or an amplitude-based anti-multipath method using a LoRaWAN radio signal that achieves 4.6 m accuracy indoors with specially designed antennas [29]. However, these approaches are not compatible with legacy devices or suitable for conventional stationary gateway deployment.
There is less published research on the use of LoRaWAN for indoor localization compared to outdoor localization. This may be due to the fact that one of the main benefits of LoRaWAN is its long range coverage, which is more relevant for outdoor environments. The original intention behind the technology was to use fewer gateways to cover large areas. However, for indoor localization, it is necessary to use multiple gateways in smaller spaces, which goes against this advantage. Despite this, some researchers believe that LoRaWAN has the potential for indoor localization and are actively studying this field, with promising results.
A study [30] compared several technologies for indoor localization, including WiFi, BLE, ZigBee, and LoRaWAN. The experiment used three gateways and one measurement point, and employed trilateration as the localization method. The results showed that LoRaWAN had a mean error of 2.7 m for a distance of 5 m between gateways, which was slightly better than the other technologies.
The work [31] investigated LoRaWAN-based localization for both indoor and outdoor environments, using RSSI fingerprinting (metric: Euclidean distance). The best-reported accuracy for the indoor environment is 4.55 m.
In [32], Zhu et al. presented results showing a mean localization error of less than 10 m for an open indoor space of 50 × 100 m2, using a fingerprinting map based on extreme RSSI and a Boundary Autocorrelation method for comparing online data to stored data.
Another recent study [33] reviewed the use of LoRaWAN for smart home localization and reported a precision of 1.6 m in the case of a Line-of-Sight and a precision of 3.1 m in the case of a non-Line-of-Sight.
The work [34] describes a system for monitoring the position and movement of elderly people, both indoors and outdoors, using a wearable device with a motion sensor and two types of localization engines: one based on global navigation satellite systems (GNSS) for outdoor use, and one based on ultra-wideband technology (UWB) for indoor use. The system has been shown to provide sub-meter indoor localization error and communication latencies of a few seconds, and uses UWB localization in combination with a LoRaWAN infrastructure for elderly assistance.
In [35], a filter-based technique on the log-normal shadowing model combined with a neural network is used to predict unknown positions. The proposed method uses indoor location estimation using the RSSI technique and achieves an average distance error of 0.5971 m.
Another recent study introduced Seirios [36], aimed at increasing the localization accuracy of IoT devices connected by LoRaWAN. Seirios uses a novel algorithm to synchronize multiple non-overlapping communication channels and exploit the unique features of the radio physical layer to increase the overall bandwidth, allowing it to resolve the direct path from multiple reflectors in both indoor and outdoor environments. The Seirios prototype is tested in outdoor and indoor environments and found to have a median error of 4.4 m outdoors and 2.4 m indoors.
A LoRa localization system called OwLL was introduced, which is able to achieve a few meters of location error with commodity LoRa clients [37]. The system uses a distributed base station network made up of low-cost components that together provide a wide bandwidth covering TV whitespaces and high aperture. The proposed system achieved a median error of 9 m in localization.
In [38], ILLOC is proposed that uses cross-correlation between differential phase sequences received by two anchors to estimate TDoA and just-in-time synchronization using a special end device that provides a time reference when it detects a transmission from the target device. In a long corridor, a sports hall, and an indoor plaza, ILLOC achieved median localization errors of 6 m (with 2 anchors), 8.36 m (with 6 anchors), and 15.16 m (with 6 anchors and frame fusion).
In recent work [39], the feasibility of using LoRaWAN for localization in industrial settings through measurement campaigns conducted in indoor and outdoor environments at two universities was investigated. The results show that LoRaWAN-based localization employed with ML techniques can achieve meter-level accuracy using a relatively dense deployment of gateways.
3. Research Methodology
In this section, the basic concepts that build the transmission of LoRa messages are described, along with LoRaWAN [40], as a network protocol that utilizes the LoRa radio communication technique. The implementation details of the end device are further introduced along with the data analysis of the collected data.
3.1. LoRa/LoRaWAN Message Transmission
3.1.1. LoRa
LoRa uses Chirp Spread Spectrum (CSS) modulation [41] for the transmission of messages from the end node to the gateway. It is a spread-spectrum technique in which the signal is spread across different frequency domains. LoRa modem uses the Coding Rate (CR) to protect against bursts of interference. For example, in LoRaWAN CR is 4/5 during LoRa radio transmission, while the header part of the packet holds CR equal to 4/8. The ability to provide long-distance communication depends on CSS technology and the non-licensed transmission frequency range below 1 GHz. (e.g., 863 to 879 MHz for Europe). The parameters required for up- and down-link communication between LoRa modules and gateways, such as spread factor (SF) and bandwidth (BW), are defined for each frequency.
3.1.2. LoRaWAN
LoRaWAN is a Medium Access Control (MAC) protocol designed for low-power, wide-area network systems. It was first introduced in 2015, with a new specification released in 2017. LoRaWAN uses an unlicensed ISM frequency spectrum, which varies depending on the region, and offers low data rates.
The duty cycle defines the maximum percentage of time within which can a particular channel can be utilized. After data transmission, the device waits until the predefined time period expires for the next transmission. The duty cycle is used to establish fair channel utilization, inside which every device will have an opportunity to send a data packet with a high probability of success without a collision.
3.1.3. LoRaWAN Architecture
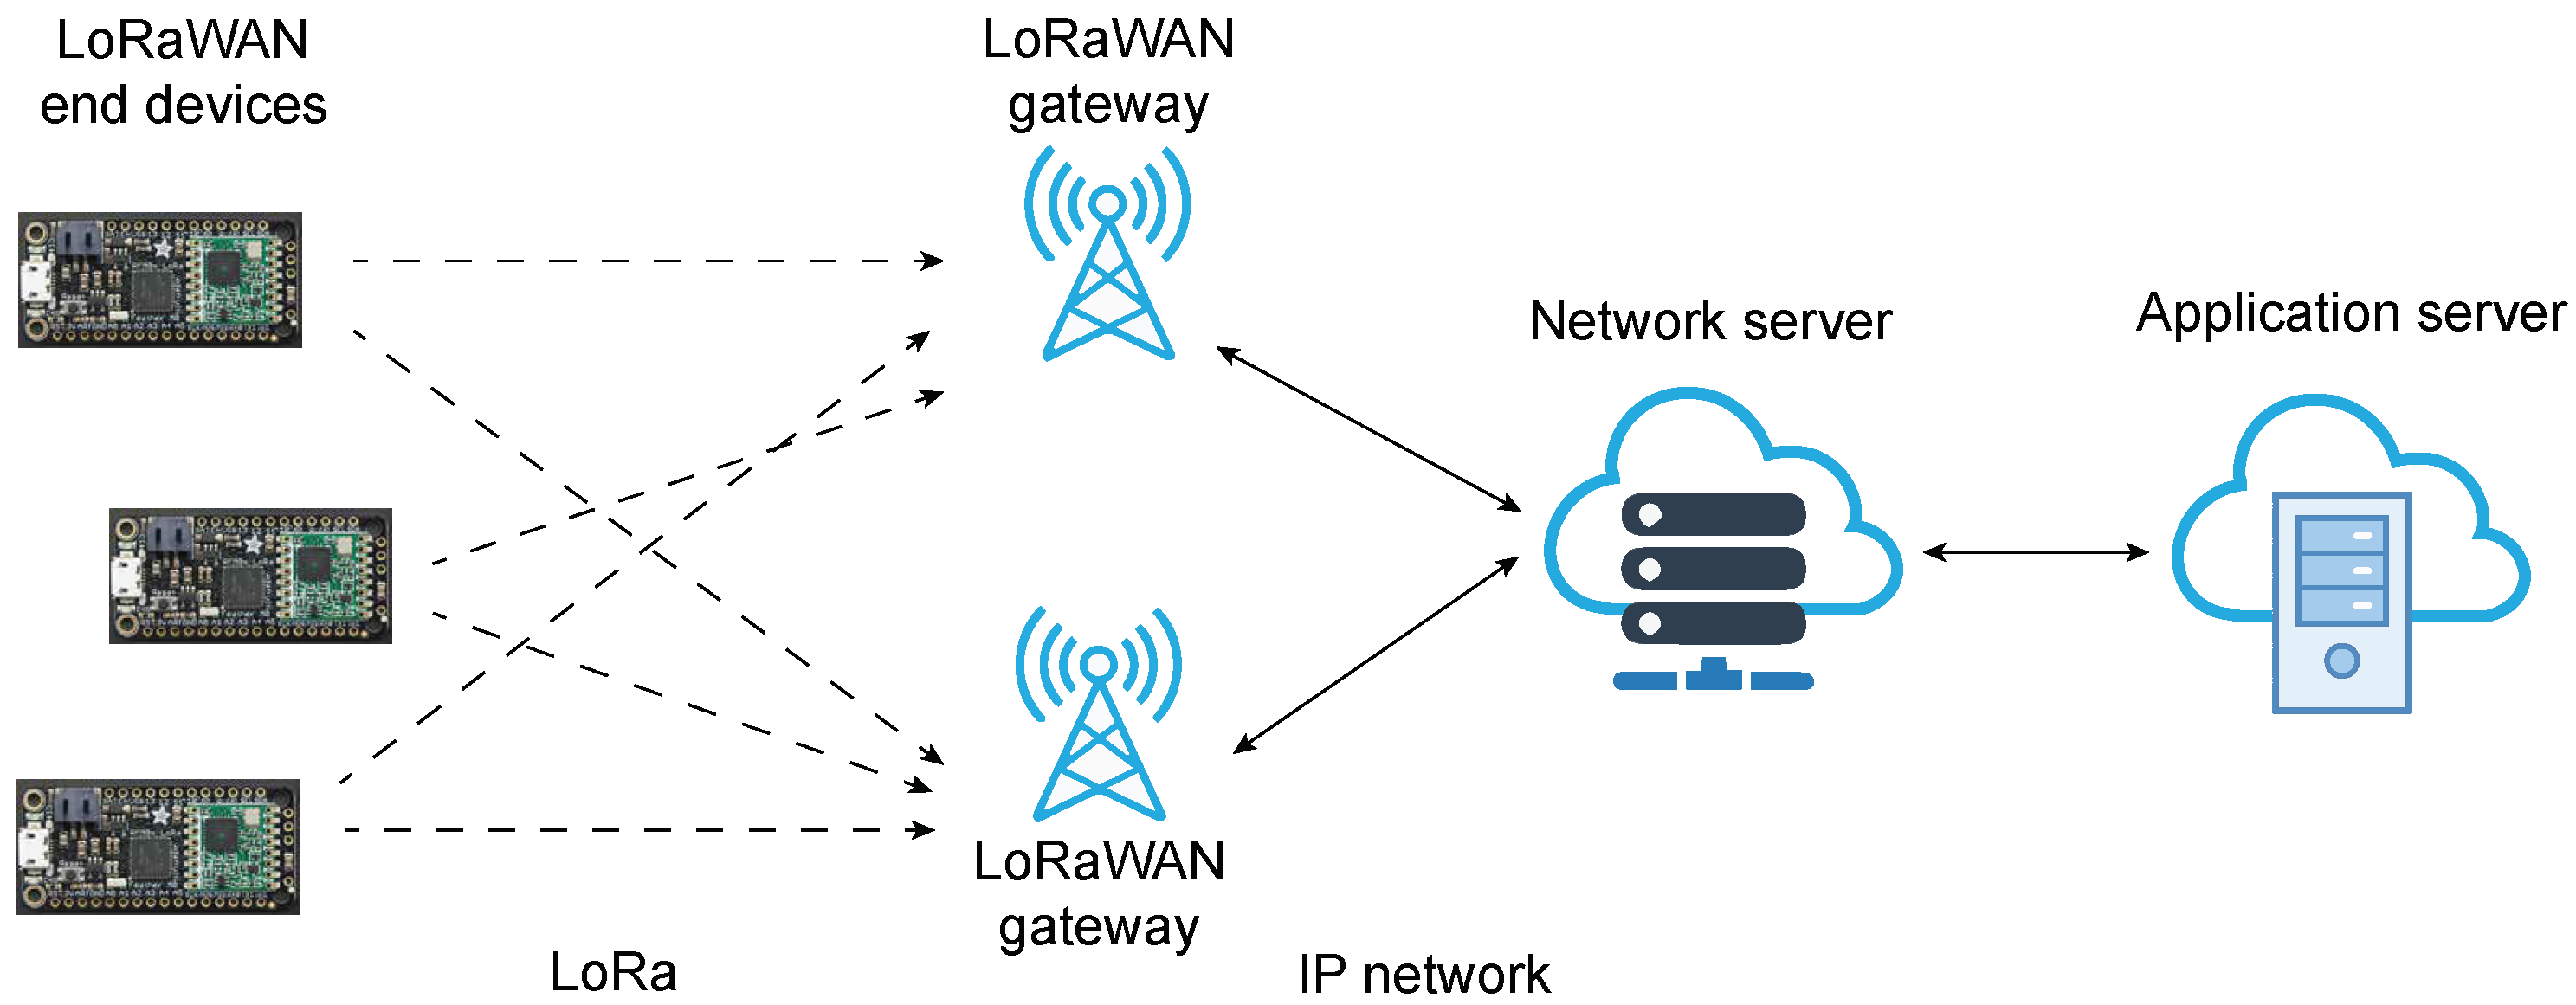
The LoRaWAN protocol uses a star network topology (Figure 2), with three main components: LoRa modules (end nodes), a single or multiple LoRa gateways, and a central network server. The gateway forwards packets between the LoRa module and the central server, which then processes the packets and relays them to the application server for further use.
3.1.4. End Devices
LoRaWAN end nodes can be divided into three classes: Class A, Class B, and Class C [42]. Class A devices are designed to minimize battery consumption and only send information to the gateway device when events occur. Class B devices are time-synchronized and communicate within a specific time interval. Class C devices are always active and intended for immediate message reception from gateways.
3.2. Experimental Setup
This paper employs the technology of Low Power Wide Area Networks (LPWAN), specifically LoRa, to transmit data from devices to the base station (Figure 2). LPWANs like LoRaWAN enable battery-powered sensors or devices to transmit low-throughput data over long distances with minimal infrastructure deployment [14]. LoRaWAN’s network architecture typically has a star-of-stars topology, as shown in Figure 2. The end devices, which are designed for specific applications, are connected to one or more gateway or base station devices. These devices are directly connected to the network server and application, and act as a transparent relay between the end devices and the network server. The network server can then forward the information to the appropriate application servers for processing. Table 1 shows the hardware and software used in this paper. Three gateways are based on Raspberry Pi and equipped with an iC880 A LoRaWAN concentrator, while two are also based on Raspberry Pi and have a RAK31 concentrator. An 868 MHz omni-directional fiberglass antenna with 10 dBi gain was used for three gateways, while a CXL 900-6LW 868 MHz omni-directional antenna with 8 dBi gain was used for other two gateways. The installed gateways are public LoRaWAN gateways connected to The Things Network and were installed to connect multiple LoRaWAN sensor devices. The machine used for machine learning experiments had the following specifications: an Intel Core i7-7700HQ processor at 2.80 GHz, 16 GB of RAM, an NVIDIA GeForce GTX 1050 graphics card, and a 64-bit Windows 10 operating system. The NVIDIA CUDA library (cuDNN) was used to improve GPU performance, and the Keras 2.3.1 Python library, built on Tensorflow 2.2.0 with CUDA GPU support, was used to perform experiments with different batch sizes.
3.3. Realization of LoRaWAN-Based Device
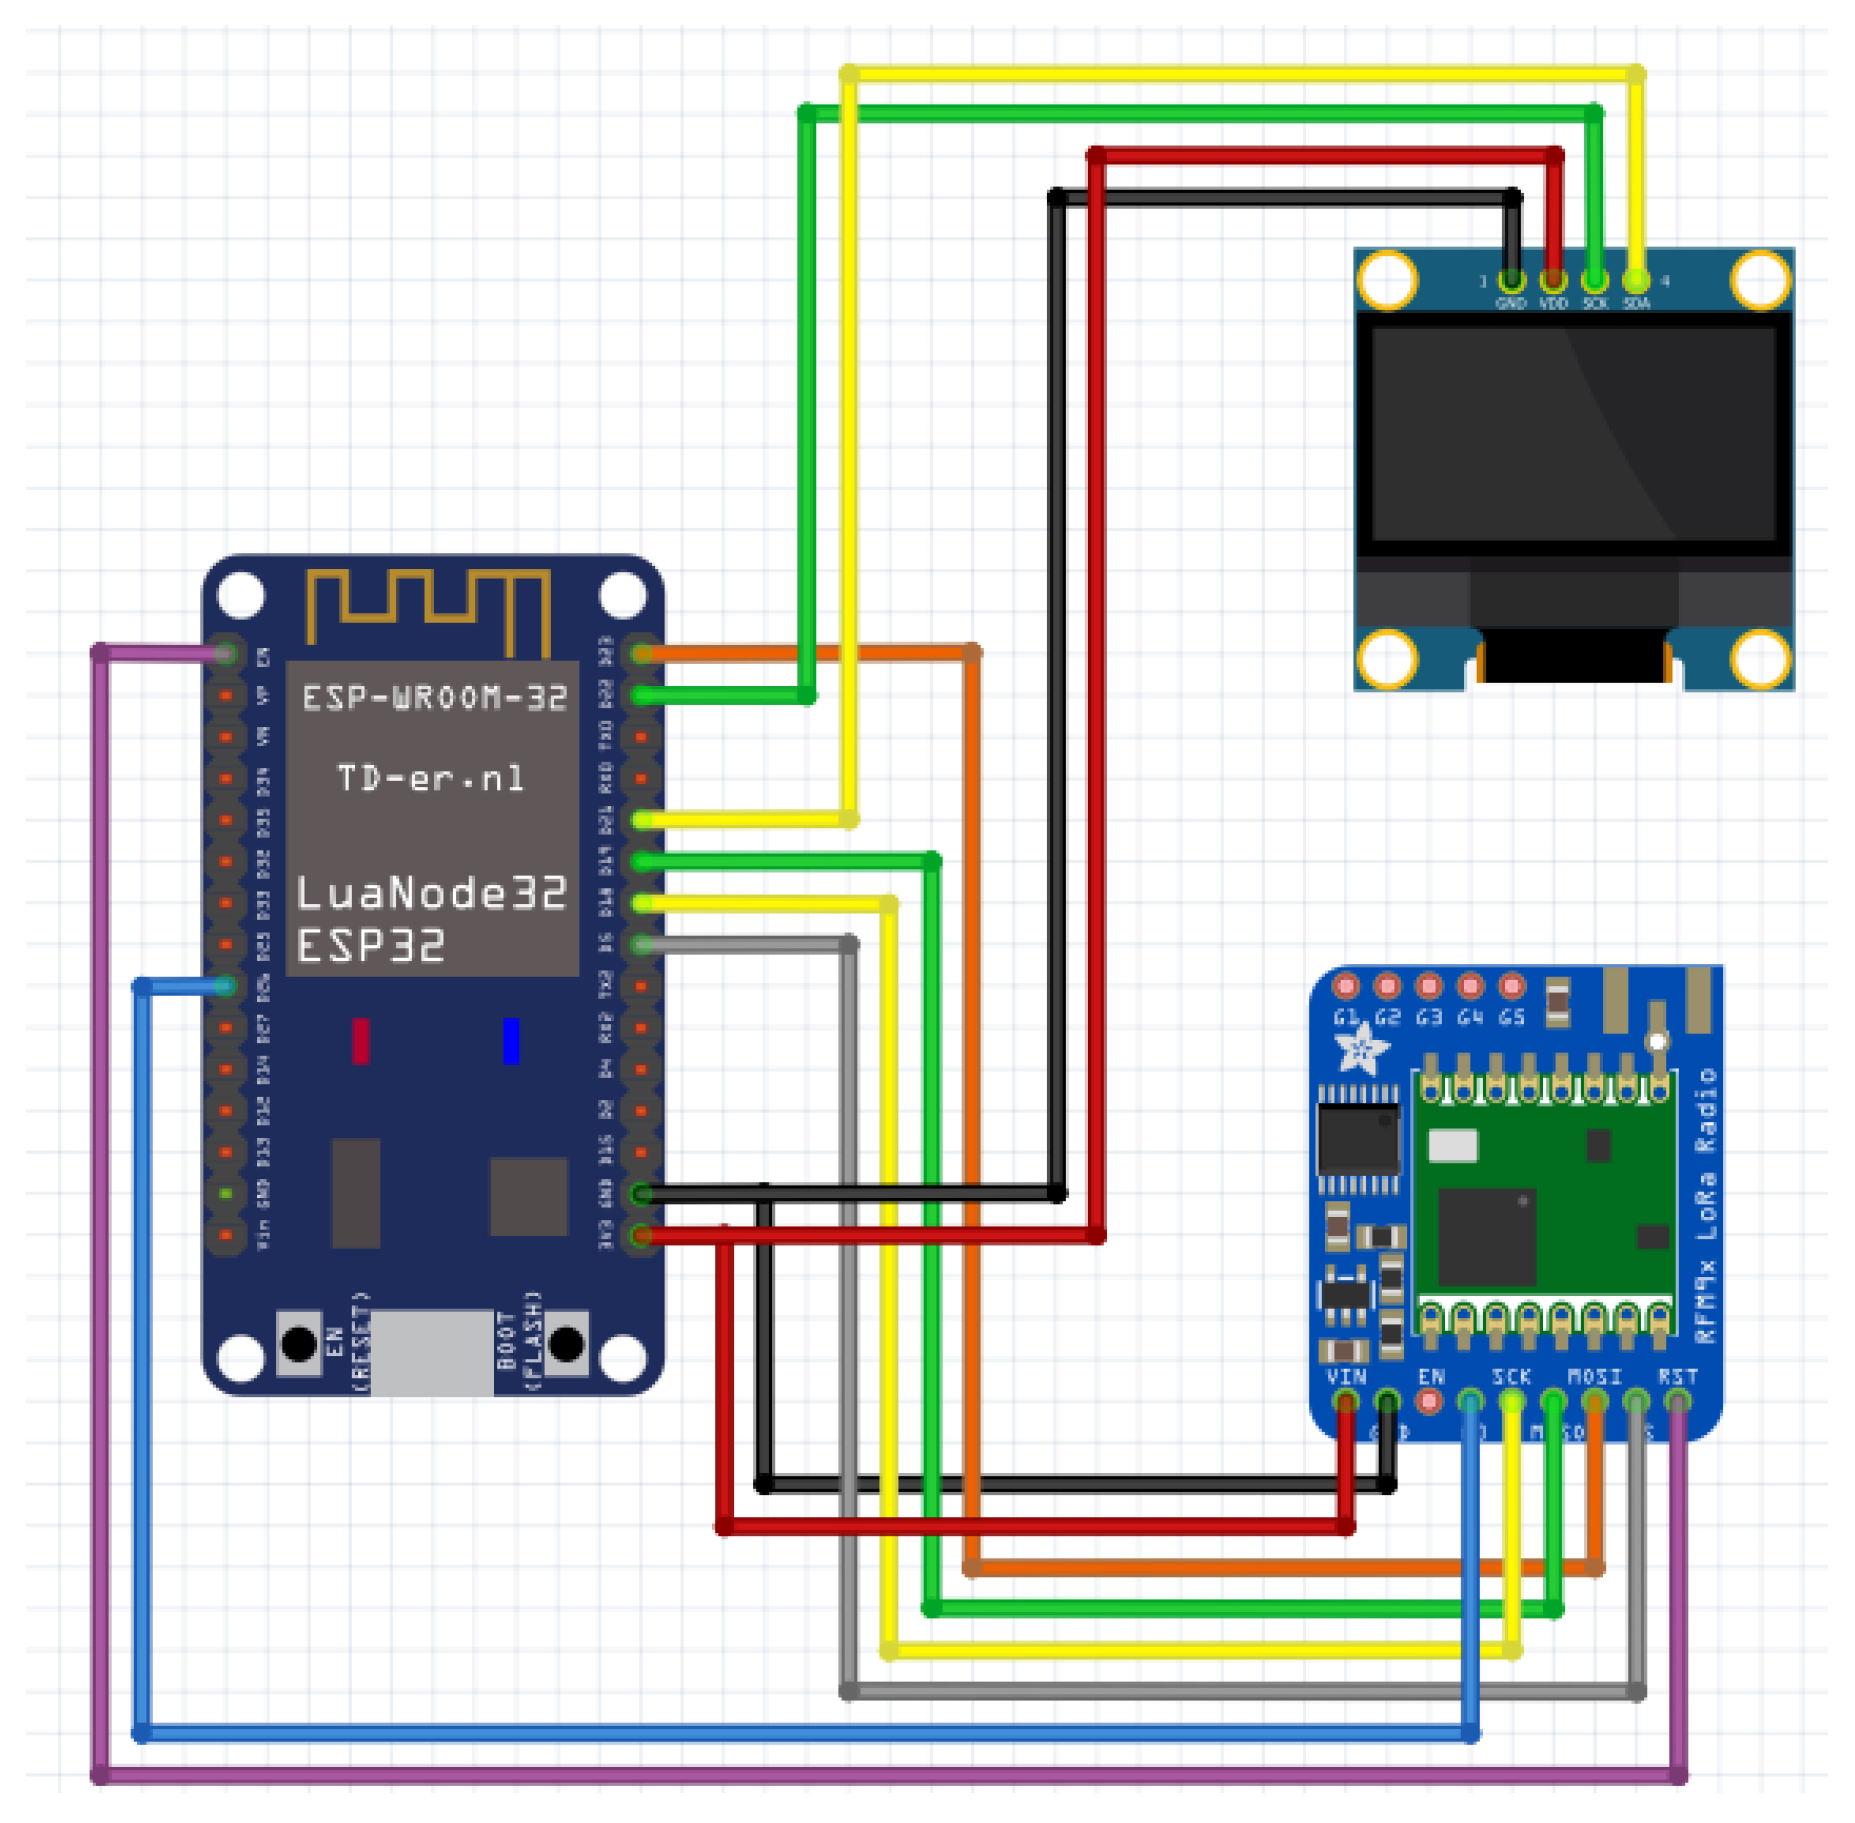
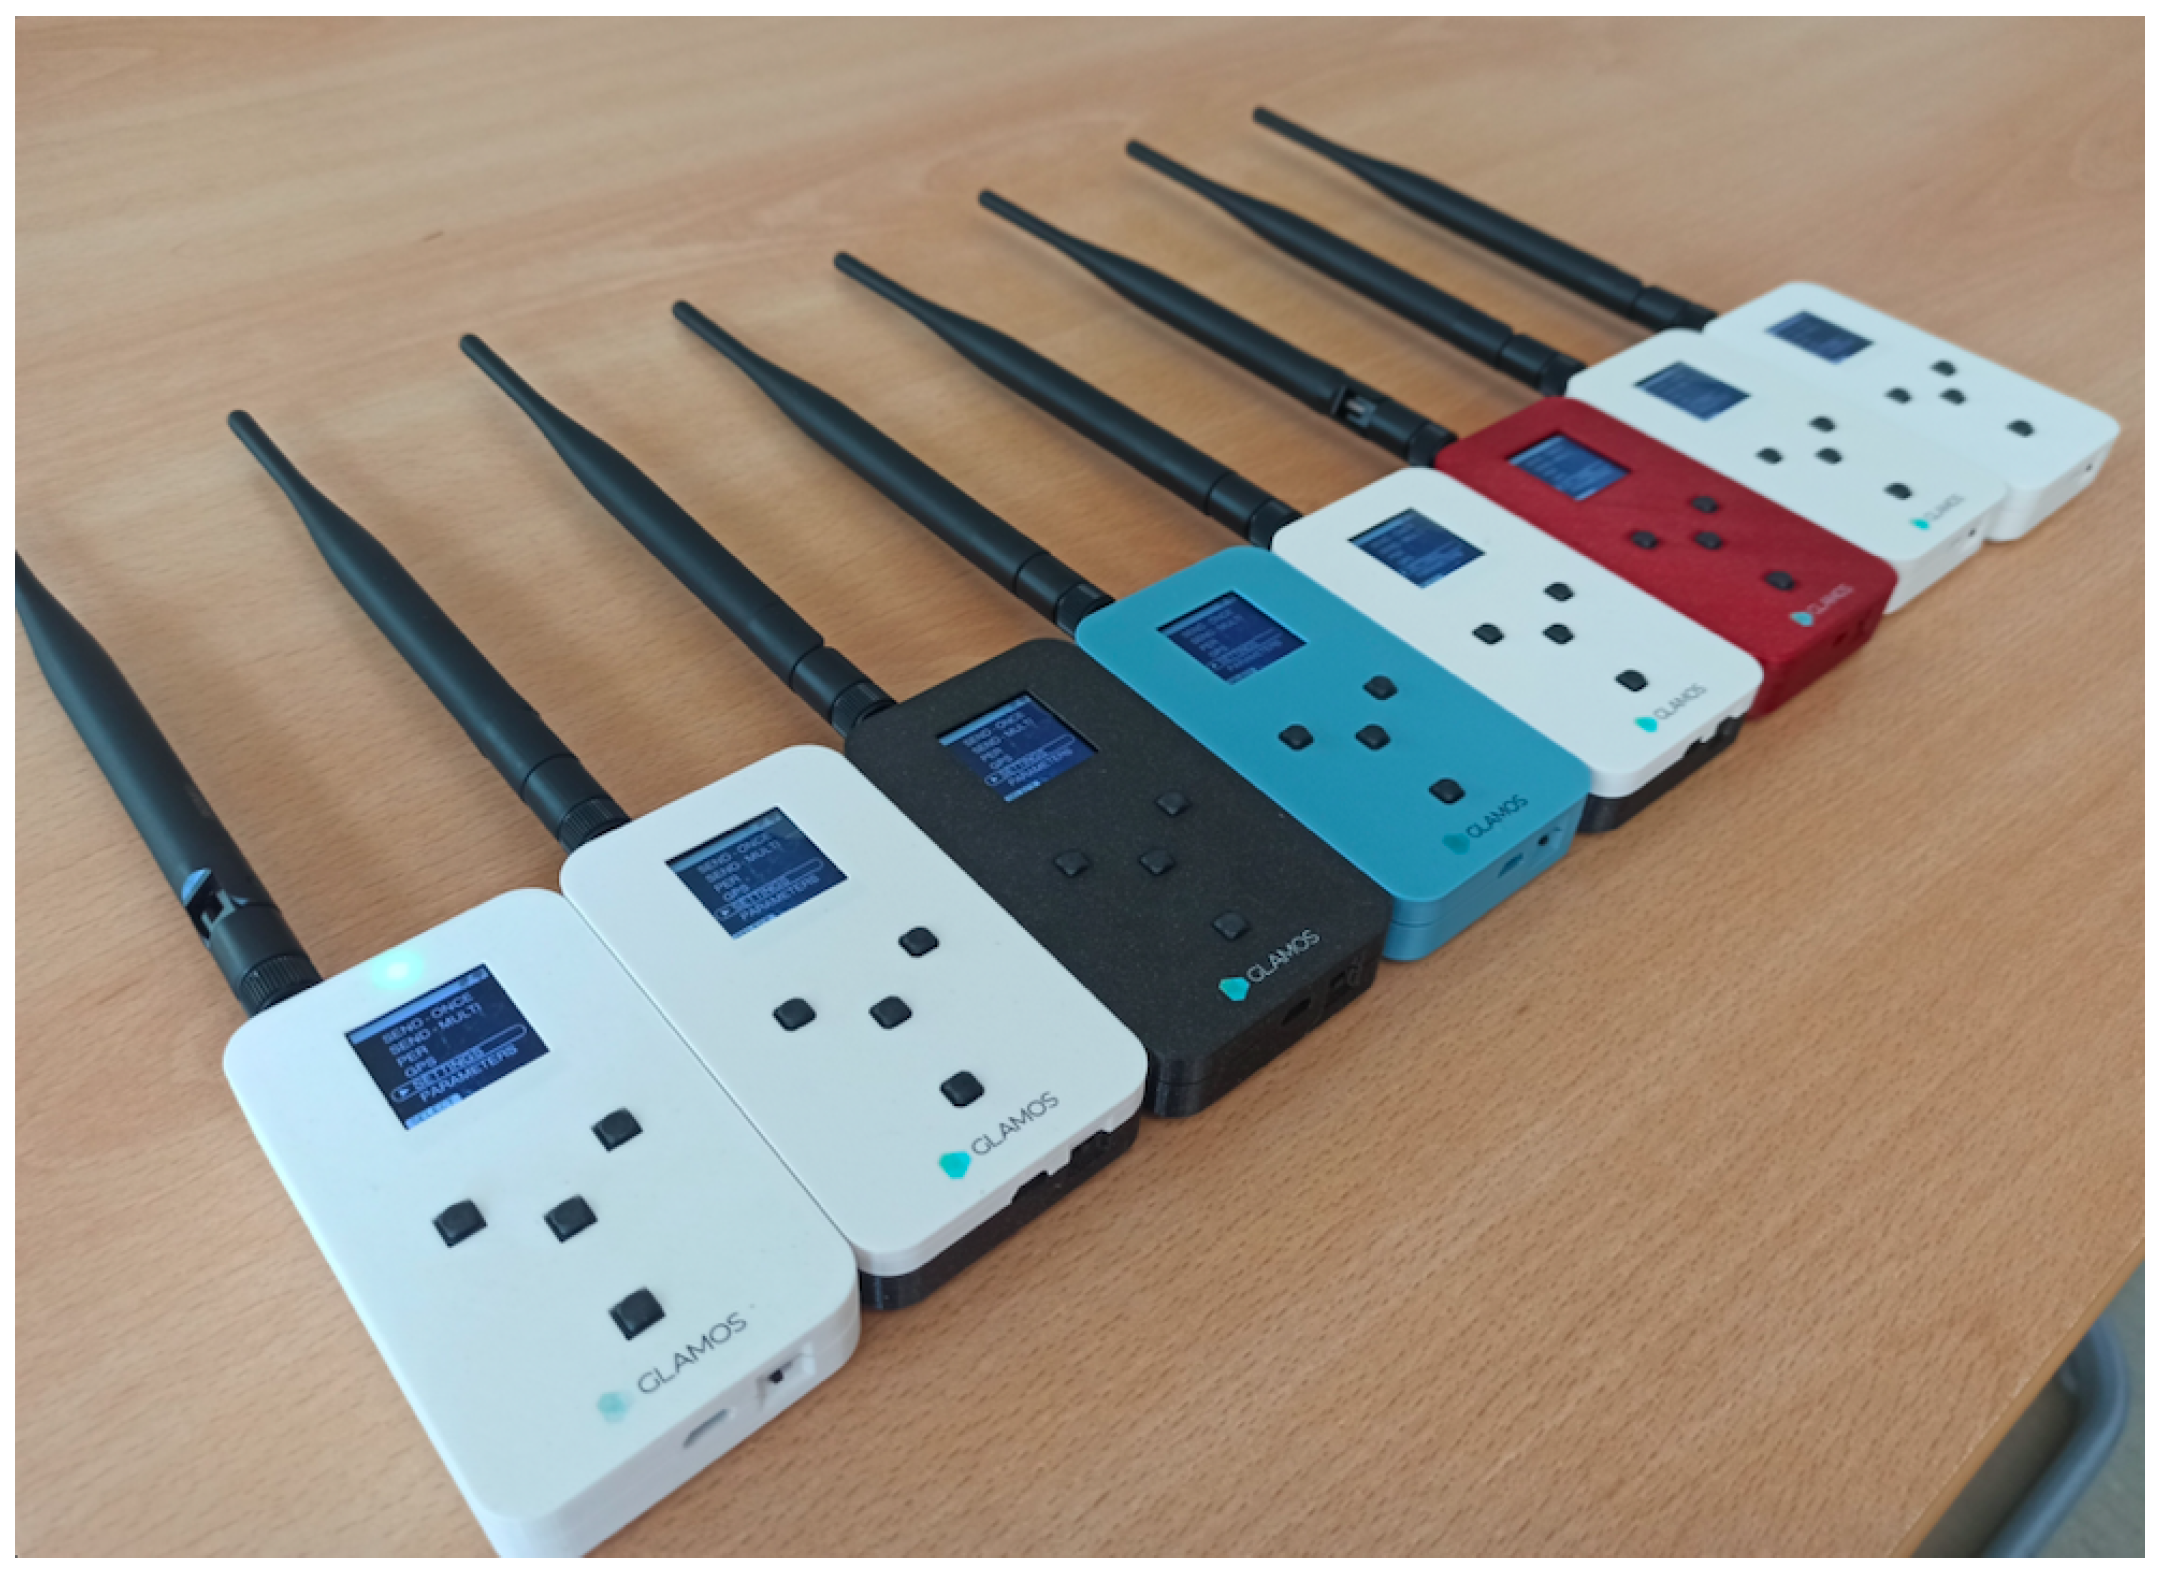
The core of the sensor device is the Espressif Systems ESP32 microcontroller with built-in WiFi and Bluetooth modules, as shown in Figure 3. To enable LoRaWAN-based communication, the RFM95W module with the SX1276 chip and the SMA male antenna with gain of 7.5 dBi was used. To achieve high accuracy in localization estimation, six LoRaWAN gateways were placed near the device (within 200 m). LoRaWAN gateways are indoor gateways configured to forward messages to The Things Network (TTN) cloud infrastructure. Figure 4 shows the final implementation of the ESP32-based LoRaWAN device with a screen and push buttons to control and send parameters. As can be seen, overall, 8 devices with the same hardware setup were used for transmission on the LoRaWAN channel, while each device was placed at three locations during information collection. Figure 5 shows all the positions in the University building where devices have been placed to collect WiFi scan information, a total of 24 locations where LoRaWAN signal strength (RSSI, SNR and GW ID) information was collected. As can be seen, these devices were placed in 6 rooms positioned on the same floor, in 4 locations in each room, so that 3 rooms were in the same sector of the building. The idea of the indoor localization was to check whether the proposed ML model can determine the position of the device in the exact location, in the room or in the building sector.
3.4. Data Analyses
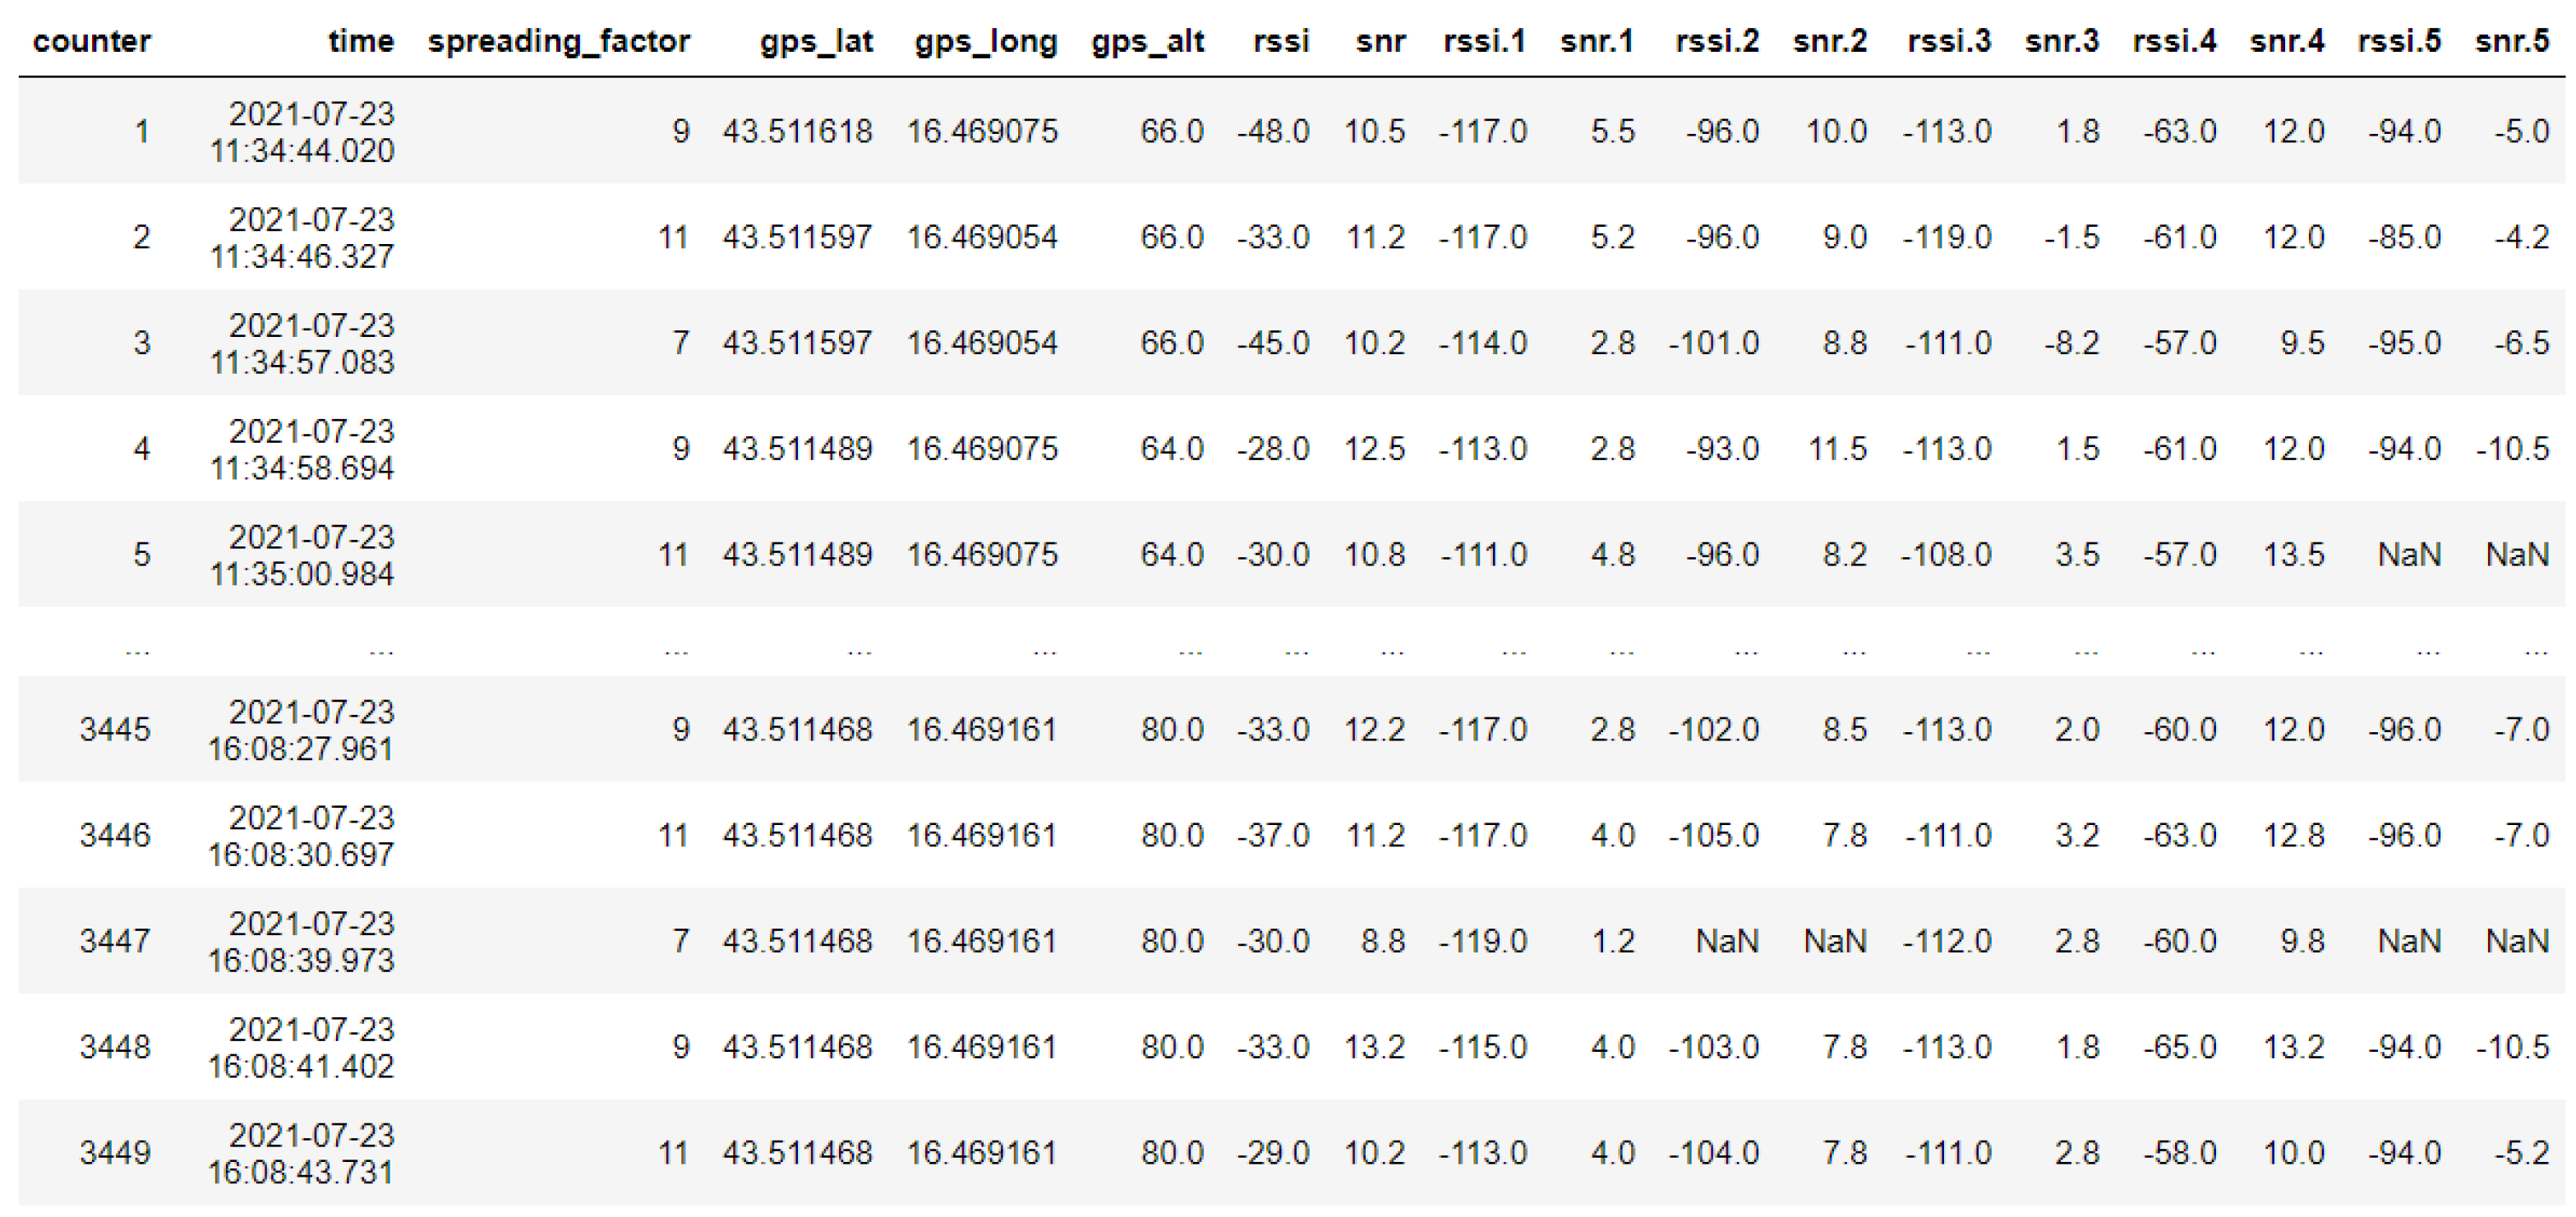
From the experiment measurements for each of the 24 location points depicted in Figure 5. Altogether, more than 90,000 data measurements were collected for the LoRa (around 1200 for every location and every SF—SF7, SF9, and SF11). Due to the specific properties of both LoRa and WiFi, data analyzes were carried out for each Lora location point. Each Lora measurement at a particular location point contains information about time, spreading factor, and Received Signal Strength Indicator (RSSI) along with Signal-to-Noise Ratio (SNR) for each of the six previously mentioned gateways, as presented in Figure 6.
LoRa Data Analyses
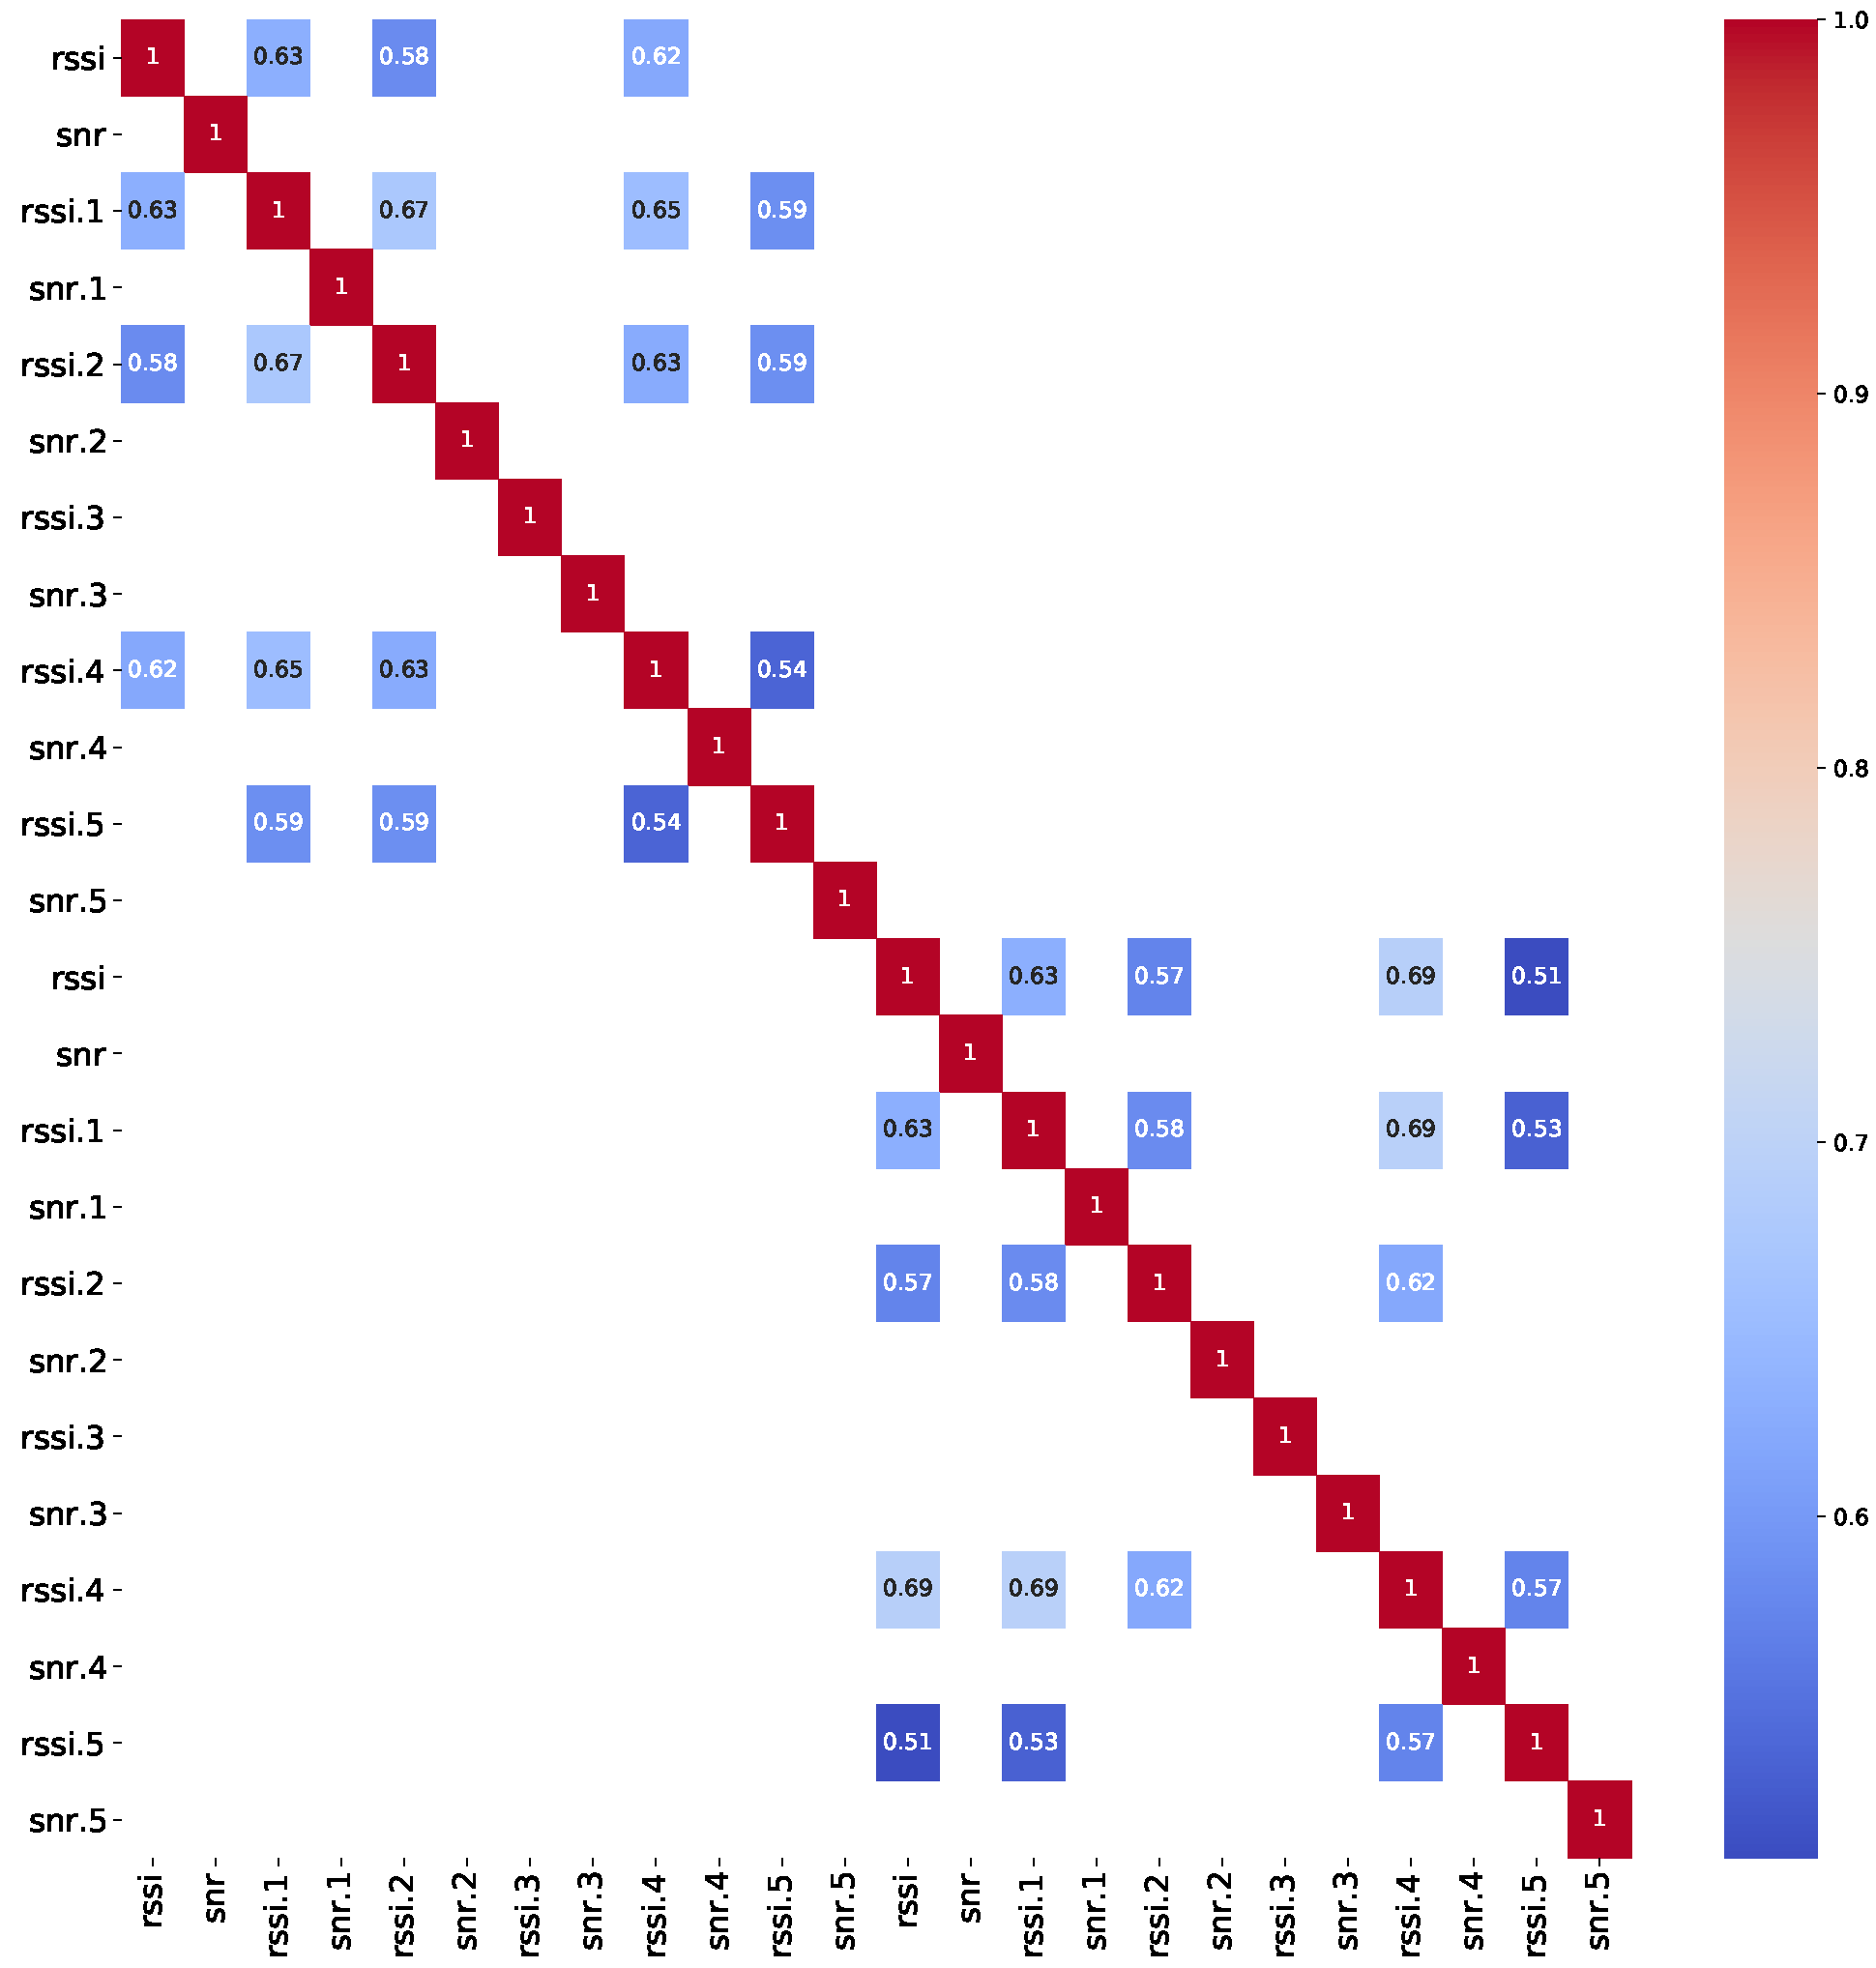
Within the experiment, three different SF factors for LoRa were examined, namely Sf and 11. A fundamental property of the LoRa modulation spreading factors is their orthogonality. Therefore, a signal that is modulated with one spreading factor and transmitted on a certain frequency channel and time does not interfere with other signals modulated with different spreading transmitted on the same frequency channel at the same time. Therefore, data analyses for each spreading factor for each localization point were done separately to examine RSSI behavior among different points with the same SF factor. To explore the data properties, two different rooms were selected that were not adjacent, but were not remote to influence the Received Signal Strength and SNR properties. These rooms were, namely, room A507 and room A509, whose positions are shown in Figure 5. As can be seen from the figure above, these rooms contain location points and 4 for room A507, and and 12 for room A509. For each of the aforementioned location points, RSSI and SNR data correlation was calculated for all combinations of points, that is, for each pair of location points: (1, 2), (1, 3), (1, 4), (2, 3), (2, 4),..., (1, 9),..., (11, 12).
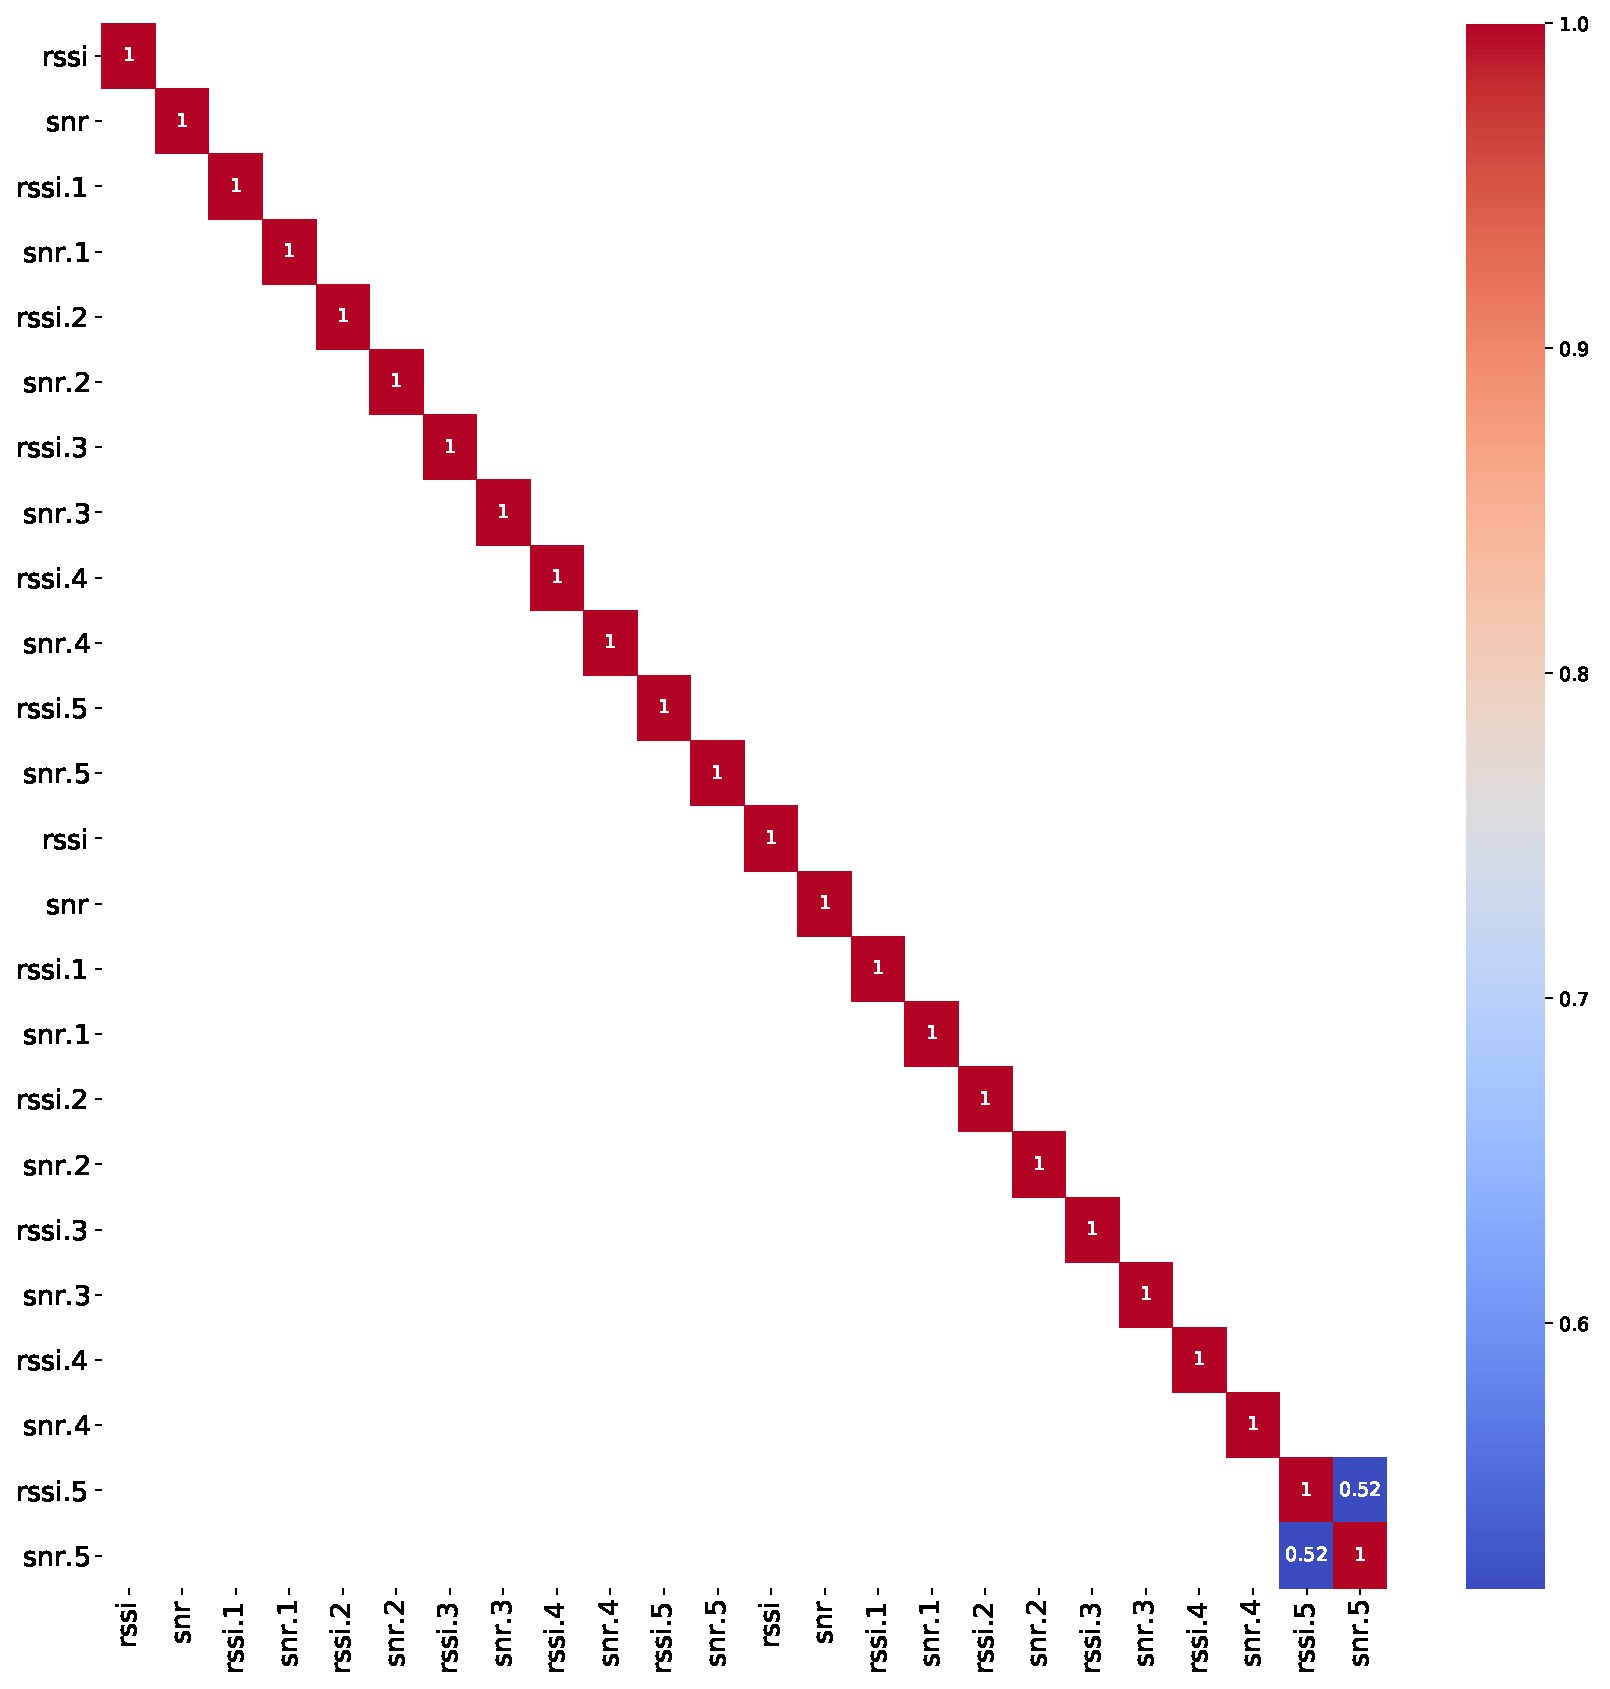
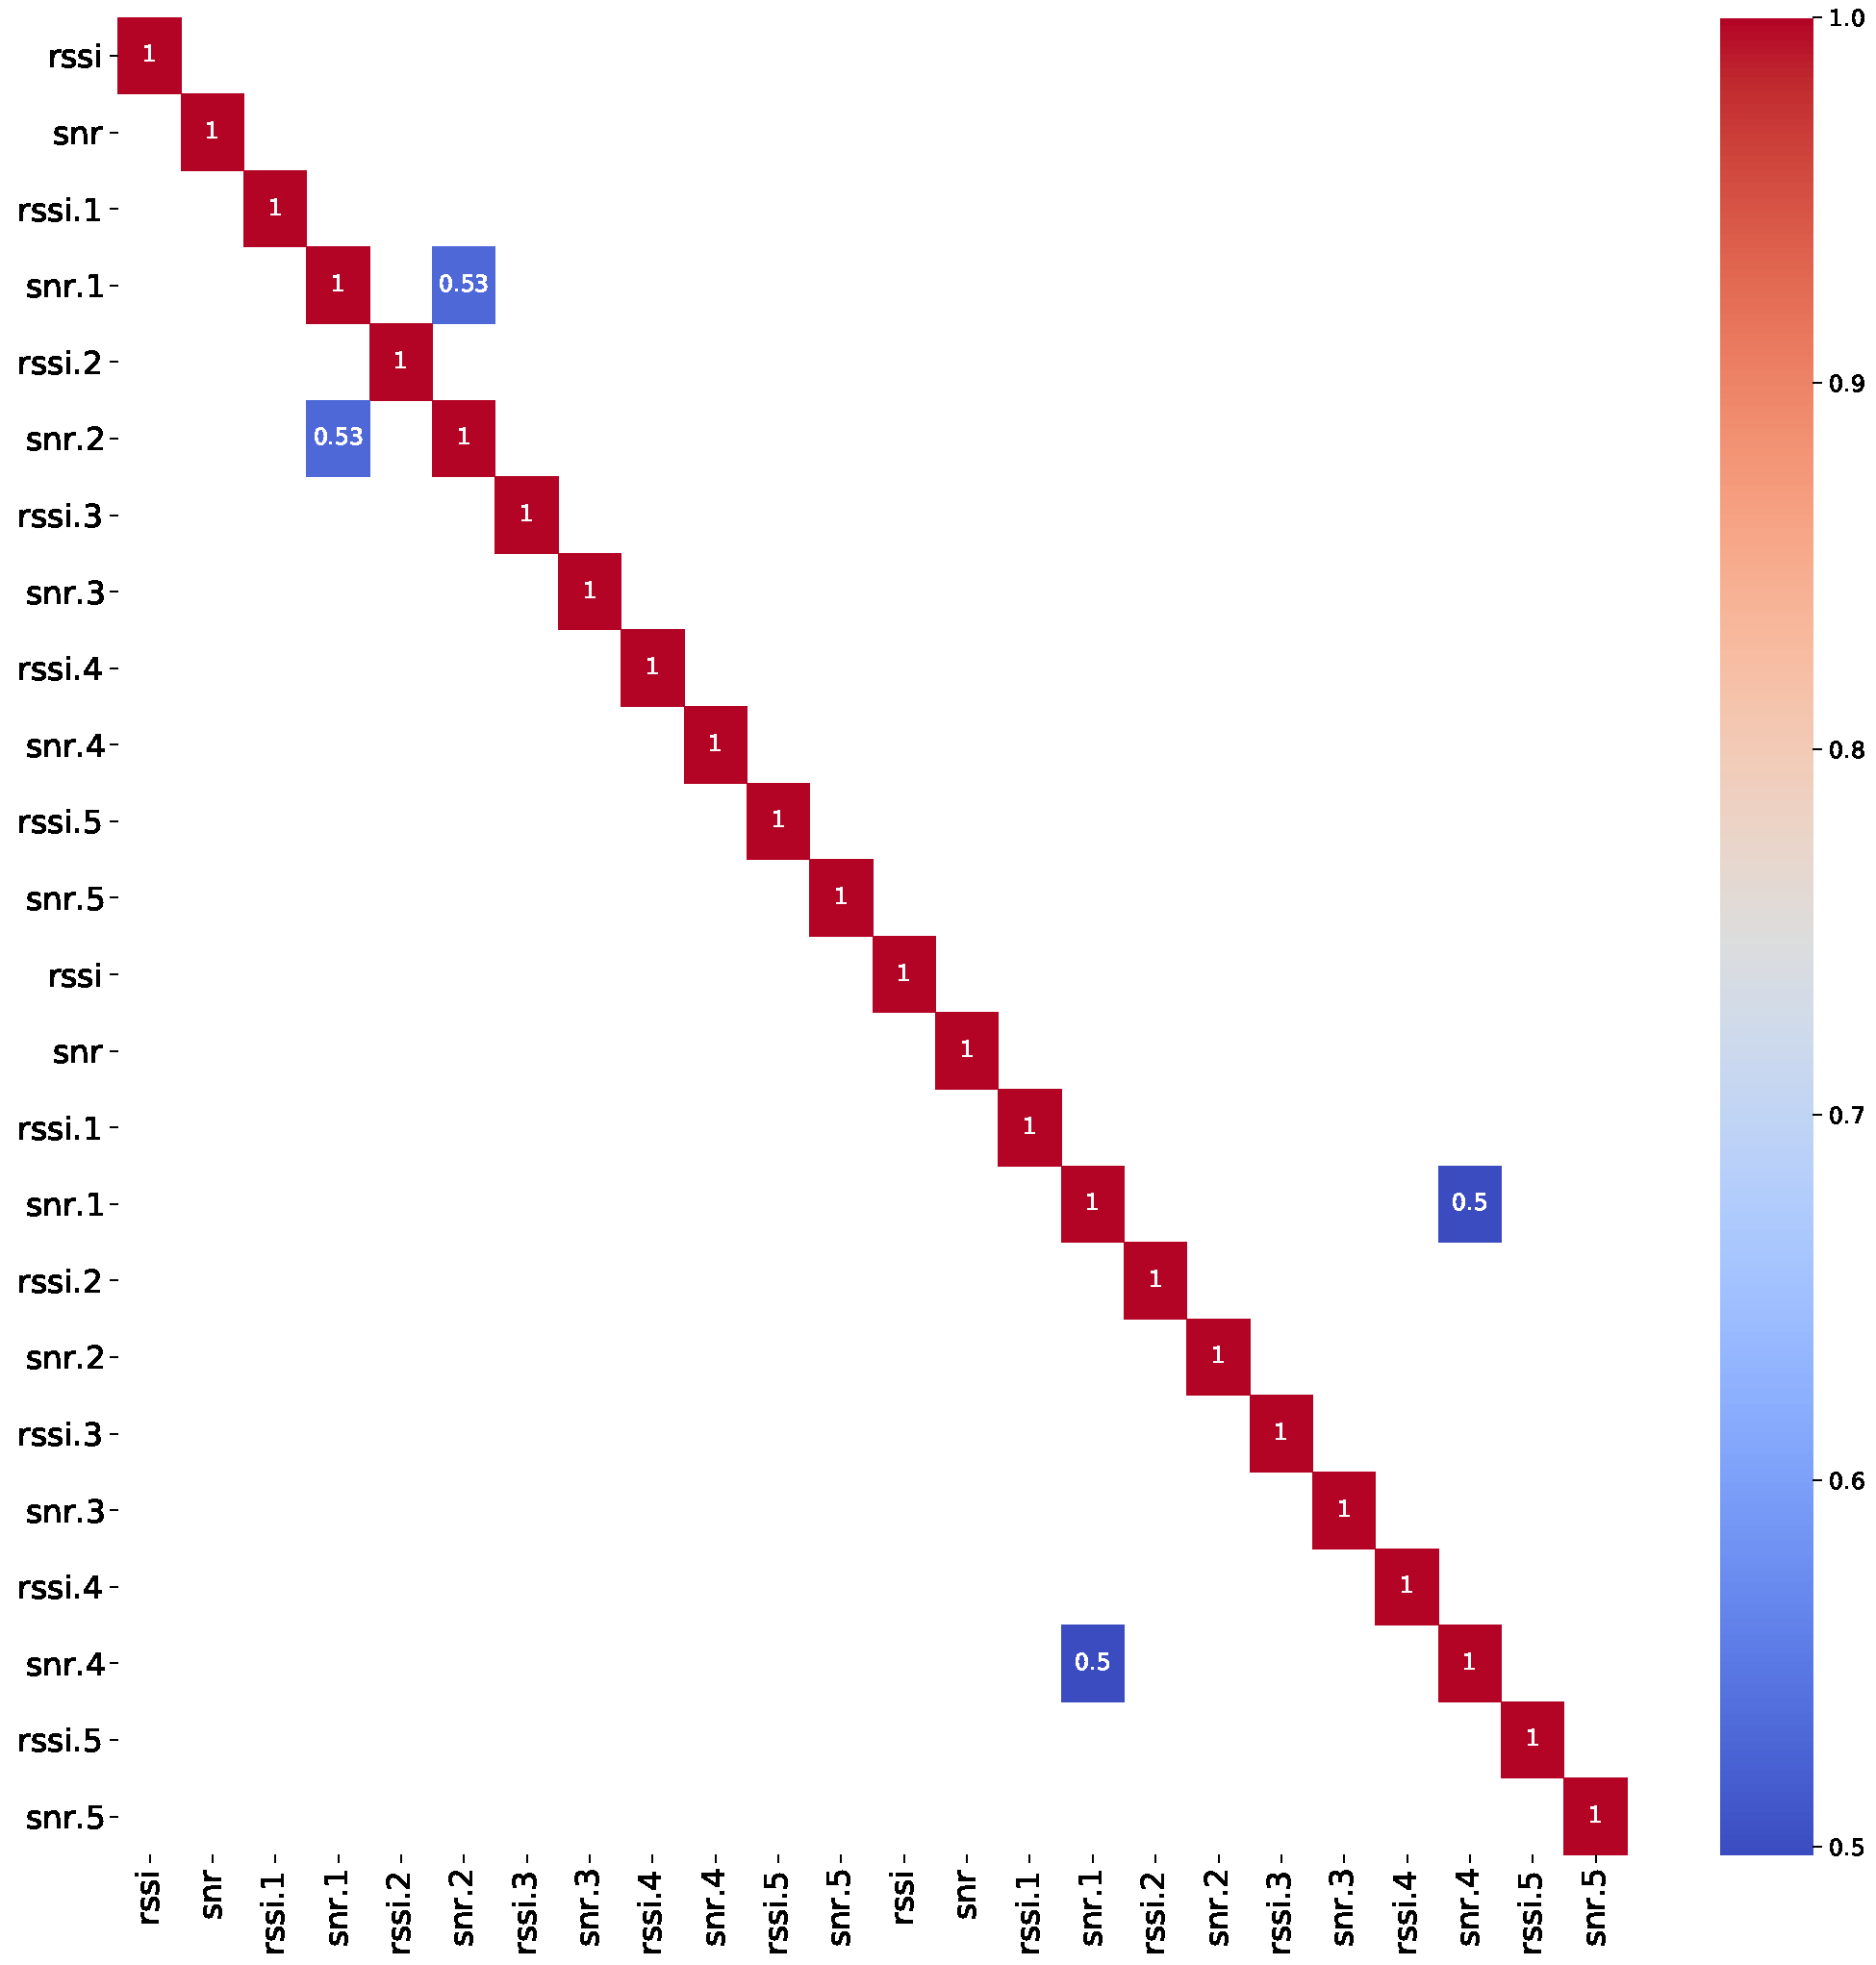
For almost all of the location point pairs, there was no data correlation, indicating that they have different RSSI and SNR values, making it possible to differentiate them solely based on information of RSSI values. This scenario is first shown in Figure 7 and Figure 8. As can be seen from the heat map, RSSI data within the same room, namely A507, does not correlate between two different location points.
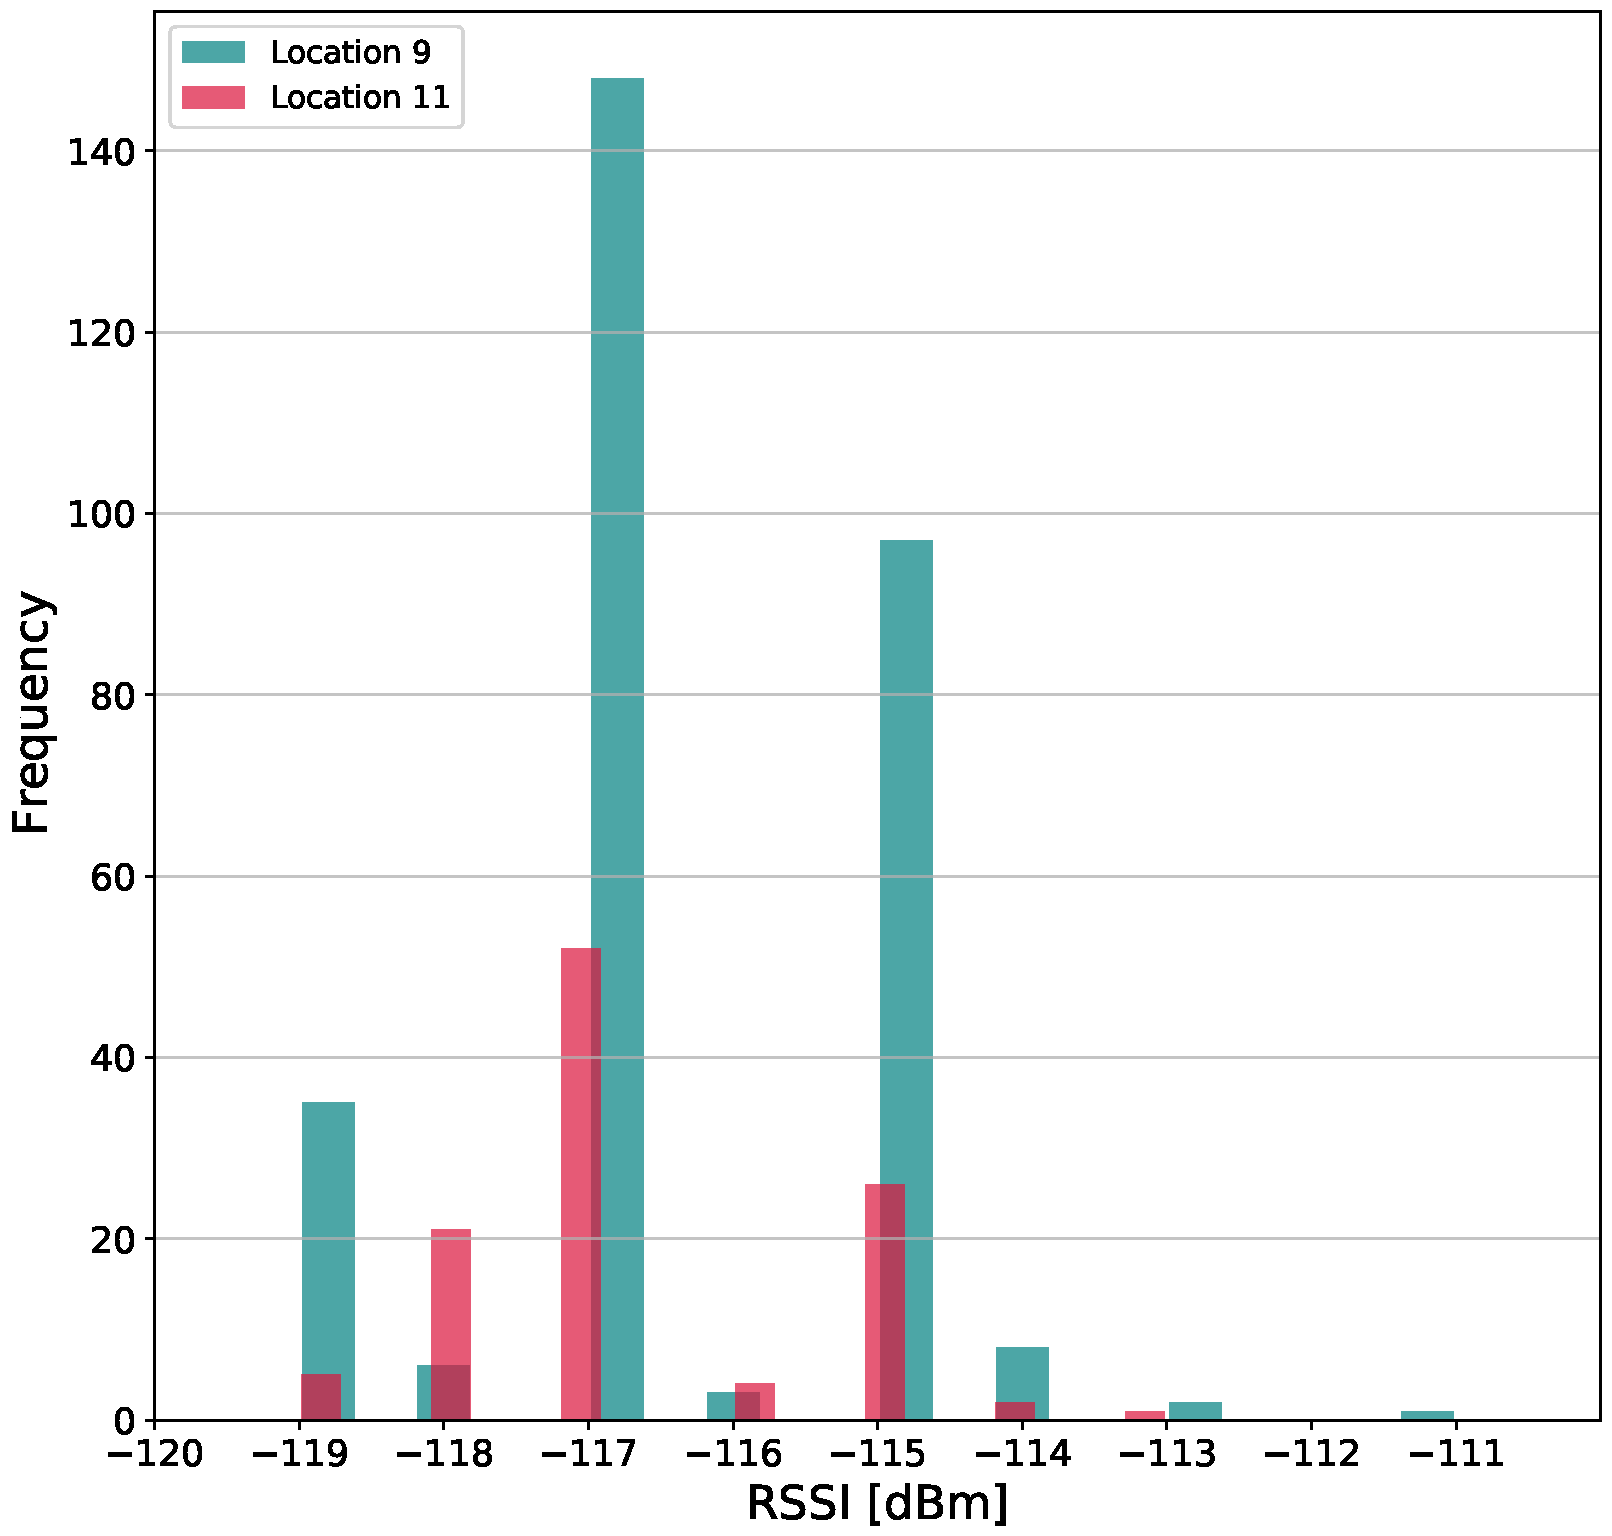
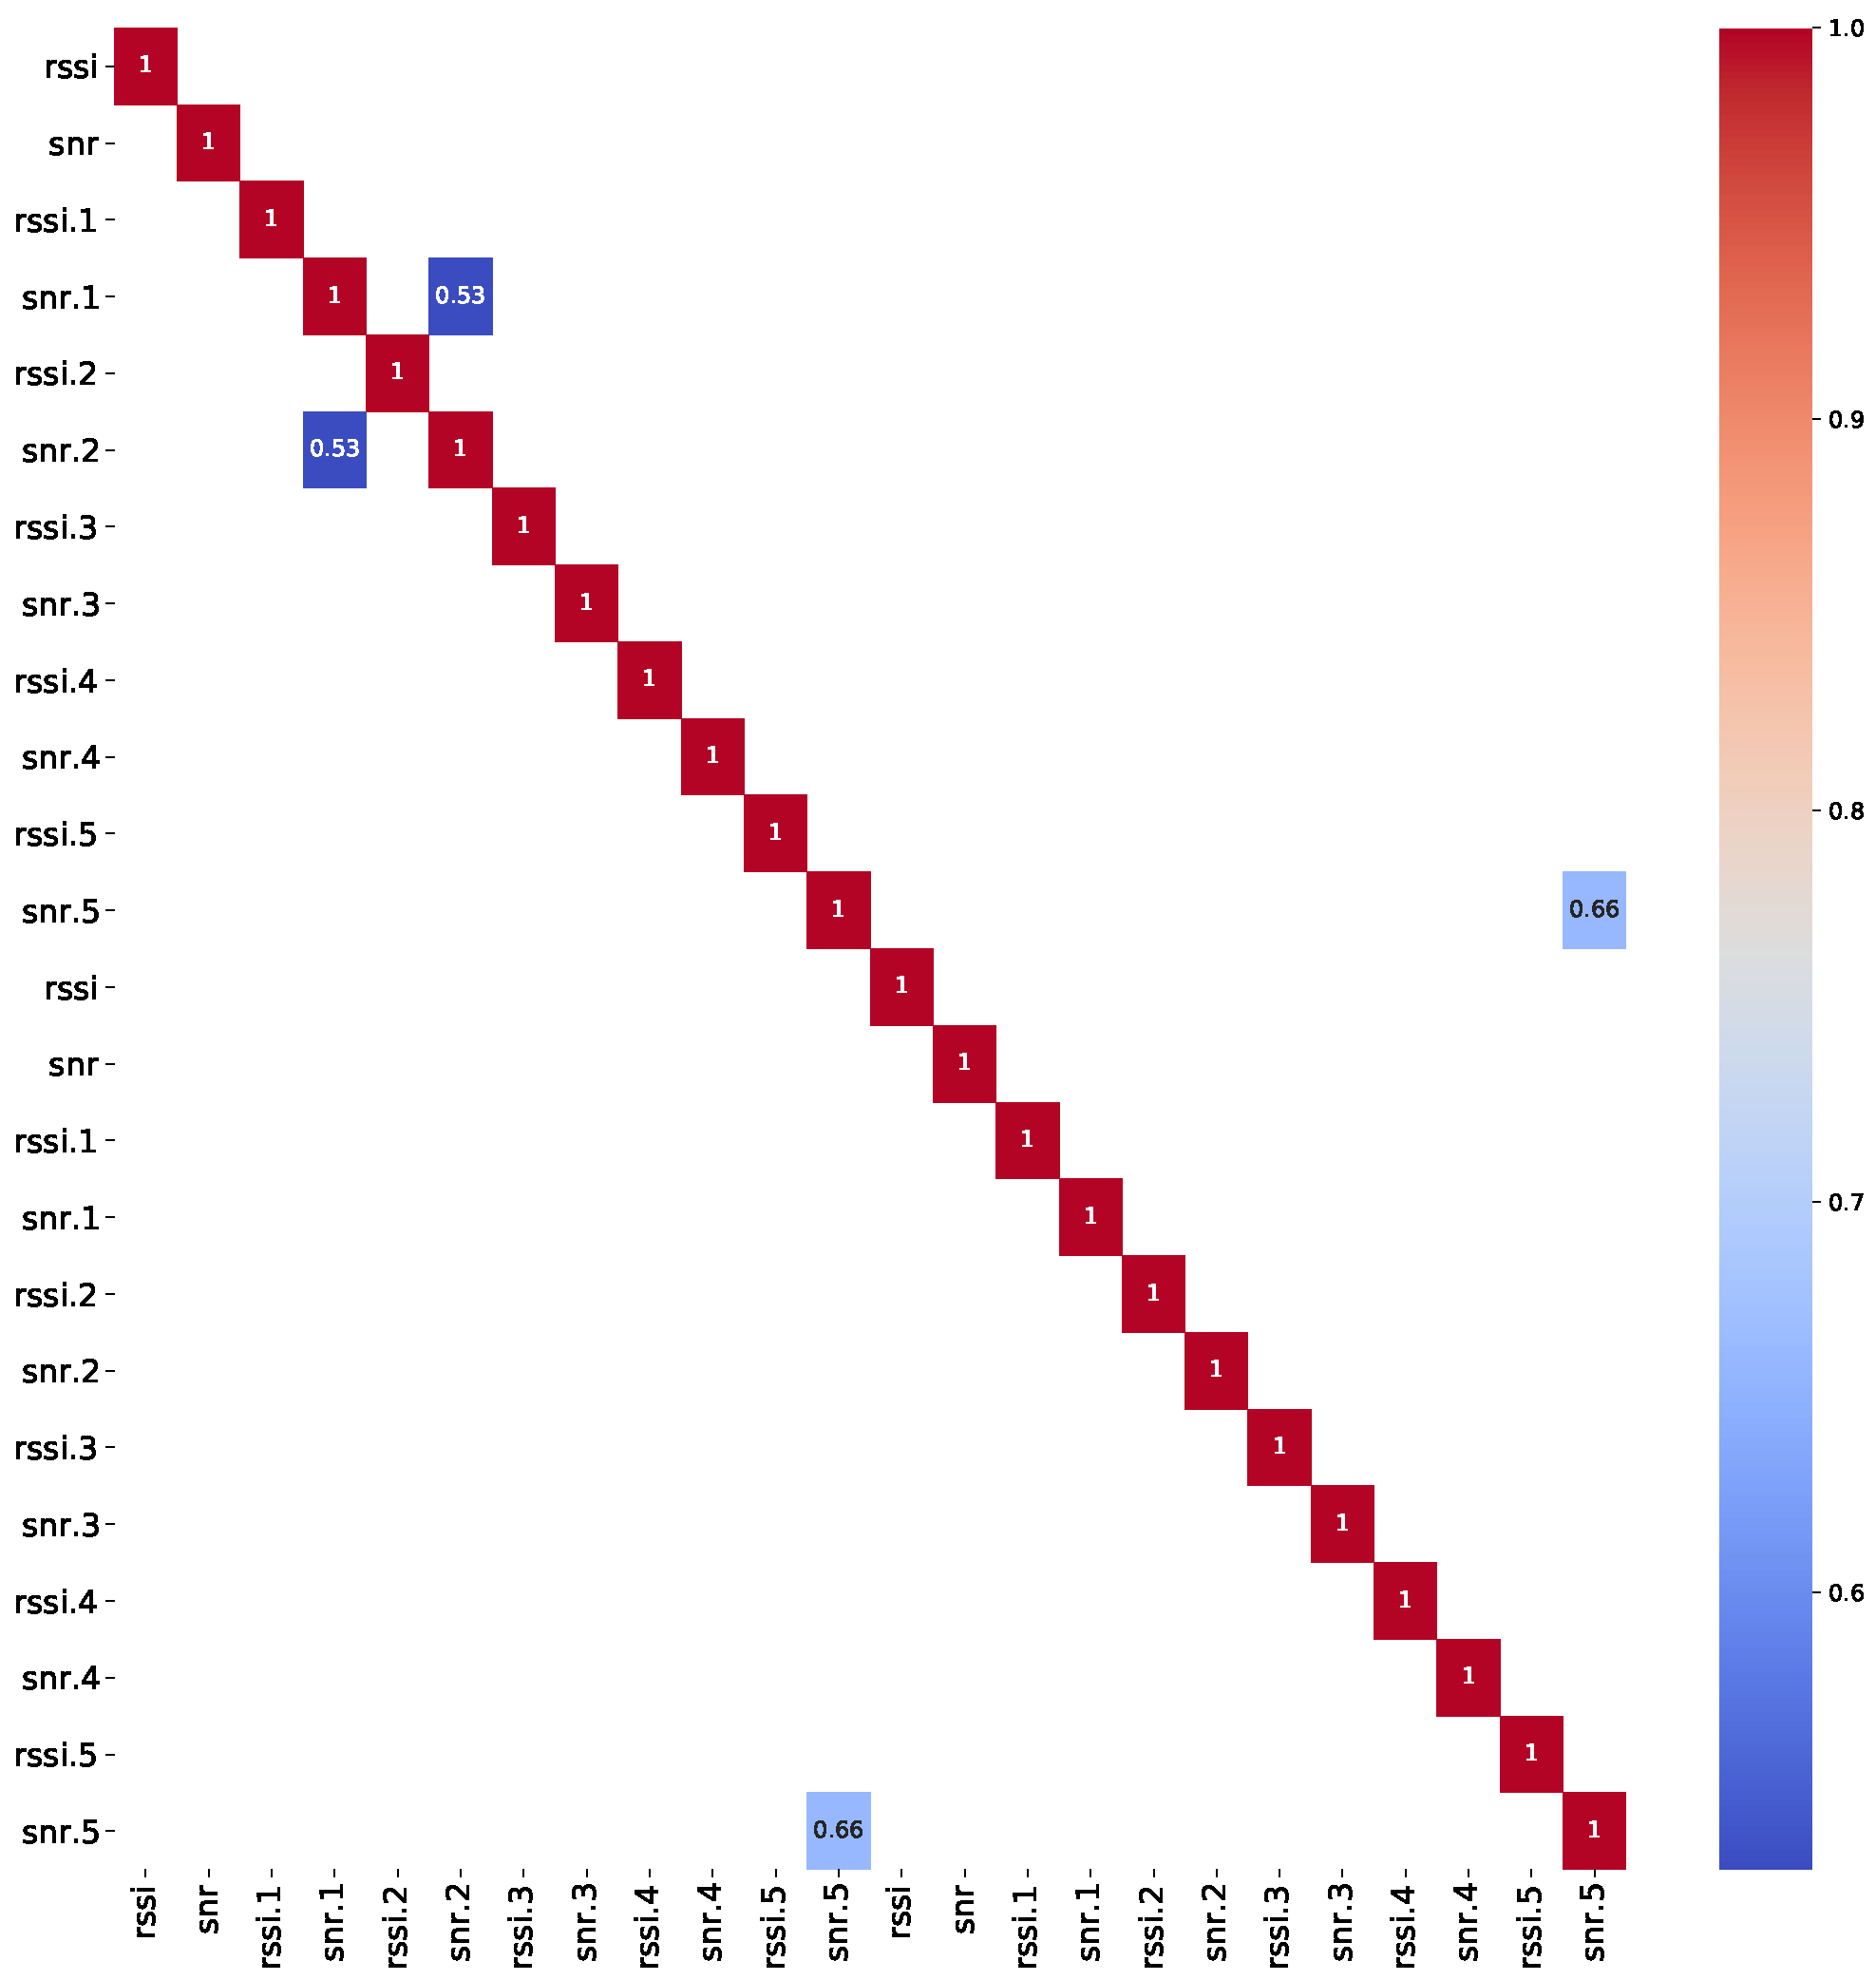
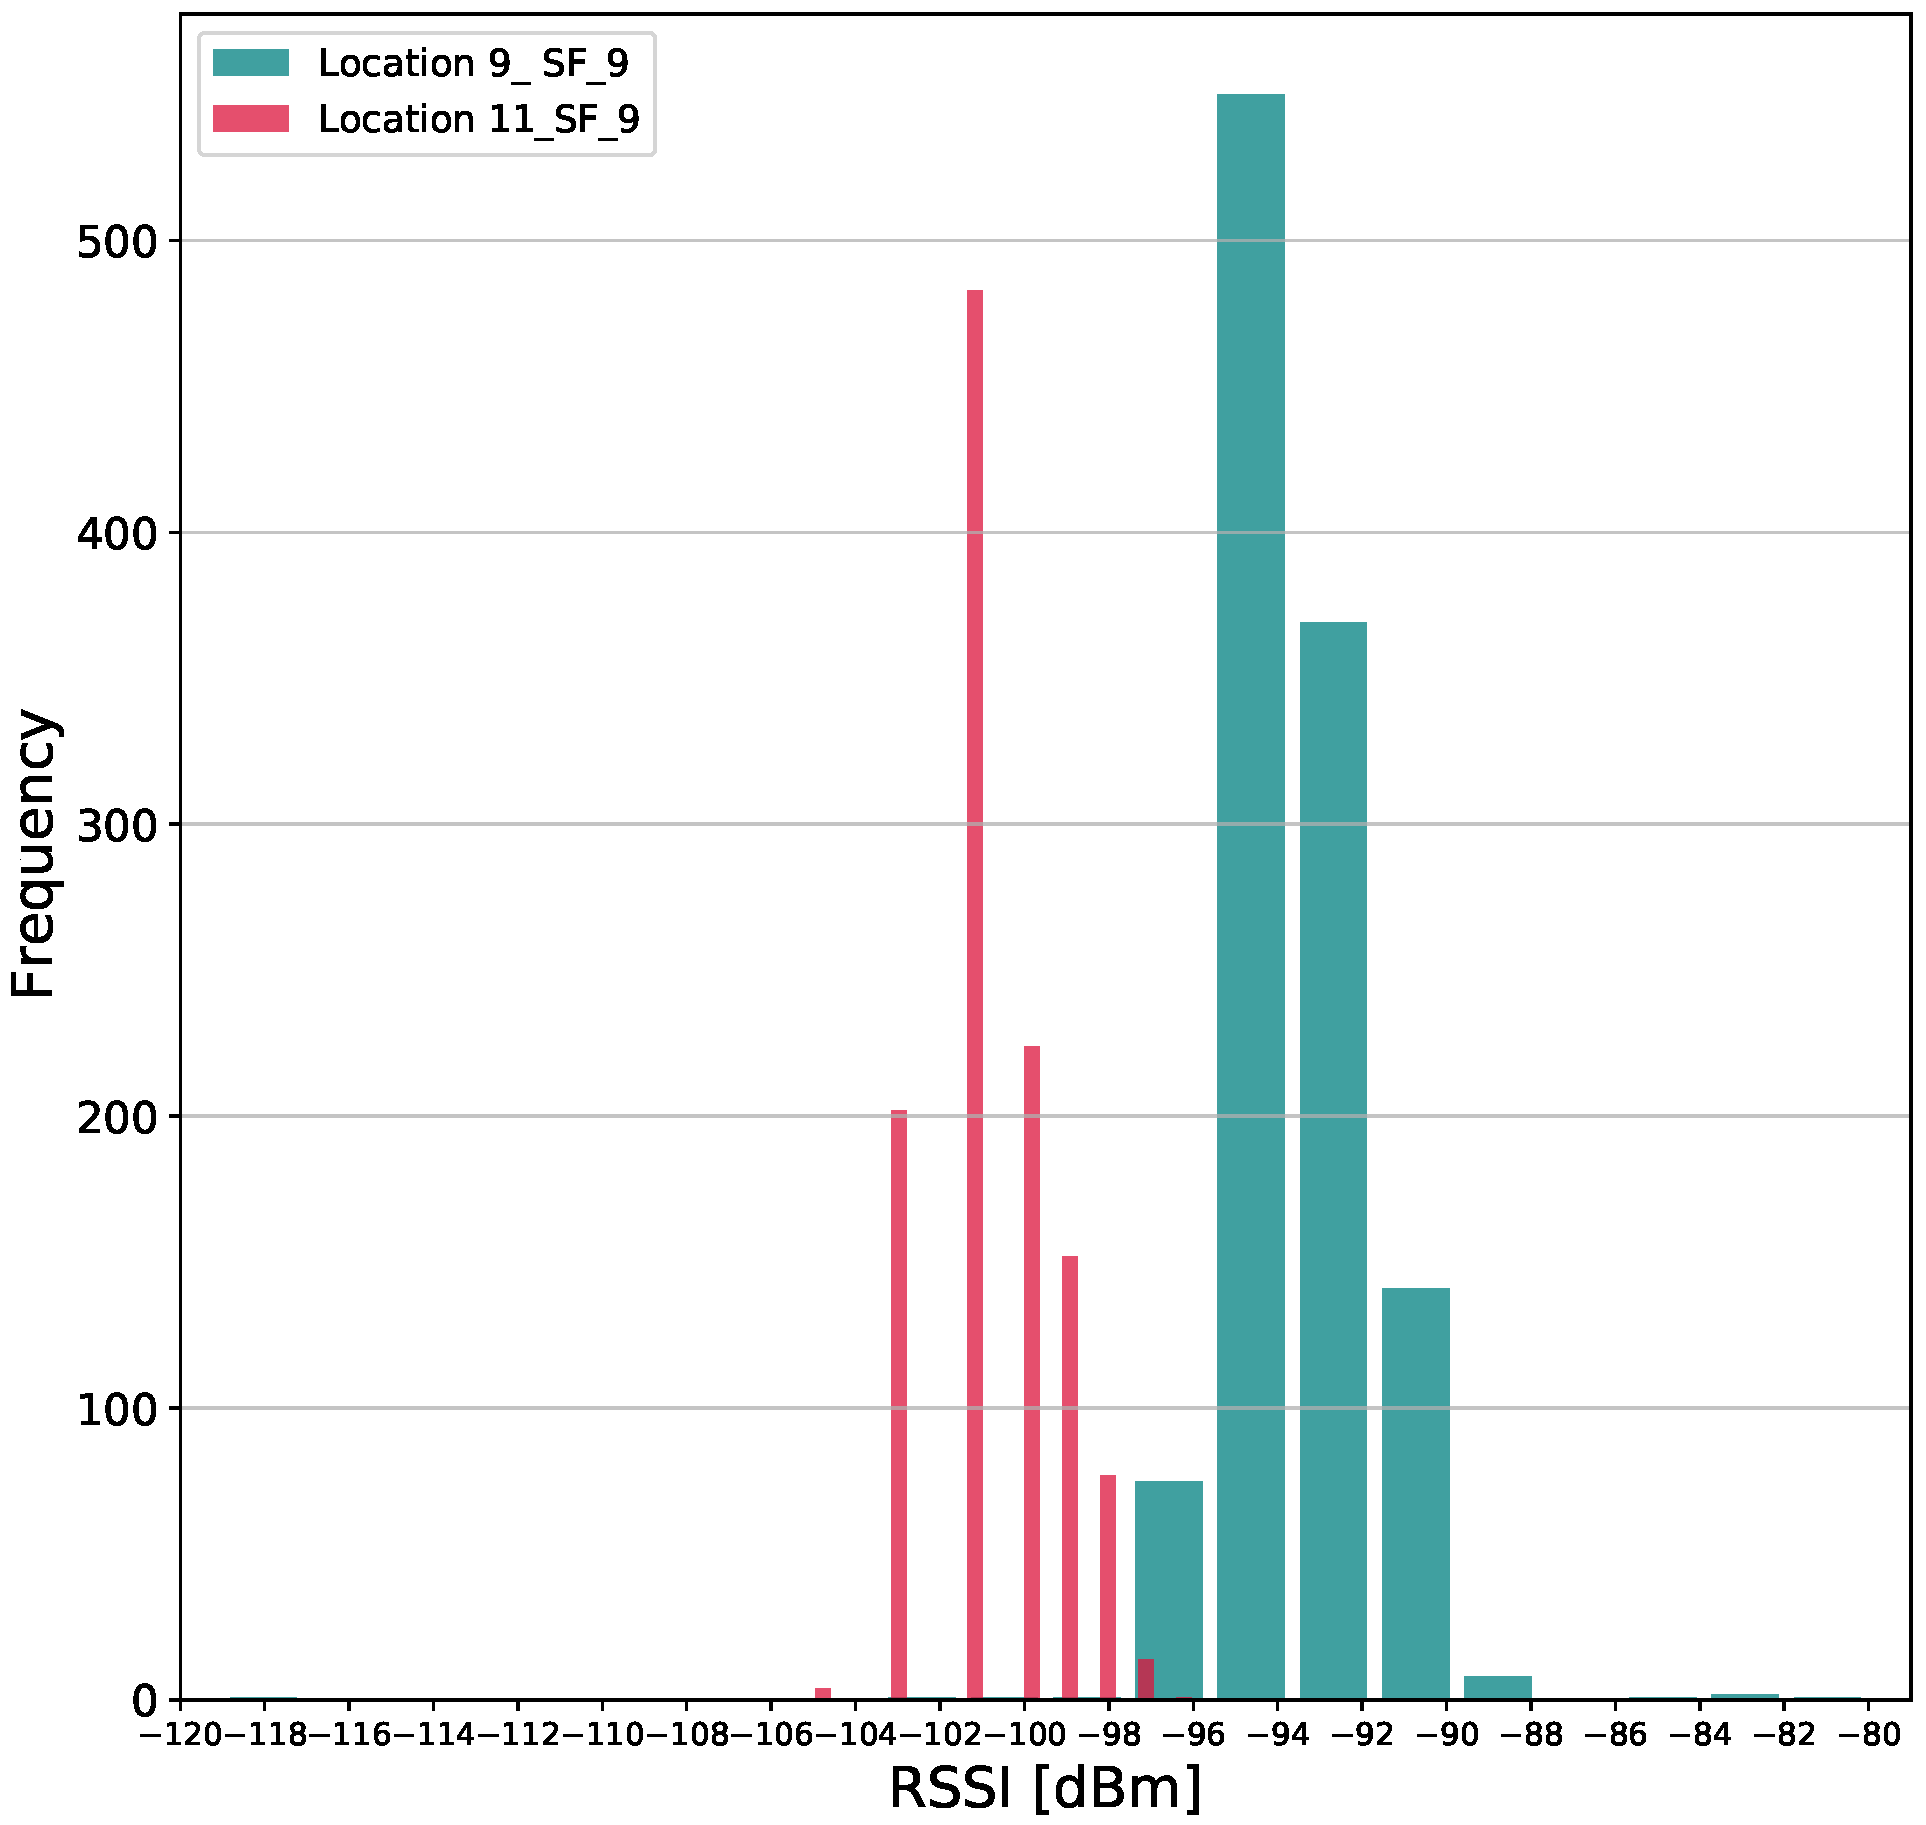
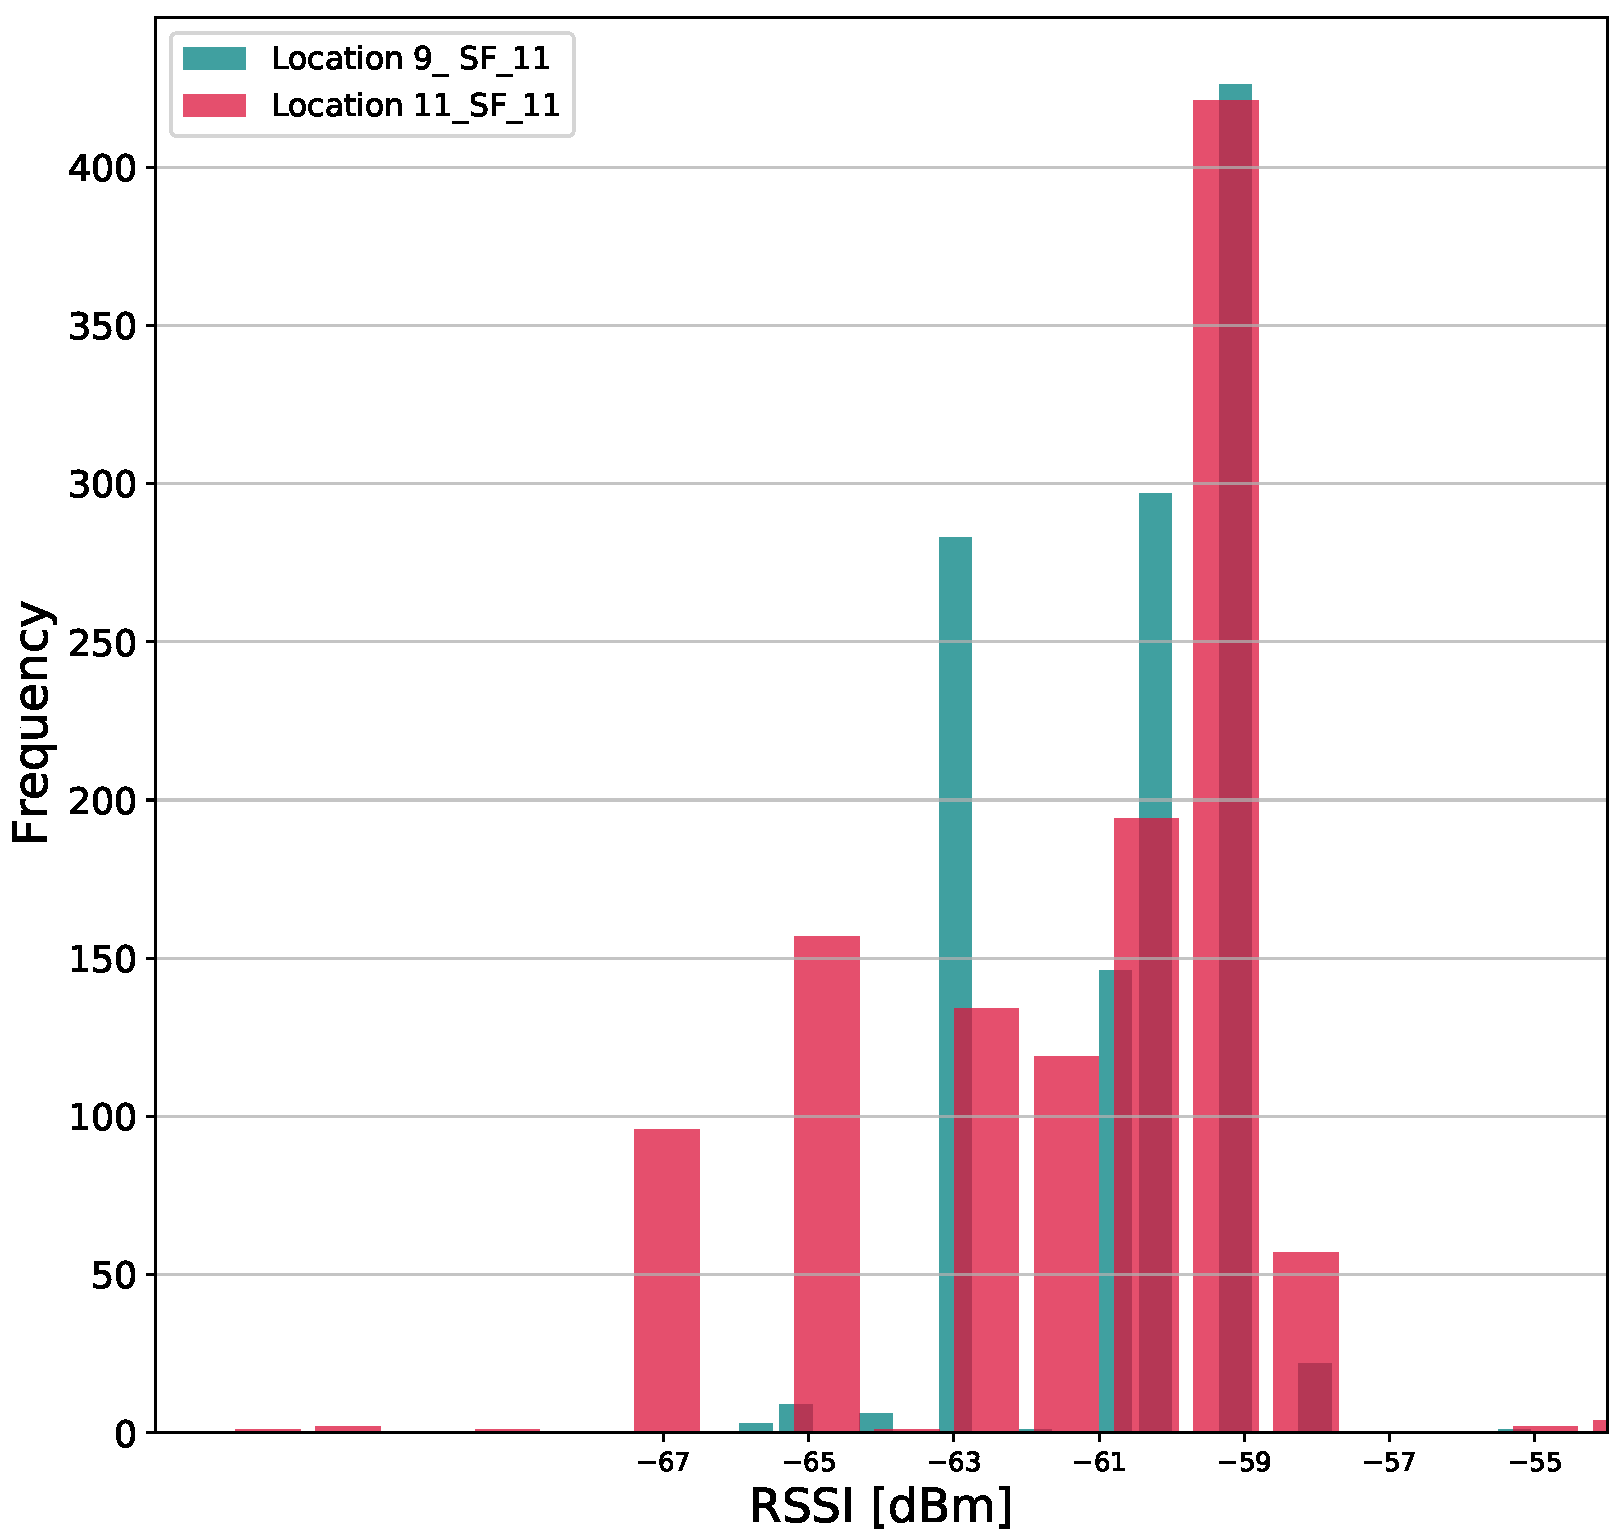
One pair of location points, namely pair (9, 11) from room A509, has shown correlation among data, as depicted in Figure 9. As can be seen, the RSSI values for Gateway 3 have been correlated at both locations. Therefore, for these location points, the pair histogram of RSSI values, shown in Figure 10, was plotted to examine whether there is an overlap between the data values in any amount for particular gateways that have exhibited correlation presented in Figure 9. The presented histogram displays the following:
- More data was sent from location point 9 in contrast to location point 11. What is more, far more non-NaN data values have been sent from location 9 in contrast to location 11, which can also serve as a distinguishing feature.
- The overlapping is borderline for RSSI values and in dBm.
- The overlapping occurs for values and in dBm.
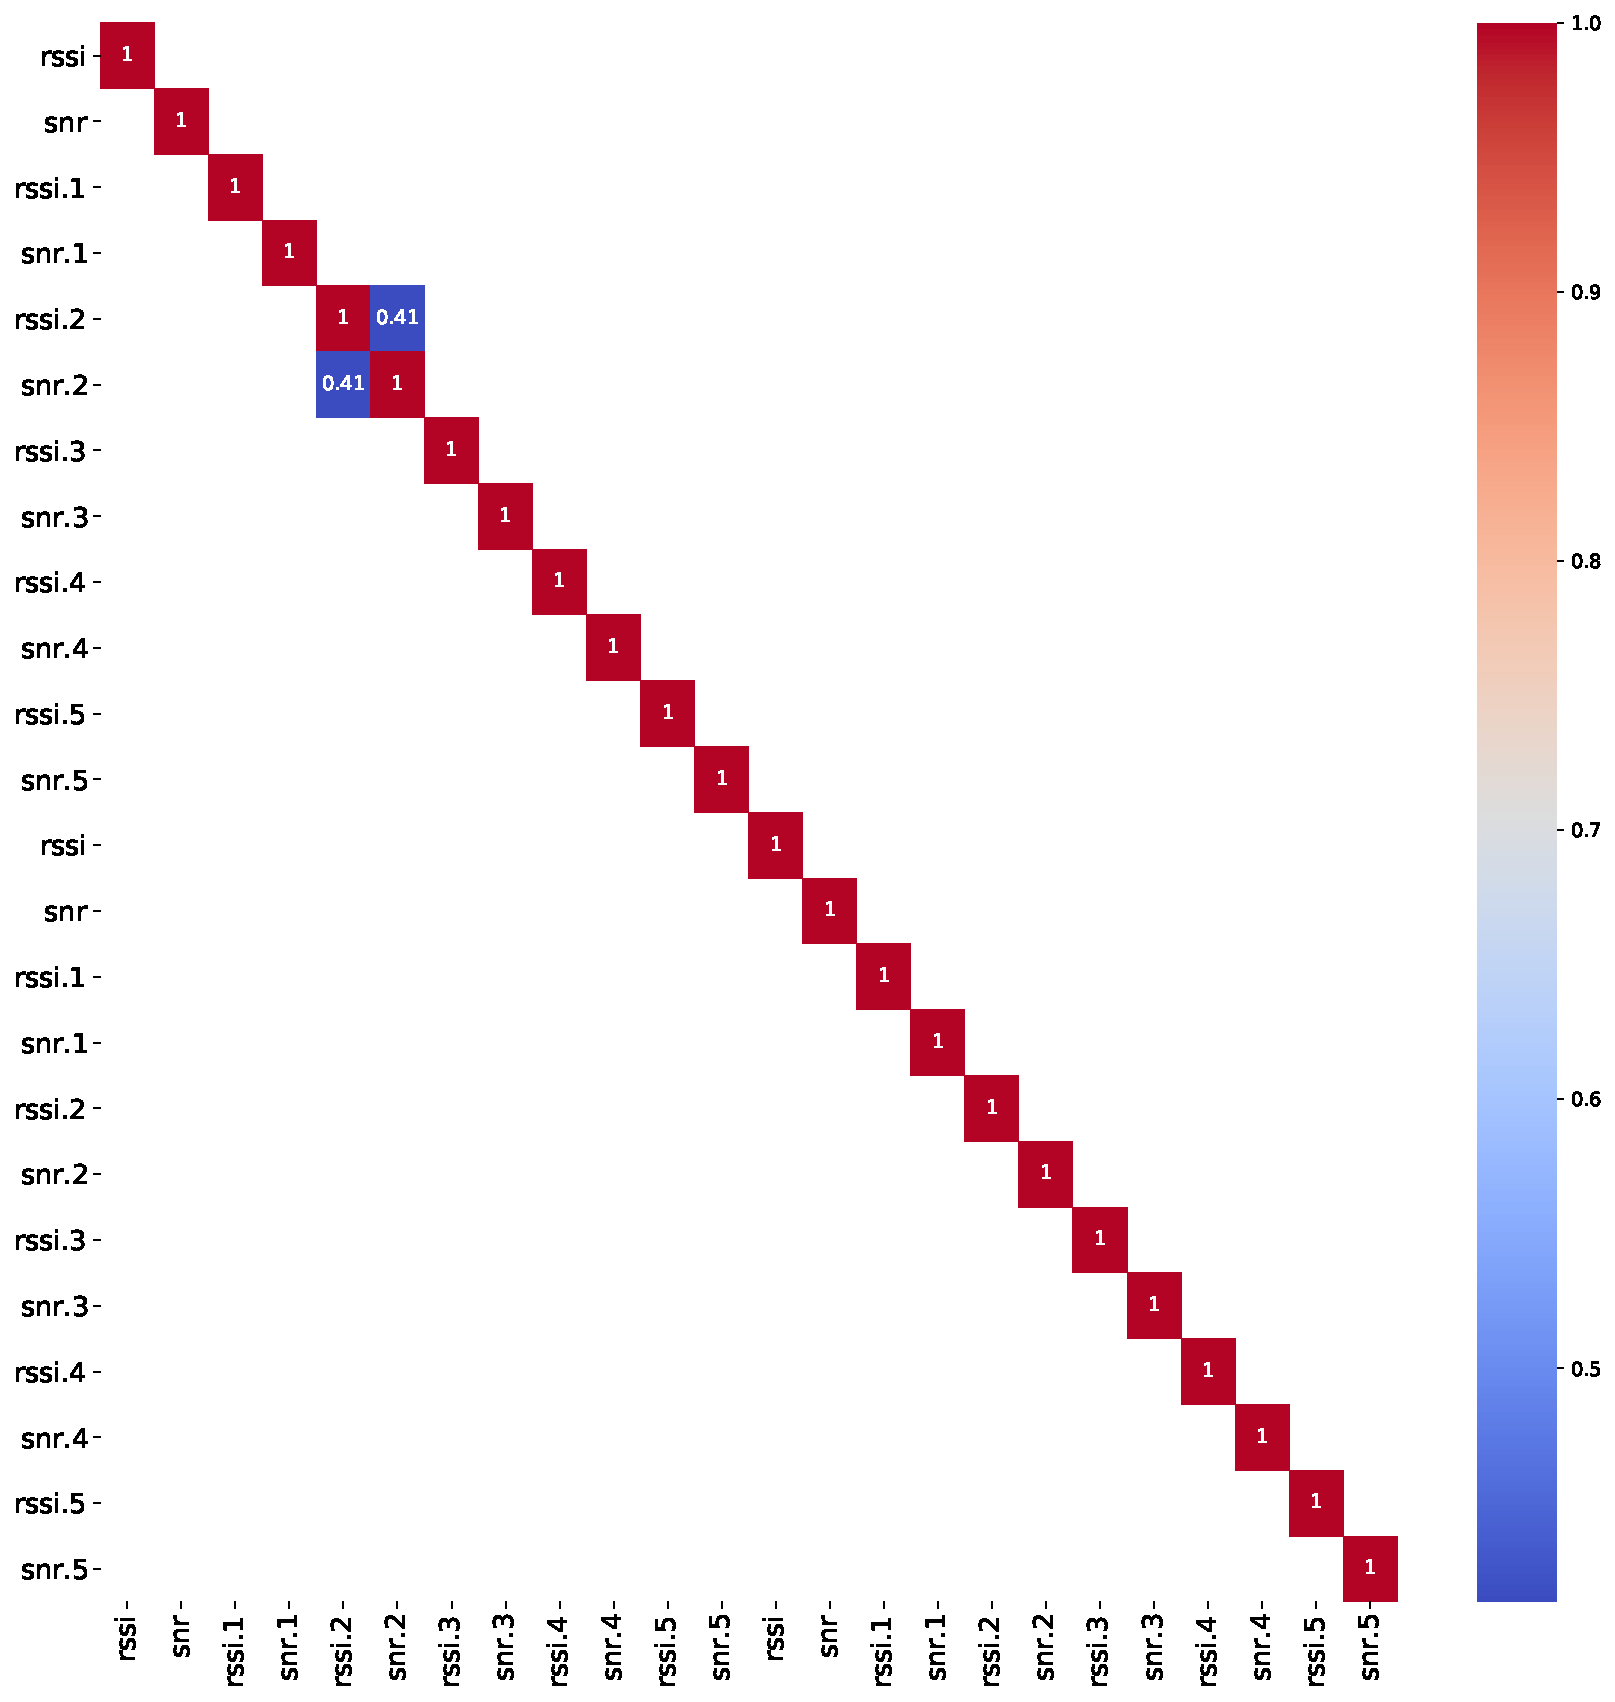
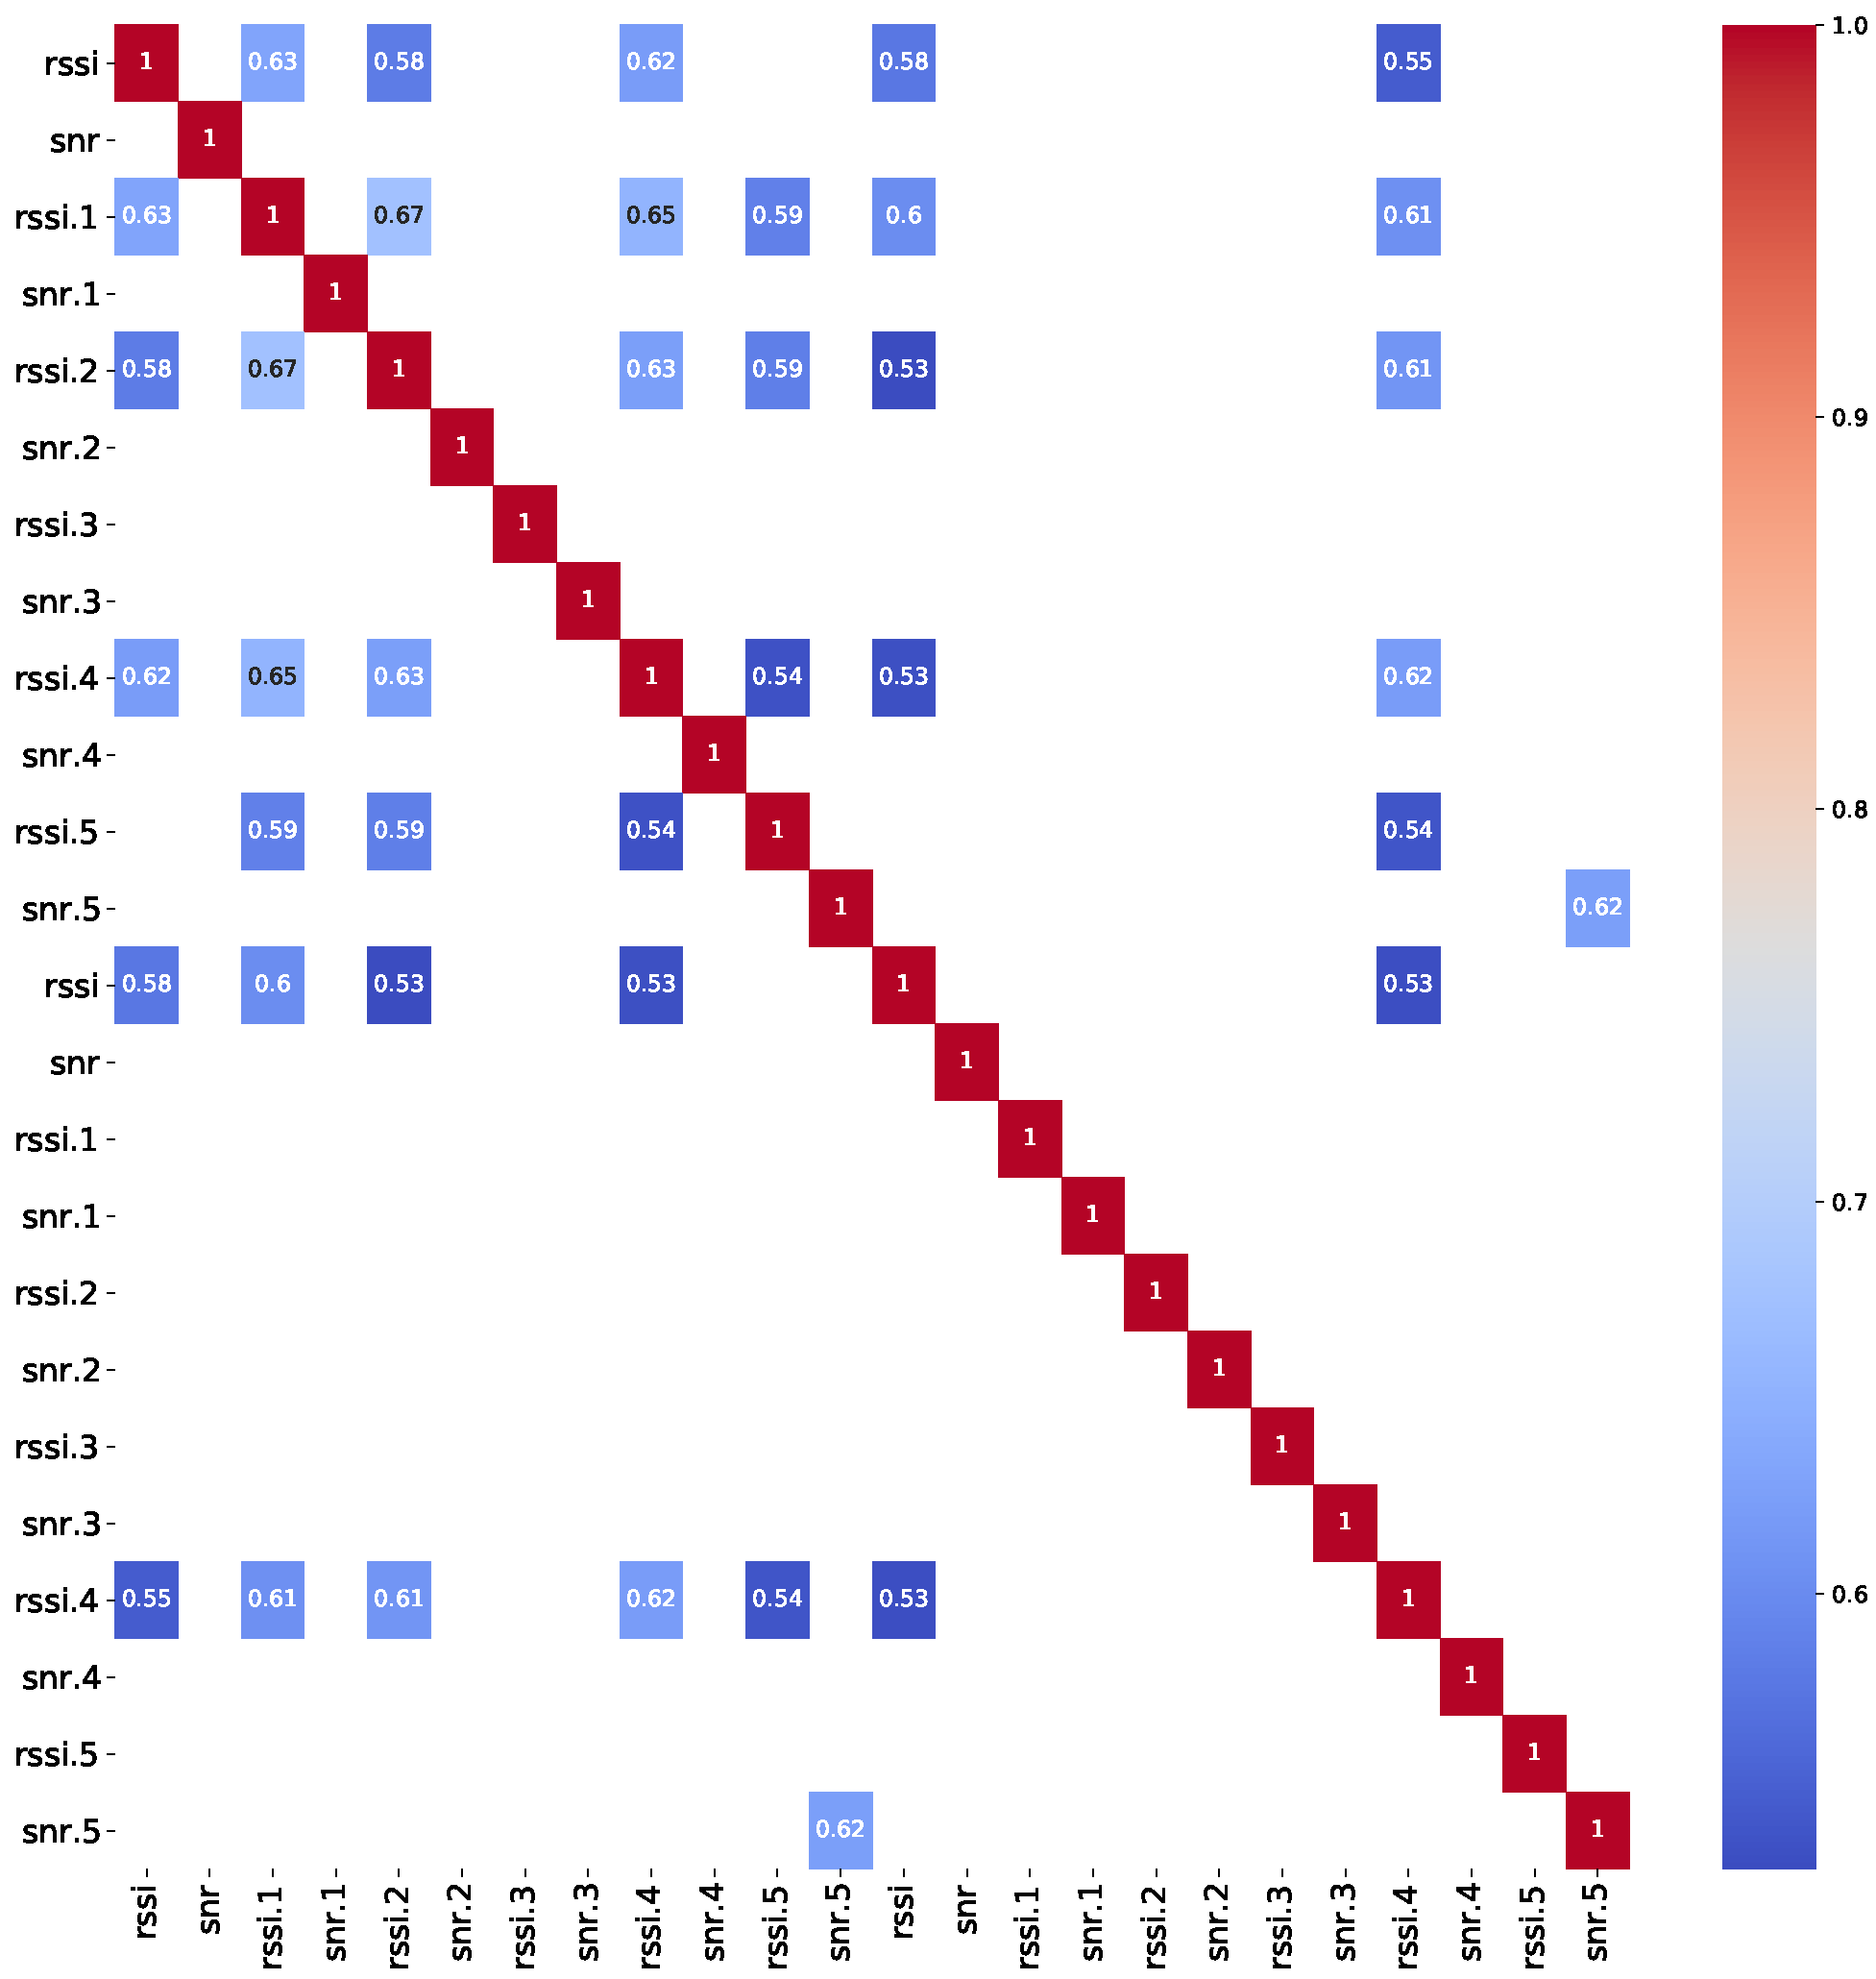
The same course of analyses was conducted for SF 9 and SF 11, i.e., taking into account room A507 and room A509 and their respectful previously described locations and location point pairs. Yet again, for each of the aforementioned location points, RSSI and SNR data correlation was calculated for all point combinations for both Spreading Factor 9 and 11. The results obtained for SF 9 differ slightly from those obtained for SF 7, whereas the results for SF 11 differ considerably from those obtained for SF 7. As can be seen on Figure 11 and Figure 12, correlations among SNR data in location points 9, 10 and 11 have started to appear. This could indicate that the farther the gateway is, the more strongly the channel influences RSSI than the change of the location point. Therefore, a histogram of RSSI values for location points 9 and 11 was once again plotted for gateway 5, as presented in Figure 13, to examine possible overlapping in data. As is shown on the histogram, no large overlapping occurs, but the starting correlation among SNR data must not be discarded and should be further considered when applying the appropriate Machine Learning model.
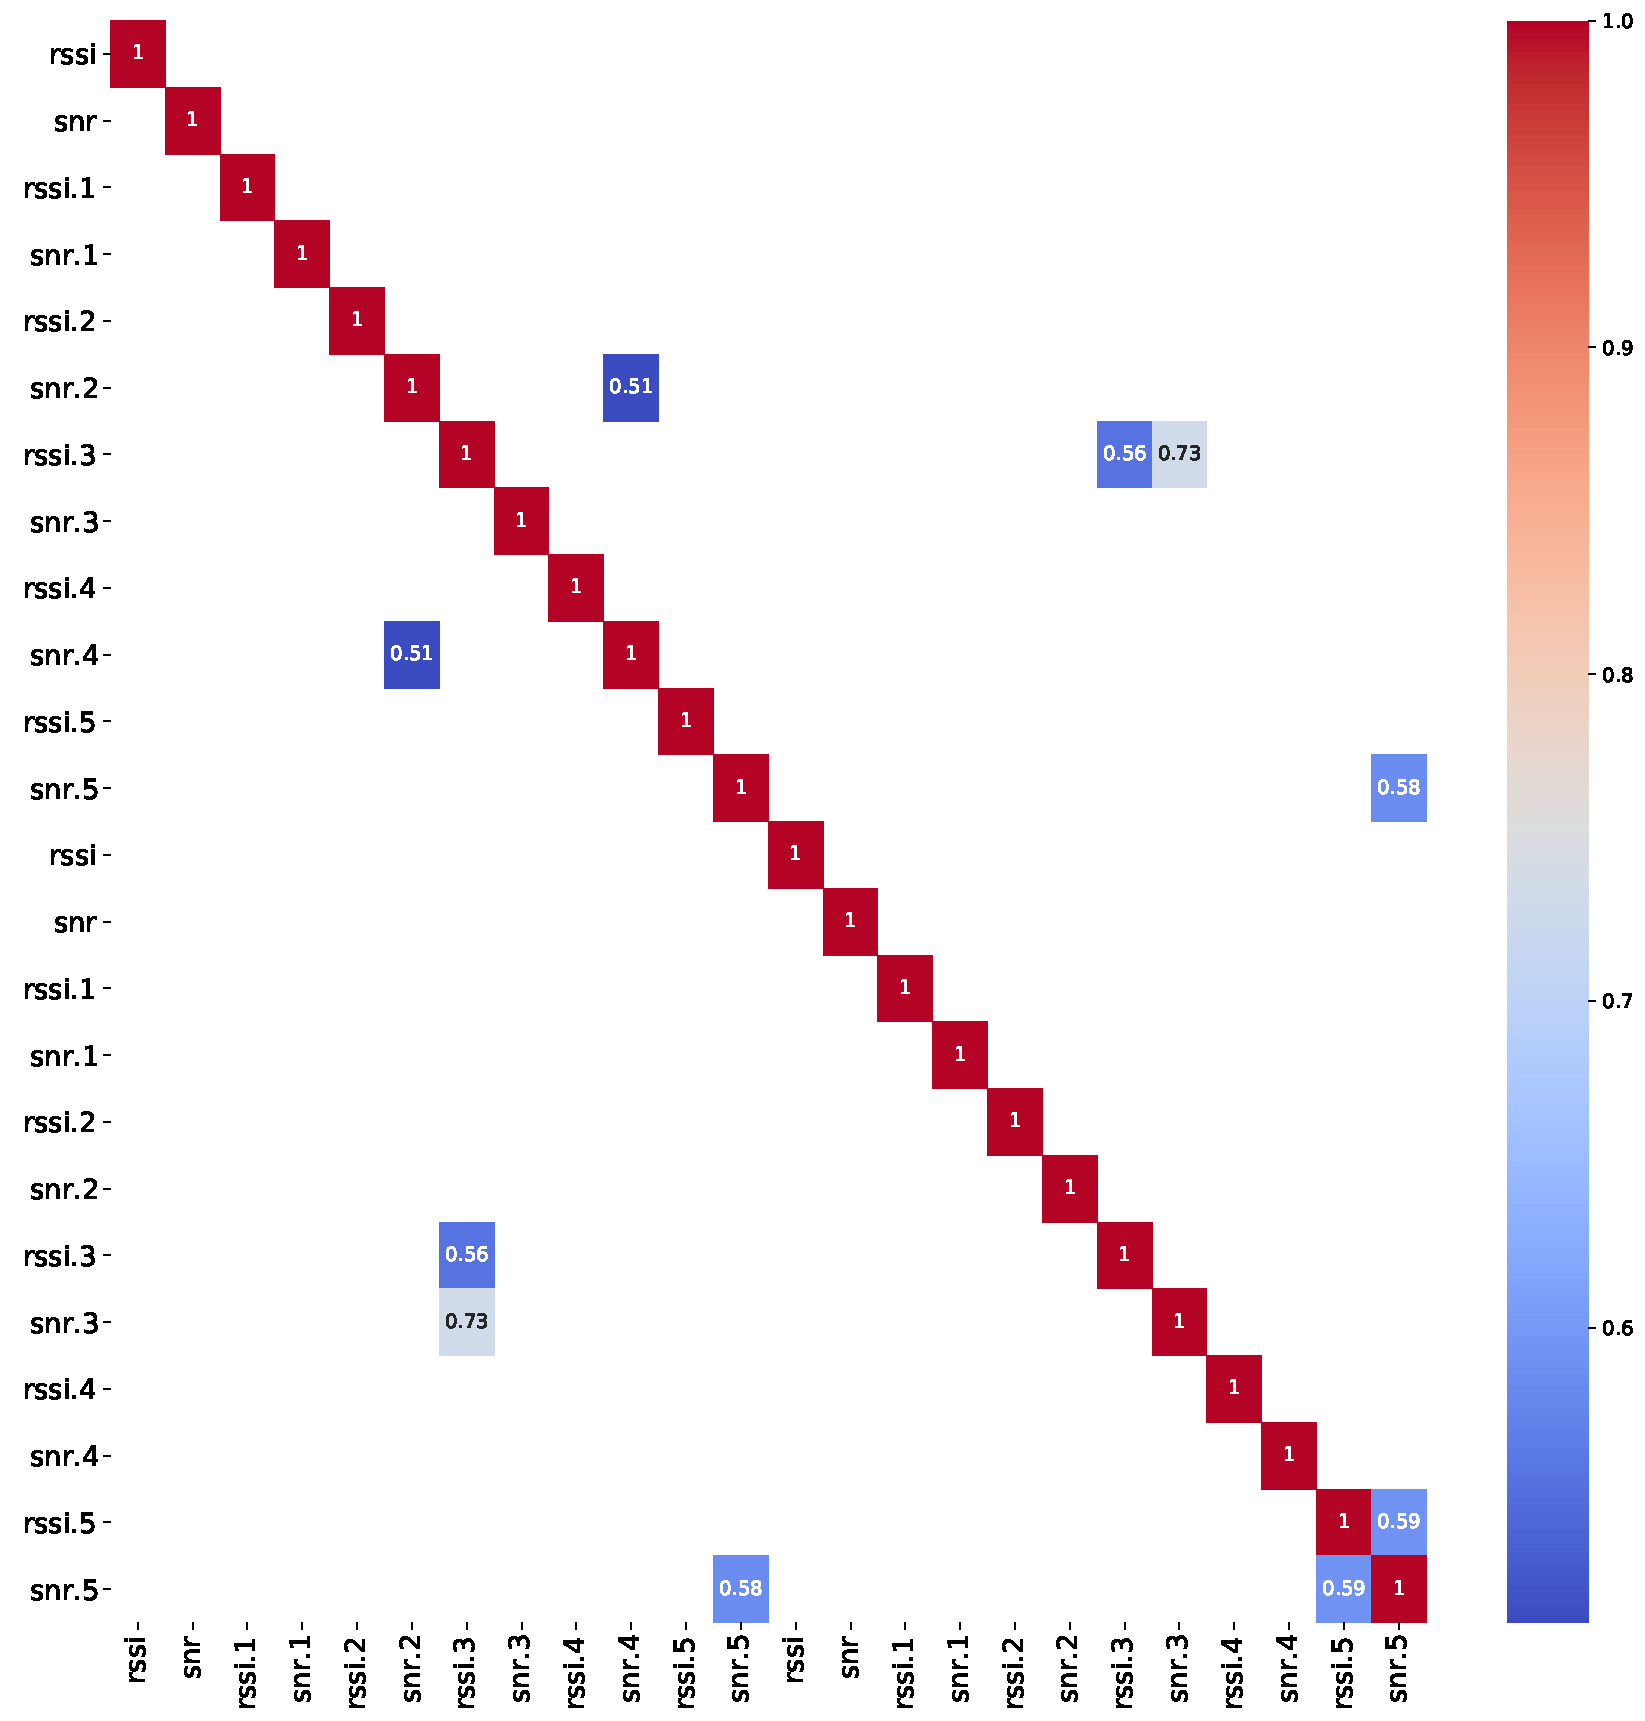
Finally, with regards to SF 11, more data correlation appeared. This is particularly exhibited in Figure 14, Figure 15 and Figure 16. The results indicate that, using spreading factor 11, it could be difficult to distinguish among the location points based on the RSSI values. On the Figure 14, Figure 15 and Figure 16, it can be seen that this is the case for location points 9, 10, 11 and 12. With that regard, a histogram of RSSI values for location points 9 and 11 for getaway zero was plotted, as presented in Figure 17. The histogram shows an enormous amount of overlap, from which we conclude that these data values might not be suitable for possible Machine Learning utilization.
Due to the above reasoning, the final examination yielded the decision that, for Machine Learning employment, it was best to select data obtained for Spreading Factor 7.
4. Machine Learning: A General Overview
Machine learning is an important area of research and application in the IoT, with the goal of giving computer programs the ability to improve through experience [43]. One of the key features of a learning machine is that its trainer is not aware of its inner workings [44].
In general, machine learning involves processing data, training a model on that data, and then testing the model to see how well it performs. This allows systems to make decisions based on the input they have been trained on [45]. To achieve this, systems use a variety of techniques and statistical models to evaluate data and identify relationships between different data features [46].
There are four main types of algorithms that are used in machine learning: supervised, unsupervised, semi-supervised, and reinforcement learning algorithms. Each of these algorithms has its own strengths and weaknesses, and is suitable for different types of tasks.
- Supervised learning algorithms require external supervision in order to learn how to map input values to output values, where the correct values are provided by the supervisor [47].
- In contrast, unsupervised learning algorithms allow computers to learn how to perform a task using only unlabeled data. These algorithms must be able to identify connections, anomalies, and similarities in the input data, and recognize patterns without any guidance [48].
- Semi-supervised learning is a combination of the two approaches, using both labeled and unlabeled data. These algorithms typically behave like unsupervised learning algorithms, but can be improved by the addition of labeled data [49].
- Reinforcement learning algorithms operate with limited information about the environment and only receive feedback on the quality of their decisions. These algorithms are able to ignore irrelevant details in order to perform effectively and maximize their performance [50].
Machine Learning has proven to be an excellent solution for a wide range of problems, including prediction, classification, pattern recognition, clustering, and so on. Depending on the application type, the best algorithm is chosen based on the technique’s speed and computational intensity [46]. Deep Learning is now one of the prime ML approaches for solving complex issues that would otherwise be impossible to solve using more traditional Machine Learning methods [45]. DL implementations have demonstrated exceptional precision and gained popularity in a variety of areas, particularly in the image and audio domains [45]. Deep Learning approaches successfully provide insights from data, grasp data patterns, and classify or predict data [51]. Deep neural networks have been defined as those with more than two hidden layers, and the term “deep” refers to the large number of hidden layers that comprise the neural network [52]. Deep Learning technologies are currently being used to solve a wide range of scientific and technological problems, such as object detection, intelligent transportation systems, speech recognition, natural language processing, computer vision, etc. [53].
Neural Networks Model
Artificial Neural Networks (ANN), also known as Neural Networks, have received much interest in the last 20 years as a Machine Learning approach for prediction and classification [46]. The brain-nervous system was the foundation for their design, which took the shape of a mathematical model created to resemble the structure and functionalities of genuine biological neural networks [54]. ANNs have been realized in a broad array of applications that involve classification or some type of forecasting, along with science, engineering, technology, mining, agriculture, business [55], computer vision [56] as well as time series forecasting [57].
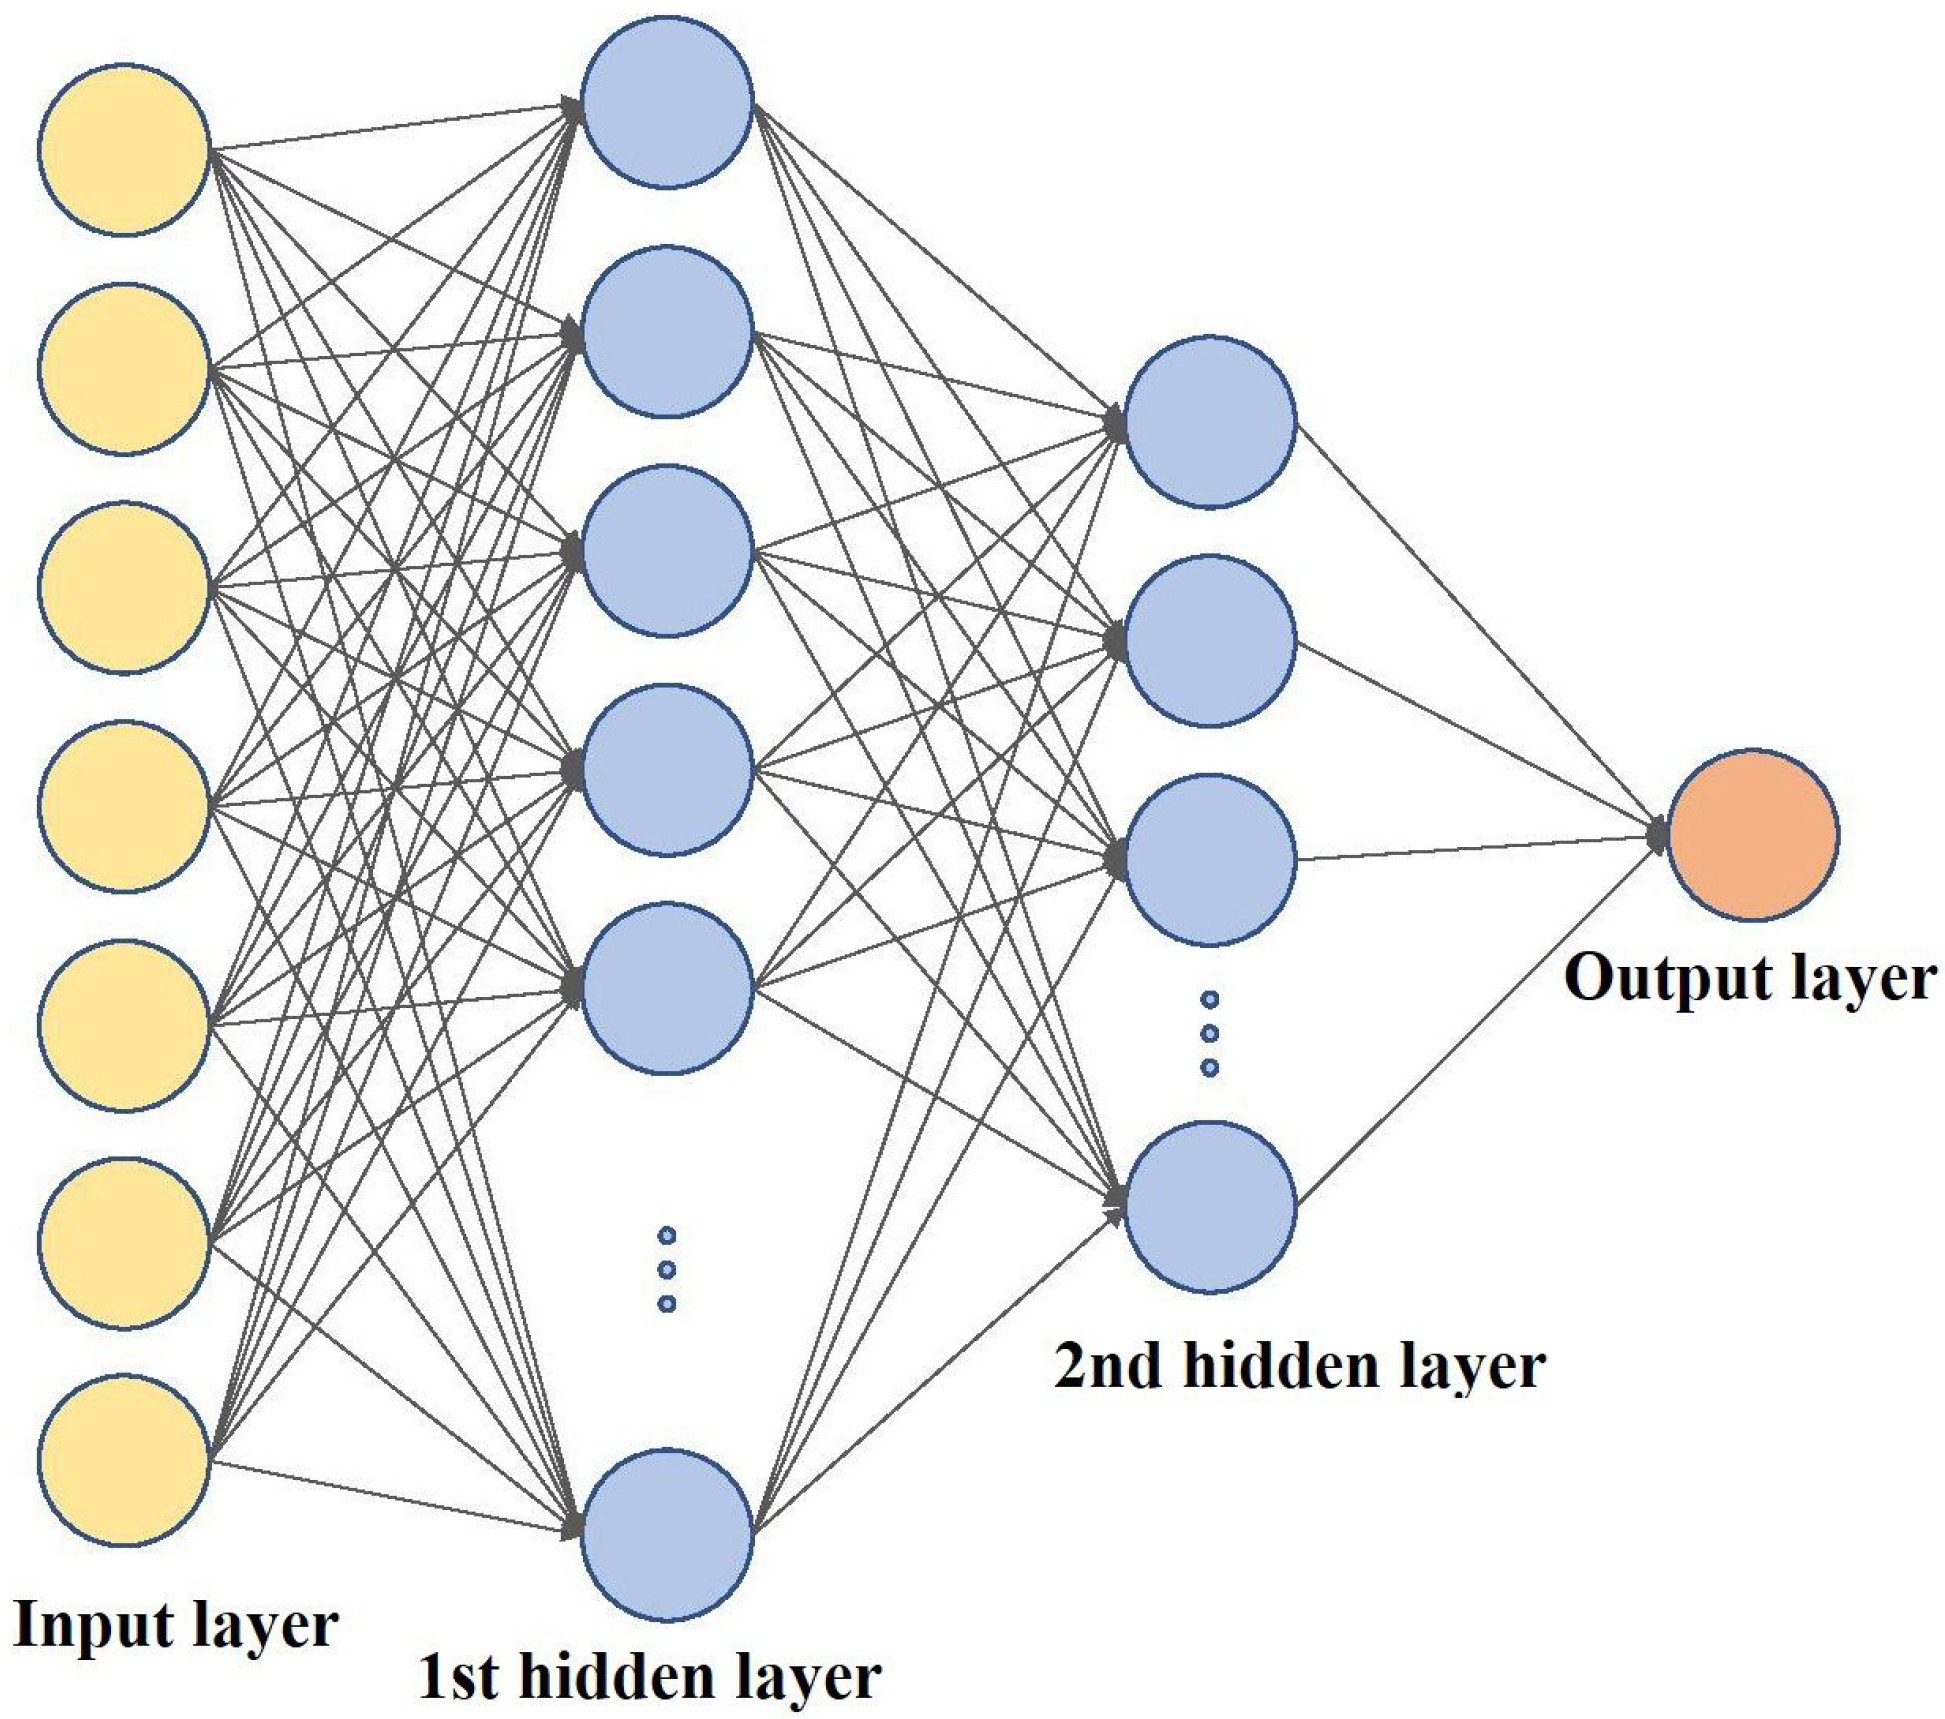
As shown in Figure 18, the neural network is formed up of three basic layers: the input layer, the hidden layers, and the output layer. The depth of the neural network is represented by the number of its hidden layers. The imitation of brain learning processes is accomplished by finding for hidden links among a series of input data using hidden neural layers where the output of one layer’s neuron will become the input of the next layer [58]. The artificial neuron can be mathematically defined as a non-linear mapping that acts on a weighted sum of its input values and a bias to produce an output based on the formula.
The number of inputs is k, the inputs are , and the weights are represented by wi. Weights are determined according to the relative importance of the inputs in relation to the remaining inputs, while the bias will provide a constant value to the mapping, that can be critical for successful learning [59]. The activation (or transfer) function is the non-linear mapping denoted as controls the neuron’s output by maintaining it in acceptable range, usually between or [60]. Activation functions are classified as linear or non-linear, with non-linear being the most common. Non-linear functions that are frequently used include (ReLU) , often used in recent years, which has become popular in recent years, as well as more traditional sigmoids functions such as logistic function logistic, and the hyperbolic tangent [58]. ReLU is typically used in the hidden layer, whilst Sigmoid is generally used in the output layer [61] due to the fact that the Sigmoid function suffers from gradient vanishing, which can substantially slow down the learning process.
Layers of artificial neurons are made up of individual neurons, each of which has multiple weights and an activation function. As a supervised learning algorithm, a neural network will calculate the weights of its neurons during the training process. In order to improve the accuracy of the network, the output of the network should be as close as possible to the ground truth for the given input data. This is achieved through the use of a loss (or cost) function, which evaluates the reliability of the network with a given set of weights during training. This is typically an iterative process. For a multi-class problem, such as localization, one of the commonly used loss functions is Categorical Cross-Entropy. This function is often used for multi-class classification tasks. The standard weighted categorical cross-entropy loss is given by:
M represents the number of training examples, K represents the number of classes, is the weight for class k, is the target label for training example m for class k, is the input for training example m, and is the model with neural network weights , as cited in [62].
Optimization algorithms are often used during the training phase of neural networks to determine the weights of neurons and minimize the loss function. Examples of these algorithms include Stochastic Gradient Descent (SGD), Adaptive Moment Optimization (Adam), and Root Mean Square Propagation (RMSProp). It is important to carefully choose the learning rate of the model, which determines how much the model should change in response to the estimated error each time it updates its weights. If the learning rate is too high, the model may not be able to find the global minimum and may not converge at all, while if the learning rate is too low, the model may take too long to converge [59].
Algorithm Evaluation Techniques
The research community has used a specific set of evaluation metrics to evaluate different characteristics of the classifier in classification problems such as localization. Confusion matrix, Accuracy, F1-score, and Average Precision (AP).
- Confusion Matrix—A confusion matrix is a tool used to evaluate the performance of a classification model. It is a matrix, where N is the number of target classes, and compares the actual target values with those predicted by the model. This allows us to see how well the classification model is performing and what types of errors it is making.
- Accuracy—It is defined as the model’s overall accuracy or amount of accurate predictions, and it is given using the formula:where and denote the number of correctly classified positive and negative instances. The values and represent the number of incorrectly classified negative and positive instances, respectively.
- F1-score—The F1-score is a metric used to evaluate the performance of a classification model. It is calculated by taking the harmonic mean of Precision and Recall. Precision is the number of accurate positive predictions divided by the total number of positive predictions, and Recall is the number of accurate positive predictions divided by the total number of actual positive instances. The F1-score is calculated using the following formula:This metric provides a balanced measure of the model’s performance, considering both precision and recall [45]. The F1-score will take values within the range, achieving the minimum for , that is, when all positive samples are misclassified, and the maximum for , which is for perfect classification [63]. When dealing with multi-class cases, F1-Score should include all classes. To do so, we need to incorporate a multi-class measure of Precision and Recall into the harmonic mean. These metrics may have two distinct specifications, resulting in two distinct metrics: Micro F1-Score and Macro F1-Score.
- Average Precision—It is the measure that takes into account both Recall and Precision and can be expressed as a function of recall [64]:
5. Results
Neural Network Model for Localization
The following is a presentation of the Neural Network model for localization that was built for LoRa data. The data used to design the NN model were previously detailed in the Data Analysis section.
The data had to be pre-processed for all of the models. The pre-processing included data normalization due to the differing value scales in the collected data.
The input to the LoRa model was the RSSI and SNR values for a particular LoRaWAN gateway. The target values for both models were the sensor locations placed at different positions (0–24). For each sensor, data from all seven LoRaWAN gateways were provided as input to the LoRa model. The data were then divided into training and test sets, the test set comprising 10% of the data.
The training set was divided into a train and a validation set, the validation set also comprising 10% of the data. This stratification helps balance the ratio of training and validation samples for each class, and can reduce biases and variance in the estimated precision [65]. This leads to more consistent predictive performance scores and minimizes potential biases that could be introduced by imbalances in the data set.
Different combinations of hyperparameters used in modeling were tested in order to select the best and most accurate model. In other words, the Adam optimizer was tested with the other hyperparameters presented in Table 2.
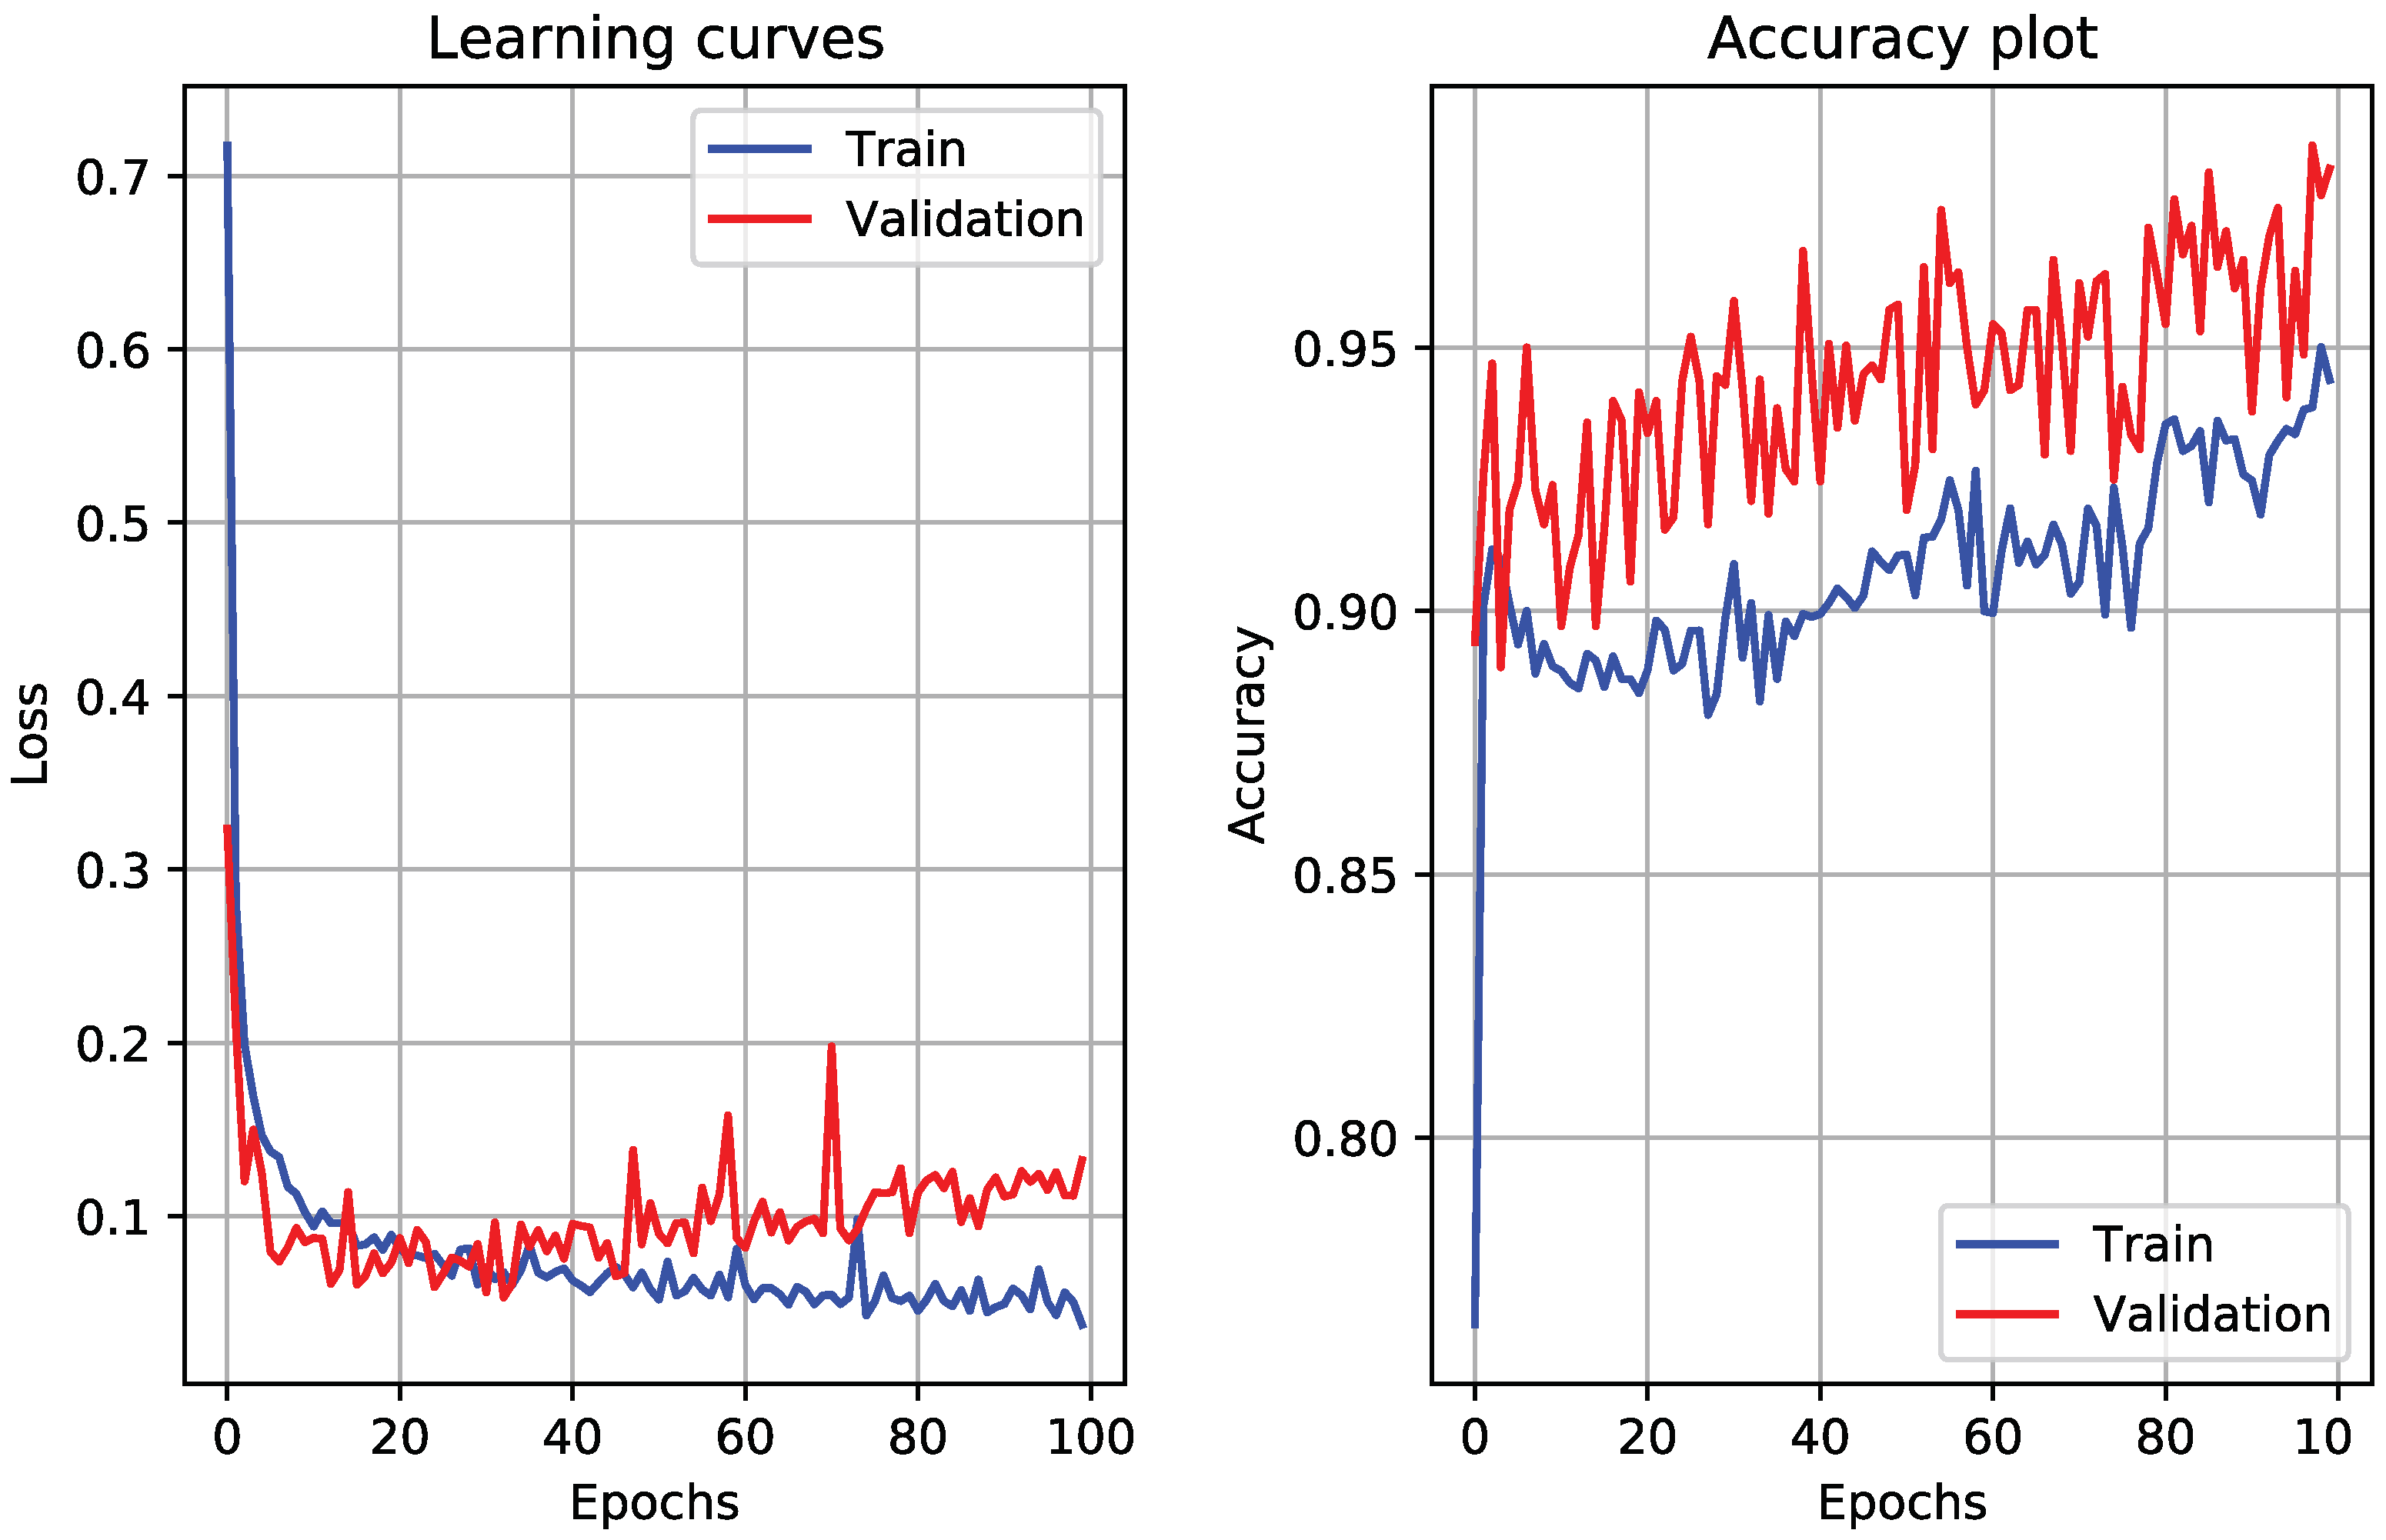
The first results we have obtained are presented in Table 3 regarding the different hyper-parameters combination. As can be seen, the best combination is the 0.01 learning rate for 100 epochs, which achieves 98.8% accuracy on the test set. These findings appear to be consistent with the findings of data analyses, which indicated that RSSI and SNR values could be a distinguishing feature for localization of specific location points.
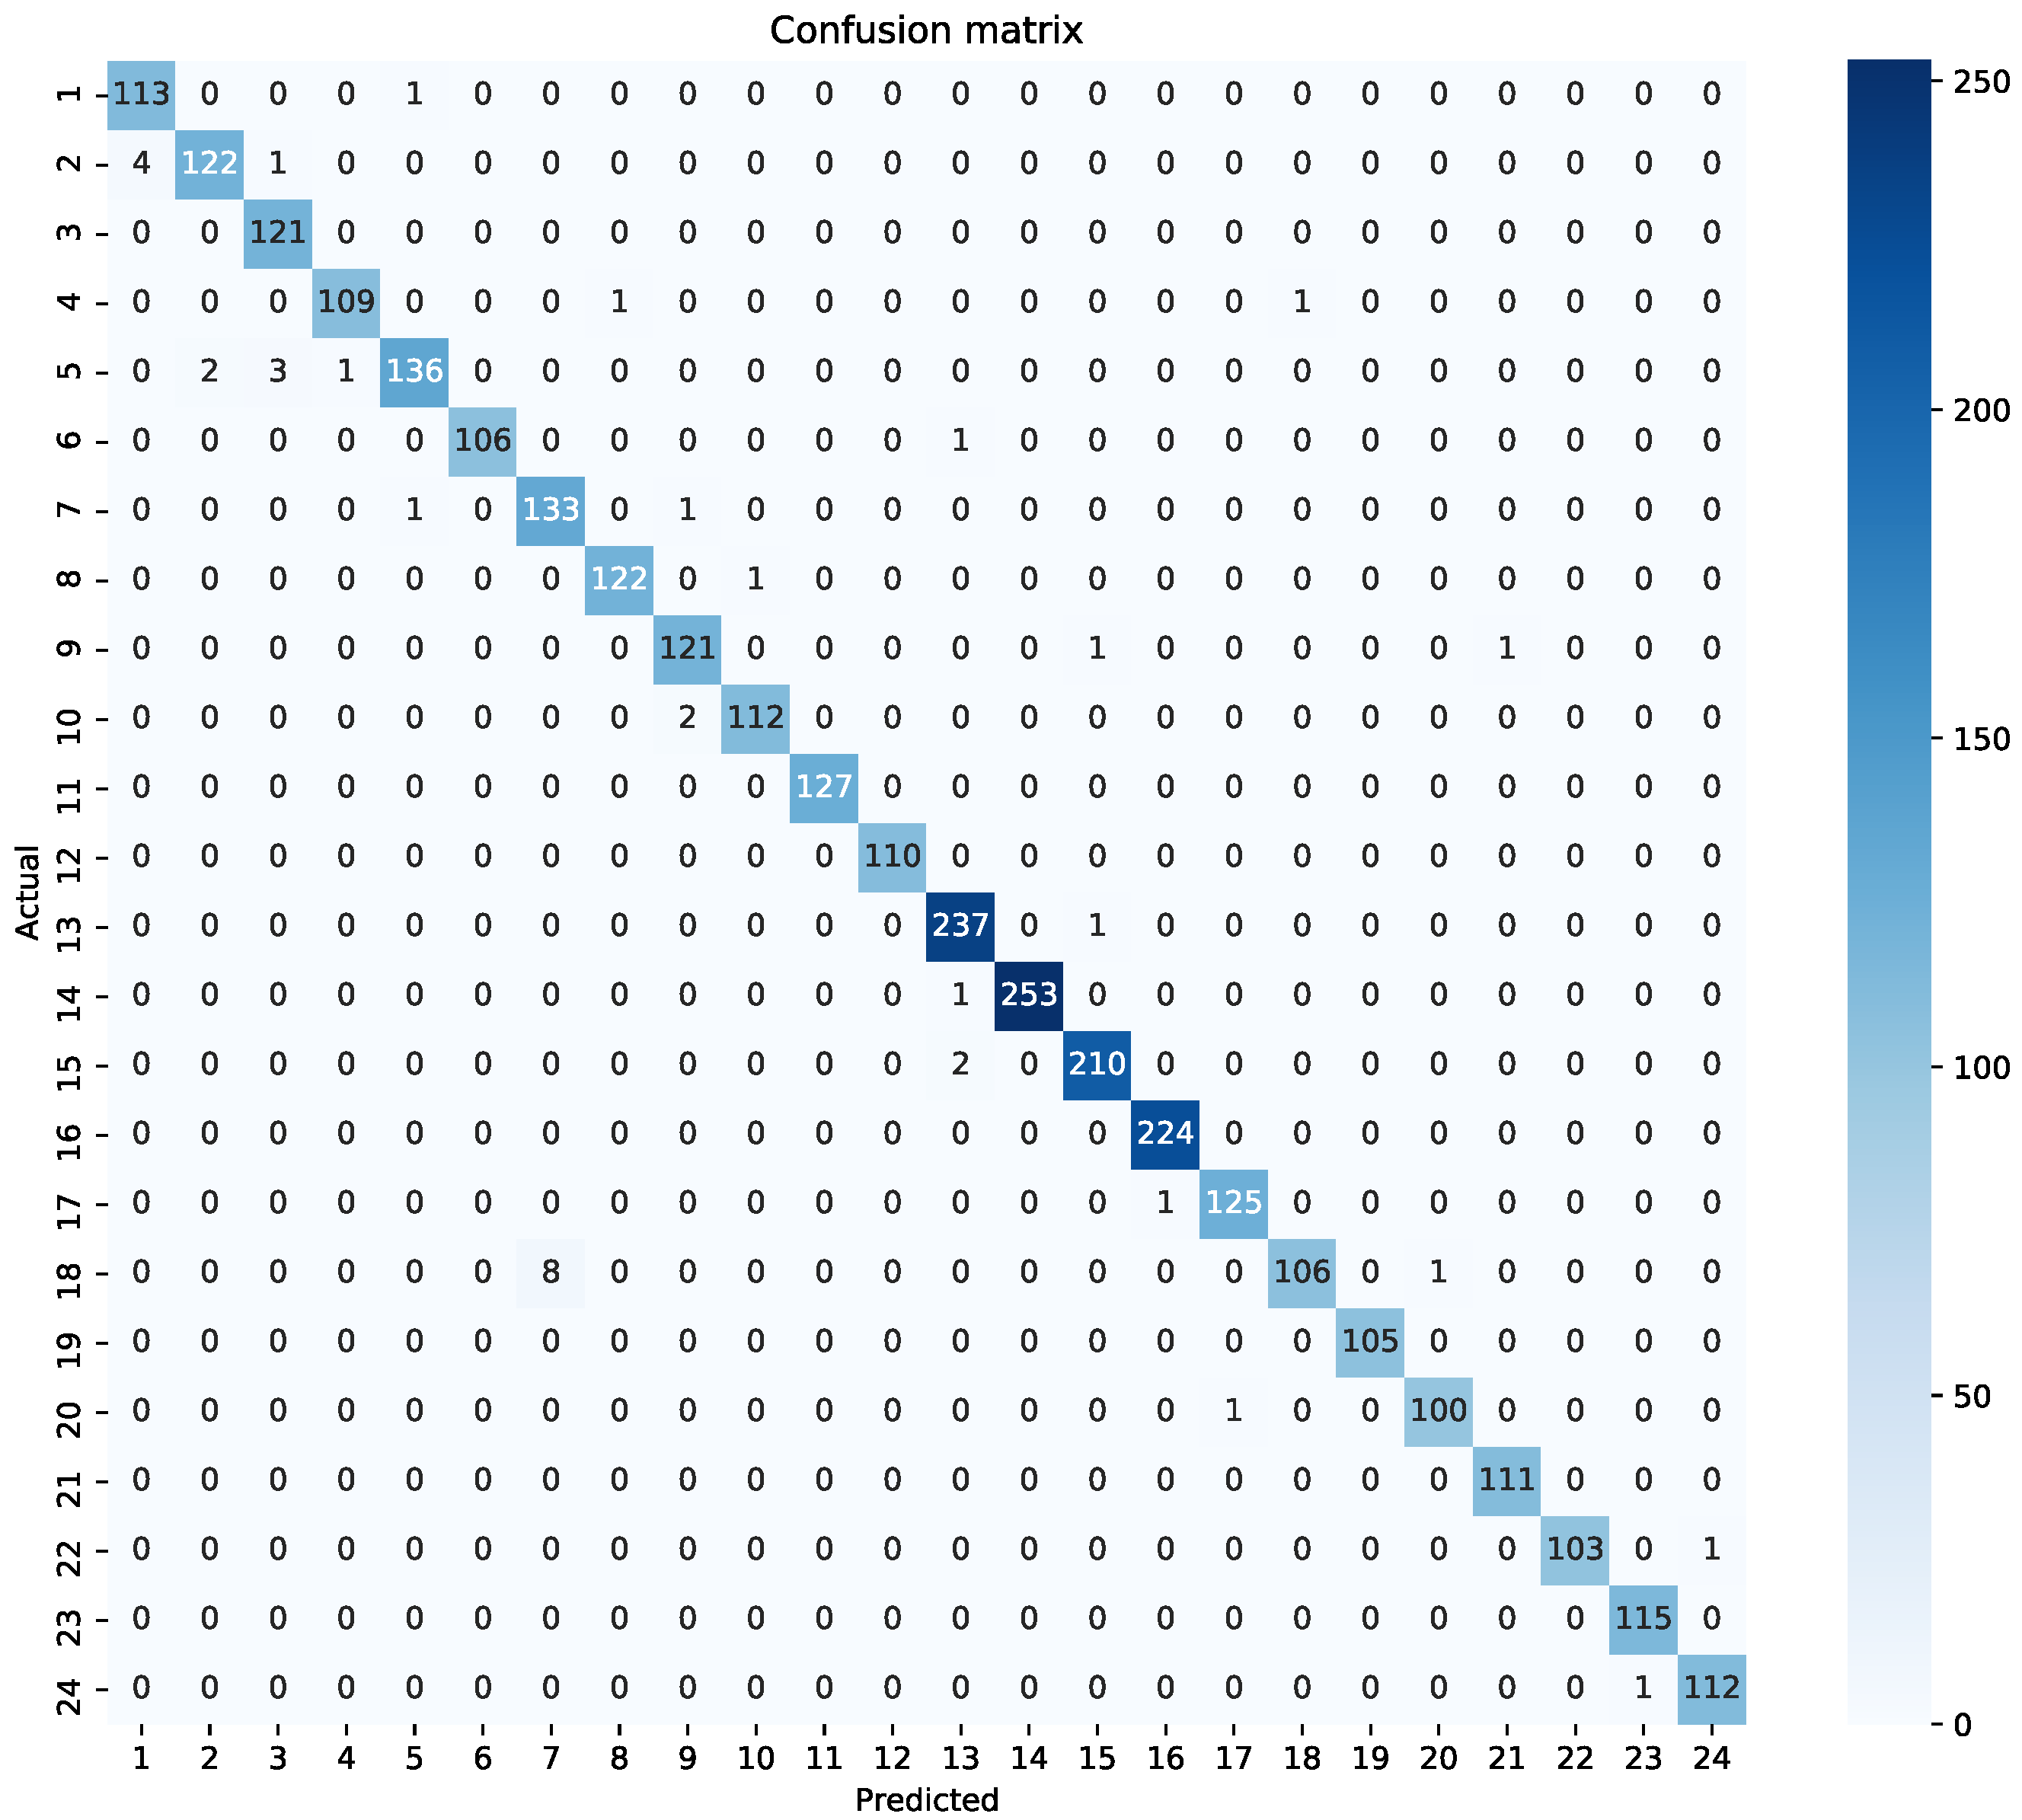
In addition, very good model performance is shown in Figure 19, visualizing the learning curves in the train and validation set, and the accuracy plot. It can be noticed that the model has not yet over-learned the training data set, showing comparable skill on both data sets, and the learning curves are almost in a optimal fit showing that the model has comparable performance. This is also confirmed using the Confusion matrix presented in Figure 20, giving us a holistic view of how well the classification model performs at a particular location point and where it misses the most, i.e., at which point the most miss-classification happened. The results presented in the Confusion matrix also are rather consistent with the observations obtained from the data analyses section, which indicated that possible miss-classification for LoRa data could possibly only occur for locations within the same room.
6. Discussion
The proposed solution uses a train-then-test methodology where a supervised learning technique is used to create a machine learning model for each indoor location based on collected data about signal strength. The model requires information about the signal strength of LoRaWAN packets from sensor devices at each LoRaWAN gateway, as well as the true location of signal capture. Once the model is created, the signal strength information can be used to estimate the location of the IoT device. However, the results of this study are limited to the specific locations from which the data was collected, and future work should examine the use of the proposed models in different locations and usage scenarios.
One limitation of the proposed system is the number of gateways typically available in practice. Normally, a single LoRaWAN gateway can cover a distance of up to 10 km, which may not be sufficient for high localization accuracy in all cases. However, research has shown that a denser deployment of LoRaWAN gateways can improve signal quality, battery life, network scalability, and robustness [66,67]. In the future, it may be possible to further improve the localization performance of the proposed solution by exploring other signal algorithms and combining information from multiple radio signals, such as Wi-Fi and BLE as well as exploring the density of gateways that would achieve good localization accuracy.
7. Conclusions
This paper introduces a system for the indoor localization of devices using variations in the strength of the wireless signal. To estimate the location of the device, a simple beacon is sent over the LoRaWAN channel to multiple gateways to a centralized system that collects information on signal strength (RSSI and SNR). For this purpose, machine learning techniques based on Neural Networks (NN) were used to detect/estimate the position from variation in signal strength. The analyzes of the collected data indicate that the best performance in terms of indoor localization accuracy establishes the LoRaWAN message sent with Spreading Factor SF7. Furthermore, using signal strength measurements, that is, RSSI and SNR captured by LoRaWAN gateways, it is possible to estimate the location of the device point with an accuracy of up to 98.8%. For future work, information on signal strength will be collected over a longer period of time to gain a better understanding of changes in signal strength, while other machine learning algorithms will be considered. Moreover, the realized machine learning models will be deployed on microcontrollers to evaluate the accuracy of device localization in real time.
Author Contributions
The individual contributions of each author are provided as follows: Conceptualization T.P. and L.D.R.; methodology, L.D.R. and T.P.; software, T.P. and L.D.R.; validation, T.P., L.D.R., J.Š. and P.Š.; formal analysis, L.D.R. and T.P.; investigation, L.D.R., T.P., J.Š; resources P.Š.; data curation, P.Š.; writing—original draft preparation T.P. and L.D.R.; writing—review and editing, T.P. and L.D.R.; visualization T.P., L.D.R. and J.Š.; supervision, P.Š.; project administration, P.Š.; funding acquisition, P.Š. All authors have read and agreed to the published version of the manuscript.
Funding
This research was funded by by the Croatian Science Foundation under the project “Internet of Things: Research and Applications”, UIP-2017-05-4206.
Data Availability Statement
Data available on request from the authors.
Conflicts of Interest
The authors declare no conflict of interest.
Abbreviations
The following abbreviations are used in this manuscript:
| IoT | Internet of Things |
| RSSI | Received Signal Strength Indication |
| SNR | Signal-to-noise ratio |
| LPWA | Low Power Wide Area |
| LoRa | Long Range |
| LoRaWAN | Long Range Wide Area Network |
| TTN | The Things Network |
| CF | Carrier Frequency |
| CR | Coding Rate |
| SF | Spreading Factor |
| BW | Bandwidth |
| CRC | Cyclic Redundancy Check |
| CSS | Chrip Spread Spectrum |
| CAD | Channel Activity Detection |
| EDA | Energy Depletion Attack |
| ISM | Industrial, Scientific and Medical |
| NB-IoT | NarrowBand-Internet of Things |
References
- Qin, J. Process Data Analytics in the Era of Big Data. AIChE J. 2014, 60, 3092–3100. [Google Scholar] [CrossRef]
- Dezfouli, B.; Esmaeelzadeh, V.; Sheth, J.; Radi, M. A Review of Software-Defined WLANs: Architectures and Central Control Mechanisms. IEEE Commun. Surv. Tutor. 2018, 21, 431–463. [Google Scholar] [CrossRef] [Green Version]
- Sain, M.; Kang, Y.J.; Lee, H.J. Survey on security in Internet of Things: State of the art and challenges. In Proceedings of the 2017 19th International Conference on Advanced Communication Technology (ICACT), Pyeongchang, Repblic of Korea, 19–22 February 2017; pp. 699–704. [Google Scholar] [CrossRef]
- Sanchez-Iborra, R.; Cano, M.D. State of the Art in LP-WAN Solutions for Industrial IoT Services. Sensors 2016, 16, 708. [Google Scholar] [CrossRef] [PubMed]
- Centenaro, M.; Vangelista, L.; Zanella, A.; Zorzi, M. Long-range communications in unlicensed bands: The rising stars in the IoT and smart city scenarios. IEEE Wirel. Commun. 2016, 23, 60–67. [Google Scholar] [CrossRef] [Green Version]
- Mangalvedhe, N.; Ratasuk, R.; Ghosh, A. NB-IoT deployment study for low power wide area cellular IoT. In Proceedings of the 2016 IEEE 27th Annual International Symposium on Personal, Indoor, and Mobile Radio Communications (PIMRC), Valencia, Spain, 4–8 September 2016; pp. 1–6. [Google Scholar] [CrossRef]
- SubPos—Open Source WiFi Positioning System. Available online: http://www.subpos.org (accessed on 21 May 2017).
- John Dian, F.; Vahidnia, R.; Rahmati, A. Wearables and the Internet of Things (IoT), Applications, Opportunities, and Challenges: A Survey. IEEE Access 2020, 8, 69200–69211. [Google Scholar] [CrossRef]
- Awolusi, I.; Marks, E.; Hallowell, M. Wearable technology for personalized construction safety monitoring and trending: Review of applicable devices. Autom. Constr. 2018, 85, 96–106. [Google Scholar] [CrossRef]
- Asaad, S.M.; Maghdid, H.S. A Comprehensive Review of Indoor/Outdoor Localization Solutions in IoT Era: Research Challenges and Future Perspectives. Comput. Netw. 2022, 212, 109041. [Google Scholar] [CrossRef]
- Ometov, A.; Shubina, V.; Klus, L.; SkibiÅska, J.; Saafi, S.; Pascacio, P.; Flueratoru, L.; Gaibor, D.Q.; Chukhno, N.; Chukhno, O.; et al. A Survey on Wearable Technology: History, State-of-the-Art and Current Challenges. Comput. Netw. 2021, 193, 108074. [Google Scholar] [CrossRef]
- Yang, C.; Shao, H. WiFi-based indoor positioning. IEEE Commun. Mag. 2015, 53, 150–157. [Google Scholar] [CrossRef]
- Hsieh, H.Y.; Prakosa, S.W.; Leu, J.Š. Towards the Implementation of Recurrent Neural Network Schemes for WiFi Fingerprint-Based Indoor Positioning. In Proceedings of the 2018 IEEE 88th Vehicular Technology Conference (VTC-Fall), Chicago, IL, USA, 27–30 August 2018; IEEE: Piscataway, NJ, USA, 2018; pp. 1–5. [Google Scholar]
- Liedmann, F.; Holewa, C.; Wietfeld, C. The radio field as a sensor—A segmentation based soil moisture sensing approach. In Proceedings of the 2018 IEEE Sensors Applications Symposium, SAS 2018, Seoul, South Korea, 12–14 March 2018; IEEE: Piscataway, NJ, USA, 2018; pp. 1–6. [Google Scholar]
- Liedmann, F.; Wietfeld, C. SoMoS—A Multidimensional Radio Field Based Soil Moisture Sensing System. In Proceedings of the IEEE Sensors, Glasgow, UK, 29 October–1 November 2017. [Google Scholar]
- Anagnostopoulos, G.G.; Kalousis, A. A Reproducible Comparison of RSSI Fingerprinting Localization Methods Using LoRaWAN. In Proceedings of the 2019 16th Workshop on Positioning, Navigation and Communications (WPNC), Bremen, Germany, 23–24 October 2019; pp. 1–6. [Google Scholar] [CrossRef] [Green Version]
- Kotaru, M.; Joshi, K.; Bharadia, D.; Katti, S. SpotFi: Decimeter Level Localization Using WiFi. In Proceedings of the 2015 ACM Conference on Special Interest Group on Data Communication, London, UK, 17–21 August 2015; Association for Computing Machinery: New York, NY, USA, 2015; pp. 269–282. [Google Scholar] [CrossRef]
- Soltanaghaei, E.; Kalyanaraman, A.; Whitehouse, K. Multipath Triangulation: Decimeter-Level WiFi Localization and Orientation with a Single Unaided Receiver. In Proceedings of the 16th Annual International Conference on Mobile Systems, Applications, and Services, Munich, Germany, 10–15 June 2018; Association for Computing Machinery: New York, NY, USA, 2018; pp. 376–388. [Google Scholar] [CrossRef]
- Vasisht, D.; Kumar, S.; Katabi, D. Decimeter-Level Localization with a Single WiFi Access Point. In Proceedings of the 13th Usenix Conference on Networked Systems Design and Implementation, Santa Clara, CA, USA, 16–18 March 2016; USENIX Association: Santa Clara, CA, USA, 2016; pp. 165–178. [Google Scholar]
- Xiong, J.; Sundaresan, K.; Jamieson, K. ToneTrack: Leveraging Frequency-Agile Radios for Time-Based Indoor Wireless Localization. In Proceedings of the 21st Annual International Conference on Mobile Computing and Networking, Paris, France, 7–11 September 2015; Association for Computing Machinery: New York, NY, USA, 2015; pp. 537–549. [Google Scholar] [CrossRef] [Green Version]
- Bargh, M.S.; de Groote, R. Indoor Localization Based on Response Rate of Bluetooth Inquiries. In Proceedings of the First ACM International Workshop on Mobile Entity Localization and Tracking in GPS-Less Environments, San Francisco, CA, USA, 14–19 September 2008; Association for Computing Machinery: New York, NY, USA, 2008; pp. 49–54. [Google Scholar] [CrossRef]
- Hou, X.; Arslan, T. Monte Carlo localization algorithm for indoor positioning using Bluetooth low energy devices. In Proceedings of the 2017 International Conference on Localization and GNSS (ICL-GNSS), Nottingham, UK, 27–29 June 2017; pp. 1–6. [Google Scholar] [CrossRef]
- Lazik, P.; Rajagopal, N.; Shih, O.; Sinopoli, B.; Rowe, A. ALPS: A Bluetooth and Ultrasound Platform for Mapping and Localization. In Proceedings of the 13th ACM Conference on Embedded Networked Sensor Systems, Seoul, Republic of Korea, 1–4 November 2015; Association for Computing Machinery: New York, NY, USA, 2015; pp. 73–84. [Google Scholar] [CrossRef]
- Kumar, S.; Hamed, E.; Katabi, D.; Erran Li, L. LTE Radio Analytics Made Easy and Accessible. In Proceedings of the 2014 ACM Conference on SIGCOMM, Chicago, IL, USA, 17–22 August 2014; Association for Computing Machinery: New York, NY, USA, 2014; pp. 211–222. [Google Scholar] [CrossRef]
- Sun, G.; Chen, J.; Guo, W.; Liu, K.R. Signal processing techniques in network-aided positioning: A survey of state-of-the-art positioning designs. IEEE Signal Process. Mag. 2005, 22, 12–23. [Google Scholar] [CrossRef]
- Ma, Y.; Selby, N.; Adib, F. Minding the Billions: Ultra-Wideband Localization for Deployed RFID Tags. In Proceedings of the 23rd Annual International Conference on Mobile Computing and Networking, Snowbird, UT, USA, 16–20 October 2017; Association for Computing Machinery: New York, NY, USA, 2017; pp. 248–260. [Google Scholar] [CrossRef]
- Nandakumar, R.; Iyer, V.; Gollakota, S. 3D Localization for Sub-Centimeter Sized Devices. In Proceedings of the 16th ACM Conference on Embedded Networked Sensor Systems, Shenzhen, China, 4–7 November 2018; Association for Computing Machinery: New York, NY, USA, 2018; pp. 108–119. [Google Scholar] [CrossRef]
- Vasisht, D.; Zhang, G.; Abari, O.; Lu, H.M.; Flanz, J.; Katabi, D. In-Body Backscatter Communication and Localization. In Proceedings of the 2018 Conference of the ACM Special Interest Group on Data Communication, Budapest, Hungary, 20–25 August 2018; Association for Computing Machinery: New York, NY, USA, 2018; pp. 132–146. [Google Scholar] [CrossRef] [Green Version]
- Chen, L.; Xiong, J.; Chen, X.; Lee, S.I.; Chen, K.; Han, D.; Fang, D.; Tang, Z.; Wang, Z. WideSee: Towards Wide-Area Contactless Wireless Sensing. In Proceedings of the 17th Conference on Embedded Networked Sensor Systems, New York, NY, USA, 10–13 November 2019; Association for Computing Machinery: New York, NY, USA, 2019; pp. 258–270. [Google Scholar] [CrossRef]
- Sadowski, S.; Spachos, P. RSSI-Based Indoor Localization With the Internet of Things. IEEE Access 2018, 6, 30149–30161. [Google Scholar] [CrossRef]
- Anjum, M.; Khan, M.A.; Ali Hassan, S.; Mahmood, A.; Gidlund, M. Analysis of RSSI Fingerprinting in LoRa Networks. In Proceedings of the 2019 15th International Wireless Communications & Mobile Computing Conference (IWCMC), Tangier, Morocco, 24–28 June 2019; pp. 1178–1183. [Google Scholar] [CrossRef] [Green Version]
- Zhu, H.; Tsang, K.F.; Liu, Y.; Wei, Y.; Wang, H.; Wu, C.K.; Chi, H.R. Extreme RSS Based Indoor Localization for LoRaWAN With Boundary Autocorrelation. IEEE Trans. Ind. Inform. 2021, 17, 4458–4468. [Google Scholar] [CrossRef]
- Kim, K.; Li, S.; Heydariaan, M.; Smaoui, N.; Gnawali, O.; Suh, W.; Suh, M.J.; Kim, J.I. Feasibility of LoRa for Smart Home Indoor Localization. Appl. Sci. 2021, 11, 415. [Google Scholar] [CrossRef]
- Fernandes, C.D.; Depari, A.; Sisinni, E.; Ferrari, P.; Flammini, A.; Rinaldi, S.; Pasetti, M. Hybrid indoor and outdoor localization for elderly care applications with LoRaWAN. In Proceedings of the 2020 IEEE International Symposium on Medical Measurements and Applications (MeMeA), Bari, Italy, 1 June–1 July 2020; pp. 1–6. [Google Scholar] [CrossRef]
- Lu, K.; Yue, Y.; Ma, J. Enhanced LoRaWAN RSSI Indoor Localization Based on BP Neural Network. In Proceedings of the 2021 IEEE 4th International Conference on Information Systems and Computer Aided Education (ICISCAE), Dalian, China, 24–26 September 2021; pp. 190–195. [Google Scholar] [CrossRef]
- Liu, J.; Gao, J.; Jha, S.; Hu, W. Seirios: Leveraging Multiple Channels for LoRaWAN Indoor and Outdoor Localization. In Proceedings of the 27th Annual International Conference on Mobile Computing and Networking, New Orleans, LA, USA, 25–29 October 2021; Association for Computing Machinery: New York, NY, USA, 2021; pp. 656–669. [Google Scholar] [CrossRef]
- Bansal, A.; Gadre, A.; Singh, V.; Rowe, A.; Iannucci, B.; Kumar, S. OwLL: Accurate LoRa Localization Using the TV Whitespaces. In Proceedings of the 20th International Conference on Information Processing in Sensor Networks (Co-Located with CPS-IoT Week 18–21 May, 2021); Association for Computing Machinery: New York, NY, USA, 2021; pp. 148–162. [Google Scholar] [CrossRef]
- Guo, D.; Gu, C.; Jiang, L.; Luo, W.; Tan, R. ILLOC: In-Hall Localization with Standard LoRaWAN Uplink Frames. Proc. ACM Interact. Mob. Wearable Ubiquitous Technol. 2022, 6, 1–26. [Google Scholar] [CrossRef]
- Svertoka, E.; Rusu-Casandra, A.; Burget, R.; Marghescu, I.; Hosek, J.; Ometov, A. LoRaWAN: Lost for Localization? IEEE Sens. J. 2022, 22, 23307–23319. [Google Scholar] [CrossRef]
- Lora Alliance. LoRaWAN 1.1 Specification, October 2017. Available online: http://lora-alliance.org/lorawan-for-developers (accessed on 28 February 2021).
- Goursaud, C.; Gorce, J.M. Dedicated networks for IoT: PHY/MAC state of the art and challenges. EAI Endorsed Trans. Internet Things 2015, 1–11. [Google Scholar] [CrossRef]
- LoRa Alliance Technical Committee. Available online: https://lora-alliance.org/resource_hub/lorawan-specification-v1-0-3/ (accessed on 28 February 2021).
- Mitchell, T.M. Machine Learning; McGraw-Hill: New York, NY, USA, 1997. [Google Scholar]
- Turing, A.M. Computing Machinery and Intelligence. Mind 1950, 59, 433–460. [Google Scholar] [CrossRef]
- Sarkar, D.; Bali, R.; Sharma, T. Practical Machine Learning with Python: A Problem-Solver’s Guide to Building Real-World Intelligent Systems, 1st ed.; Apress: Berkely, CA, USA, 2017. [Google Scholar]
- Zantalis, F.; Koulouras, G.; Karabetsos, S.; Kandris, D. A Review of Machine Learning and IoT in Smart Transportation. Future Internet 2019, 11, 94. [Google Scholar] [CrossRef] [Green Version]
- Goodfellow, I.; Bengio, Y.; Courville, A. Deep Learning; MIT Press: Cambridge, MA, USA, 2016. [Google Scholar]
- Garca, S.; Luengo, J.; Herrera, F. Data Preprocessing in Data Mining; Springer Publishing Company, Incorporated: Berlin/Heidelberg, Germany, 2014. [Google Scholar]
- Mohammed, M.; Khan, M.; Bashier, E. Machine Learning: Algorithms and Applications; Taylor & Francis: Abingdon, UK, 2016. [Google Scholar]
- Ravindran, B. Chapter 23—Relativized hierarchical decomposition of Markov decision processes. In Decision Making; Progress in Brain Research; Elsevier: Amsterdam, The Netherlands, 2013; Volume 202, pp. 465–488. [Google Scholar] [CrossRef]
- Bhattacharya, S.; Somayaji, S.; Gadekallu, T.; Maddikunta, M.A.P. A Review on Deep Learning for Future Smart Cities. Internet Technol. Lett. 2020, 5, e187. [Google Scholar] [CrossRef]
- Zhu, X.X.; Tuia, D.; Mou, L.; Xia, G.; Zhang, L.; Xu, F.; Fraundorfer, F. Deep Learning in Remote Sensing: A Comprehensive Review and List of Resources. IEEE Geosci. Remote Sens. Mag. 2017, 5, 8–36. [Google Scholar] [CrossRef]
- Shinde, P.P.; Shah, S. A Review of Machine Learning and Deep Learning Applications. In Proceedings of the 2018 Fourth International Conference on Computing Communication Control and Automation (ICCUBEA), Pune, India, 16–18 August 2018; pp. 1–6. [Google Scholar] [CrossRef]
- Sarkar, D.; Bali, R.; Sharma, T. Practical Machine Learning with Python; Apress: Berkely, CA, USA, 2018. [Google Scholar]
- Abiodun, O.I.; Kiru, M.U.; Jantan, A.; Omolara, A.E.; Dada, K.V.; Umar, A.M.; Linus, O.U.; Arshad, H.; Kazaure, A.A.; Gana, U. Comprehensive Review of Artificial Neural Network Applications to Pattern Recognition. IEEE Access 2019, 7, 158820–158846. [Google Scholar] [CrossRef]
- Zhou, Y.T.; Chellappa, R. Artificial Neural Networks for Computer Vision/Yi-Tong Zhou, Rama Chellappa; Springer-Verlag: New York, NY, USA, 1992; 170p. [Google Scholar]
- Hewamalage, H.; Bergmeir, C.; Bandara, K. Recurrent Neural Networks for Time Series Forecasting: Current Status and Future Directions. arXiv 2019, arXiv:1909.00590. [Google Scholar] [CrossRef]
- Dujić Rodić, L.; Perković, T.; Škiljo, M.; Šolić, P. Privacy leakage of LoRaWAN smart parking occupancy sensors. Future Gener. Comput. Syst. 2023, 138, 142–159. [Google Scholar] [CrossRef]
- Provoost, J.; Wismans, L.; der Drift, S.V.; Kamilaris, A.; Keulen, M.V. Short Term Prediction of Parking Area states Using Real Time Data and Machine Learning Techniques. arXiv 2019, arXiv:1911.13178. [Google Scholar]
- Hagan, M.T.; Demuth, H.B.; Beale, M. Neural Network Design, 2nd ed.; Oklahoma State University: Stillwater, OK, USA, 2014. [Google Scholar]
- Hayou, S.; Doucet, A.; Rousseau, J. On the Impact of the Activation function on Deep Neural Networks Training. In Proceedings of the 36th International Conference on Machine Learning, Long Beach, CA, USA, 9–15 June 2019; Chaudhuri, K., Salakhutdinov, R., Eds.; PMLR: Long Beach, CA, USA, 2019; Volume 97, pp. 2672–2680. [Google Scholar]
- Ho, Y.; Wookey, S. The Real-World-Weight Cross-Entropy Loss Function: Modeling the Costs of Mislabeling. IEEE Access 2020, 8, 4806–4813. [Google Scholar] [CrossRef]
- Chicco, D.; Jurman, G. The advantages of the Matthews correlation coefficient (MCC) over F1 score and accuracy in binary classification evaluation. BMC Genom. 2020, 21, 6. [Google Scholar] [CrossRef] [Green Version]
- Martin-Abadal, M.; Ruiz-Frau, A.; Hinz, H.; Gonzalez-Cid, Y. Jellytoring: Real-Time Jellyfish Monitoring Based on Deep Learning Object Detection. Sensors 2020, 20, 1708. [Google Scholar] [CrossRef] [Green Version]
- Zeng, X.; Martinez, T. Distribution-Balanced Stratified Cross-Validation for Accuracy Estimation. J. Exp. Theor. Artif. Intell. 2001, 12, 1–12. [Google Scholar] [CrossRef]
- Dongare, A.; Narayanan, R.; Gadre, A.; Luong, A.; Balanuta, A.; Kumar, S.; Iannucci, B.; Rowe, A. Charm: Exploiting Geographical Diversity through Coherent Combining in Low-Power Wide-Area Networks. In Proceedings of the 2018 17th ACM/IEEE International Conference on Information Processing in Sensor Networks (IPSN), Porto, Portugal, 11–13 April 2018; pp. 60–71. [Google Scholar] [CrossRef]
- Liu, J.; Xu, W.; Jha, S.; Hu, W. Nephalai: Towards LPWAN C-RAN with Physical Layer Compression. In Proceedings of the 26th Annual International Conference on Mobile Computing and Networking, London, UK, 21–25 September 2020; Association for Computing Machinery: New York, NY, USA, 2020. [Google Scholar] [CrossRef]
Figure 1.
Indoor localization using LoRaWAN.

Figure 2.
LoRaWAN (Long Range Wide Area Network) architecture.

Figure 3.
Scheme of ESP32 device connected to RFM95 module that implements LoRa communication.

Figure 4.
Glamos devices that implement ESP32 microcontroller with WiFi along with RFM95 module with for LoRa communication.
Figure 4.
Glamos devices that implement ESP32 microcontroller with WiFi along with RFM95 module with for LoRa communication.

Figure 5.
Measurement locations.

Figure 6.
Snapshot of a LoRa Dataframe for location 1, room A507.

Figure 7.
Data correlation for RSSI and SNR values for ROOM A507 and location points 2 and 3.

Figure 8.
Data correlation for RSSI and SNR values for ROOM A507 and location points 2 and 4.

Figure 9.
Data correlation for RSSI and SNR values for ROOM A509 and location points 9 and 11.

Figure 10.
Histogram of RSSI values from gateway 3 for ROOM A509 for location points 9 and 11.

Figure 11.
Data correlation for RSSI and SNR values for ROOM A509 and location points 9 and 10 for SF 9.
Figure 11.
Data correlation for RSSI and SNR values for ROOM A509 and location points 9 and 10 for SF 9.

Figure 12.
Data correlation for RSSI and SNR values for ROOM A509 and location points 9 and 11 for SF 9.
Figure 12.
Data correlation for RSSI and SNR values for ROOM A509 and location points 9 and 11 for SF 9.

Figure 13.
Histogram of RSSI values from gateway 5 for ROOM A509 for location points 9 and 11.

Figure 14.
Data correlation for RSSI and SNR values for ROOM A507 and location points 9 and 11 for SF 11.
Figure 14.
Data correlation for RSSI and SNR values for ROOM A507 and location points 9 and 11 for SF 11.

Figure 15.
Data correlation for RSSI and SNR values for ROOM A507 and location points 10 and 11 for SF11.
Figure 15.
Data correlation for RSSI and SNR values for ROOM A507 and location points 10 and 11 for SF11.

Figure 16.
Data correlation for RSSI and SNR values for ROOM A507 and location points 11 and 12 for SF 11.
Figure 16.
Data correlation for RSSI and SNR values for ROOM A507 and location points 11 and 12 for SF 11.

Figure 17.
Histogram of RSSI values from gateway zero for ROOM A509 for location points 9 and 11.

Figure 18.
Example of a Neural Network Architecture.

Figure 19.
Learning curves and Accuracy plot for LoRa data for 0.01 learning rate and 100 epochs.

Figure 20.
Confusion matrix for LoRa data for 0.01 learning rate and 100 epochs.


Table 1.
List of used hardware and software.
| Hardware | Software | |
|---|---|---|
| LoRaWAN GW | ML Machine | |
| 3 × RPi with iC880A and 10 dBi ant. | Intel [email protected] GHz | Keras2.3.1. |
| 2 × RPi with RAK831 and 8 dBi ant. | 16 GB of RAM | cuDNN |
| NVIDIA GeForce GTX 1050 | ||
Table 2.
Selection of hyper parameters for designing the NN models.
| Hyper Parameter | Values |
|---|---|
| Number of neurons | Layer1—192, Layer2—96, Layer3—24 |
| Learning rate | 0.001, 0.01 |
| Number of epochs | 50, 100, 150 |
| Batch size | 64 |
Table 3.
Results of first Neural Network model for Adaptive Moment Optimization (Adam) optimizer using signal strength data from LoRa.
Table 3.
Results of first Neural Network model for Adaptive Moment Optimization (Adam) optimizer using signal strength data from LoRa.
| Learn. Rate | Epochs | Acc. | Macro Avg | Weighted Avg | |||||
|---|---|---|---|---|---|---|---|---|---|
| Precision | Recall | F-Score | Precision | Recall | F-Score | ||||
| train | 0.01 | 50 | 0.9428 | 0.9467 | 0.9345 | 0.9339 | 0.9523 | 0.9428 | 0.9419 |
| val | 0.01 | 50 | 0.9375 | 0.9432 | 0.9280 | 0.9263 | 0.9502 | 0.9375 | 0.9361 |
| test | 0.01 | 50 | 0.9413 | 0.9450 | 0.9336 | 0.9337 | 0.9494 | 0.9413 | 0.9406 |
| train | 0.001 | 50 | 0.9341 | 0.9521 | 0.9232 | 0.9140 | 0.9577 | 0.9341 | 0.9257 |
| val | 0.001 | 50 | 0.9303 | 0.9496 | 0.9188 | 0.9079 | 0.9558 | 0.9303 | 0.9208 |
| test | 0.001 | 50 | 0.9330 | 0.9509 | 0.9162 | 0.9096 | 0.9540 | 0.9330 | 0.9243 |
| train | 0.01 | 100 | 0.9906 | 0.9904 | 0.9897 | 0.9898 | 0.9910 | 0.9906 | 0.9905 |
| val | 0.01 | 100 | 0.9840 | 0.9835 | 0.9818 | 0.9823 | 0.9845 | 0.9840 | 0.9839 |
| test | 0.01 | 100 | 0.9880 | 0.9880 | 0.9872 | 0.9875 | 0.9882 | 0.9880 | 0.9880 |
| train | 0.001 | 100 | 0.9289 | 0.9462 | 0.9167 | 0.9066 | 0.9529 | 0.9289 | 0.9196 |
| val | 0.001 | 100 | 0.9205 | 0.94102 | 0.9077 | 0.8965 | 0.9477 | 0.9205 | 0.9109 |
| test | 0.001 | 100 | 0.9263 | 0.9446 | 0.9080 | 0.9008 | 0.9485 | 0.9263 | 0.9166 |
| train | 0.01 | 150 | 0.9617 | 0.9666 | 0.9556 | 0.9545 | 0.9705 | 0.9617 | 0.9606 |
| val | 0.01 | 150 | 0.9524 | 0.9594 | 0.94777 | 0.9438 | 0.96557 | 0.9524 | 0.95053 |
| test | 0.01 | 150 | 0.9590 | 0.9645 | 0.9532 | 0.9533 | 0.9669 | 0.9590 | 0.9583 |
| train | 0.001 | 150 | 0.9359 | 0.9510 | 0.9246 | 0.9042 | 0.9585 | 0.9359 | 0.9188 |
| val | 0.001 | 150 | 0.9252 | 0.9419 | 0.9209 | 0.8992 | 0.9500 | 0.9252 | 0.9084 |
| test | 0.001 | 150 | 0.9391 | 0.95427 | 0.9217 | 0.9050 | 0.9595 | 0.9391 | 0.9237 |
Disclaimer/Publisher’s Note: The statements, opinions and data contained in all publications are solely those of the individual author(s) and contributor(s) and not of MDPI and/or the editor(s). MDPI and/or the editor(s) disclaim responsibility for any injury to people or property resulting from any ideas, methods, instructions or products referred to in the content. |
© 2023 by the authors. Licensee MDPI, Basel, Switzerland. This article is an open access article distributed under the terms and conditions of the Creative Commons Attribution (CC BY) license (https://creativecommons.org/licenses/by/4.0/).
Share and Cite
MDPI and ACS Style
Perković, T.; Dujić Rodić, L.; Šabić, J.; Šolić, P. Machine Learning Approach towards LoRaWAN Indoor Localization. Electronics 2023, 12, 457. https://doi.org/10.3390/electronics12020457
AMA Style
Perković T, Dujić Rodić L, Šabić J, Šolić P. Machine Learning Approach towards LoRaWAN Indoor Localization. Electronics. 2023; 12(2):457. https://doi.org/10.3390/electronics12020457
Chicago/Turabian StylePerković, Toni, Lea Dujić Rodić, Josip Šabić, and Petar Šolić. 2023. "Machine Learning Approach towards LoRaWAN Indoor Localization" Electronics 12, no. 2: 457. https://doi.org/10.3390/electronics12020457
Note that from the first issue of 2016, this journal uses article numbers instead of page numbers. See further details here.