Article

Digital Transformation Management of Supply Chain Firms Based on Big Data from DeFi Social Media Profiles

by
Damianos P. Sakas
1,
Nikolaos T. Giannakopoulos
1,*,
Marina C. Terzi
1,
Nikos Kanellos
1 and
Angelos Liontakis
2
1
BICTEVAC Laboratory—Business Information and Communication Technologies in Value Chains Laboratory, Department of Agribusiness and Supply Chain Management, School of Applied Economics and Social Sciences, Agricultural University of Athens, 118 55 Athens, Greece
2
Orimas Laboratory—Organizational Innovation and Management Systems, Department of Agribusiness and Supply Chain Management, School of Applied Economics and Social Sciences, Agricultural University of Athens, 118 55 Athens, Greece
*
Author to whom correspondence should be addressed.
Electronics 2023, 12(20), 4219; https://doi.org/10.3390/electronics12204219
Submission received: 5 September 2023 / Revised: 8 October 2023 / Accepted: 10 October 2023 / Published: 12 October 2023
(This article belongs to the Special Issue Data-Driven Digital Transformation in Industry 4.0)

Abstract

:
Emerging technologies in the digital context can favor industrial sector firms in their aim to improve their performance. Digitalization is mainly expressed through the utilization of big data that originate from various sources. Blockchain technology has led to the extended adoption of capitalization of Decentralized Finance (DeFi) services, such as cryptocurrency trade platforms. Supply chain firms, in their quest to exploit any means and collaborations available to promote their services, could place advertisements on DeFi’s social media profiles to boost their financial performance. Social media analytics, as a part of the big data family, are an emerging tool for promoting a firm’s digital transformation, based on the plethora of customer behavioral data they provide. This study aims to examine whether the social media analytics of DeFi platforms are capable of affecting their website visibility, as well as the financial performance of supply chain firms. To do so, the authors collected data from the social media profiles of the most-known DeFi platforms and web analytics from the most significant supply chain firms’ websites. For this purpose, proper statistical analysis, Fuzzy Cognitive Mapping, Hybrid Modeling, and Cognitive Neuromarketing models were adopted. Throughout the present research, it has been discerned that from an increase in the social media analytics of DeFi platforms, their website visibility increases, while the organic and paid traffic costs of supply chain firms decrease. Supply chain firms’ website customers tend to increase at the same time.

1. Introduction

1.1. Supply Chain Firms’ Digital Transformation Importance

In recent years, the rapid advancement of digital technologies has ushered in an era of profound transformation across industries [1]. Emerging technologies and innovative gadgets such as smartphones, computers, driverless cars, and smart wearable devices have fundamentally reshaped the methods through which customers both acquire and distribute information [2]. These advancements have led to a seismic shift in how online users connect with the world, making information more readily available and easily shareable than ever before [3]. The various innovations and digital advancements are making their mark on every sector, and supply chains are undoubtedly no exception to this trend [4]. The process of digitalization within supply chains now includes not only digital products and services but also involves managing the various supply chain processes within companies that find themselves amidst these swift and transformative changes [5]. As organizations strive to stay competitive and efficient, the integration of digital solutions and the effective utilization of data have become imperatives for success [6,7].
A firm with robust operational resilience can promptly acclimate to emerging circumstances and swiftly redistribute its resources to facilitate a speedy recuperation process [8]. Amidst a plethora of strategies aimed at enhancing operational resilience, it is discerned that digital transformation stands out as a preeminent approach to the revival and restoration of business operations [9]. Urbinati et al. [9] present compelling evidence that underscores the pivotal role played by digital transformation as a primary catalyst, actively facilitating the growth of innovative capacities within firms [10]. To sustain a competitive edge within the ever-evolving landscape, enterprises are compelled to periodically refresh and update their digital infrastructure [11].
Nevertheless, the impact of digital transformation varies across state-owned enterprises and large corporations. According to Xue et al. [11], the influence of digital transformation on a company’s operational aspects is intricately linked to both its size and distinctive characteristics [12]. Similarly, in a study by Wu et al. [12], it is disclosed that organizational innovation operates as an intermediate factor between digital technology and firm performance [13]. Furthermore, their findings indicate that the utilization of digital technology not only enhances the process of digital transformation but also contributes to the augmentation of organizational innovation.
In this unstable and rapidly changing setting, companies must stand out from their counterparts by effectively leveraging digital transformation within the realm of e-commerce logistics, to foster growth [14]. Companies are employing sophisticated analytic tools to realize digital transformation goals, foster the development of sustainable communities [15], and, consequently, elevate interactions and collaborations with customers. The significance of digital transformation for supply chain companies cannot be overstated. Embracing digital technologies and strategies is essential for supply chain firms to enhance operational efficiency, streamline processes, improve collaboration across the supply chain network, and adapt to dynamic market demands [16]. This transformation enables real-time visibility into inventory levels, demand patterns, and delivery schedules, leading to better decision making and reduced lead times [17]. Overall, the adoption of digital transformation ensures that supply chain firms remain competitive, agile, and capable of meeting the evolving needs of both customers and partners in today’s rapidly changing business landscape.
The role of technological advancement in intricate scientific exploration and the responsible allocation of digital resources during this digital age is widely acknowledged [18]. This involves upgrading its digital infrastructure through the integration of cloud computing, big data, artificial intelligence, and internet-based solutions, all aimed at augmenting operational effectiveness [19]. By leveraging distinctive consensus mechanisms and compatible encryption algorithms [20], blockchain technology (BCT) enables organizations to decrease transaction costs, such as negotiation, search, intermediary involvement, and information technology frameworks. Moreover, it automates the processes of aggregating, amending, and sharing data, thus eliminating the need for manual interventions [21]. Consequently, blockchain presents a remarkable opportunity for companies to elevate their operational efficiency.
The research topic of the paper focuses on the assessment of DeFi platforms’ social media in favor of supply chain firms’ promotion and digital transformation. The introductory part is a comprehensive analysis of the present studies and findings of the related literature, followed by the Section 2, where the authors present the formulation of the methodological context, as well as provide information regarding the sample and the settlement of the research hypotheses. In the Results section, multiple analyses have been performed (correlation, linear regression, Hybrid Modeling, cognitive neuromarketing) to extract the necessary outcomes for the research, while in the Discussion and Conclusions sections, these outcomes are elaborated to produce important practical and theoretical insights.

1.2. Financial Performance of Firms’ Digital Transformation through Emerging Technologies Adoption (DeFi)

Lately, there has been a noticeable trend within supply chain firms to increasingly adopt emerging technologies, including Artificial Intelligence (AI), the Internet of Things (IoT), and blockchain, as a means of revolutionizing their operational paradigms [22]. Concurrently, the emergence of novel technological domains, such as Decentralized Finance (DeFi), has introduced a transformative influence on the conventional landscape of financial services. DeFi, underpinned by blockchain and cryptocurrency, orchestrates a fundamental reconfiguration of traditional financial activities, proffering alternatives characterized by decentralization, security, and automation [23].
By embracing the innovative solutions furnished by DeFi, these entities are afforded entry into a realm of financial mechanisms characterized by decentralization and engendering efficiencies materialized through automated procedures [24]. The inherently decentralized architecture of DeFi engenders a potential for supply chain corporations to avail themselves of decentralized liquidity pools and novel avenues for funding, thereby engendering refined strategies for capital management and the plausible reduction in borrowing expenditures [25]. Through the mechanization of intricate fiscal processes, the eradication of intermediary entities, and the abatement of the susceptibilities attributed to manual errors, these firms are poised to cultivate operational efficiencies that seamlessly transpose into heightened financial performance [26].
Furthermore, DeFi’s intrinsic ability to facilitate seamless cross-border transactions and currency conversions introduces a heightened level of efficiency to the domain of international supply chain operations, thereby engendering a milieu of cost-effectiveness that augments favorable financial ramifications [27]. DeFi’s distinctive attributes transcend these aforementioned advantages, extending to encompass the concept of asset tokenization—a transformative mechanism with the potential to fundamentally reshape the financial landscape for entities operating within the supply chain sphere [28]. This innovative paradigm possesses the potency to reconfigure extant financial strategies inherent to supply chain operations, thereby constituting a profound paradigm shift within the realm.
Amidst the envisaged advantages, it becomes imperative to meticulously deliberate upon the potential hazards. The incorporation of Decentralized Finance (DeFi) invariably introduces an aspect of volatility through its reliance on cryptocurrencies, necessitating prudent attention. An eminent challenge pertains to the imperative realm of risk management and security. While DeFi ostensibly presents a framework characterized by decentralization and security, it remains susceptible to vulnerabilities [29]. The neglect of these crucial facets could potentially culminate in subjecting enterprises to substantial fiscal losses and the erosion of their standing in the eyes of stakeholders. Within an expeditiously evolving sphere, judicious decision making holds paramount importance in optimizing financial performance at the dynamic crossroads of supply chain and DeFi technologies [30].

1.3. Digital Transformation, Big Data, and Social Media Analytics

The increasing digitalization of supply chain firms has been complemented by the utilization of big data to enhance financial performance [31]. Within the context of DeFi-enabled supply chains, substantial volumes of data are generated throughout various stages of operations. Employing advanced analytics, supply chain firms can extract valuable insights from this data, leading to optimized inventory management, demand prediction, and risk mitigation [32]. Such analytical metrics in the digital marketing sector include KPIs such as organic/paid traffic, organic/paid traffic costs, number of website visitors, and their bounce rate [33].
Social media analytics mainly concern metrics such as the posts’ impression, profiles’ total followers, followers’ growth, and post interaction [34]. Supply chain firms can effectively monitor social media platforms to gauge customer sentiment, track market trends, and identify emerging demands [35]. Analyzing social media conversations, for example, can uncover shifts in consumer preferences, allowing firms to adapt their strategies promptly. Furthermore, engagement with the DeFi community on social media platforms fosters brand loyalty and trust, crucial factors in the context of a decentralized and trust-driven ecosystem [35]. The convergence of these technologies offers a spectrum of benefits for supply chain firms operating within the DeFi sphere, such as enhanced visibility into supply chain processes, heightened efficiency, and real-time insights that enable firms to respond agilely to dynamic market changes [36].
By strategically engaging with the DeFi community through these platforms, supply chain firms can extend their audience reach, leading to increased traffic to their websites and enhanced opportunities for conversions and sales [37]. Analyzing sentiment on DeFi social media platforms empowers firms to gauge community reactions to their products or services, directly influencing potential customer decisions and consequently impacting financial performance [38]. For supply chain firms opting to advertise on DeFi social media platforms, integrating big data and social media analytics becomes an essential driver of targeted engagement and financial optimization. [35,38]. Employing big data and social media analytics enables firms to tailor their marketing efforts precisely to the DeFi community’s preferences [39].
Notably, social media analytics encompass sentiment analysis, offering insights into users’ feelings toward specific products, services, or marketing campaigns [40]. This information enables firms to adapt their messaging and offerings according to prevailing sentiment within the DeFi community. The analysis of engagement rates, click-through rates, and conversion rates through social media analytics facilitates the measurement of advertising campaign effectiveness in real time, fostering the ability to make necessary adjustments promptly and ensure dynamic and responsive campaigns [41]. Integrating big data and social media analytics also aids in evaluating the return on investment (ROI) more comprehensively [42]. By tracking key metrics related to user engagement, acquisition costs, and revenue generated from DeFi social media advertising campaigns, firms can quantitatively evaluate the financial impact of their efforts, allowing for resource allocation efficiency and maximization of financial gains within the DeFi ecosystem [43].

2. Materials and Methods

The social media analytics of the selected DeFi platforms have been noted as the main factor for initiating supply chain firms’ digital transformation. The goal of the research is to assess the impact of social media analytics of DeFi platforms on both their digital marketing performance, as well as on the marketing and financial aspects of supply chain firms’ performance. The paper’s context follows the three stages mentioned below, to support and empower the research findings.
  • In the first stage, a comprehensive statistical analysis, which includes correlation and SLR models (simple linear regression) based on the collected big data from the social media profiles and websites of the sample’s firms, shows the potential strong relationships between DeFi social media and supply chain performance metrics. Moreover, the deployment of a diagnostic model for both the DeFi and the supply chain websites is being provided in the same stage. For this model, the capitalization of Fuzzy Cognitive Mapping processes took place to present a map of the potential relationships among the study’s entities.
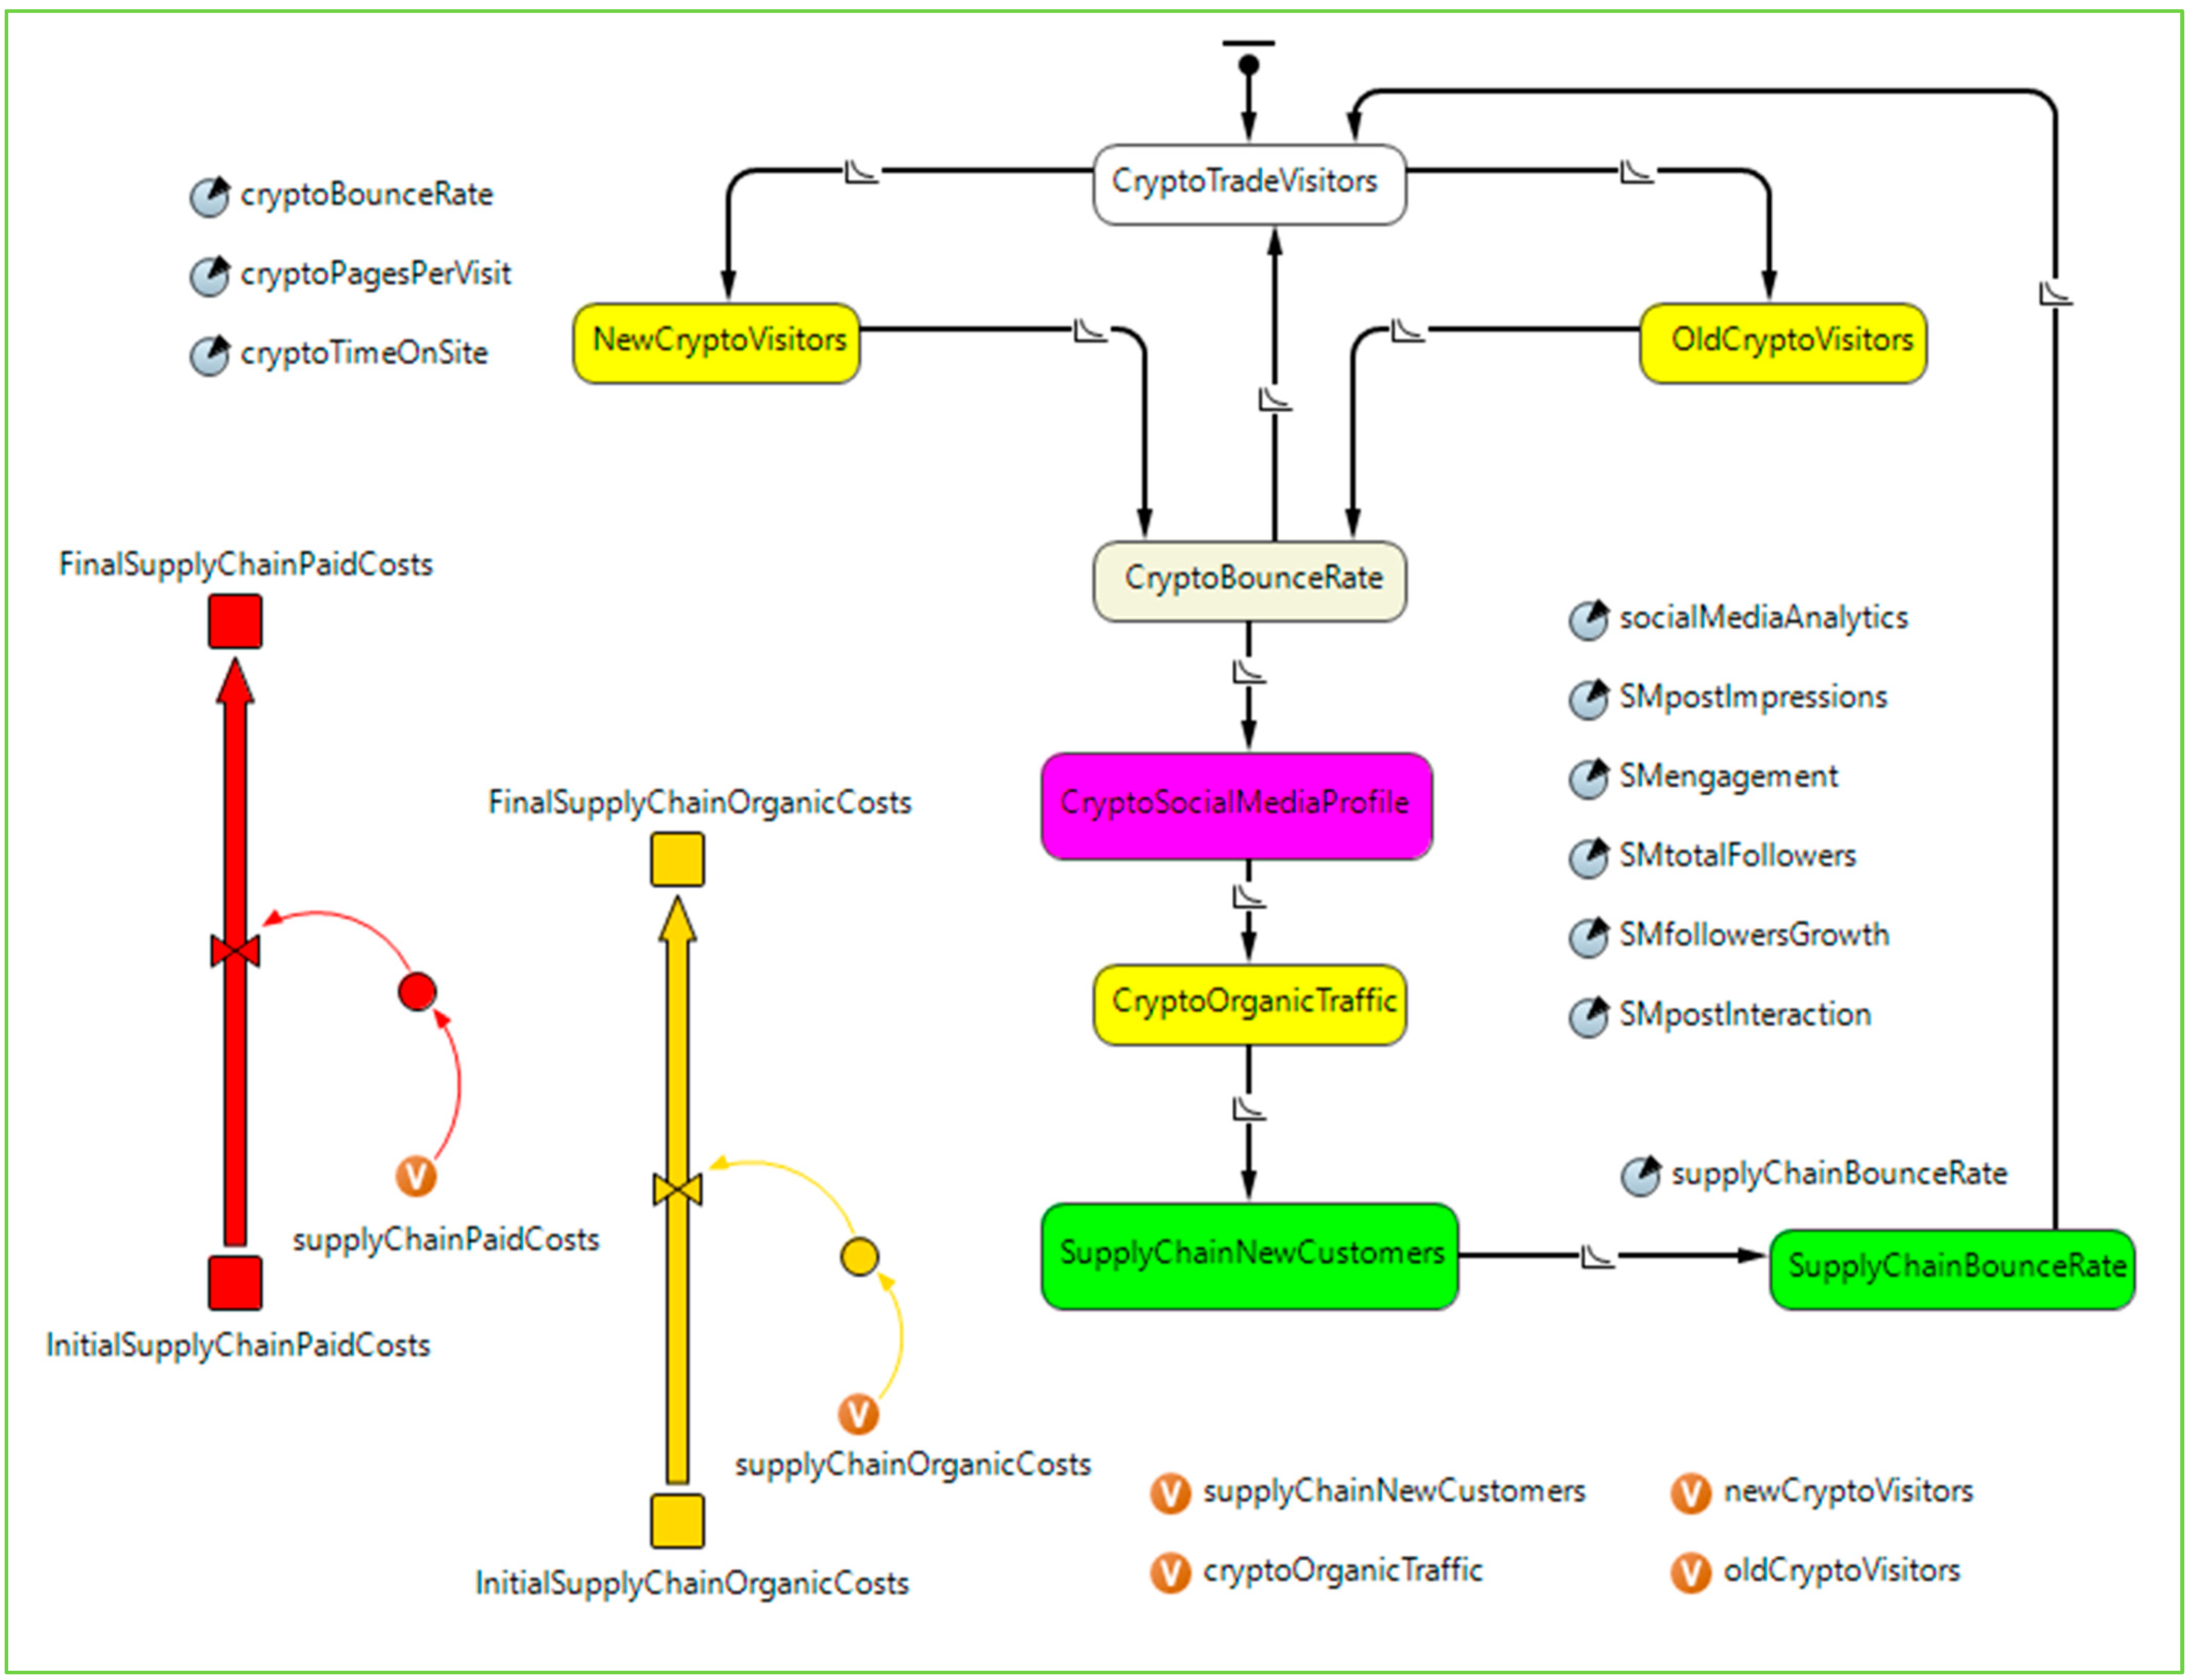
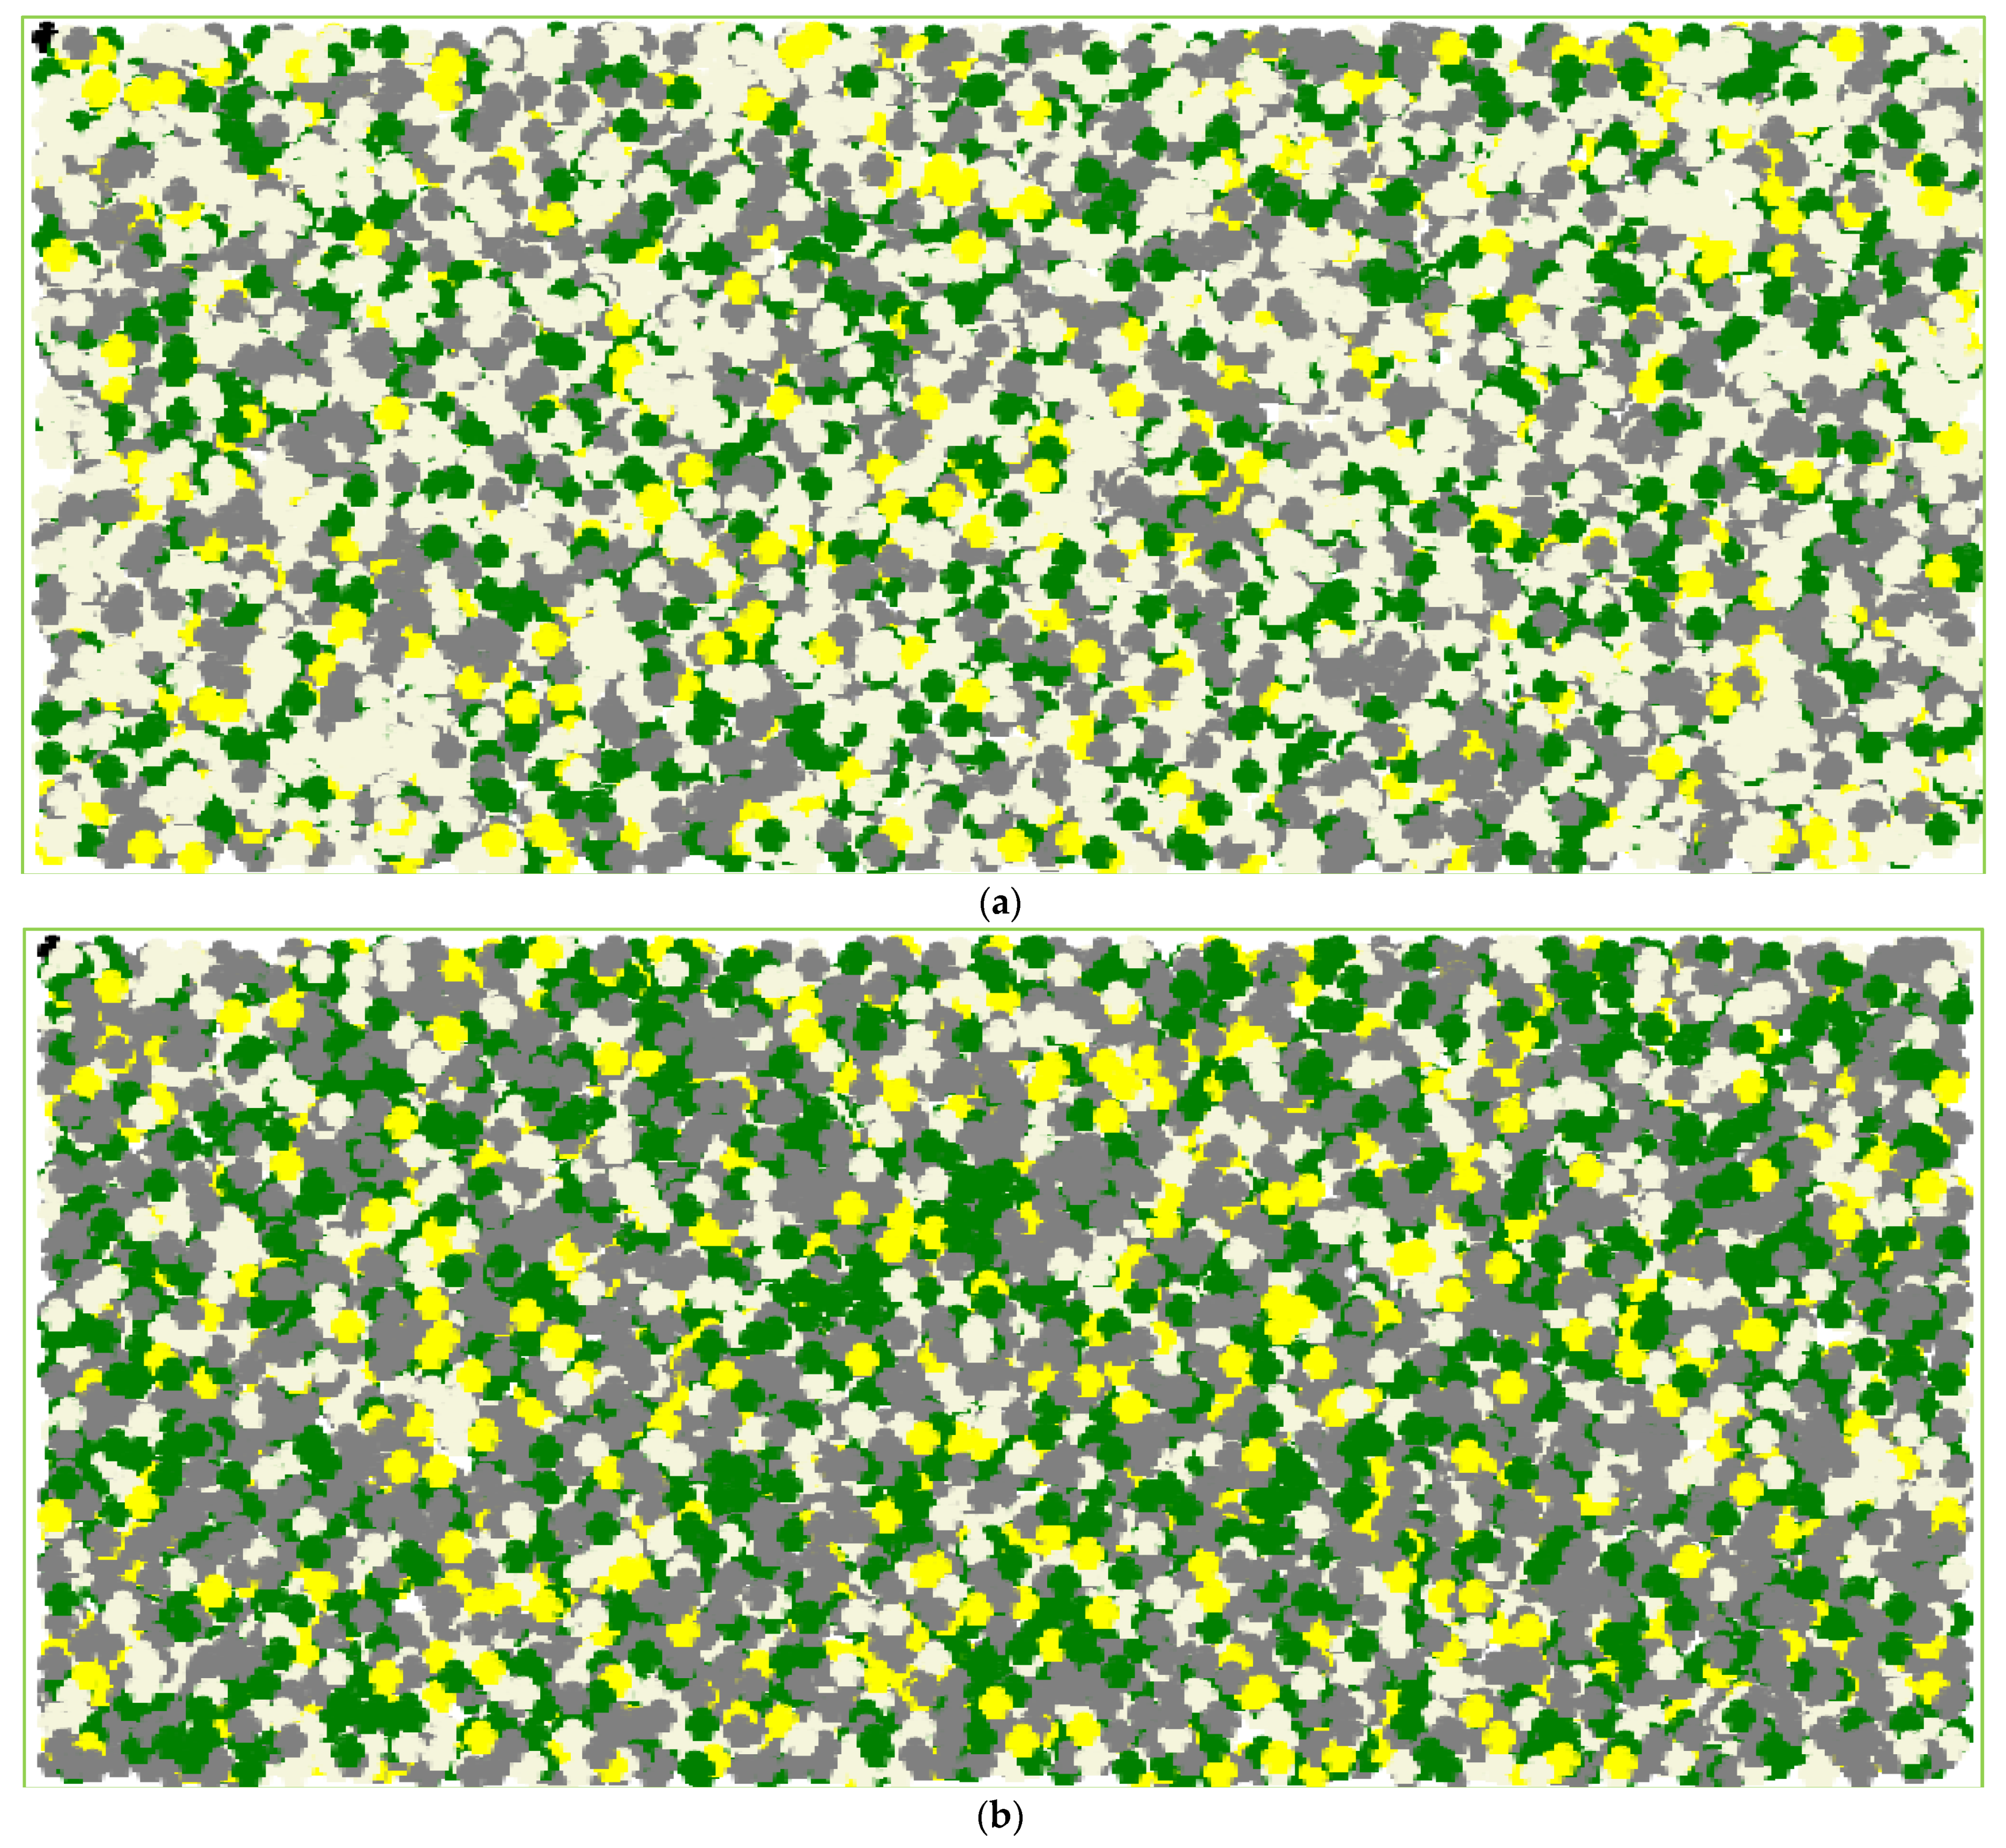
  • The next stage of the methodological context concerns the development of a hybrid simulation model that utilizes both Agent-Based Modeling (ABM) and System Dynamics (SD) procedures. Decision Support Systems (DSS) enable the modeling process the authors need to capitalize to simulate the variation in the online behavior of DeFi platforms and supply chain firms’ websites and social media profile visitors.
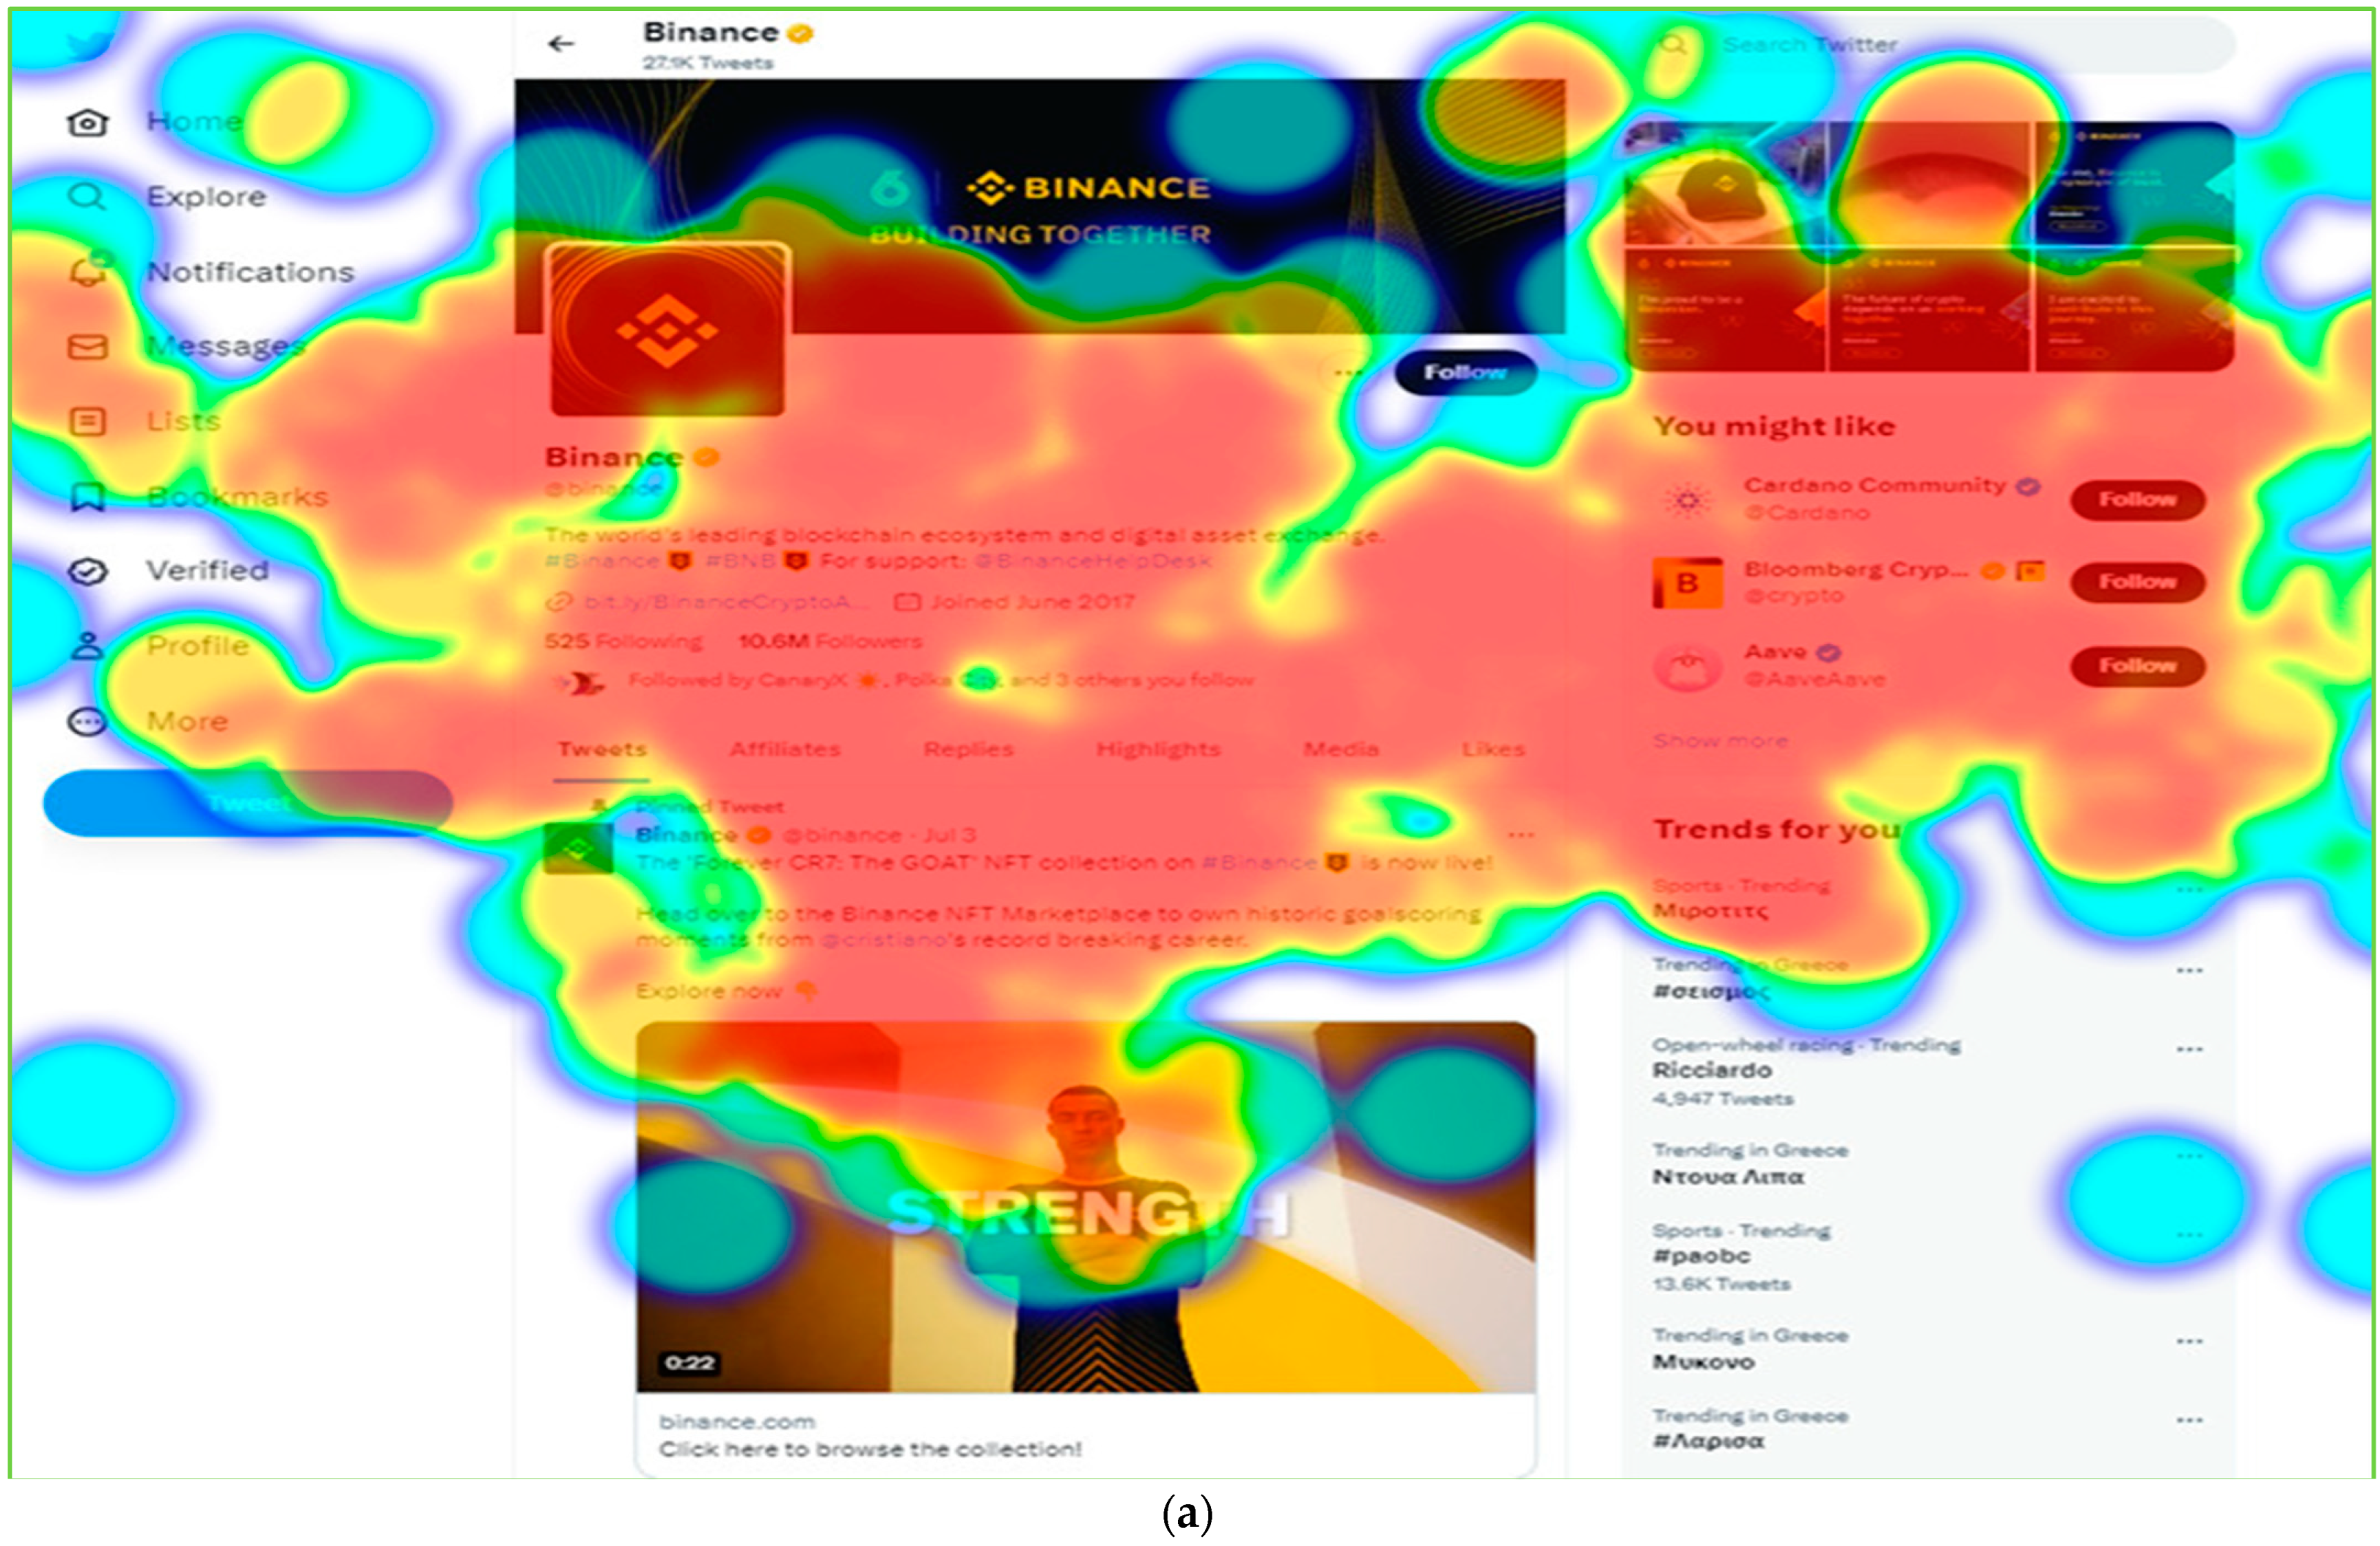
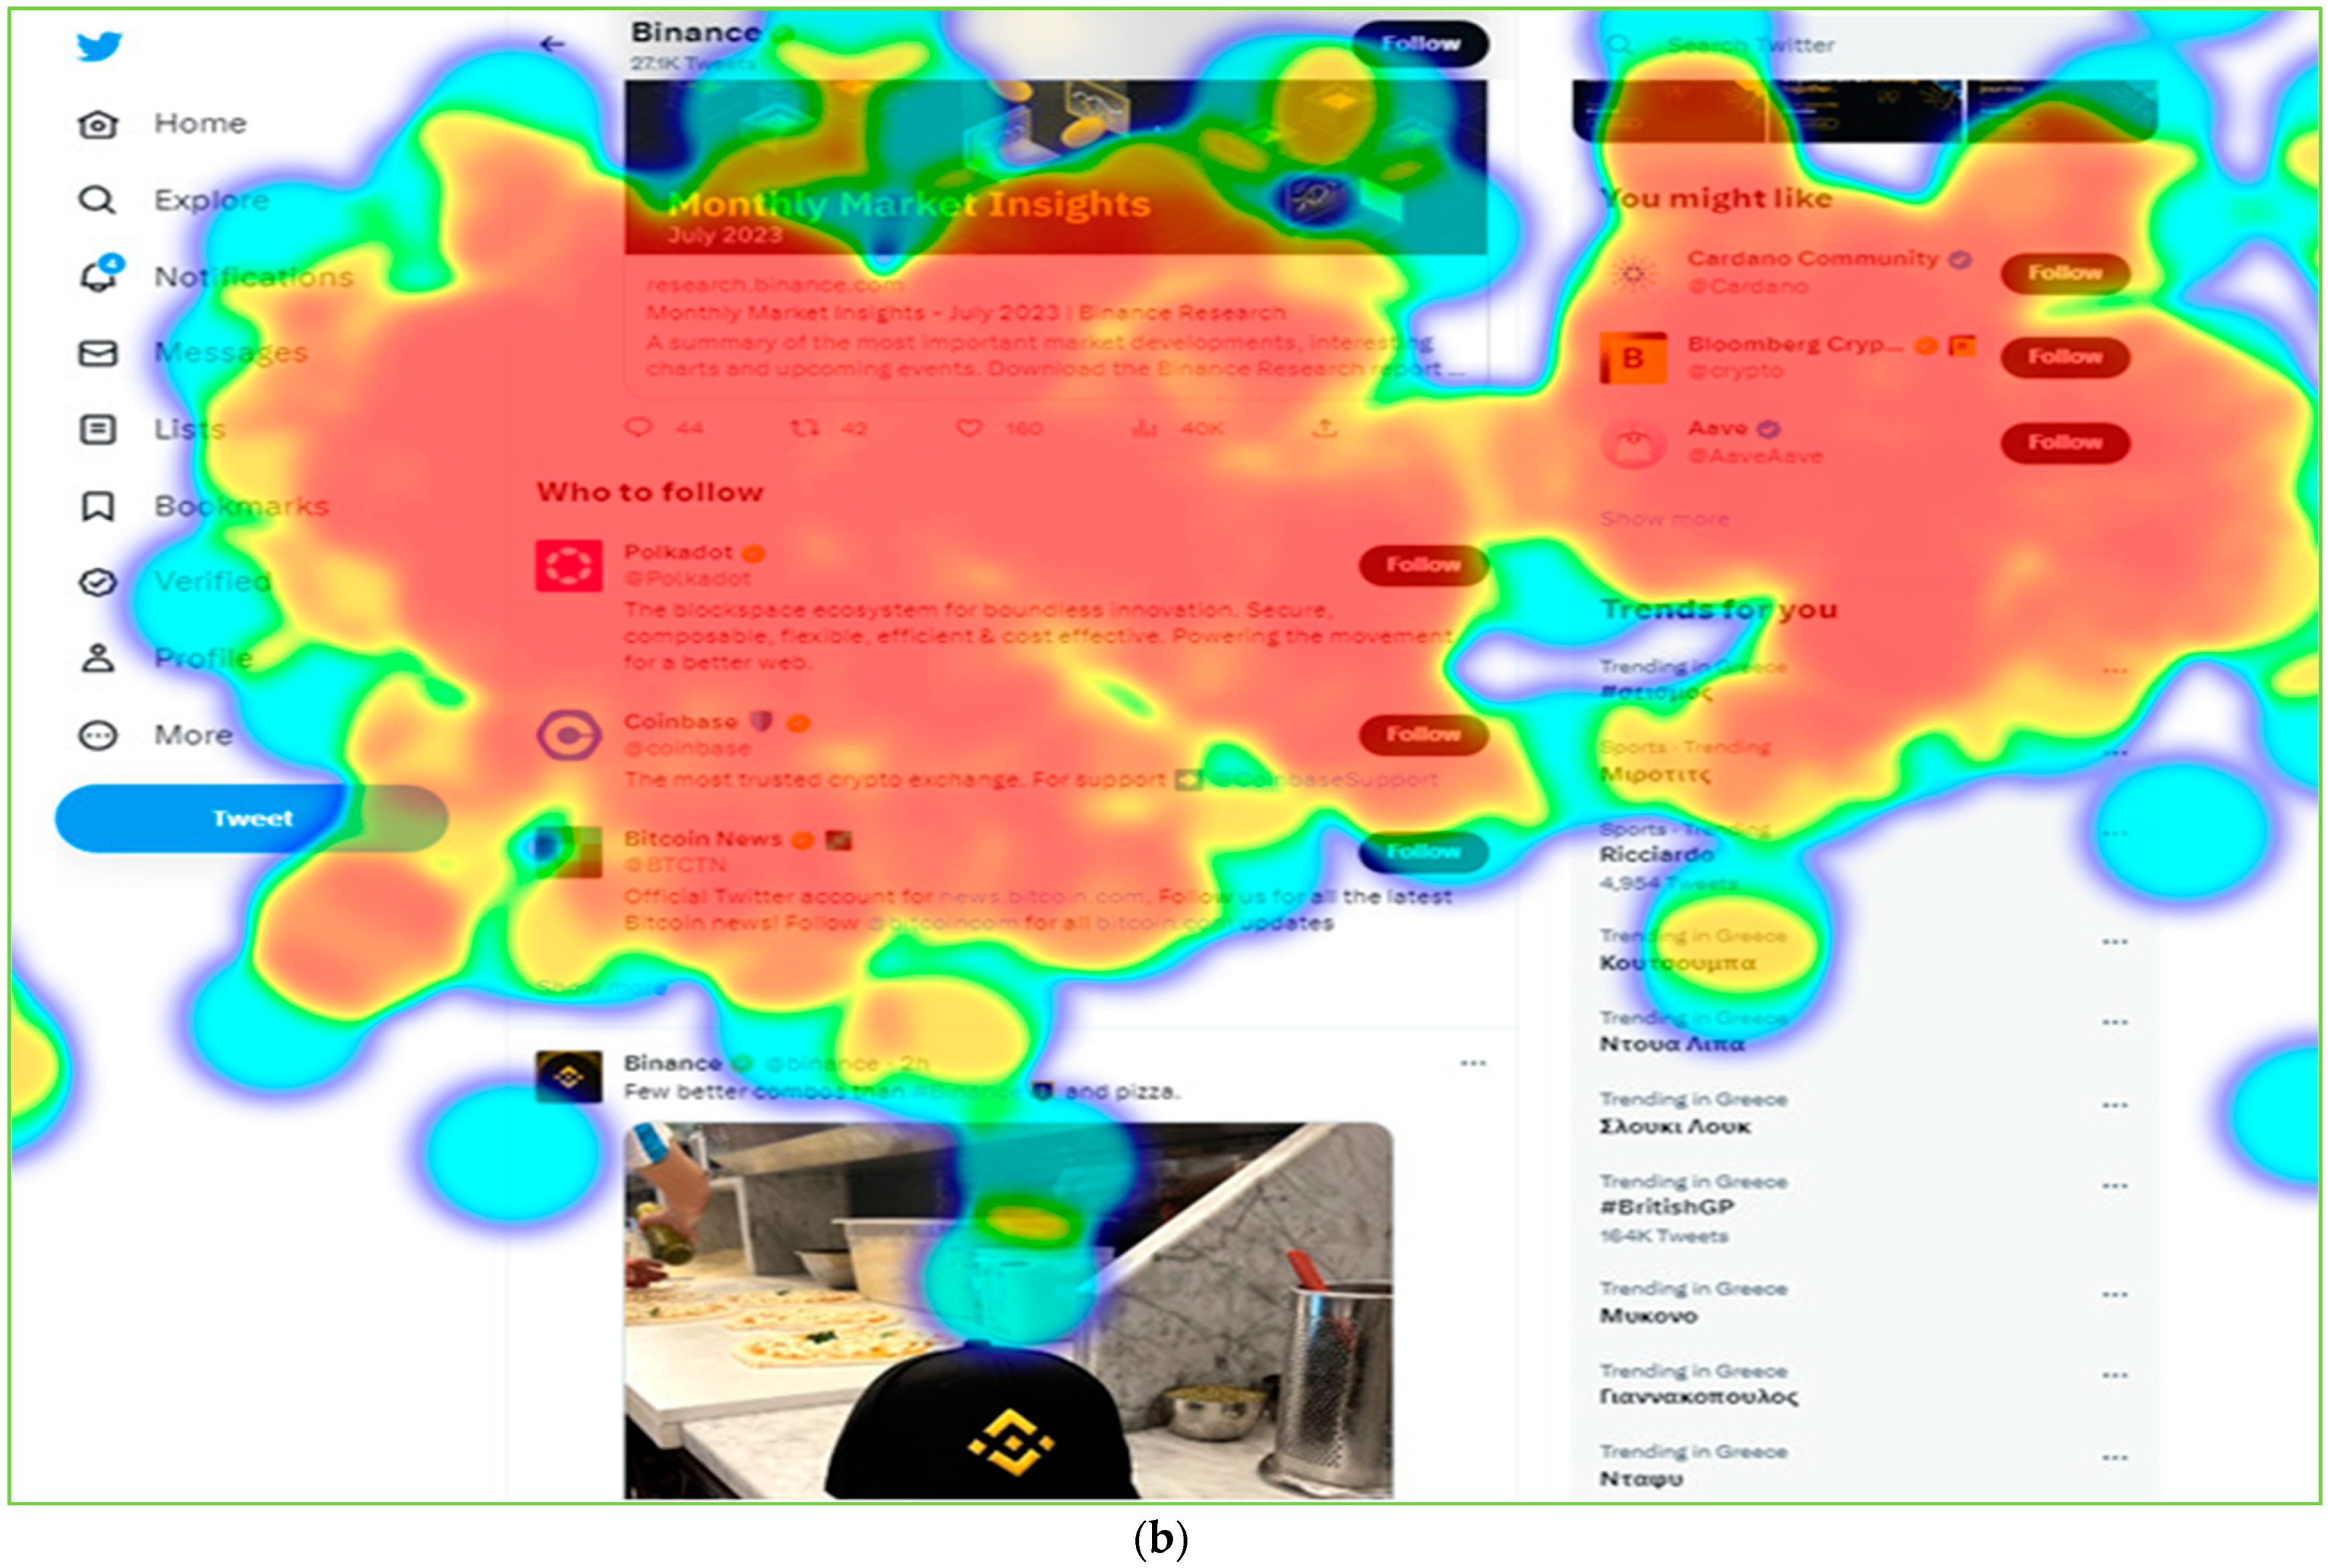
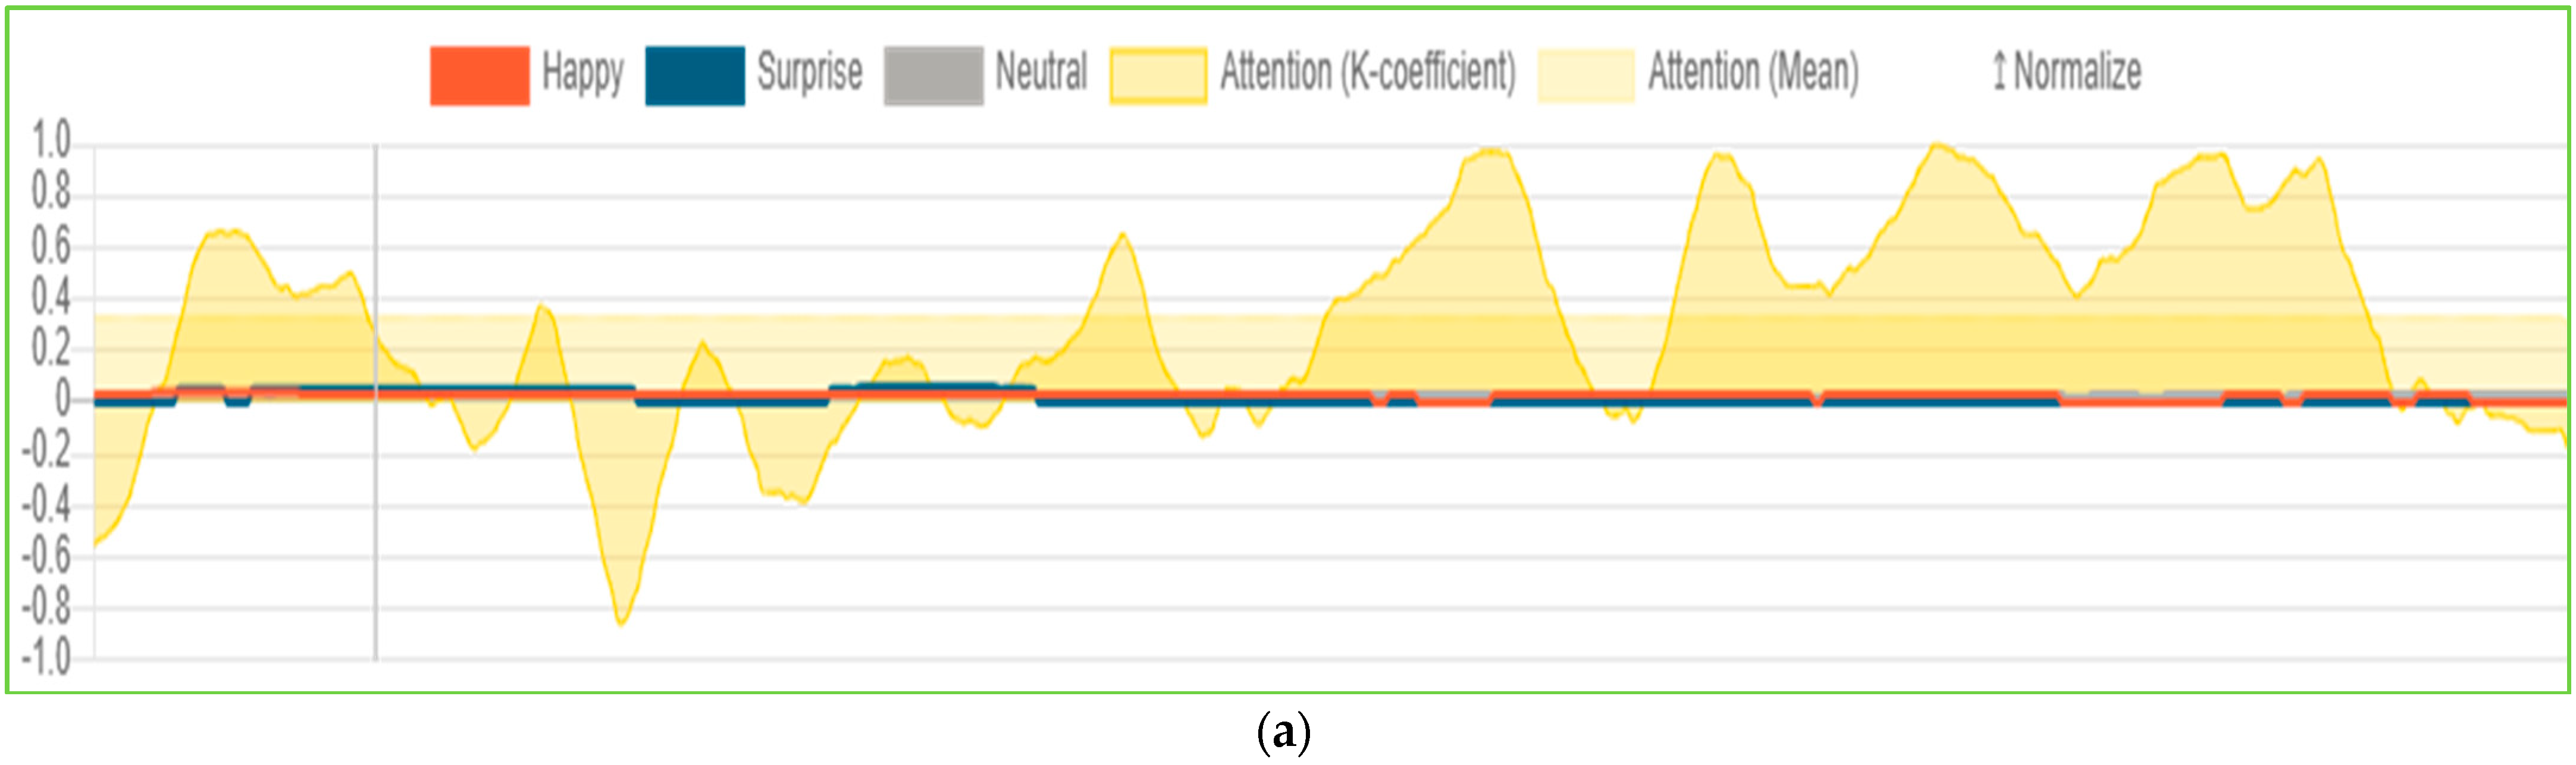
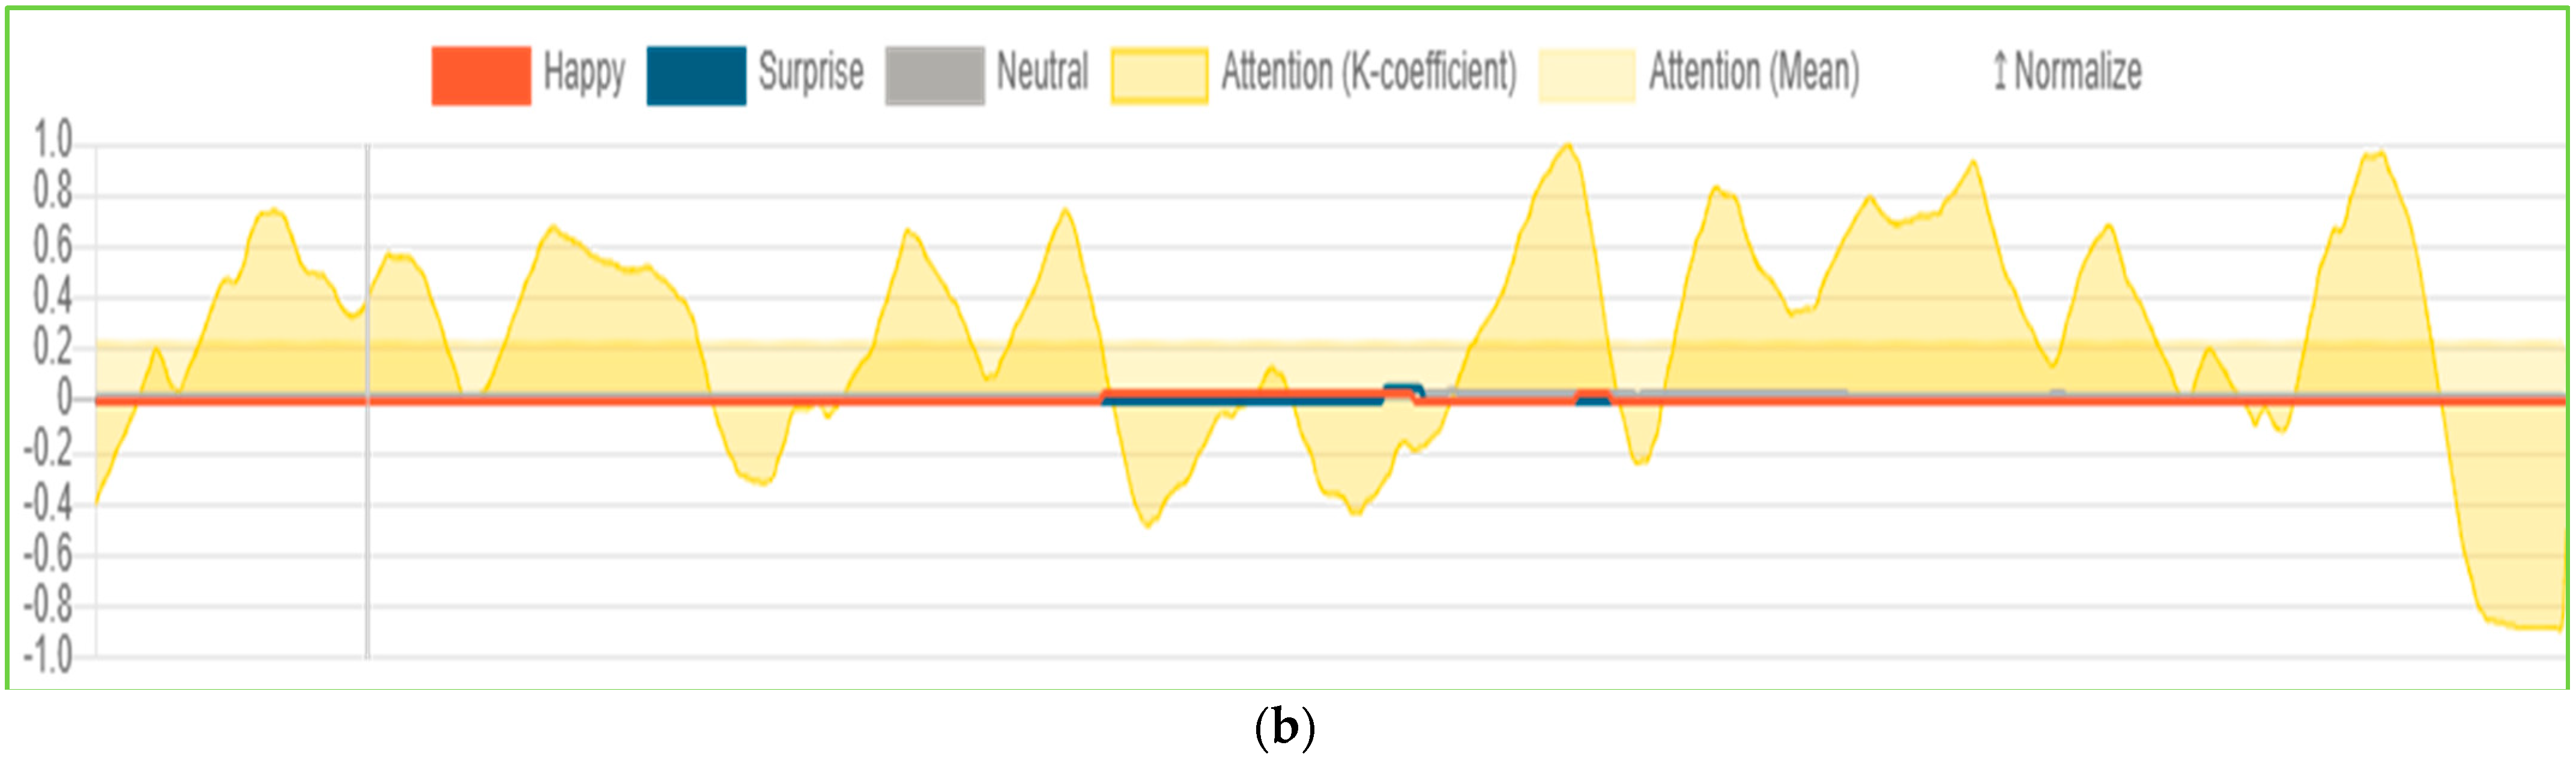
  • In the last stage, a cognitive neuromarketing model is deployed, where 21 participants of various ages and income categories are summoned to observe the social media profile of the most-known DeFi platform for 30 s (the Twitter profile of Binance was the one selected). With this model, some of the research hypotheses that refer to DeFi platforms’ performance will be answered, while further insights from the behavior of the social media profile’s visitors will emerge.

2.1. Theoretical Framework and Research Hypotheses

The related literature and studies have highlighted the importance of digital transformation for supply chain enterprises and big data’s role in this concept. For instance, big data analytics of supply chain companies, such as those originating from their websites, facilitate their digital transformation processes [44]. Kostakis and Kargas [45] indicated that data mining, machine learning, and neural networks are among the most utilized methods for analyzing big data in favor of firms’ digital transformation. Moreover, analytical data from the supply chain firms’ environment, such as data regarding the product, production procedures, sales, and customers, were found to be decisive for the outcome of their digital transformation process [46]. According to Kache and Seuring [47], big data analytics, from supply chain firms’ business environments, are also considered crucial for the digital transformation of their activities.
Our research is focused on the impact that social media from DeFi platform profiles could have on supply chain companies’ digital transformation, as well as their own digital performance. DeFi social media analytics’ connection with supply chain companies’ digital transformation and DeFi platforms’ performance metrics should be examined. To do so, specific big data analytic metrics, that depict digital marketing and financial performance, were summoned as dependent variables for measuring DeFi social media analytics’ impact. Those metrics include website organic traffic, organic/paid traffic costs, bounce rate, and new customers.
Therefore, the research hypotheses were based on the big data analytic metrics of organic traffic, organic and paid costs, bounce rate, and new customers. At first, the impact of DeFi social media analytics on their own digital performance should be measured. This leads to the first 2 research hypotheses (H1, H2), where the analytic metric of DeFi’s organic traffic [48] and website bounce rate [49] are used as dependent factors.
Hypothesis 1 (H1):
Decentralized Finance platforms’ organic traffic is impacted by the Social Media Analytics of their profiles.
Hypothesis 2 (H2):
The abandoning rate of Decentralized Finance platforms is being reduced through the utilization of their Social Media Analytics.
Regarding the digital performance metrics of supply chain companies, their connection with the variation in DeFi platforms’ social media is next to be examined. For this reason, the metrics of organic and paid traffic costs [50], as well as the one of new customers were summoned. The specific metrics indicate a possibility for reducing key digital advertising costs for supply chain firms, while also increasing the new-coming customers to their corporate websites.
Hypothesis 3 (H3):
The organic and paid traffic costs related to Supply Chain Firms’ website visibility can be reduced through the usage of Decentralized Finance Social Media Analytics.
Hypothesis 4 (H4):
The more Supply Chain Firms capitalize on Decentralized Finance Social Media Analytics, the more their new customers can increase.

2.2. Research Sample and Data Gathering

To perform the required data collection, the determination of the study’s sample needs to be specified. The selected firms consist of the five most successful supply chain firms in 2022, based on their performance over returns on physical assets (ROPA), revenue growth, and inventory turn [51], as well as the 5 top Decentralized Finance (DeFi) platforms for 2023, based on the evaluation of their offered services, fees, minimum deposits, etc. [52]. The supply chain firms and Decentralized Finance (DeFi) platforms that consist of the research sample are:
  • Supply chain firms: Cisco Systems [53], Schneider Electric [54] Colgate-Palmolive [55], Johnson & Johnson [56], and PepsiCo [57].
  • Decentralized Finance platforms: Binance [58], Coinbase [59], Crypto [60], DeFi Swap [61], and AQRU [62].
From the referred firms and platforms, big data analytics were collected from their websites, as well as social media analytics from the social media profiles (Twitter, Facebook, Instagram, and TikTok) of the cryptocurrency trade platforms, as seen in Table 1. To perform this data collection task, the authors capitalized on the Semrush [63] and Fanpage Karma [64] decision support website platforms through the monthly payment of consideration. Hence, the referred data were gathered daily, for 180 days, between 1 July 2022, and 31 January 2023.
Moreover, regarding the cognitive neuromarketing model, the authors randomly summoned 21 participants of various ages and groups to observe the social media profile of the most well-known DeFi platform. The preferred social media profile that was selected is the Twitter account of Binance, since this social profile had the highest number of visits and interactions, among other DeFi platforms and social media profiles (compared to Facebook, Instagram, and TikTok). So, the authors utilized the Realeye [65] neuromarketing platform that produces eye tracking and emotion analysis data through the observation of the Twitter profile of the DeFi platform. The participants observed the DeFi social media profile via a web camera, and the Realeye [65] platform collected eye-tracking movements, gazes, and expressions.
Table 1. Big Data and Social Media Analytic metrics.
MetricsDescription of the Big Data and Social Media Analytics
Organic TrafficOrganic traffic is generated by individuals looking for a particular good or service; increasing the number of such visitors on-page is an excellent approach to locating qualified leads and improving revenue [48].
Organic CostsThe amount of expenses linked with a firm’s activities to generate website traffic through unpaid search results [50].
Paid CostsThe amount of expenses linked with a firm’s activities to generate website traffic through paid search results [50].
Bounce RateThe amount of website visits that terminate their session with a web page, shortly after entering it.
Post ImpressionsThe assortment of times a profile’s posts appeared on someone’s display within the specified period. The total number of instances a profile’s posts, home page, advertising, stories, and so on have been viewed by visitors [66].
Engagement (%)Engagement measures how well a profile invites people to contribute. Firms may employ this statistic to analyze the effectiveness of profiles of various categories as well as their rivals [66] because all fundamental data are available, and interactions are adjusted for the number of fans.
Total FollowersThe total amount of people who liked or followed the profile or account. The number of followers indicates how vast and recognized a profile is and how far it could expand organically [66].
Followers GrowthThe proportion of the increase in followers throughout the initial and final day of the chosen timeframe. Every day in the historical graph represents the change from the initial day of the specified period [66].
Post Interaction (%)Average post engagement per follower each post. Interactions include likes, hearts, haha, and other emoticons, in addition to comments, shares, and retweets [66].

3. Results

3.1. Statistical Analysis

Through this stage, the authors performed extensive correlation and SLR analyses. Table 2 presents the descriptive statistics of the paper’s variables, including the statistical metrics of mean, minimum, maximum, and std. deviation. Moreover, the authors performed correlation analysis based on Pearson’s coefficient, as seen in Table 3.
For SLR models, the dependent variables were selected based on the research hypotheses, which are DeFi organic traffic and bounce rate, supply chain organic and paid traffic costs, as well as their bounce rate. At first, the SLR model of DeFi organic traffic was produced and was verified overall with p-value = 0.000 < a = 0.01 and R2 = 1.000 (Table 4). The social media analytic metrics of DeFi profiles significantly impact their organic traffic metric since they have p-values = 0.000 < a = 0.01 level of significance. For every 1% increase in post impressions, engagement, total followers, followers’ growth, and post interaction, DeFi organic traffic varies by −291.4%, −128%, 434.9%, −105.5%, and 5.7%, respectively. The first research hypothesis (H1) of the paper is verified, and Decentralized Finance platforms’ organic traffic is impacted by the social media analytics of their profiles.
The linear regression of DeFi platforms’ bounce rate is shown in Table 5, and it is overall verified, with p-value = 0.000 < a = 0.01 and R2 = 1.000. The DeFi social media analytics significantly impact their platform bounce rate. With each 1% rise in post impressions, engagement, total followers, followers’ growth, and post interaction, the DeFi bounce rate variates by −699.6%, 394.4%, 75.5%, 2834.5%, and −2608.6%, respectively. The second research hypothesis (H2) is also verified, meaning that the abandoning rate of Decentralized Finance platforms is being reduced through the utilization of their social media analytics.
The SLR models of supply chain firms’ organic and paid traffic costs as dependent variables were found to be verified overall with p-values = 0.000 < a = 0.01 and R2 = 1.000 (Table 6 and Table 7), and the included DeFi social media analytics had a significant effect on them with p-values = 0.000 < a = 0.01 level of significance. For supply chain firms’ organic traffic costs, each 1% of the increase in post impressions, engagement, total followers, followers’ growth, and post interaction variate by −2385.3%, 596.5%, 2160.7%, 506.8%, and −976.8%, respectively, while their paid traffic costs variate by −1175.4%, 445.2%, 1233.7%, −448%, and 35.3%, accordingly. Therefore, the third research hypothesis (H3), means that the organic and paid traffic costs related to supply chain firms’ website visibility can be reduced through the usage of Decentralized Finance social media analytics.
Lastly, for the linear regression model of supply chain firms’ new website customers, the model is being verified overall with p-values = 0.000 < a = 0.01 and R2 = 1.000 (Table 8), and all of them had a significant effect on supply chain new customers’ variable, with p-values = 0.000 < a = 0.01 level of significance. Supply chain firms’ new customers vary by 1606.4%, −843.4%, −1154.9%, −288.9%, and 737.9%, accordingly, for every 1% increase in post impressions, engagement, total followers, followers’ growth, and post interaction. This indicates that the fourth and final research hypothesis (H4) of the paper is verified, meaning that the more supply chain firms capitalize on DeFi social media analytics, the more their new customers can increase.

3.2. Fuzzy Cognitive Mapping Model

In the present section, the authors emphasize on is the representation of the relationships among the study’s variables. To perform this task, the Fuzzy Cognitive Mapping (FCM) procedure is discerned for its usage. Through the presentation of the relationships deployed among the study’s variables, a more coherent understanding can be made, through elaborating on the connection between supply chain firms and DeFi platforms’ social media analytics. To deploy the model, the authors utilized the online platforms of MentalModeler [67] and produced the model presented in Figure 1. The produced FCM model aids the process of extracting important insights from the variables’ relationships. FCM depicts the static relationships of the model’s variables and their intercorrelations [68]. In this context, multiple applications of Fuzzy Cognitive Mapping processes have aided in the solution of various decision-making problems in various fields [69].

3.3. Hybrid Model Deployment

Aiming to simulate the impact of DeFi platforms’ social media on supply chain firms’ key digital marketing and financial KPIs, the authors deployed a Hybrid Model (HM) [70], consisting of both Agent-Based (ABM) and System Dynamic (SD) models. The simulation process of the HM was reinforced by inserting the coefficients of the correlation and SLR analyses. The simulation time of the Hybrid Model was set to 360 days to capture the whole fluctuations of the variables throughout the year. The Decision Support System (DSS) utilized for the deployment of the Hybrid Model is the Anylogic software [71]. More specifically, the authors seek to model the variation in supply chain firms’ new customers, organic and paid costs, as well as DeFi platforms’ organic traffic and bounce rate, through the fluctuation of DeFi social media analytics. For the ABM model, 10,000 agents were used to simulate the online behavior of supply chain and DeFi websites and social media platform visitors.
In Figure 2, the deployed Hybrid Model is being depicted, and its simulation starts from the DeFi visitors statechart (cryptotradevisitors), from where, based on their repeatability of website visits, they split into new DeFi visitors (newcryptovisitors statechart) and old (returning) DeFi visitors (oldcryptovisitors statechart). From there, based on the abandoning rate of the DeFi websites, the visitors either leave the site and return to the initial statechart (cryptotradevisitors) or move through the bounce rate statechart to one of DeFi’s social media profiles. There, the DeFi website visitors following their relevance with DeFi social media profiles usage, affect, up to a point, those platforms’ organic traffic (cryptoorganictraffic statechart), contributing to their organic visibility. Therefore, the next statecharts of supply chain new customers (supplychainnewcustomers) and bounce rate (supplychainbouncerate) were accessed, triggering the activation of specific variables regarding supply chain firms, such as the dynamic variables of supply chain organic and paid traffic. The included factors follow the Normal distribution, and the model’s variables determine their variation and connection. From the deployed statecharts and factors–variable intercorrelations, a Java routine has been produced, which is presented in Table A1 in the Appendix A.
During the simulation of the DeFi platforms and supply chain firms’ analytical metrics, the allocation of the Agent-Based Model’s (ABM) agents was performed. This allocation is based on the statecharts each agent manages to reach through the 360-day simulation period. So, in Figure 3a,b, we can see the allocation of 10,000 agents, during the simulation of DeFi social media usage. In the first Figure 3a, a limited usage of DeFi social media by their website visitors, leads to a reduced number of yellow and green agents, while the number of beige-colored agents is increased. Gray color represents the agents that do not land on DeFi websites, beige colors the agents that land on their websites and abandon them right after, while yellow and green color represent agents that contribute to DeFi platforms’ organic traffic, as well as supply chain firms’ new visitors/customers. After increasing DeFi social media usage, in Figure 3b, we can discern increased numbers of green-colored agents, with yellow-colored agents remaining the same, while the number of beige-colored agents has decreased. It becomes clear that increased usage of DeFi social media from their website visitors does not seem to increase their organic traffic, but on the contrary, it increases the amount of potential website visitors and customers of supply chain firms that could collaborate with them.
Based on the outcomes of the simulation analysis, the variation through the 360 days indicated some important outcomes concerning the variation in DeFi platforms’ organic traffic and bounce rate, as well as supply chain firms’ new customers, organic, and paid costs are presented in Figure 4. From the comparison of the referred variables’ variation through time, with DeFi social media analytics, we can generally observe that shortly after every increase in the DeFi social media analytics’ values, their organic traffic decreases, and their website bounce rate decreases also. At the same time, supply chain firms’ organic and paid costs are being reduced shortly after, while their new customer metric increases. The opposite happens to the referred variables when DeFi social media analytics’ values decrease.

3.4. Cognitive Neuromarketing Model

Reaching the cognitive neuromarketing model of the study, the authors aim to evaluate the responses of Decentralized Finance (DeFi) social media profiles’ visitors, measured in eye tracking observation, fixations, and gazes’ engagement, as well as the expressed emotions [72,73]. The assessment of the social media profile of Binance on Twitter was performed, where 21 participants were put to observe the referred Twitter profile for 30 s, with the usage of a web camera that records their expressions. From the deployment of the cognitive neuromarketing model, aggregated heatmaps and facial analysis images were produced by the total of the study’s participants. The observation of the social media profile of the DeFi profile was performed through the utilization of the Realeye [65] decision support platform.
In Figure 5, the results of the aggregated heatmaps produced by the 21 participants of the neuromarketing model are presented. Figure 5a shows the first 15 s of the social media profile observation, where the areas of the profile the participants mostly noticed are mentioned with more intensity and interest (red color) [74]. The same applies to Figure 5b, where the aggregated heatmaps of the last 15 s are presented. From these figures, it can be discerned that the participants tended to focus more on the posts (videos/images or simple text) on the social media profile of the DeFi platform, as well as on the suggestions made to them regarding other social media profiles they might like or should follow. Little importance was given to the column with the trending tweets or news.
Referring to the aggregated facial analysis of the participants, we extracted the following graphs, presented in Figure 6, that show the attention and emotions allocation of the 21 participants. In Figure 6a, which indicates the first 15 s of the observation process, the participants had a quite high mean attention coefficient, with some increased parts of attention expression, while not expressing clear emotions of happiness and surprise. Whereas, in Figure 6b, at the last 15 s of the observation, the participants’ mean attention coefficient was reduced, despite the appearance of some peaks in their attention expression. Again, no clear indication of happiness or surprise emotional expression was extracted.

4. Discussion

In the present section of the paper, the outcomes of the deployed methods are presented by highlighting the verification or not of the paper’s research hypotheses. First, the importance of DeFi profiles’ social media analytics is examined towards the digital performance of DeFi organizations, as well as the financial performance of supply chains that would cooperate with them. For this reason, the data that the authors gathered were analyzed through correlation and linear regressions, followed by FCM and Hybrid Modeling processes. Moreover, a sample of 21 participants was collected, that were summoned for a cognitive neuromarketing experiment, which aided the extraction of further information.
From the performed statistical analysis, multiple insights were collected that are related to the impact of DeFi profiles’ social media analytics on both their websites’ digital performance as well as supply chain firms’ financial performance. As dependent variables for DeFi platforms’ digital performance, the big data metrics of organic traffic and bounce rate were used, while for supply chain firms’ financial performance, the big data metrics of organic and paid traffic costs, and new customers were adopted. The research hypotheses of the paper were all verified since the deployed linear regression models had a statistical significance below the a = 0.01 level (p-values). More specifically, hypotheses H1 and H2 were verified meaning that social media analytics from DeFi platforms’ profiles significantly affect their website organic traffic, while also tending to reduce its bounce rate. The H3 and H4 hypotheses, which were also verified, indicate that the organic and paid traffic costs of supply chain firms can also be reduced from the utilization of DeFi social media analytics, whereas their new customers’ metric increases through the utilization of DeFi social media analytics.
Concerning the application of the Hybrid Modeling, where ABM and SD models were utilized, various information arose that mostly verified the regression models and the settled research hypotheses. More analytically, it can be discerned that through the 360 simulation days, an increase in the total of DeFi’s social media analytics leads to decreased website organic traffic, and bounce rate. Lower levels of website organic traffic indicate a decrease in corporate digital performance, whereas lower levels of website bounce rate present an increased digital performance. For supply chain firms, the increase in DeFi profiles’ social media analytics in the simulation model triggered a significant reduction in their website organic and paid costs, while their website’s new customers metric increased. The reduction in these traffic costs and the increase in new website customers lead to increased financial performance, since a firm’s customers are increased, while their advertisement costs are kept low. A strong potential for supply chain firms to harvest originates from capitalizing on DeFi profiles’ social media analytics.
Moreover, referring to the implications of the cognitive neuromarketing model, based on the participants’ observation of the selected DeFi social media profile, important insights arise. Firstly, from the heatmaps and gazes of the participants (Figure 5) [72], it is shown that they expressed much interest in the DeFi social media profile by intensely observing the links to other websites provided in specific places on the profile page [75]. Moreover, the participants were keen on reading the “You might like” and “Who to follow” columns of the DeFi social media profile, which indicates the influence the profile has on visitors who might be searching for some information [76]. From the facial and emotion analysis charts (Figure 6), we can discern that through the DeFi social media profile observation period, the participants expressed high coefficients of the attention mechanism [77], which indicates the great interest the participants showed in the information posted on the DeFi social media profile.
The extracted insights from the neuromarketing model support the verification of the research hypotheses H1 and H2, due to the great interest the participants showed on the main link to the DeFi website (cited on the social media profile page). This means that DeFi websites could attract more traffic that is also more engaged with its content from their social media profile visibility, and thus have increased organic traffic and reduced bounce rate metrics. Regarding the H4, it could be said that the hypothesis is verified, based on the interest shown by the study’s participants in the columns “You might like” and “Who to follow” of the DeFi social media profile. Because DeFi social media profile visitors are fixating on the referred columns, there is a high possibility of visiting the mentioned websites for further information or for buying their products and services. So, given that more people will visit supply chain firms with the intent to acquire their products and services due to their appearance on DeFi social media profiles, the hypothesis that DeFi social media analytics can be capitalized for attracting more new customers to supply chain firms is verified.

5. Conclusions

5.1. Theoretical and Practical Implications

The novelty of this research lies in its holistic examination of the symbiotic interplay between supply chain firms’ digital transformation strategies, the integration of DeFi technologies, and the leveraging of big data and social media analytics. The existing literature often silos discussions of these topics without exploring the intricate ways they intersect and influence each other within the unique context of DeFi-enabled supply chain operations. By delving into this uncharted territory, the study aims to shed light on how supply chain firms can strategically navigate the DeFi landscape by not only embracing digital transformation but also harnessing the potential of DeFi’s emerging technologies and the insights gleaned from social media analytics. This comprehensive approach contributes to a deeper understanding of the multifaceted mechanisms that drive financial success within the evolving paradigm of decentralized finance, thus offering valuable guidance for practitioners and researchers alike.
This study showed that the utilization of social media analytics can significantly impact some of the key indicators of Decentralized Finance organizations’ digital performance. Moreover, supply chain firms could enhance their financial performance, and thus their digital transformation efforts. It was discerned that specific analytic metrics from the social media profiles of DeFi platforms can lower or increase the organic traffic (website organic visibility), and the bounce rate of their websites, thus promoting these organizations’ digital brand name and performance. More specifically, an increase in DeFi platforms’ organic traffic occurs when their social media profiles’ total followers and post interaction increase, while a reduction to their website’s bounce rate is achieved from an increase in their social media profiles’ post impression and interaction. Both the increase in website organic traffic and the decrease in bounce rate indicate an enhanced digital performance and brand name for DeFi organizations.
At the same stage, insights also highlight the role of big data from DeFi social media profiles to the digital and financial performance of supply chain firms. The organic traffic costs of supply chain firms’ websites can be reduced from an increase in the post impression and interaction metrics of DeFi social media profiles, while their paid traffic costs could be decreased from an increase in post impression and followers’ growth metrics of DeFi social media profiles. Furthermore, supply chain firms’ new website customers can also be increased by increasing post impression and interaction metrics of DeFi social media profiles. It should be noted that lower values of organic and paid traffic costs, combined with higher numbers of new website customers, indicate enhanced financial and digital performance for firms. The referred outcomes show a novel path for a successful digital transformation for supply chain firms.
The present study’s outcomes are aligned with the other literature findings in the field of supply chain firms. More specifically, Farnoush et al. [78] and Hasan et al. [79] mention the field of blockchain technology and its advancements, which include cryptocurrencies and DeFi applications, as a factor for assisting and successfully managing the digital transformation of modern firms. Moreover, the connection between leveraging big data to predict supply chain firms’ customer demand and enhance their sustainability has been highlighted as a critical factor in their digital transformation management [15]. Supply chain firms should capitalize on various technologies to achieve the desired levels of digital transformation [80], such as the blockchain and DeFi applications. In this way, these firms could develop sustainable strategies and enhance their performance, hence improving their position in the market [81]. Utilizing DeFi platforms’ social media profiles for advertising or analyzing their potential customers’ demand and behavior is a proper step in their aim for efficient digital transformation management.
The practical implications that arise from the present research are mostly focused on providing innovative methods for firms to identify and apply digital transformation initiatives. Through a collaboration with DeFi organizations, supply chain firms could promote their brand name by advertising on DeFi social media profiles, or making sure they appear on their profile columns, such as “You might like” and “Who to follow”. Since DeFi social media analytics affect supply chain firms’ organic and paid costs, as well as their new website customer count, these firms should consider the benefits of placing their brand in these columns of DeFi social media profiles. Moreover, supply chain firms could increase the links to their websites and social media platforms placed on DeFi social media profiles, apart from appearing on the referred columns. In this way, supply chain marketers could achieve increased visibility of their website and the firm’s services and product promotion, from such low-cost and efficient strategies similar to SEO, SEM [81], affiliate marketing [82], and video marketing [83].

5.2. Limitations

The limitations of this study were mainly focused on three sections, including the observation and gathering time for the study’s sample, the simulation time of the Hybrid Model, and the number of participants in the cognitive model. Regarding the research sample, it refers to a 180-day observation and collection period, while its simulation time was set to 360 days. As per the participants of the cognitive neuromarketing model, 21 people were summoned. To enhance the results and the generalization of the research findings, more data could be gathered, depicted by an extended period (360 days rather than 180). Furthermore, by increasing the simulation period and the number of participants in the cognitive neuromarketing model, the outcomes of the study could be more generalized. The above limitations do not affect the quality of the research findings, nevertheless, potential improvements to the results’ generalization could be applied.

5.3. Future Work

The authors, having analyzed the impact of DeFi social media profiles on their website visibility and the potential benefits for supply chain firms, highlight some of the fields that could extend their research. Some fields in which the research interest could be turned to refer to other digital marketing strategies for the promotion of DeFi platforms and organizations, such as video marketing and email marketing campaigns. At the same time, the potential benefits for supply chain firms through collaboration with DeFi organizations and their digital marketing initiatives should be further examined.

Author Contributions

Conceptualization, D.P.S. and N.T.G.; methodology, D.P.S. and N.T.G.; software, N.T.G.; validation, M.C.T., N.K. and A.L.; formal analysis, M.C.T., N.K. and A.L.; investigation, N.T.G., M.C.T. and N.K.; resources, N.T.G. and M.C.T.; data curation, N.K. and A.L.; writing—original draft preparation, N.T.G. and M.C.T.; writing—review and editing, D.P.S. and N.T.G.; visualization, D.P.S. and N.T.G.; supervision, D.P.S., N.K. and A.L.; project administration, D.P.S. and N.T.G.; funding acquisition, M.C.T., N.K. and A.L. All authors have read and agreed to the published version of the manuscript.

Funding

This research received no external funding.

Data Availability Statement

Not applicable.

Acknowledgments

The authors acknowledge the support of this work by the project “Smart Agri-Culture and Circular Bio-Economy—SmartBIC”. (MIS MIS5047106) which is implemented under the Action “Reinforcement of the Research and Innovation Infra-structure”, funded by the Operational Programme “Competitiveness, Entrepreneurship and Innovation” (NSRF 2014-2020) co-financed by Greece and the European Union (European Regional Development Fund).

Conflicts of Interest

The authors declare no conflict of interest.

Appendix A

Table A1. Java coding route of supply chain and DeFi trade organizations simulation.
Java Coding Route of Anylogic
@Override
 @AnyLogicInternalCodegenAPI
 public void enterState( short _state, boolean _destination ) {
 switch( _state ) {
      case CryptoTradeVisitors: // (Simple state (not composite))
  statechart.setActiveState_xjal( CryptoTradeVisitors );
  transition.start();
  transition1.start();
  return;
      case NewCryptoVisitors: // (Simple state (not composite))
  statechart.setActiveState_xjal( NewCryptoVisitors );
  {
newCryptoVisitors++
;}
  transition3.start();
  return;
      case CryptoBounceRate: // (Simple state (not composite))
  statechart.setActiveState_xjal( CryptoBounceRate );
  {
SMpostImpressions = normal(198170.48 , 376508.88);

SMengagement = normal(0.12,0.19);

SMtotalFollowers = normal(47403.33,549.72);

SMfollowersGrowth = normal(3549.10,6044.04);

SMpostInteraction = normal(0.54,0.8);

cryptoBounceRate = SMpostImpressions*(−6.996) + SMengagement*(3.944) + SMtotalFollowers*(0.755) + SMfollowersGrowth*(28.345) + SMpostInteraction*(−26.086)
;}
  transition2.start();
  transition5.start();
  return;
      case CryptoSocialMediaProfile: // (Simple state (not composite))
  statechart.setActiveState_xjal( CryptoSocialMediaProfile );
  {
socialMediaAnalytics = SMpostImpressions + SMengagement + SMtotalFollowers + SMfollowersGrowth + SMpostInteraction
;}
  transition7.start();
  return;
      case CryptoOrganicTraffic: // (Simple state (not composite))
  statechart.setActiveState_xjal( CryptoOrganicTraffic );
  {
cryptoOrganicTraffic = SMpostImpressions*(−2.914) + SMengagement*(−1.280) + SMtotalFollowers*(4.349) + SMfollowersGrowth*(−1.055) + SMpostInteraction*(0.057)
;}
  transition8.start();
  return;
      case SupplyChainNewCustomers: // (Simple state (not composite))
  statechart.setActiveState_xjal( SupplyChainNewCustomers );
  {
supplyChainNewCustomers = SMpostImpressions*(16.064) + SMengagement*(−8.434) + SMtotalFollowers*(−11.549) + SMfollowersGrowth*(−2.889) + SMpostInteraction*(7.379);

supplyChainPaidCosts = SMpostImpressions*(−11.754) + SMengagement*(4.452) + SMtotalFollowers*(12.337) + SMfollowersGrowth*(−4.480) + SMpostInteraction*(0.353);

supplyChainOrganicCosts = SMpostImpressions*(−23.853) + SMengagement*(5.965) + SMtotalFollowers*(21.607) + SMfollowersGrowth*(5.068) + SMpostInteraction*(−9.768)
;}
  transition11.start();
  return;
      case SupplyChainBounceRate: // (Simple state (not composite))
  statechart.setActiveState_xjal( SupplyChainBounceRate );
  transition6.start();
  return;
      case OldCryptoVisitors: // (Simple state (not composite))
  statechart.setActiveState_xjal( OldCryptoVisitors );
  {
oldCryptoVisitors++
;}
  transition4.start();
  return;
      default:
  super.enterState( _state, _destination );
  return;
 } }

References

  1. Kutnjak, A.; Pihiri, I.; Tomičić Furjan, M. Digital transformation case studies across industries–literature review. In Proceedings of the 2019 42nd International Convention on Information and Communication Technology, Electronics and Microelectronics (MIPRO), Opatija, Croatia, 20–24 May 2019; IEEE: New York, NY, USA, 2019; pp. 1293–1298. [Google Scholar] [CrossRef]
  2. Nasiri, M.; Ukko, J.; Saunila, M.; Rantala, T. Managing the digital supply chain: The role of smart technologies. Technovation 2020, 96, 102121. [Google Scholar] [CrossRef]
  3. Stachová, K.; Stacho, Z.; Cagáňová, D.; Stareček, A. Use of Digital Technologies for Intensifying Knowledge Sharing. Appl. Sci. 2020, 10, 4281. [Google Scholar] [CrossRef]
  4. Diéssica, O.-D.; Maqueira-Marín, J.M.; Moyano-Fuentes, J. The link between information and digital technologies of industry 4.0 and agile supply chain: Mapping current research and establishing new research avenues. Comput. Ind. Eng. 2022, 167, 108000. [Google Scholar] [CrossRef]
  5. Büyüközkan, G.; Göçer, F. Digital supply chain: Literature review and a proposed framework for future research. Comput. Ind. 2018, 97, 157–177. [Google Scholar] [CrossRef]
  6. Behl, A.; Gaur, J.; Pereira, V.; Yadav, R.; Benjamin Laker, B. Role of big data analytics capabilities to improve sustainable competitive advantage of MSME service firms during COVID-19–A multi-theoretical approach. J. Bus. Res. 2022, 148, 378–389. [Google Scholar] [CrossRef]
  7. Knudsen, E.S.; Lien, L.B.; Timmermans, B.; Belik, I.; Pandey, S. Stability in turbulent times? The effect of digitalization on the sustainability of competitive advantage. J. Bus. Res. 2021, 128, 360–369. [Google Scholar] [CrossRef]
  8. Chen, H.Y.; Das, A.; Ivanov, D. Building resilience and managing post-disruption supply chain recovery: Lessons from the information and communication technology industry. Int. J. Inf. Manag. 2019, 49, 330–342. [Google Scholar] [CrossRef]
  9. Paul, S.K.; Chowdhury, P.; Moktadir, M.A.; Lau, K.H. Supply chain recovery challenges in the wake of COVID-19 pandemic. J. Bus. Res. 2021, 136, 316–329. [Google Scholar] [CrossRef] [PubMed]
  10. Urbinati, A.; Chiaroni, D.; Chiesa, V.; Frattini, F. The role of digital technologies in open innovation processes: An exploratory multiple case study analysis. R&D Manag. 2020, 50, 136–160. [Google Scholar] [CrossRef]
  11. Wimelius, H.; Mathiassen, L.; Holmstrom, J.; Keil, M. A paradoxical perspective on technology renewal in digital transformation. Inf. Syst. J. 2021, 31, 198–225. [Google Scholar] [CrossRef]
  12. Xue, L.; Zhang, Q.Y.; Zhang, X.M.; Li, C.Y. Can digital transformation promote green technology innovation? Sustainability 2022, 14, 7497. [Google Scholar] [CrossRef]
  13. Wu, T.; Chen, B.B.; Shao, Y.X.; Lu, H.X. Enable digital transformation: Entrepreneurial leadership, ambidextrous learning and organisational performance. Tech. Anal. Strat. Manag. 2021, 33, 1389–1403. [Google Scholar] [CrossRef]
  14. Skeldon, P. Global Number of Ecommerce Users Jumps 10% in 2020 and Will Hit 3.8bn This Year: Study. 2021. Available online: https://bit.ly/3apDnz8 (accessed on 10 August 2023).
  15. George, G.; Haas, M.R.; Pentland, A. Big data and management: From the Editors. Acad. Manag. J. 2014, 57, 321–326. Available online: https://ink.library.smu.edu.sg/lkcsb_research/4621 (accessed on 11 August 2023). [CrossRef]
  16. Attaran, M. Digital technology enablers and their implications for supply chain management. Supply Chain. Forum Int. J. 2020, 21, 158–172. [Google Scholar] [CrossRef]
  17. Yang, M.; Fu, M.; Zhang, Z. The adoption of digital technologies in supply chains: Drivers, process and impact. Technol. Forecast. Soc. Chang. 2021, 169, 120795. [Google Scholar] [CrossRef]
  18. Busulwa, R.; Pickering, M.; Mao, I. Digital transformation and hospitality management competencies: Toward an integrative framework. Int. J. Hosp. Manag. 2022, 102, 103132. [Google Scholar] [CrossRef]
  19. He, X.; Hu, W.; Li, W.; Hu, R. Digital transformation, technological innovation, and operational resilience of port firms in case of supply chain disruption. Mar. Pollut. Bull. 2023, 190, 114811. [Google Scholar] [CrossRef]
  20. Hughes, L.; Dwivedi, Y.K.; Misra, S.K.; Rana, N.P.; Raghavan, V.; Akella, V. Blockchain research, practice and policy: Applications, benefits, limitations, emerging research themes and research agenda. Int. J. Inf. Manag. 2019, 49, 114–129. [Google Scholar] [CrossRef]
  21. Morkunas, V.J.; Paschen, J.; Boon, E. How blockchain technologies impact your business model. Bus. Horiz. 2019, 62, 295–306. [Google Scholar] [CrossRef]
  22. Lee, K.; Azmi, N.; Hanaysha, J.; Alzoubi, H.; Alshurideh, M. The effect of digital supply chain on organizational performance: An empirical study in Malaysia manufacturing industry. Uncertain Supply Chain. Manag. 2022, 10, 495–510. [Google Scholar] [CrossRef]
  23. Far, S.B.; Rad, A.I.; Asaar, M.R. Blockchain and its derived technologies shape the future generation of digital businesses: A focus on decentralized finance and the Metaverse. Data Sci. Manag. 2023, 6, 183–197. [Google Scholar] [CrossRef]
  24. On, Y.; Reardon, A.J. What digital banks can learn from decentralised finance. J. Digit. Banking 2021, 5, 255–263. [Google Scholar]
  25. Liu, Z. Literature review of supply chain finance based on blockchain perspective. Open J. Bus. Manag. 2020, 9, 419–429. [Google Scholar] [CrossRef]
  26. Lahkani, M.J.; Wang, S.; Urbański, M.; Egorova, M. Sustainable B2B E-Commerce and Blockchain-Based Supply Chain Finance. Sustainability 2020, 12, 3968. [Google Scholar] [CrossRef]
  27. Allen, F.; Gu, X.; Jagtiani, J. Fintech, cryptocurrencies, and CBDC: Financial structural transformation in China. J. Int. Money Financ. 2022, 124, 102625. [Google Scholar] [CrossRef]
  28. Schueffel, P. DeFi: Decentralized Finance-An Introduction and Overview. J. Innov. Manag. 2021, 9, 1–9. [Google Scholar] [CrossRef]
  29. Wronka, C. Financial crime in the decentralized finance ecosystem: New challenges for compliance. J. Financ. Crime 2023, 30, 97–113. [Google Scholar] [CrossRef]
  30. Raja Santhi, A.; Muthuswamy, P. Influence of Blockchain Technology in Manufacturing Supply Chain and Logistics. Logistics 2022, 6, 15. [Google Scholar] [CrossRef]
  31. Seyedan, M.; Mafakheri, F. Predictive big data analytics for supply chain demand forecasting: Methods, applications, and research opportunities. J. Big Data 2020, 7, 1–22. [Google Scholar] [CrossRef]
  32. Bag, S.; Wood, L.C.; Xu, L.; Dhamija, P.; Kayikci, Y. Big data analytics as an operational excellence approach to enhance sustainable supply chain performance. Resour. Conserv. Recycl. 2020, 153, 104559. [Google Scholar] [CrossRef]
  33. Saura, J.R.; Palos-Sánchez, P.; Cerdá Suárez, L.M. Understanding the Digital Marketing Environment with KPIs and Web Analytics. Future Internet 2017, 9, 76. [Google Scholar] [CrossRef]
  34. Drivas, I.C.; Kouis, D.; Kyriaki-Manessi, D.; Giannakopoulou, F. Social Media Analytics and Metrics for Improving Users Engagement. Knowledge 2022, 2, 225–242. [Google Scholar] [CrossRef]
  35. Choi, T.-M.; Guo, S.; Luo, S. When blockchain meets social-media: Will the result benefit social media analytics for supply chain operations management? Transp. Res. Part E Logist. Transp. Rev. 2020, 135, 101860. [Google Scholar] [CrossRef]
  36. Dolgui, A.; Ivanov, D. 5G in digital supply chain and operations management: Fostering flexibility, end-to-end connectivity and real-time visibility through internet-of-everything. Int. J. Prod. Res. 2022, 60, 442–451. [Google Scholar] [CrossRef]
  37. Maheshwari, S.; Gautam, P.; Jaggi, C.K. Role of Big Data Analytics in supply chain management: Current trends and future perspectives. Int. J. Prod. Res. 2021, 59, 1875–1900. [Google Scholar] [CrossRef]
  38. Grover, P.; Kar, A.K.; Dwivedi, Y.K. Understanding artificial intelligence adoption in operations management: Insights from the review of academic literature and social media discussions. Ann. Oper. Res. 2022, 308, 177–213. [Google Scholar] [CrossRef]
  39. Mappesona, H.; Ikhsani, K.; Ali, H. Customer purchase decision model, supply chain management and customer satisfaction: Product quality and promotion analysis. Int. J. Supply Chain. Manag. 2020, 9, 592–600. Available online: https://core.ac.uk/download/pdf/288291233.pdf (accessed on 30 August 2023).
  40. Sivarajah, U.; Irani, Z.; Gupta, S.; Mahroof, K. Role of big data and social media analytics for business to business sustainability: A participatory web context. Ind. Mark. Manag. 2020, 86, 163–179. [Google Scholar] [CrossRef]
  41. Muhammad, A.; Ibrahim, M.; Ikramuddin, I.; Syahputra, H. The role of digital marketing platforms on supply chain management for customer satisfaction and loyalty in small and medium enterprises (SMEs) at Indonesia. Int. J. Supply Chain. Manag. 2020, 9, 1210–1220. Available online: https://core.ac.uk/download/pdf/328146431.pdf (accessed on 30 August 2023).
  42. Ranjan, J.; Foropon, C. Big data analytics in building the competitive intelligence of organizations. Int. J. Inf. Manag. 2021, 56, 102231. [Google Scholar] [CrossRef]
  43. Silva, S.C.; Duarte, P.A.O.; Almeida, S.R. How companies evaluate the ROI of social media marketing programmes: Insights from B2B and B2C. J. Bus. Ind. Mark. 2020, 35, 2097–2110. [Google Scholar] [CrossRef]
  44. Tavana, M.; Shaabani, A.; Raeesi Vanani, I.; Kumar Gangadhari, R. A Review of Digital Transformation on Supply Chain Process Management Using Text Mining. Processes 2022, 10, 842. [Google Scholar] [CrossRef]
  45. Kostakis, P.; Kargas, A. Big-Data Management: A Driver for Digital Transformation? Information 2021, 12, 411. [Google Scholar] [CrossRef]
  46. Fukui, T. A systems approach to big data technology applied to supply chain. In Proceedings of the 2016 IEEE International Conference on Big Data (Big Data), Washington, DC, USA, 5–8 December 2016; pp. 3732–3736. [Google Scholar] [CrossRef]
  47. Kache, F.; Seuring, S. Challenges and opportunities of digital information at the intersection of Big Data Analytics and supply chain management. Int. J. Oper. Prod. Manag. 2017, 37, 10–36. [Google Scholar] [CrossRef]
  48. Forbes. 15 Low-Cost Tactics to Increase Organic Traffic. 2022. Available online: https://www.forbes.com/sites/forbesbusinesscouncil/2022/11/10/15-low-cost-tactics-to-increase-organic-traffic/ (accessed on 9 August 2023).
  49. Poulos, M.; Korfiatis, N.; Papavlassopoulos, S. Assessing stationarity in web analytics: A study of bounce rates. Expert Syst. 2019, 37, e12502. [Google Scholar] [CrossRef]
  50. Lynch, O. The Case for Organic Traffic vs. Paid Traffic. 2023. Available online: https://cheq.ai/blog/organic-traffic-vs-paid-traffic-2/ (accessed on 9 August 2023).
  51. Griswold, M. The Gartner Supply Chain Top 25 for 2022. 2022. Available online: https://www.gartner.com/en/articles/the-gartner-supply-chain-top-25-for-2022#:~:text=This%20year%2C%20Cisco%20retains%20the,and%20creating%20supply%20chain%20ecosystems (accessed on 16 June 2023).
  52. Pepi, K. 8 Best DeFi Apps to Try in 2023. 2022. Available online: https://www.business2community.com/cryptocurrency/best-defi-apps (accessed on 16 June 2023).
  53. Cisco Systems. 2023. Available online: https://www.cisco.com/ (accessed on 12 June 2023).
  54. Schneider Electric. 2023. Available online: https://www.se.com/ (accessed on 12 June 2023).
  55. Colgate-Palmolive. 2023. Available online: https://www.colgatepalmolive.com/ (accessed on 12 June 2023).
  56. Johnson & Johnson. 2023. Available online: https://www.jnj.com/ (accessed on 12 June 2023).
  57. Pepsico. 2023. Available online: https://www.pepsico.com/ (accessed on 12 June 2023).
  58. Binance. 2023. Available online: https://www.binance.com/ (accessed on 12 June 2023).
  59. Coinbase. 2023. Available online: https://www.coinbase.com/ (accessed on 12 June 2023).
  60. Crypto. 2023. Available online: https://crypto.com/ (accessed on 12 June 2023).
  61. DeFi Swap. 2023. Available online: https://defiswap.io/ (accessed on 12 June 2023).
  62. AQRU. 2023. Available online: https://aqru.io/ (accessed on 12 June 2023).
  63. Semrush. 2023. Available online: https://www.semrush.com/ (accessed on 12 June 2023).
  64. Fanpage Karma. 2023. Available online: https://www.fanpagekarma.com/ (accessed on 12 June 2023).
  65. Realeye. 2023. Available online: https://www.realeye.io/ (accessed on 30 June 2023).
  66. Fanpage Karma Academy. Metrics Overview. 2023. Available online: https://academy.fanpagekarma.com/en/metrics/ (accessed on 9 August 2023).
  67. MentalModeler. 2022. Available online: https://dev.mentalmodeler.com/ (accessed on 16 June 2023).
  68. Migkos, S.P.; Sakas, D.P.; Giannakopoulos, N.T.; Konteos, G.; Metsiou, A. Analyzing Greece 2010 Memorandum’s Impact on Macroeconomic and Financial Figures through FCM. Economies 2022, 10, 178. [Google Scholar] [CrossRef]
  69. Mpelogianni, V.; Groumpos, P.P. Re-approaching fuzzy cognitive maps to increase the knowledge of a system. AI Soc. 2018, 33, 175–188. [Google Scholar] [CrossRef]
  70. Retzlaff, C.O.; Ziefle, M.; Calero-Valdez, A. The history of agent-based modeling in the social sciences. In Digital Human Modeling and Applications in Health, Safety, Ergonomics and Risk Management. Human Body, Motion and Behavior; Duffy, V.G., Ed.; HCII 2021; Lecture Notes in Computer Science; Springer: Cham, Switzerland, 2021; p. 12777. [Google Scholar] [CrossRef]
  71. Anylogic. 2022. Available online: https://www.anylogic.com/ (accessed on 22 June 2023).
  72. Sakas, D.P.; Giannakopoulos, N.T.; Trivellas, P. Exploring affiliate marketing’s impact on customers’ brand engagement and vulnerability in the online banking service sector. Int. J. Bank Mark. 2023. ahead-of-print. [Google Scholar] [CrossRef]
  73. Sarishma, D.; Sangwan, S.; Tomar, R.; Srivastava, R. A Review on Cognitive Computational Neuroscience: Overview, Models, and Applications. In Innovative Trends in Computational Intelligence. EAI/Springer Innovations in Communication and Computing; Tomar, R., Hina, M.D., Zitouni, R., Ramdane-Cherif, A., Eds.; Springer: Cham, Switzerland, 2022. [Google Scholar] [CrossRef]
  74. Rawnaque, F.S.; Rahman, K.M.; Anwar, S.F.; Vaidyanathan, R.; Chau, T.; Sarker, F.; Al Mamun, K.A. Technological advancements and opportunities in Neuromarketing: A systematic review. Brain Inf. 2020, 7, 10. [Google Scholar] [CrossRef]
  75. Barbierato, E.; Berti, D.; Ranfagni, S.; Hernández-Álvarez, L.; Bernetti, I. Wine label design proposals: An eye-tracking study to analyze consumers’ visual attention and preferences. Int. J. Wine Bus. Res. 2023, 35, 365–389. [Google Scholar] [CrossRef]
  76. Casado-Aranda, L.-A.; Sánchez-Fernández, J.; Ibáñez-Zapata, J.-A. Evaluating Communication Effectiveness Through Eye Tracking: Benefits, State of the Art, and Unresolved Questions. Int. J. Bus. Commun. 2020, 60, 24–61. [Google Scholar] [CrossRef]
  77. Lieskovská, E.; Jakubec, M.; Jarina, R.; Chmulík, M. A Review on Speech Emotion Recognition Using Deep Learning and Attention Mechanism. Electronics 2021, 10, 1163. [Google Scholar] [CrossRef]
  78. Farnoush, A.; Gupta, A.; Dolarsara, H.A.; Paradice, D.; Rao, S. Going beyond intent to adopt Blockchain: An analytics approach to understand board member and financial health characteristics. Ann. Oper. Res. 2022, 308, 93–123. [Google Scholar] [CrossRef]
  79. Hasan, M.R.; Shiming, D.; Islam, M.A.; Hossain, M.Z. Operational efficiency effects of blockchain technology implementation in firms: Evidence from China. Rev. Int. Bus. Strategy 2020, 30, 163–181. [Google Scholar] [CrossRef]
  80. Stroumpoulis, A.; Kopanaki, E. Theoretical Perspectives on Sustainable Supply Chain Management and Digital Transformation: A Literature Review and a Conceptual Framework. Sustainability 2022, 14, 4862. [Google Scholar] [CrossRef]
  81. Sakas, D.P.; Giannakopoulos, N.T.; Kanellos, N.; Migkos, S.P. Innovative Cryptocurrency Trade Websites’ Marketing Strategy Refinement, via Digital Behavior. IEEE Access 2022, 10, 63163–63176. [Google Scholar] [CrossRef]
  82. Sakas, D.P.; Giannakopoulos, N.T.; Nasiopoulos, D.K.; Kanellos, N.; Tsoulfas, G.T. Assessing the Efficacy of Cryptocurrency Applications’ Affiliate Marketing Process on Supply Chain Firms’ Website Visibility. Sustainability 2023, 15, 7326. [Google Scholar] [CrossRef]
  83. Sakas, D.P.; Giannakopoulos, N.T.; Terzi, M.C.; Kamperos, I.D.G.; Kanellos, N. What is the connection between Fintechs’ video marketing and their vulnerable customers’ brand engagement during crises? Int. J. Bank Mark. 2023. ahead-of-print. [Google Scholar] [CrossRef]
Figure 1. Fuzzy Cognitive Mapping mind map. The red-colored arrows indicate positive correlation between the factors, while the blue-colored indicate negative correlation. The thickness of the arrows show the intensity of the relationships.
Electronics 12 04219 g001
Figure 2. Hybrid Model Deployment of DeFi Platforms’ Social Media Analytics and Supply Chain Firms’ performance.
Electronics 12 04219 g002
Figure 3. Allocation of 10,000 agents in (a) with little to no usage of DeFi social media, and (b) with increased usage of social media.
Electronics 12 04219 g003
Figure 4. Simulation of Cryptocurrency Trade and Supply Chain Firms’ variables in the 360 days.
Electronics 12 04219 g004
Figure 5. Aggregated heatmap analysis of the study’s 21 participants. (a) shows the first 15 s of the DeFi Twitter profile observation and (b) shows the trailing seconds.
Electronics 12 04219 g005aElectronics 12 04219 g005b
Figure 6. Aggregated facial analysis of the study’s 21 participants. (a) shows the first 15 s of the DeFi Twitter profile observation and (b) shows the trailing seconds.
Electronics 12 04219 g006aElectronics 12 04219 g006b
Table 2. Descriptive Statistics of the 5 Supply Chain Firms and DeFi during six months.
MetricsMeanMinMaxStd. Deviation
Supply Chain Firms (SC)
Organic Costs24,437,840.0817,760,939.0030,389,621.004,516,413.75
Paid Costs1,363,788.42717,103.002,676,244.00500,493.54
Bounce Rate0.620.570.650.03
New Customers15,888,074.4313,230,273.0018,363,549.001,812,070.90
Decentralized Finance (DF)
Organic Traffic53,389,414.8343,390,849.0060,687,631.005,058,999.21
Bounce Rate0.630.570.710.04
Post Impressions376,508.8849,215.00550,628.00198,170.48
Engagement (%)19.003.0034.000.12
Total Followers47,403.3346,480.0047,900.00549.72
Followers Growth6044.041012.0010,884.003549.10
Post Interaction (%)8.001.0016.005.40
n = 180 observation days for the five selected Supply Chain Firms and DeFi Platforms.
Table 3. Correlation analysis matrix.
SC Organic CostsSC Paid CostsSC Bounce RateSC New CustomersDF Organic TrafficDF Bounce RateDF Post
Impressions
DF
Engagement
DF Total FollowersDF Followers GrowthDF Post Interaction
SC Organic Costs1−0.349−0.459−0.5540.170−0.407−0.823 *−0.846 *−0.804−0.831 *−0.819 *
SC Paid Costs−0.34910.1630.016−0.026−0.0610.882 *0.898 *0.892 *0.880 *0.883 *
SC Bounce Rate−0.4590.16310.877 **−0.2220.2600.5760.3340.5770.3740.313
SC New Customers−0.5540.0160.877 **1−0.3450.1770.4230.2940.4230.3500.322
DF Organic Traffic0.170−0.026−0.222−0.3451−0.402−0.748−0.904 *−0.741−0.887 *−0.908 *
DF Bounce Rate−0.407−0.0610.2600.177−0.40210.2850.2890.2660.3030.266
DF Post Impressions−0.823 *0.882 *0.5760.423−0.7480.28510.956 **0.999 **0.954 **0.931 **
DF Engagement−0.846 *0.898 *0.3340.294−0.904 *0.2890.956 **10.955 **0.992 **0.989 **
DF Total Followers−0.8040.892 *0.5770.423−0.7410.2660.999 **0.955 **10.957 **0.935 **
DF Followers Growth−0.831 *0.880 *0.3740.350−0.887 *0.3030.954 **0.992 **0.957 **10.997 **
DF Post Interaction−0.819 *0.883 *0.3130.322−0.908 *0.2660.931 **0.989 **0.935 **0.997 **1
* and ** indicate statistical significance at the 95% and 99% levels, accordingly.
Table 4. Impact of DeFi Social Media Analytics on their Organic Traffic.
VariablesStandardized CoefficientR2Fp-Value
Constant1.000-0.000 **
Post Impressions−2.9140.000 **
Engagement−1.2800.000 **
Total Followers4.3490.000 **
Followers Growth−1.0550.000 **
Post Interaction0.0570.000 **
** indicate statistical significance at the 99% level.
Table 5. Impact of DeFi Social Media Analytics on their Website Bounce Rate.
VariablesStandardized CoefficientR2Fp-Value
Constant-1.000-0.000 **
Post Impressions−6.9960.000 **
Engagement3.9440.000 **
Total Followers0.7550.000 **
Followers Growth28.3450.000 **
Post Interaction−26.0860.000 **
** indicate statistical significance at the 99% level.
Table 6. Impact of DeFi Social Media Analytics on Supply Chain Firms’ Organic Traffic Costs.
VariablesStandardized CoefficientR2Fp-Value
Constant-1.000-0.000 **
Post Impressions−23.8530.000 **
Engagement5.9650.000 **
Total Followers21.6070.000 **
Followers Growth5.0680.000 **
Post Interaction−9.7680.000 **
** indicate statistical significance at the 99% level.
Table 7. Impact of DeFi Social Media Analytics on Supply Chain Firms’ Paid Traffic Costs.
VariablesStandardized CoefficientR2Fp-Value
Constant-1.000-0.000 **
Post Impressions−11.7540.000 **
Engagement4.4520.000 **
Total Followers12.3370.000 **
Followers Growth−4.4800.000 **
Post Interaction0.3530.000 **
** indicate statistical significance at the 99% level.
Table 8. Impact of DeFi Social Media Analytics on Supply Chain Firms Website New Customers.
VariablesStandardized CoefficientR2Fp-Value
Constant-1.000-0.000 **
Post Impressions16.0640.000 **
Engagement−8.4340.000 **
Total Followers−11.5490.000 **
Followers Growth−2.8890.000 **
Post Interaction7.3790.000 **
** indicate statistical significance at the 99% level.
Disclaimer/Publisher’s Note: The statements, opinions and data contained in all publications are solely those of the individual author(s) and contributor(s) and not of MDPI and/or the editor(s). MDPI and/or the editor(s) disclaim responsibility for any injury to people or property resulting from any ideas, methods, instructions or products referred to in the content.

