Article

An Integrated Scheme for Forecasting and Controlling Ramps in Offshore Wind Farms Considering Wind Power Uncertainties during Extreme Storms

State Grid Jiangsu Electric Power Company Ltd., Research Institute, Nanjing 211103, China
*
Author to whom correspondence should be addressed.
Electronics 2023, 12(21), 4443; https://doi.org/10.3390/electronics12214443
Submission received: 19 September 2023 / Revised: 23 October 2023 / Accepted: 25 October 2023 / Published: 29 October 2023

Abstract

:
Global warming-induced extreme tropical storms disrupt the operation of offshore wind farms, causing wind power ramp events and threatening the safety of the interconnected onshore grid. In order to attenuate the impact of these ramps, this paper proposes an integrated strategy for forecasting and controlling ramps in offshore wind farms. First, the characteristics of wind power ramps during tropical storms are studied, and a general ramp control framework is established. Second, a wind power ramp prediction scheme is designed based on a minimal gated memory network (MGMN). Third, by taking into account the wind power ramp prediction results and wind power uncertainties, a chance-constraint programming-based optimal ramp control scheme is developed to simultaneously maximize wind power absorption and minimize ramp control costs. Finally, we use real-world offshore wind farm data to validate the effectiveness of the proposed strategy.

1. Introduction

Propelled by greenhouse gas emission-driven climate change, extreme weather events such as tropical storms can have far-reaching influences on the social security of disaster-stricken areas. As for the electricity sector, tropical storms can damage critical electricity infrastructure, causing widespread outages and destabilizing system operations. Even though the improved mechanical strength of electrical equipment greatly enhances its ability to withstand storms, power turbulence from storm-caused wind power ramps still threatens the system’s stability by incurring transmission congestion, power imbalances, and unexpected frequency deviations. Therefore, controlling storm-related wind power ramps is becoming an urgent priority in power system operation.
Ramp events occur in various energy sectors, including load, solar, and wind power [1,2,3]. Load ramp events (LREs) are driven by human activities, whereas solar and wind power ramps are caused by complex atmospheric phenomena [4]. Diurnal radiation variations and abrupt short-term micro-climates can lead to a solar power surge or ebb. For example, when a cloud temporarily shades photovoltaic (PV) panels, inverter outputs will ramp down quickly. Similarly, wind gusts caused by tropical storms can generate wind power ramps. Renewable energy power ramps can pose a great threat to secure and stable grid operation. Hence, it is essential to possess situational awareness of renewable power ramp risks and establish preventive ramp control. In this context, researchers have conducted various investigations into the forecasting of renewable energy power ramps.
As for solar power ramp forecasting, Ref. [5] proposed a post-processing adjustment approach to improve the hour-ahead forecasting of solar power ramp events. A credal network (CN) and imprecise Dirichlet model-based forewarning strategy for solar power ramps were developed in [6]. The CN model learns the relationship between meteorological conditions and ramp events. Considering the scarcity of historical ramp event records, a probability interval is adopted to reflect the ambiguous correlation between SPREs and meteorological conditions. Wind power prediction plays an important role in ramp prediction. Recently, various machine learning-based wind power prediction strategies have been proposed [7,8,9,10]. Ref. [11] developed an ensemble learning-based wind power prediction scheme by integrating multiple gradient boosting trees (GBDTs) based on Bayesian optimization. Ref. [12] proposed a two-stage framework for wind power forecasting using contrastive learning, generating improved performance with high accuracy and robustness. Ref. [13] proposed a deep reinforcement learning-based wind power prediction strategy considering privacy protection. Ref. [14] studied wind power ramp forecasting in Brazil and Uruguay. A wavelet decomposition method applying 48 different mother wavelet functions was adopted for feature extraction, and then deep recurrent neural networks were trained for wind power ramp forecasting. By exploiting the wind power curve, Ref. [15] designed a primary model and used Markov-switching auto-regression to correct the prediction residuals. Eventually, an improved swinging door algorithm was presented to extract the ramping segments. Ref. [16] also used the swinging door algorithm for ramp event detection. Additionally, the authors developed a novel dynamic programming model for simultaneous ramp trend identification and segment combination, thus improving prediction performance.
Ramp control aims to attenuate the influence of unexpected renewable power ramps on grid operation. Researchers usually implement ramp control either at the individual unit level [17,18,19,20] or the system level. In [17], the generator speed and pitch angle were regulated to smooth wind power outputs. Besides controlling wind turbines, external auxiliary resources such as energy storage systems (ESSs) can also actively regulate wind power ramps. Ref. [18] studied classified ramping scenarios and proposed an active adjustment strategy to decide the expected charging/discharging energy of ESSs according to the conditions of the wind power and the ESS. Ref. [19] used ESSs to compensate for negative unbalanced power caused by composite load changes and wind ramps. A smoothing model based on two-layer model algorithm control (MAC) was established for ESSs. Considering the cost of ESSs, Ref. [20] designed the power consumption control of heating and ventilation air-conditioning (HVAC) systems to attenuate turbine power outputs. System-level ramp control usually considers the operational goals of the whole system instead of a specific wind turbine or wind farm. In [21], an ESS-based RR control strategy was developed to smooth and limit PV power fluctuations in power grid operation. The system operator needs to dispatch ramp control orders to the respective regulation resources (e.g., wind farms and ESSs). The regulation resources would attempt to guarantee good order-tracking performance to obtain more regulation profits. In [22], the authors considered the situation where wind farms compete to participate in ramp control to decrease control errors during ramp events. Renewable energy power ramps at times can serve as ramping products to provide ramping services. In this situation, operators would use, rather than control, power ramps [23,24,25].
Recent rampant tropical storm events have led to more wind power ramp events globally [26]. The scale and strength of ramp events have become too large to be ignored. It has become urgent to control wind power ramps of considerable strength and reduce their negative influence on system operation. Although existing wind ramp control strategies use various resources such as ESSs and HVAC systems to achieve an improved wind power profile and reduced control costs, they usually do not sufficiently consider the following aspects:
  • Integration of wind power ramp forecasting and control: Previous studies have mainly focused on forecasting and controlling wind power ramp events separately, resulting in the segregation of wind power ramp forecasting and control. Researchers usually adopt a self-defined ramp model to simulate wind power ramp events. Under these conditions, wind power ramp control design cannot use real ramp information for better control performance validation.
  • Wind power ramp control considering uncertainties: Wind power ramp forecasts may contain uncertainties due to the intermittency of wind power. Deterministic ramp control can incur operational risks by treating wind power as deterministic variables. Therefore, wind power ramp control should consider wind power uncertainties to reduce operational risks.
To address the aforementioned challenges, we present an integrated scheme for forecasting and controlling wind power ramps that considers uncertainties in offshore wind farms. First, we analyze and assess the influence of tropical storms on the offshore wind farm output power. Second, based on the assessment results, we extract relevant ramp features and design an indirect ramp forecasting model using an MGMN. Finally, we develop a system-level wind power ramp control strategy using the forecast information.
The main contributions are as follows:
  • An integrated offshore wind power ramp prediction and control framework is developed to support ramp event warnings and the secure operation of the interconnected onshore main grid.
  • A chance-constraint programming-based wind power ramp control strategy is developed within the integrated framework to achieve the secure integration of offshore wind power into the onshore main grid.
The remainder of this paper is as follows. Section 2 presents a general framework with integrated wind power ramp forecasting and control under tropical storm conditions. Section 3 focuses on the detailed procedures of the stochastic wind power ramp control model and control strategy design. Section 4 presents some case studies and analyses. Section 5 presents the conclusions.

2. General Framework of Integrated Scheme for Forecasting and Controlling Wind Power Ramps during Extreme Storms

In this section, we first systematically study how extreme storms induce offshore wind power ramps by discussing their meteorological factors. Then, we systematically present the integrated wind power ramp forecasting and control framework, detailing the basic modules in the framework.

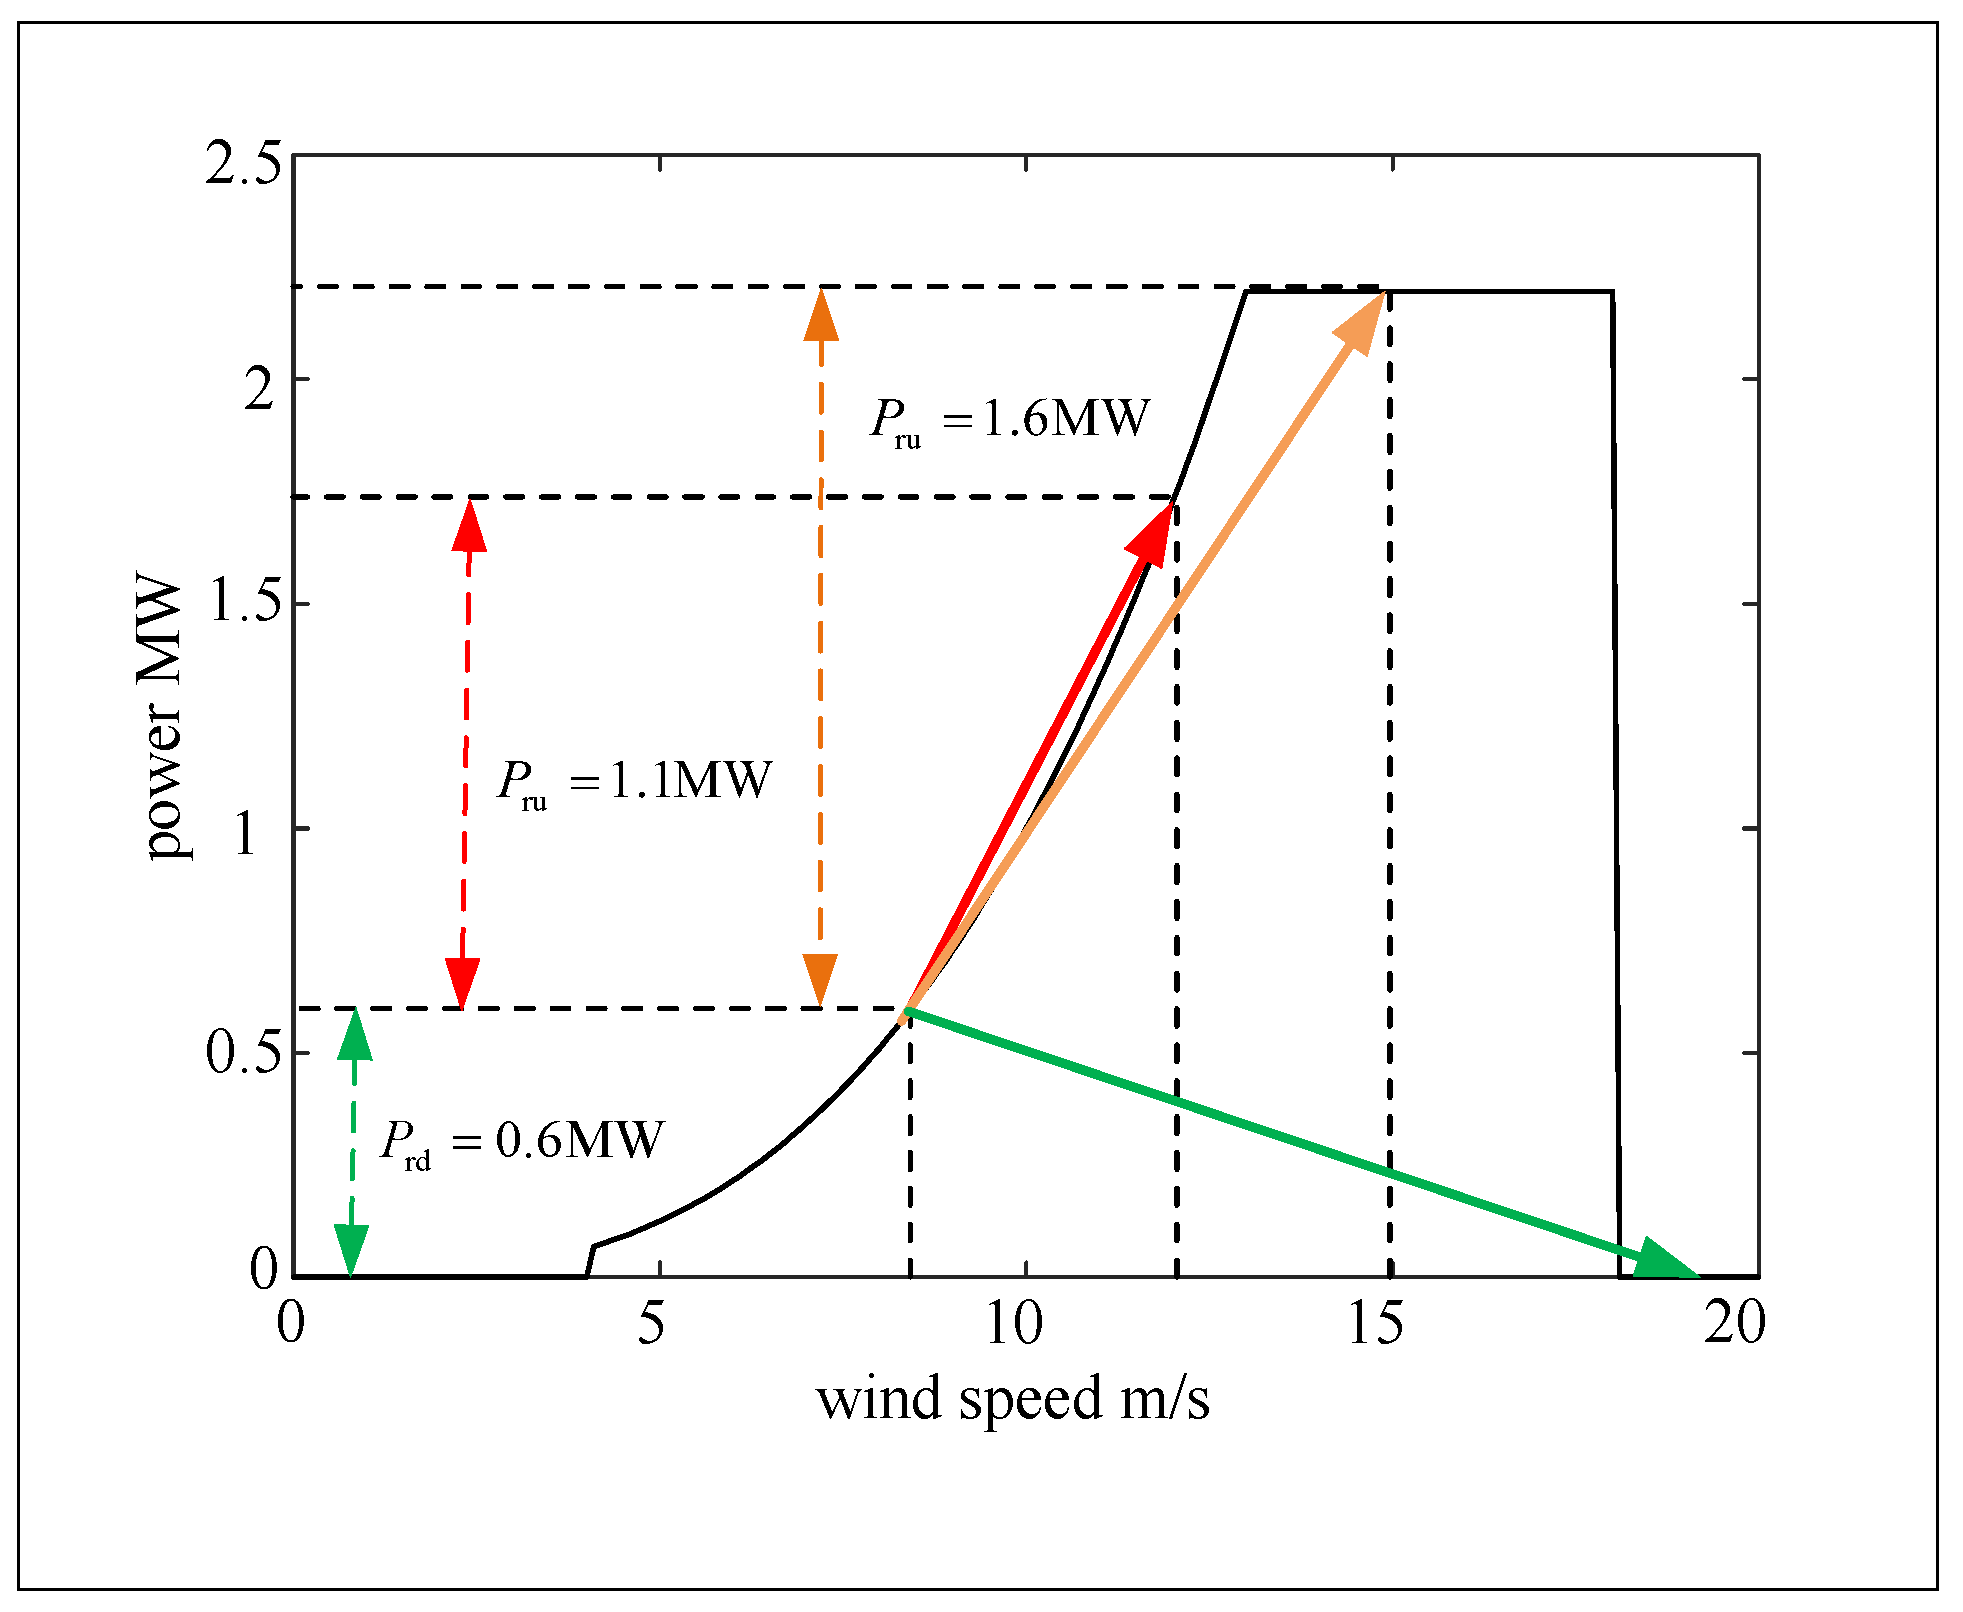
2.1. Wind Power Ramps during Tropical Storms

Unlike regular wind conditions, tropical storms are accompanied by unexpectedly abnormal wind gusts. In this paper, we describe the abnormal patterns from the perspective of the following components. The most explicit feature of tropical storms is arguably the elevated wind speed. Based on the National Hurricane Center [27], a tropical cyclone has maximum sustained winds of 39 to 73 mph (17.4 m/s to 32.6 m/s). In contrast, the normal wind speed range for the operation of wind turbines is 13 to 31 mph (5.8 m/s to 13.9 m/s), which falls into the category of a breeze.
Usually, there exists an analytical mapping between the turbine output power P w ( v ) and wind speed v [28,29]:
P w v = 0 v < v in , v > v out ρ A C p v 3 ρ A C p v 3 2 v in v v rated 2 v in v v rated P rated v rated v v out
where P rated denotes the rated wind power; ρ is the air density; A is the sweeping area of an impeller; C p is the power coefficient. v in , v rated , and v out denote the cut-in, rated, and cut-out wind speeds. According to (1), when wind speed v transits from normal breeze v b into unexpected gale v g in storms, there will exist two broad ramp scenarios: (1) ramp-ups and (2) ramp-downs.
Ramp-ups occur when v g is smaller than the cut-out speed v out .
P ru = ρ A C p v g 3 v b 3 ρ A C p v g 3 v b 3 2 2 , v g v rated P ru = P rated ρ A C p v b 3 ρ A C p v b 3 2 2 , v rated v g v out
In (2), we can see that the amplitude of ramp-ups increases with increasing v g . Then, P r u reaches the constant value as v g falls into the range of ( v in , v rated ) .
Ramp-downs occur when v g surpasses the cut-out speed. The amplitude P rd of ramp-downs v out is:
P rd = ρ A C p v b 3 ρ A C p v b 3 2 2
As shown in Figure 1, when the wind speed changes from v b = 8.5 m/s to three different values during tropical storms, the wind turbine experiences three different ramps, indicated by the red, orange, and green arrows. Given a rated power of 2.5 MW and considering a threshold of 20 % capacity for one-hour ramps [30], all three ramp events in Figure 1 violate the standard. Atmospheric pressure and temperature can affect the turbine output power P w by changing the air density ρ in (1). ρ represents the mass per unit volume of the Earth’s atmosphere. Based on the ideal gas law, the density of dry air is:
ρ = p m k b T
where p is the atmospheric pressure; T is the temperature; k b is the Boltzmann constant; and m is the molecular mass of dry air. According to (4), air at a high temperature is less dense than air at a low temperature, resulting in a smaller ρ . High-pressure air is denser than low-pressure air, resulting in a larger ρ . Similar to wind speed change-induced power ramp scenarios, abrupt changes in temperature and pressure can cause abrupt changes in ρ , leading to wind power ramps.

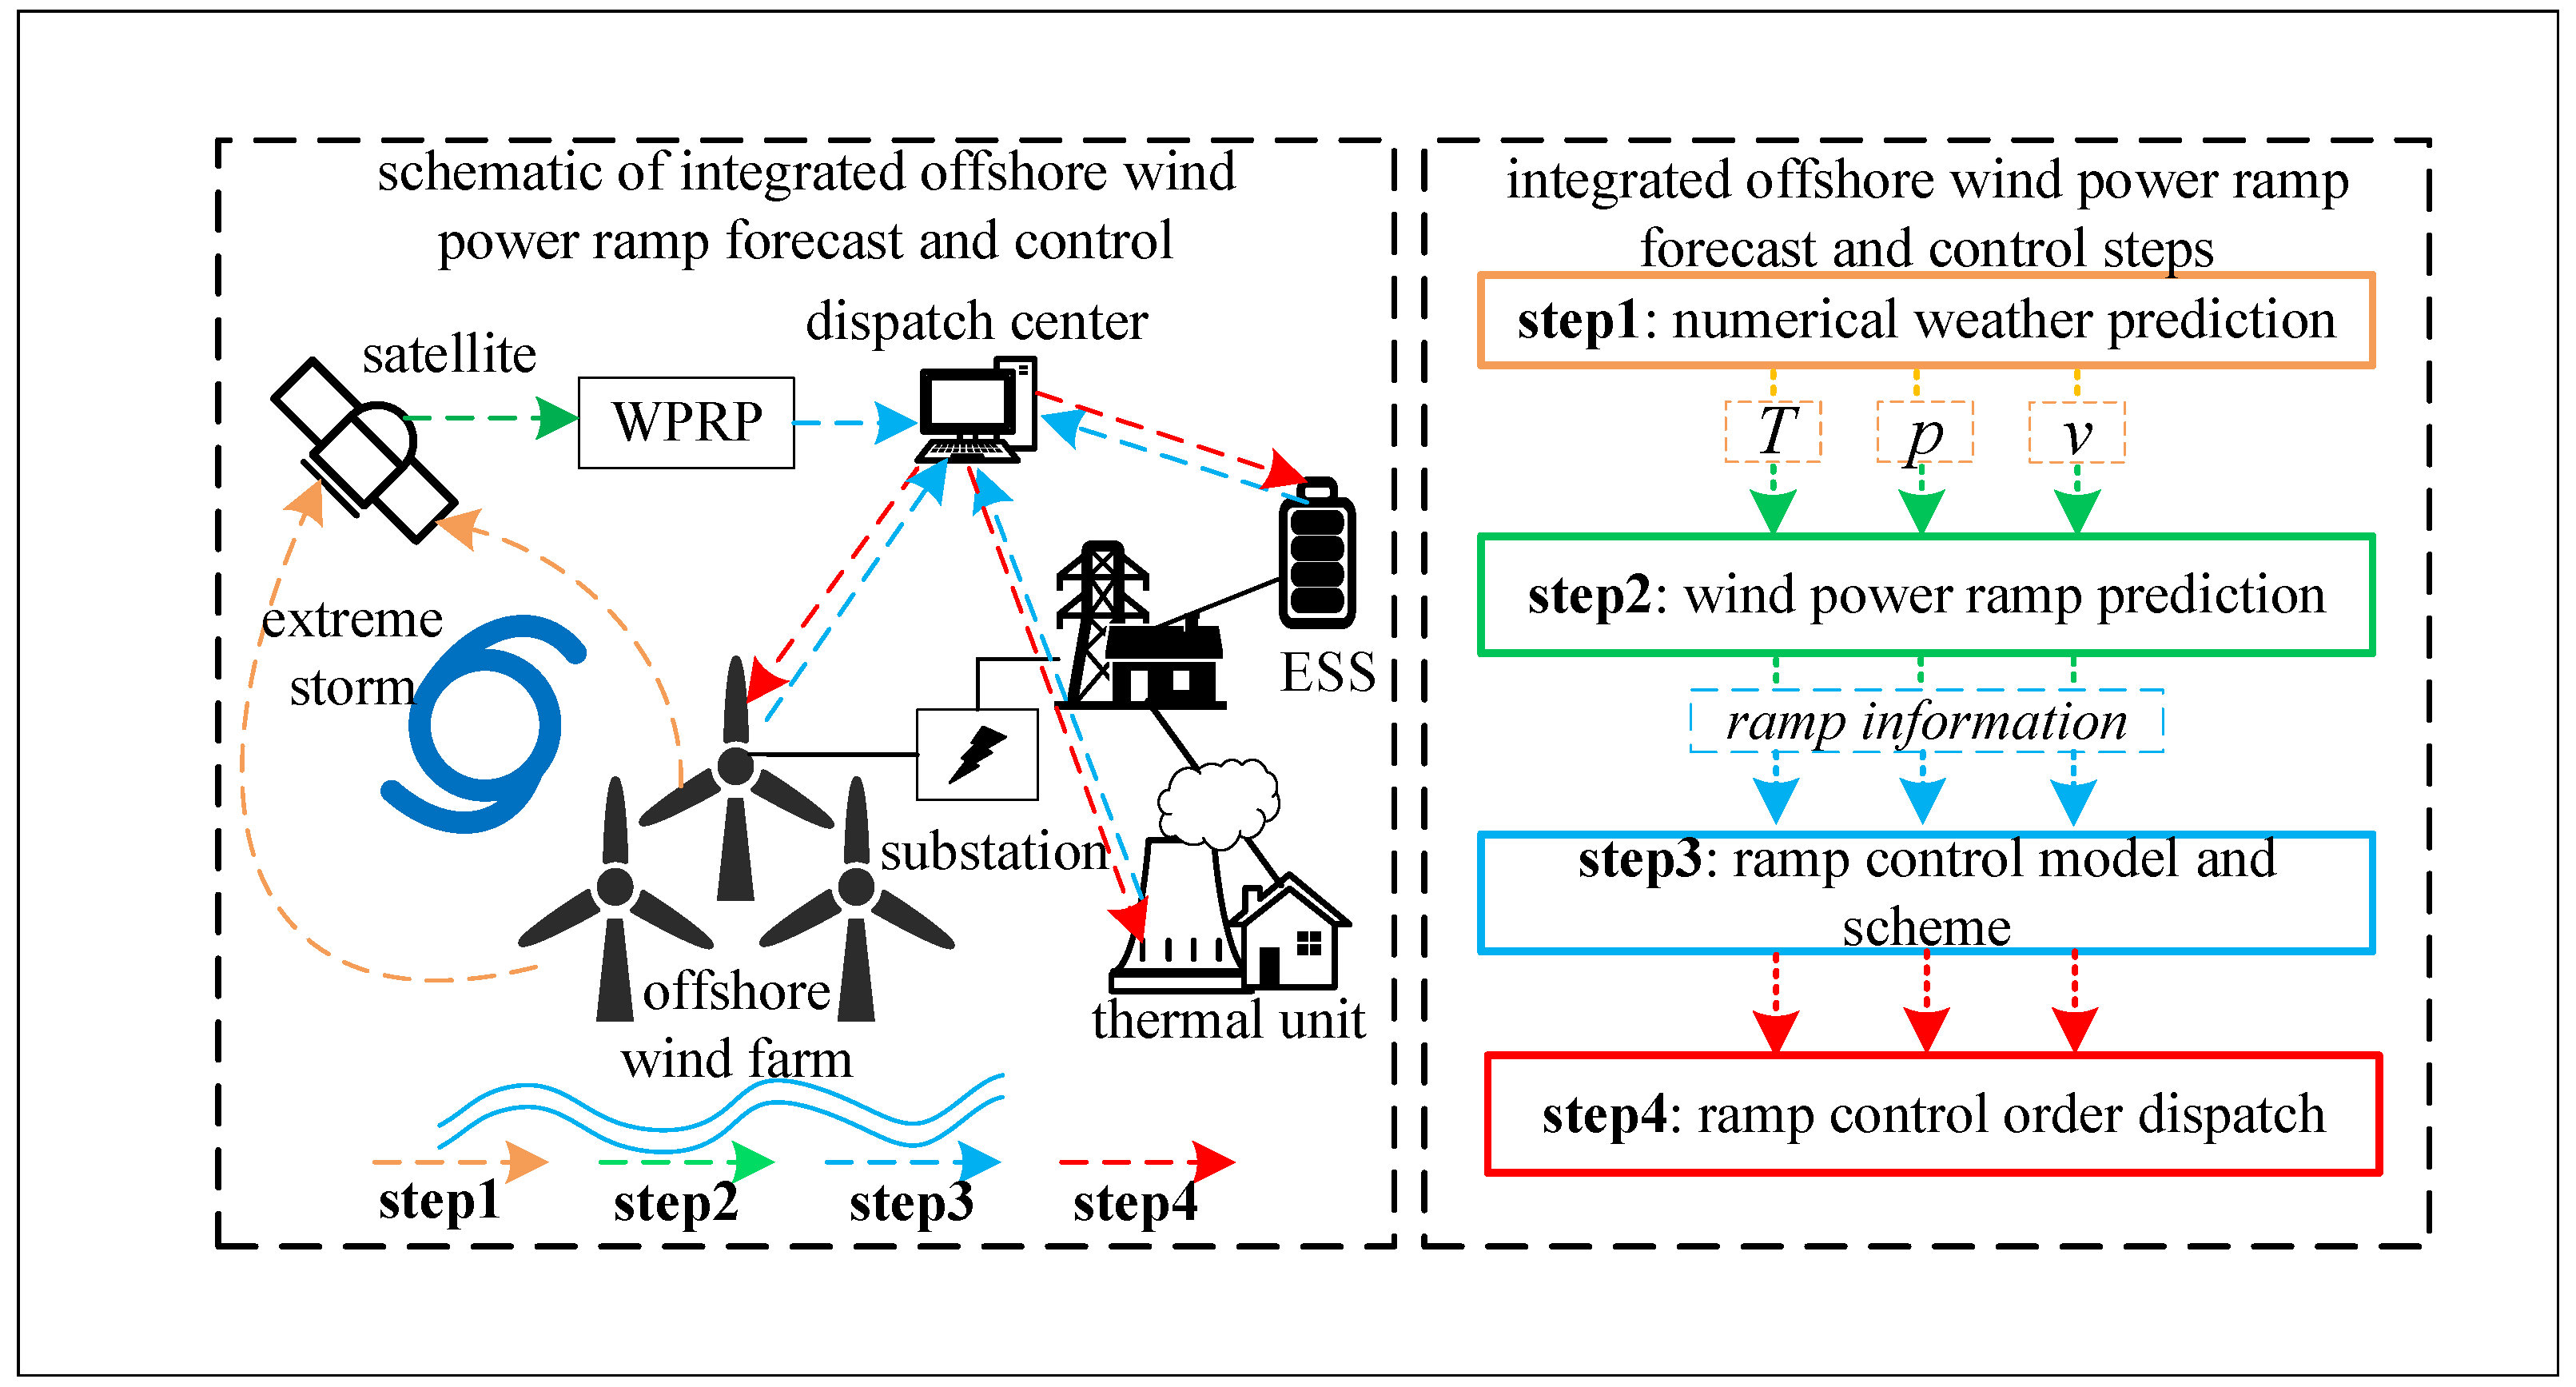
2.2. General Framework of Integrated Offshore Wind Power Ramp Control

Wind power ramp events can cause a significant short-term power imbalance, threatening the safe and stable operation of power systems. Therefore, it is essential to develop wind power ramp control strategies that can attenuate the influence of wind power ramps. The general offshore wind power ramp control framework consists of the following three modules: (1) offshore wind power prediction; (2) offshore wind power ramp identification; and (3) offshore wind power ramp control. The offshore wind power prediction provides the predicted wind power information for offshore wind power ramp identification. After detecting wind power ramps, the dispatch center switches to the offshore wind power ramp control mode.

2.2.1. Offshore Wind Power Prediction

In this paper, we use a minimal gated memory network (MGMN) to achieve offshore wind power prediction. An MGMN is a simplified gated structure memory network that adopts only one set of weight matrices in the hidden layer. Compared to the commonly used long short-term memory (LSTM), an MGMN simplifies the network structure by removing output gates and bias. Meanwhile, input gates and forget gates are coupled, which reduces the training process without reducing the prediction accuracy. The detailed prediction procedures are as follows:
  • Step 1: Based on the collected offshore wind farm data, perform a correlation analysis and select the explanatory variables s 1 s 2 s m that are strongly related to wind power.
  • Step 2: Using the explanatory variables, construct the datasets D = d t , d t = S t P w t , S t = s 1 t s 2 t s m t . s i ( t ) represents the ith explanatory variable at time t. P w ( t ) represents the wind power at time t. Divide D into the training dataset D t r a i n R N t r × m + 1 and the test dataset D t r a i n R N t e × m + 1 .
  • Step 3: Input the training dataset D t r a i n R N t r × m + 1 into the MGMN to obtain the predicted wind power P w f ( t ) :
    i t = 1 sigmoid W x · S t + W h · h t 1 + b f
    a t = tanh W x · S t + W h · h t 1 + b a
    h t = f t · h t 1 + i t · a t
    P w f ( t ) = sigmoid W y · h t
    where W x , W h , and W y represent the weight matrices of the MGMN, and b f and b a represent the bias vectors.
  • Step 4: Compute the loss function:
    L P w f ( t ) , P w ( t ) = t = 1 N t r P w f ( t ) P w ( t ) 2
    Update the weights using the gradient descent method:
    W x i j : = W x i j η L W x
    W h i j : = W h i j η L W h
    W y i j : = W y i j η L W y
  • Step 5: Repeat steps 3–4 until the stop criteria are reached. Input the test dataset D train R N te × m + 1 to check the performance of the MGMN-based prediction model.

2.2.2. Offshore Wind Power Ramp Identification

Using the wind power prediction information in Section 2.2.1, we can determine whether wind power ramps occur at a specific time interval ( t 0 , t 1 ) . Generally, there exist four ramp definitions that can aid in ramp detection [31]. In this paper, we use Definition 1 and calculate the difference Δ P w = P w f ( t 1 ) P w f ( t 0 ) between the power at the beginning t 0 and the end t 1 of the time interval. If the difference Δ P w surpasses the threshold Δ P w 0 , we determine that a wind ramp occurs:
Δ P w > Δ P w 0

2.2.3. Offshore Wind Power Ramp Control

After detecting the wind power ramps, the dispatch center will switch to the wind power ramp control mode to attenuate the influence. Instead of studying the turbine-level output power smoothing, we focus on the system-level output power attenuation, which is usually formulated as an optimization problem. When integrated into the onshore main power system, the dispatch center requires that the offshore wind power ramp should be maintained within the allowable range. Therefore, the main goal of wind power ramp control is to achieve minimal ramp control costs while satisfying the ramp limits.
Based on Section 2.2.1, Section 2.2.2 and Section 2.2.3, we present a schematic in Figure 2 summarizing the aforementioned three modules. In Step 1, the satellite uses scanned measurements to forecast temperature T, atmospheric pressure p, and wind speed v. In Step 2, machine learning-based wind power ramp prediction (WPRP) is employed to determine whether the dispatch center should switch to ramp control mode. In Step 3, based on the ramp information from Step 2, the dispatch center builds the ramp control model by collecting operational information from the respective regulation units. In Step 4, through the execution of the ramp control scheme, the dispatch center sends the ramp control orders to the respective regulation units. The forecast provides wind power prediction information and the wind power ramp status for the optimization-based ramp control.

3. Offshore Wind Power Ramp Control Scheme during Extreme Storms

The core step of integrated offshore wind power ramp forecasting and control is the development of a ramp control model using the forecast results. Without loss of generality, this section first presents a benchmark wind power ramp control model considering no wind power uncertainties. The main objective of wind power ramp control is to minimize the regulation cost while guaranteeing that the controlled wind power ramp meets the threshold. This paper defines the threshold as the r th % of the installed nameplate capacity P N for the offshore wind farm. In other words, the wind power ramp after control should fall in the range of r th % to r th % :
r th % P N P w t P w t 1 r th % P N , t N t \ 1
Besides Equation (14), wind ramp power control should also satisfy the (1) source-level operational constraints, and (2) system-level operational constraints. The source-level operational constraints mainly contain the operational constraints of individual regulation units.

3.1. Source-Level Operational Constraints

3.1.1. Operational Constraints of ESSs

0 P ess , i dis t P ess , i d i s , max x ess , i dis t , t N t , i N s
0 P ess , i c h a t P ess , i c h a , max x ess , i c h a t , t N t , i N s
x ess , i dis t + x ess , i r m c h a t 1 , i N s
E ess , i min E ess , i t E ess , i max , t N t , i N s
E ess , i t = η s cha P ess , i cha t 1 1 η s out η s o u t P e s s , i d i s t + E e s s , i t 1 , t N t \ 1 , i N s
E ess , i t = η s cha P ess , i cha t 1 1 η s out η s dis P ess , i dis t + E ess , i 0 , t = 1 , i N s
where P ess , i dis ( t ) denotes the discharging power of ESS i at time t; P ess , i dis , max denotes the maximal discharging power of ESS i; and x ess , i dis ( t ) denotes the binary decision variable for the discharging status of ESS i at t (1 represents the discharging). P ess , i cha ( t ) denotes the charging power of ESS i at time t; P ess , i cha , max denotes the maximal charging power of ESS i; and x ess , i cha ( t ) denotes the binary decision variable for the charging status of ESS i at t (1 represents the charging). E ess , i ( t ) represents the power storage of ESS i at time t; and E ess , i min and E ess , i max represent the minimal and maximal power storage of ESS i. η s cha and η s dis represent the charging and discharging efficiency of ESS i. E ess , i 0 represents the initial power of ESS i. N t and N s represent the set of times and the set of ESSs, respectively.

3.1.2. Operational Constraints of Thermal Units

P g , i min P g , i t P g , i max , t N t , i N g
R D g , i P g , i t P g , i t 1 R U g , i , t N t \ 1 , i N g
R D g , i P g , i t P g , i 0 R U g , i , t = 1 , i N g
where P g , i min and P g , i max represent the minimal and maximal power of thermal unit i; and P g , i ( t ) represents the power of thermal unit i at time t. R D g , i and R U g , i represent the ramp-down and ramp-up limits of thermal unit i. P g , i 0 represents the initial power of thermal unit i.

3.1.3. Operational Constraints of Offshore Wind Farms

This paper aggregates all wind power plants into a single offshore wind farm, and the operator can send orders to the wind farm control center directly to achieve the power reduction P w , p ( t ) P w ( t ) . The wind power P w ( t ) should satisfy:
0 P w t P w , a t
where P w , a ( t ) represents the (maximal) available wind power at time t. If there is no prediction error, P w , a ( t ) should be equal to the predicted wind power P w , p ( t ) via the indirect wind power ramp prediction model in Section 2.2.1.

3.2. System-Level Operational Constraints

The system-level operational constraints describe the power balance:
i = 1 N G P g , i t + i = 1 N S P ess , i t + P w t = P d t , t N t
P ess , i t = P ess , i dis t P ess , i cha t , t N t
where P d ( t ) is the load requirement at time t.

Objective Function of Wind Power Ramp Control

min i = 1 N G t = 1 T a g , i P g , i t 2 + b g , i P g , i t + c g , i + t = 1 T λ w t P w , a t P w t + i = 1 N S t = 1 T λ ess cha t P ess , i cha t + λ ess dis t P ess , i dis t
where N G and N S represent the number of thermal units and ESSs. a g , i , b g , i , and c g , i represent the fuel cost coefficients; λ w ( t ) represents the wind curtailment cost coefficient; and λ ess cha and λ ess dis represent the charging and discharging cost coefficients.

3.3. Stochastic Wind Power Ramp Control Model and the Deterministic Equivalent

The point-valued forecast P w , p ( t ) can carry uncertainties:
P w , p err t = P w , a t P w , p t
We use a normal distribution to formulate the uncertain prediction error P w , p err t N μ , σ 2 . In this situation, the deterministic model becomes stochastic. Specifically, Equation (24) changes to:
0 P w t P w , p t + P w , p err t
where the uncertain prediction error P w , p err means that the deterministic model can result in infeasible or suboptimal solutions. Therefore, we use a chance constraint to ensure that the probability of meeting the requirement exceeds a certain threshold [32,33,34,35], rather than trying to meet the requirement exactly. Therefore, Equation (29) can be rewritten as:
P P w t P w , p t + P w , p err t 1 ε
P w t 0
where P denotes the probability function; and ε is a small number that represents the tolerance of the operator to constraint violations.
The objective function is rewritten as:
min E i = 1 N G t = 1 T a g , i P g , i t 2 + b g , i P g , i t + c g , i + t = 1 T λ w t P w , p t + P w , p err ( t ) P w t + i = 1 N S t = 1 T λ ess cha t P ess , i cha t + λ ess dis t P ess , i dis t
In summary, the stochastic wind power ramp control model contains Objective (32) and Constraints (14)–(23), (25), (26), (30) and (31).
The chance constraint makes the model non-convex, and we need to obtain its convex equivalent to make the model solvable. As for (30), we have:
P P w , p err t P w t P w , p t 1 ε
1 F P w t P w , p t 1 ε
where F ( · ) is the cumulative distribution function. Considering the continuity of the variables, it follows that:
P w t P w , p t F 1 ε
Equation (32) is rewritten as:
min i = 1 N G t = 1 T a g , i P g , i t 2 + b g , i P g , i t + c g , i + t = 1 T λ w t P w , p t + μ P w t + i = 1 N S t = 1 T λ ess cha t P ess , i cha t + λ ess dis t P ess , i dis t
The resulting deterministic equivalent model contains Objective (36) and Constraints (14)–(23), (25), (26), (31) and (35). The equivalent model is convex and can be solved using commercial off-the-shelf solvers.

4. Case Studies

In this paper, the case studies are implemented on a laptop with a 2.50 GHz Intel Core i7-7200 CPU using Gurobi and Matlab. The wind power ramp prediction results using the integrated scheme are demonstrated in Section 4.1. The wind power ramp control results are demonstrated in Section 4.2.

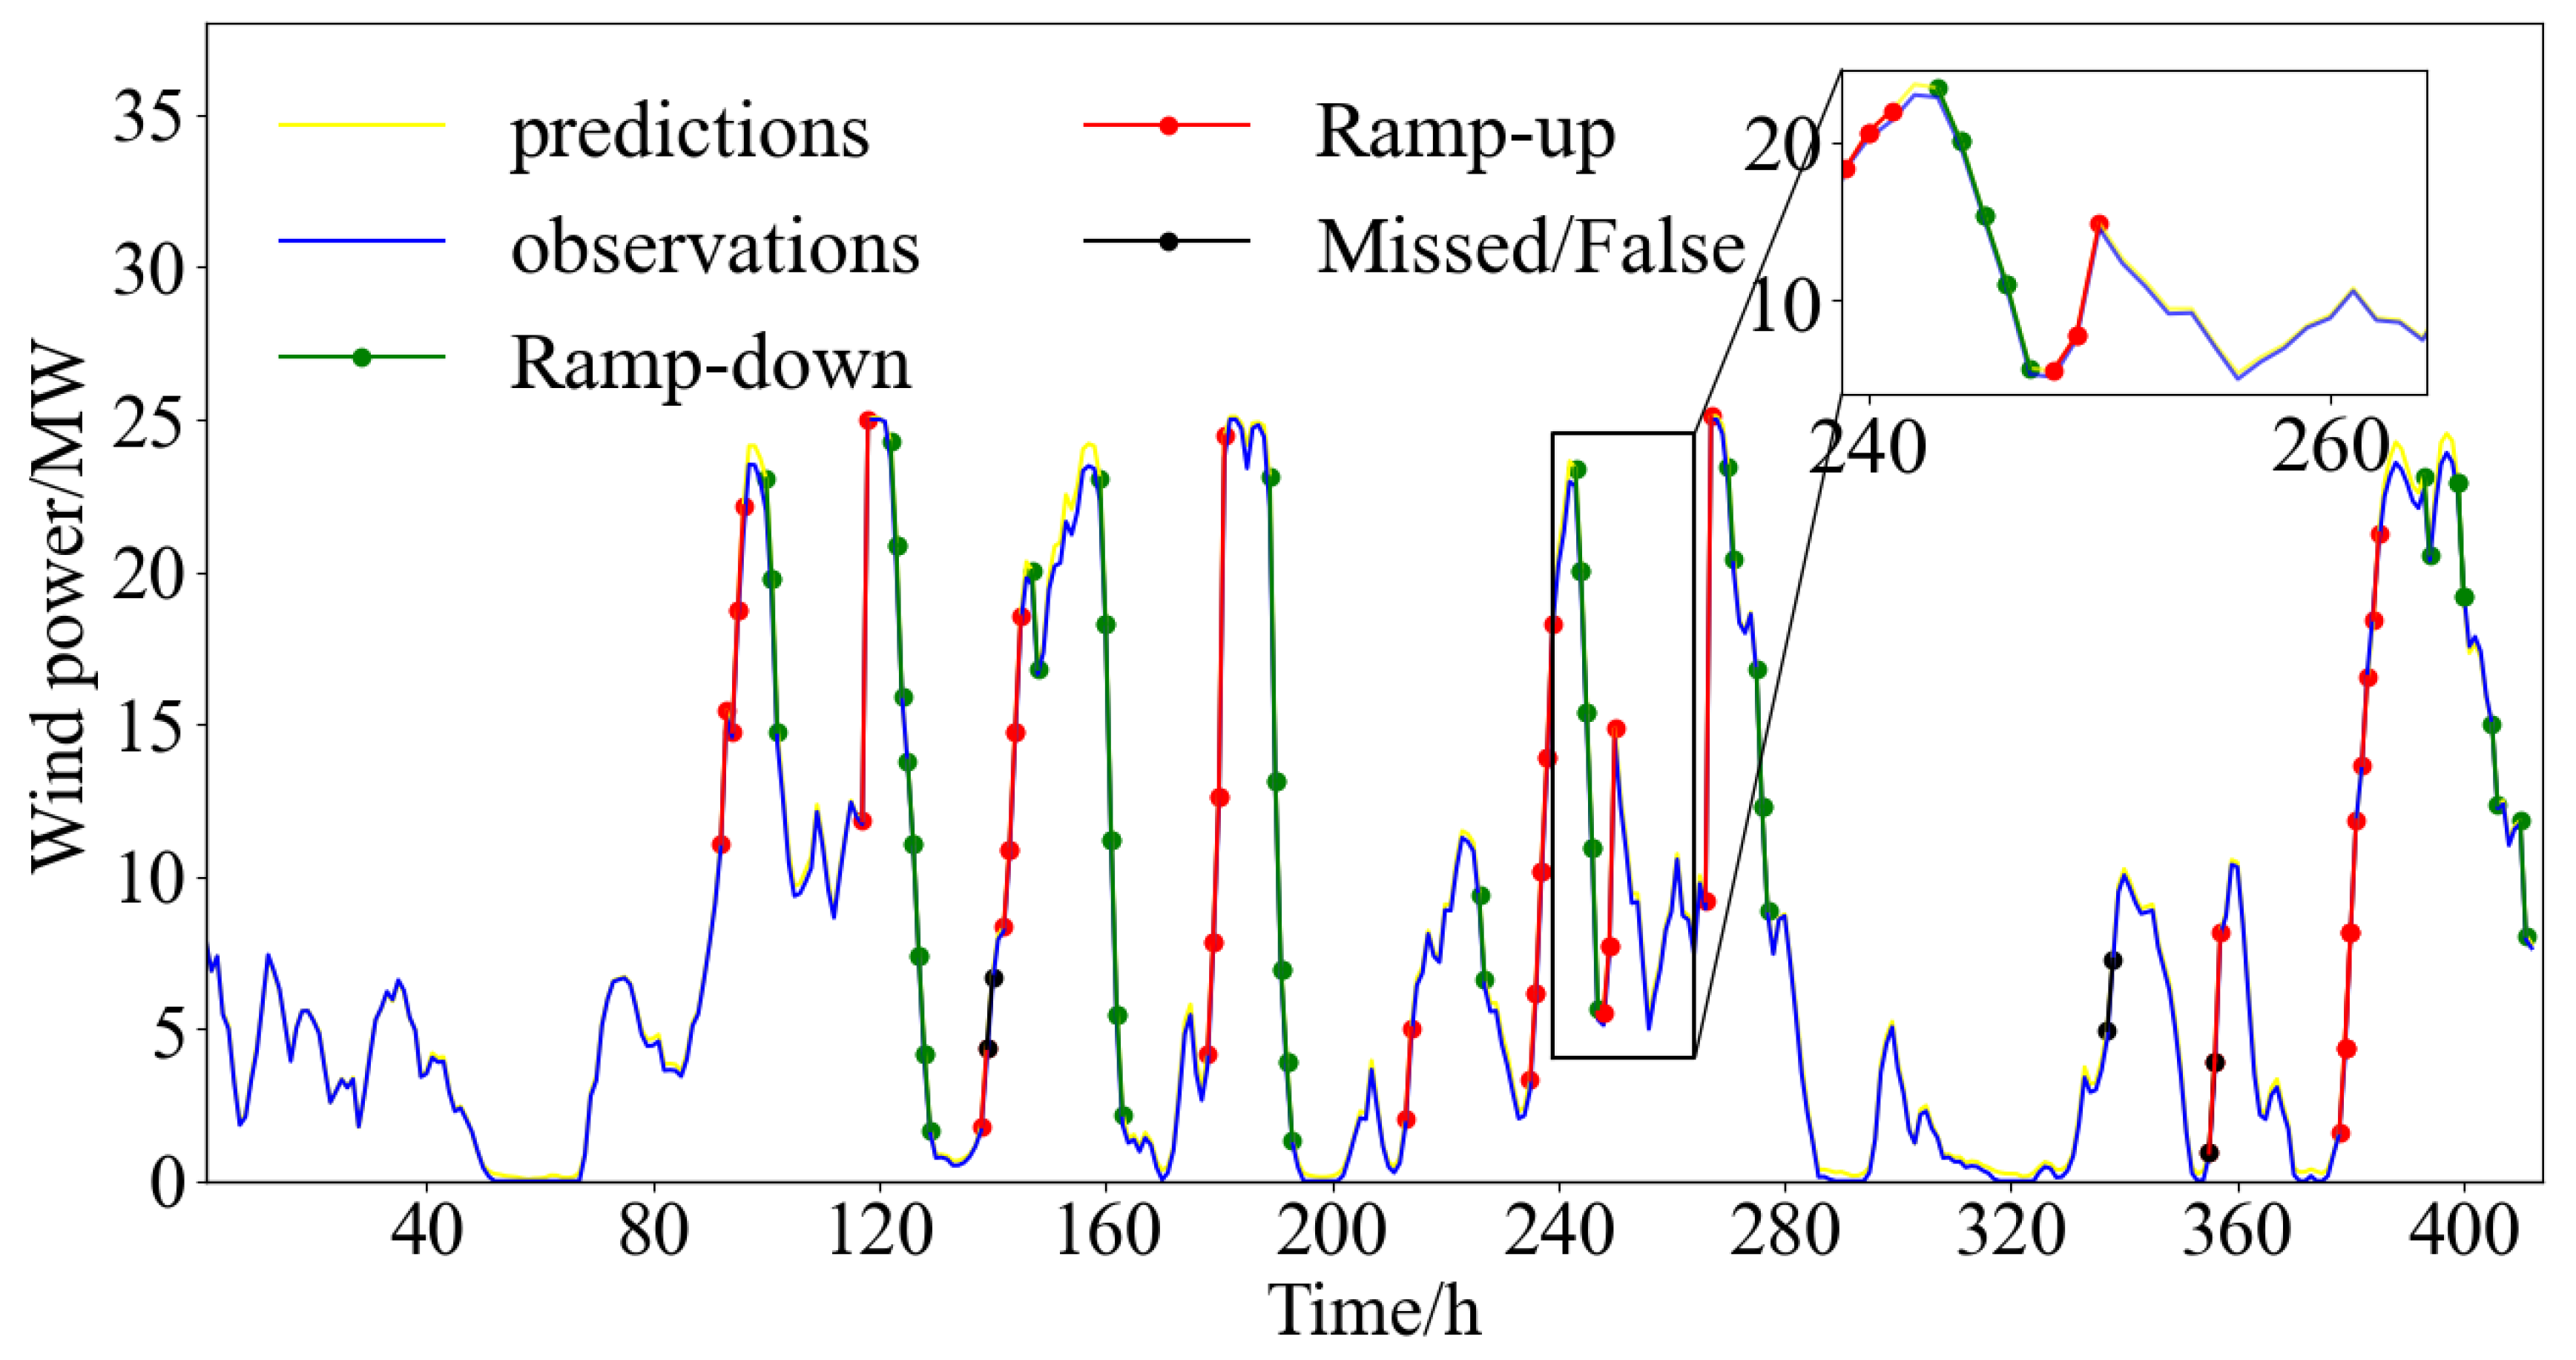
4.1. Offshore Wind Power Ramp Prediction under Extreme Weather Conditions

The case studies used data from an offshore wind farm in Jiangsu Province, with a data resolution of 1 h, spanning 1655 time points. The candidate explanatory variables contained meteorological information, including temperature, air pressure, wind direction, and wind speed. Figure 3 shows the profile of the historical wind power at 1655 time points. A total of 75% of the data was selected as the training dataset, and the remaining 25% was selected as the test dataset.
After training the prediction model, we tested the performance using the test dataset. The observed (actual) and predicted wind power curves are illustrated in Figure 4.
In order to evaluate the accuracy of the wind power prediction, we chose three commonly used metrics for evaluating the performance of predictive models, i.e., mean absolute error (MAE), mean square error (MSE), and root mean square error (RMSE):
M A E = 1 m t = 1 m P w , p t P w t
M S E = 1 m t = 1 m P w , p t P w t 2
R M S E = 1 m t = 1 m P w , p t P w t 2
where m is the number of samples; P w , p ( t ) is the predicted value; and P w ( t ) is the observed (actual) value. The evaluation results are presented in Table 1. In Figure 4 and Table 1, we can see that the prediction model achieved satisfactory prediction performance. The average prediction error approximately fell below 5 % .
Based on the wind power prediction results in Figure 4, we used the ramp events model to identify the wind power ramp event. When the wind power change exceeded 10% of the rated power, a wind power ramp event occurred. Figure 5 shows the results of the wind power ramp identification. The overall ramp prediction accuracy was 97.3%, showing that when the wind power prediction achieved high accuracy, most of the ramp events could be successfully identified.

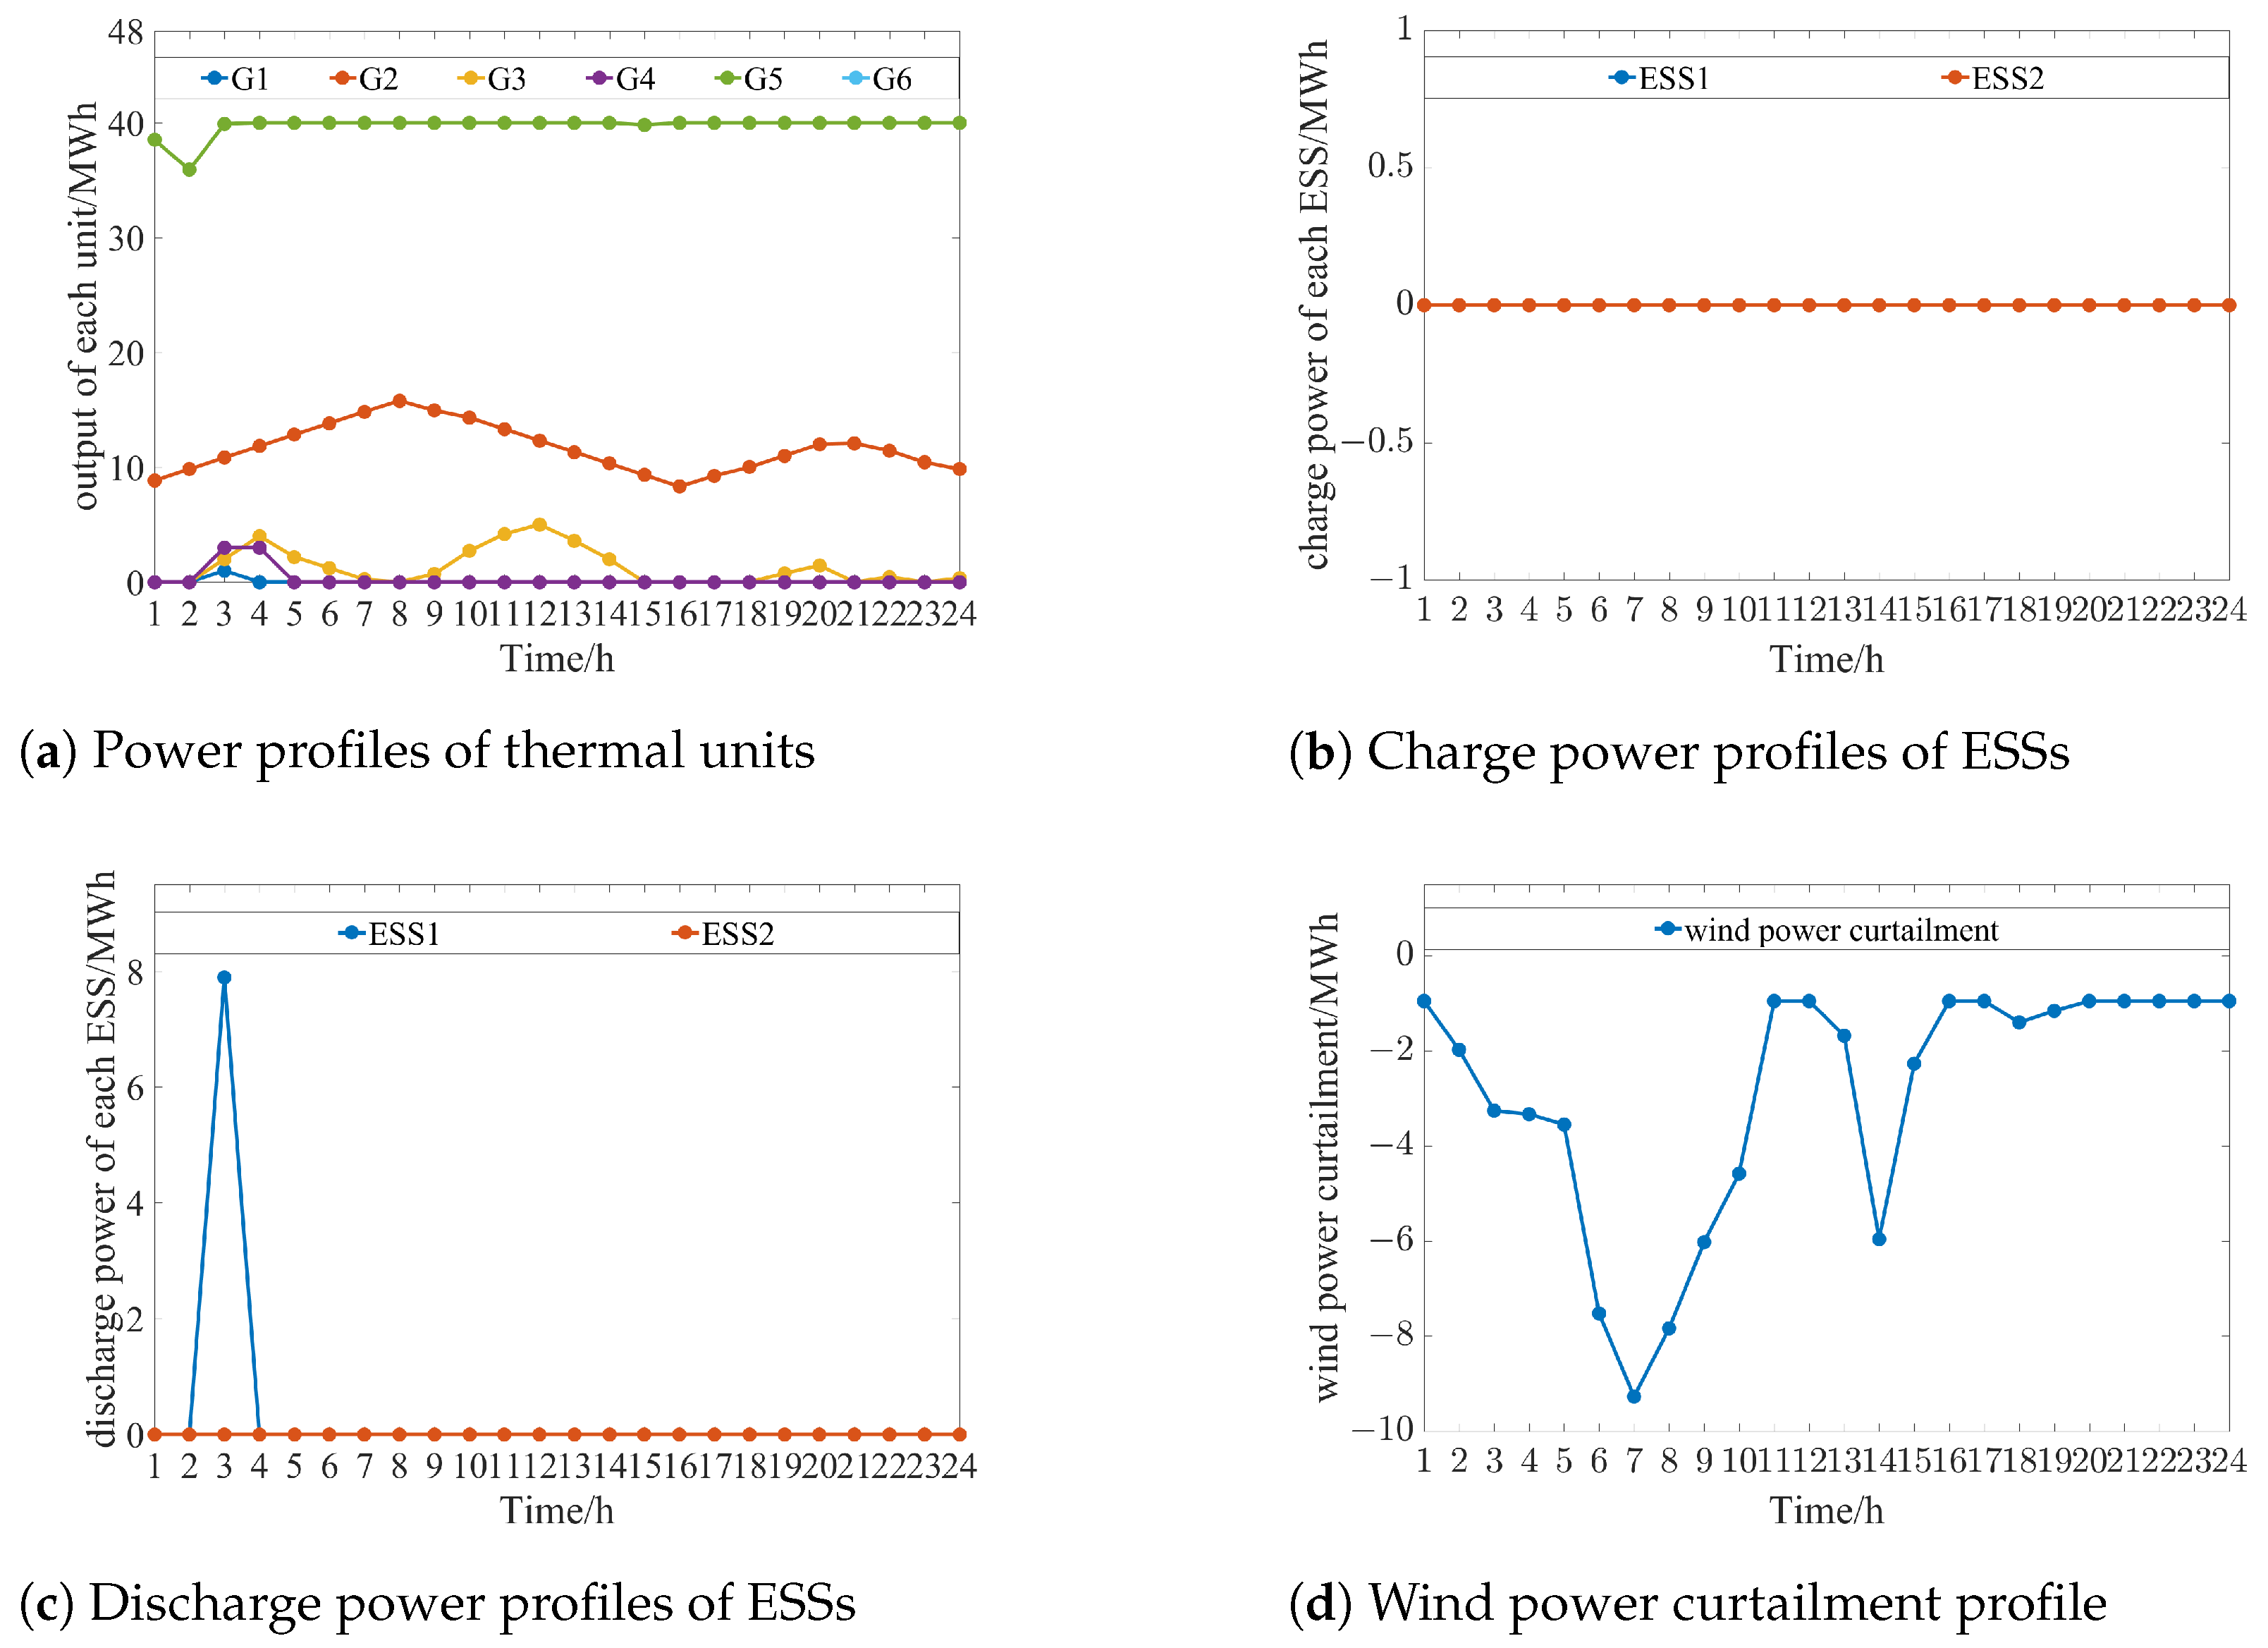
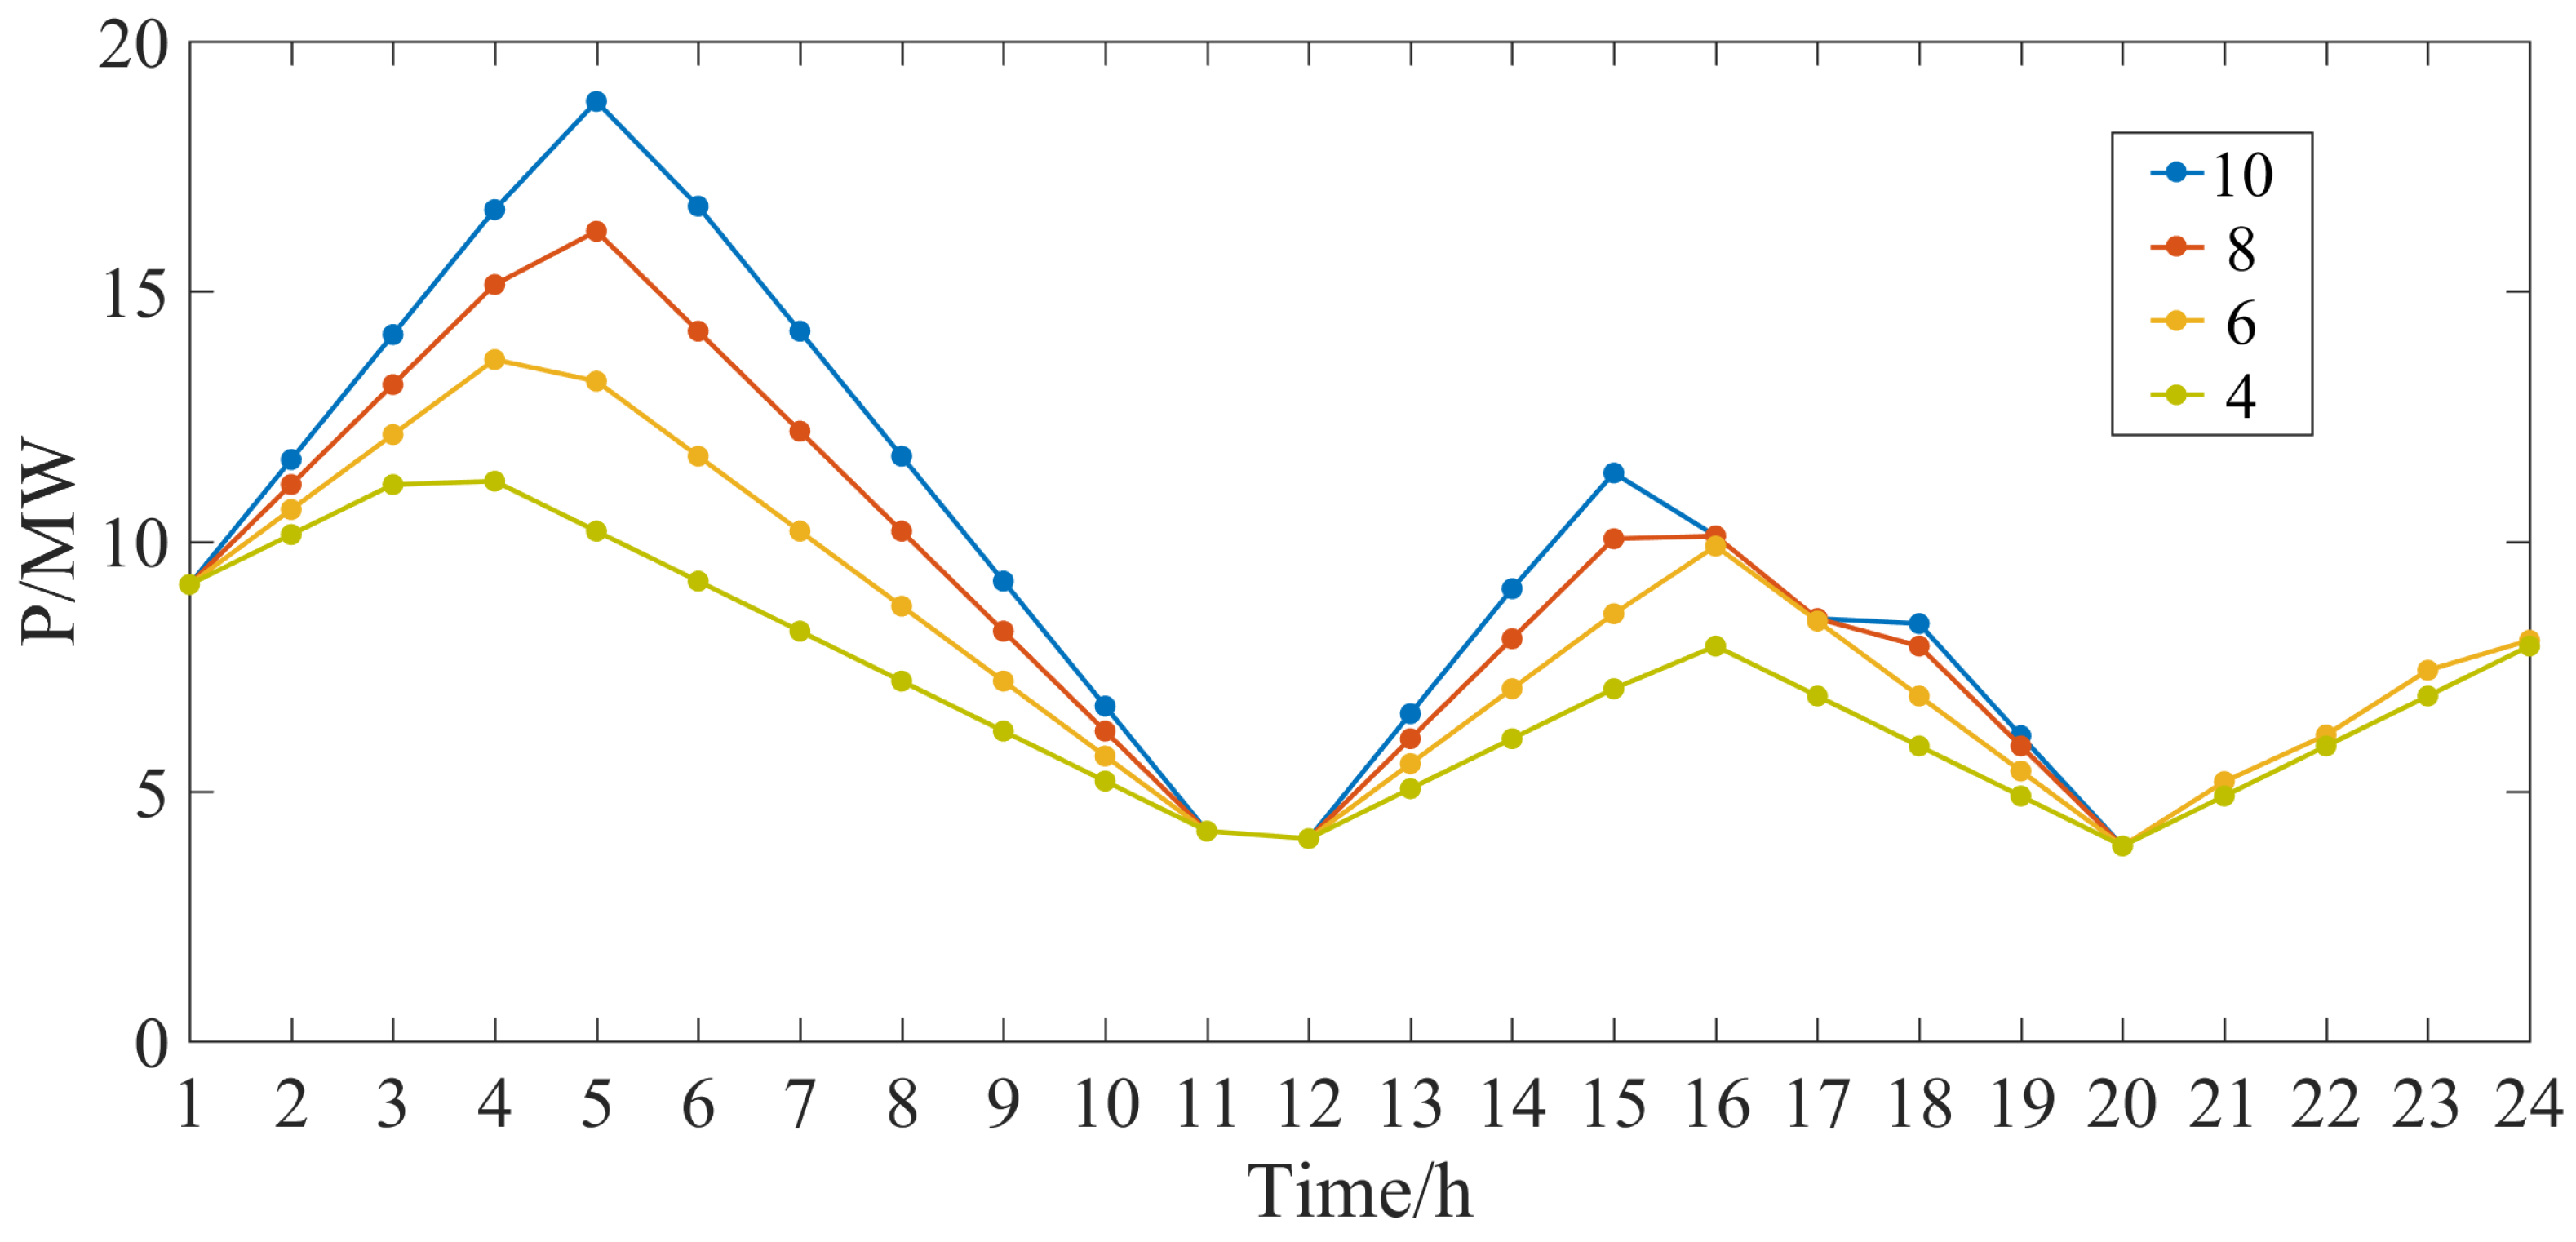
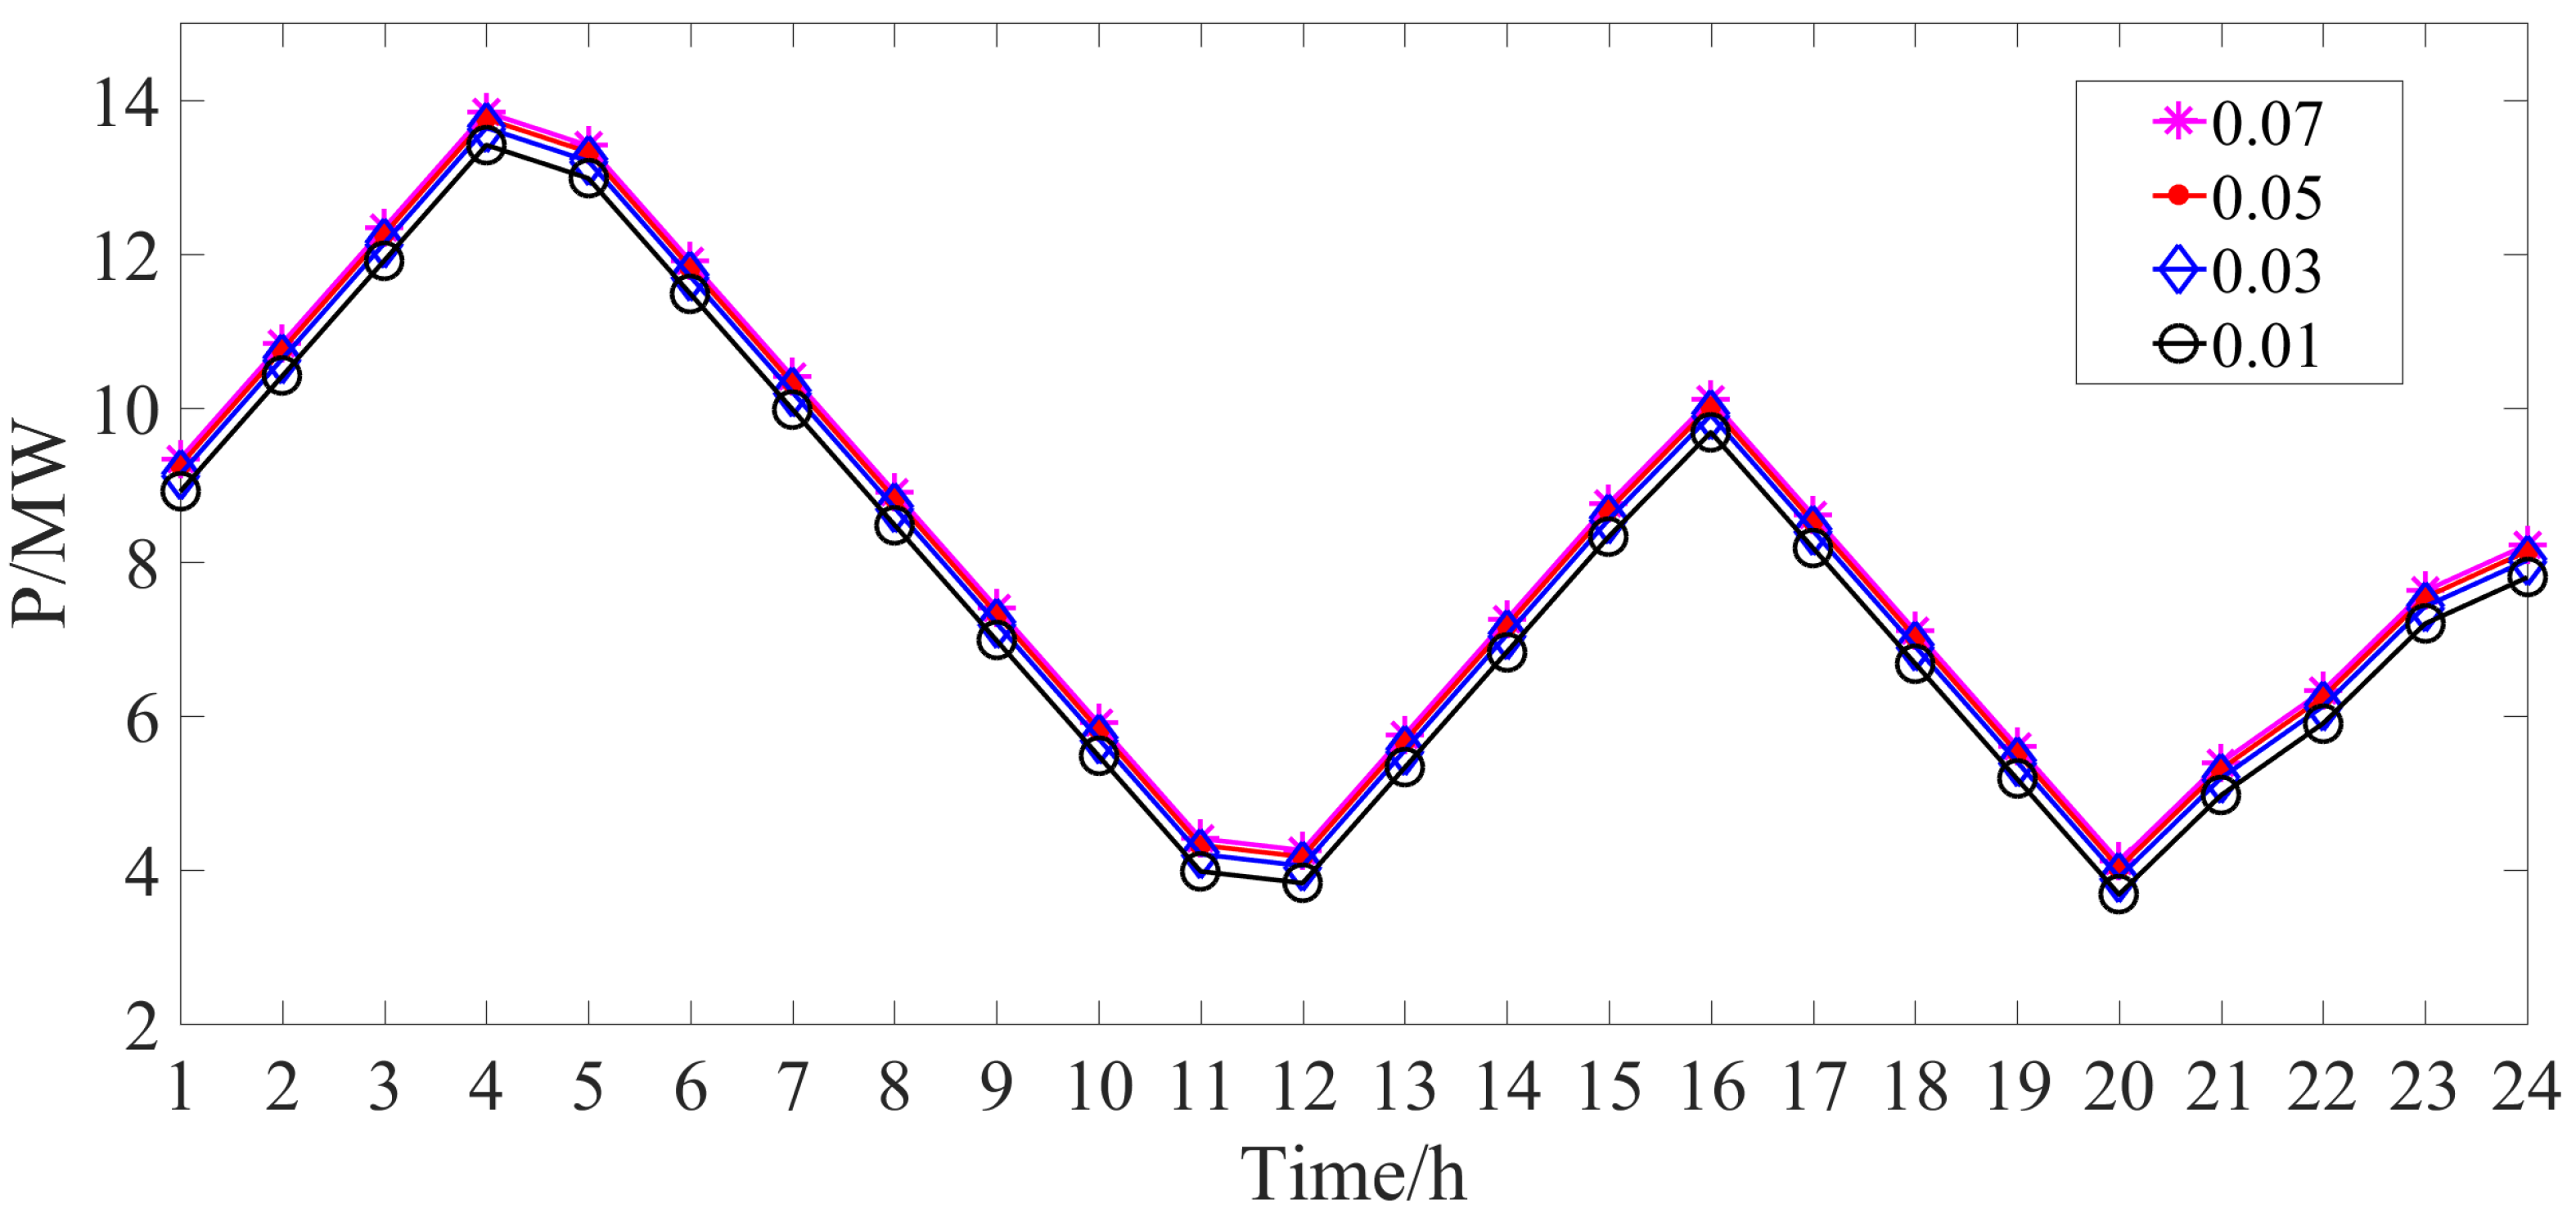
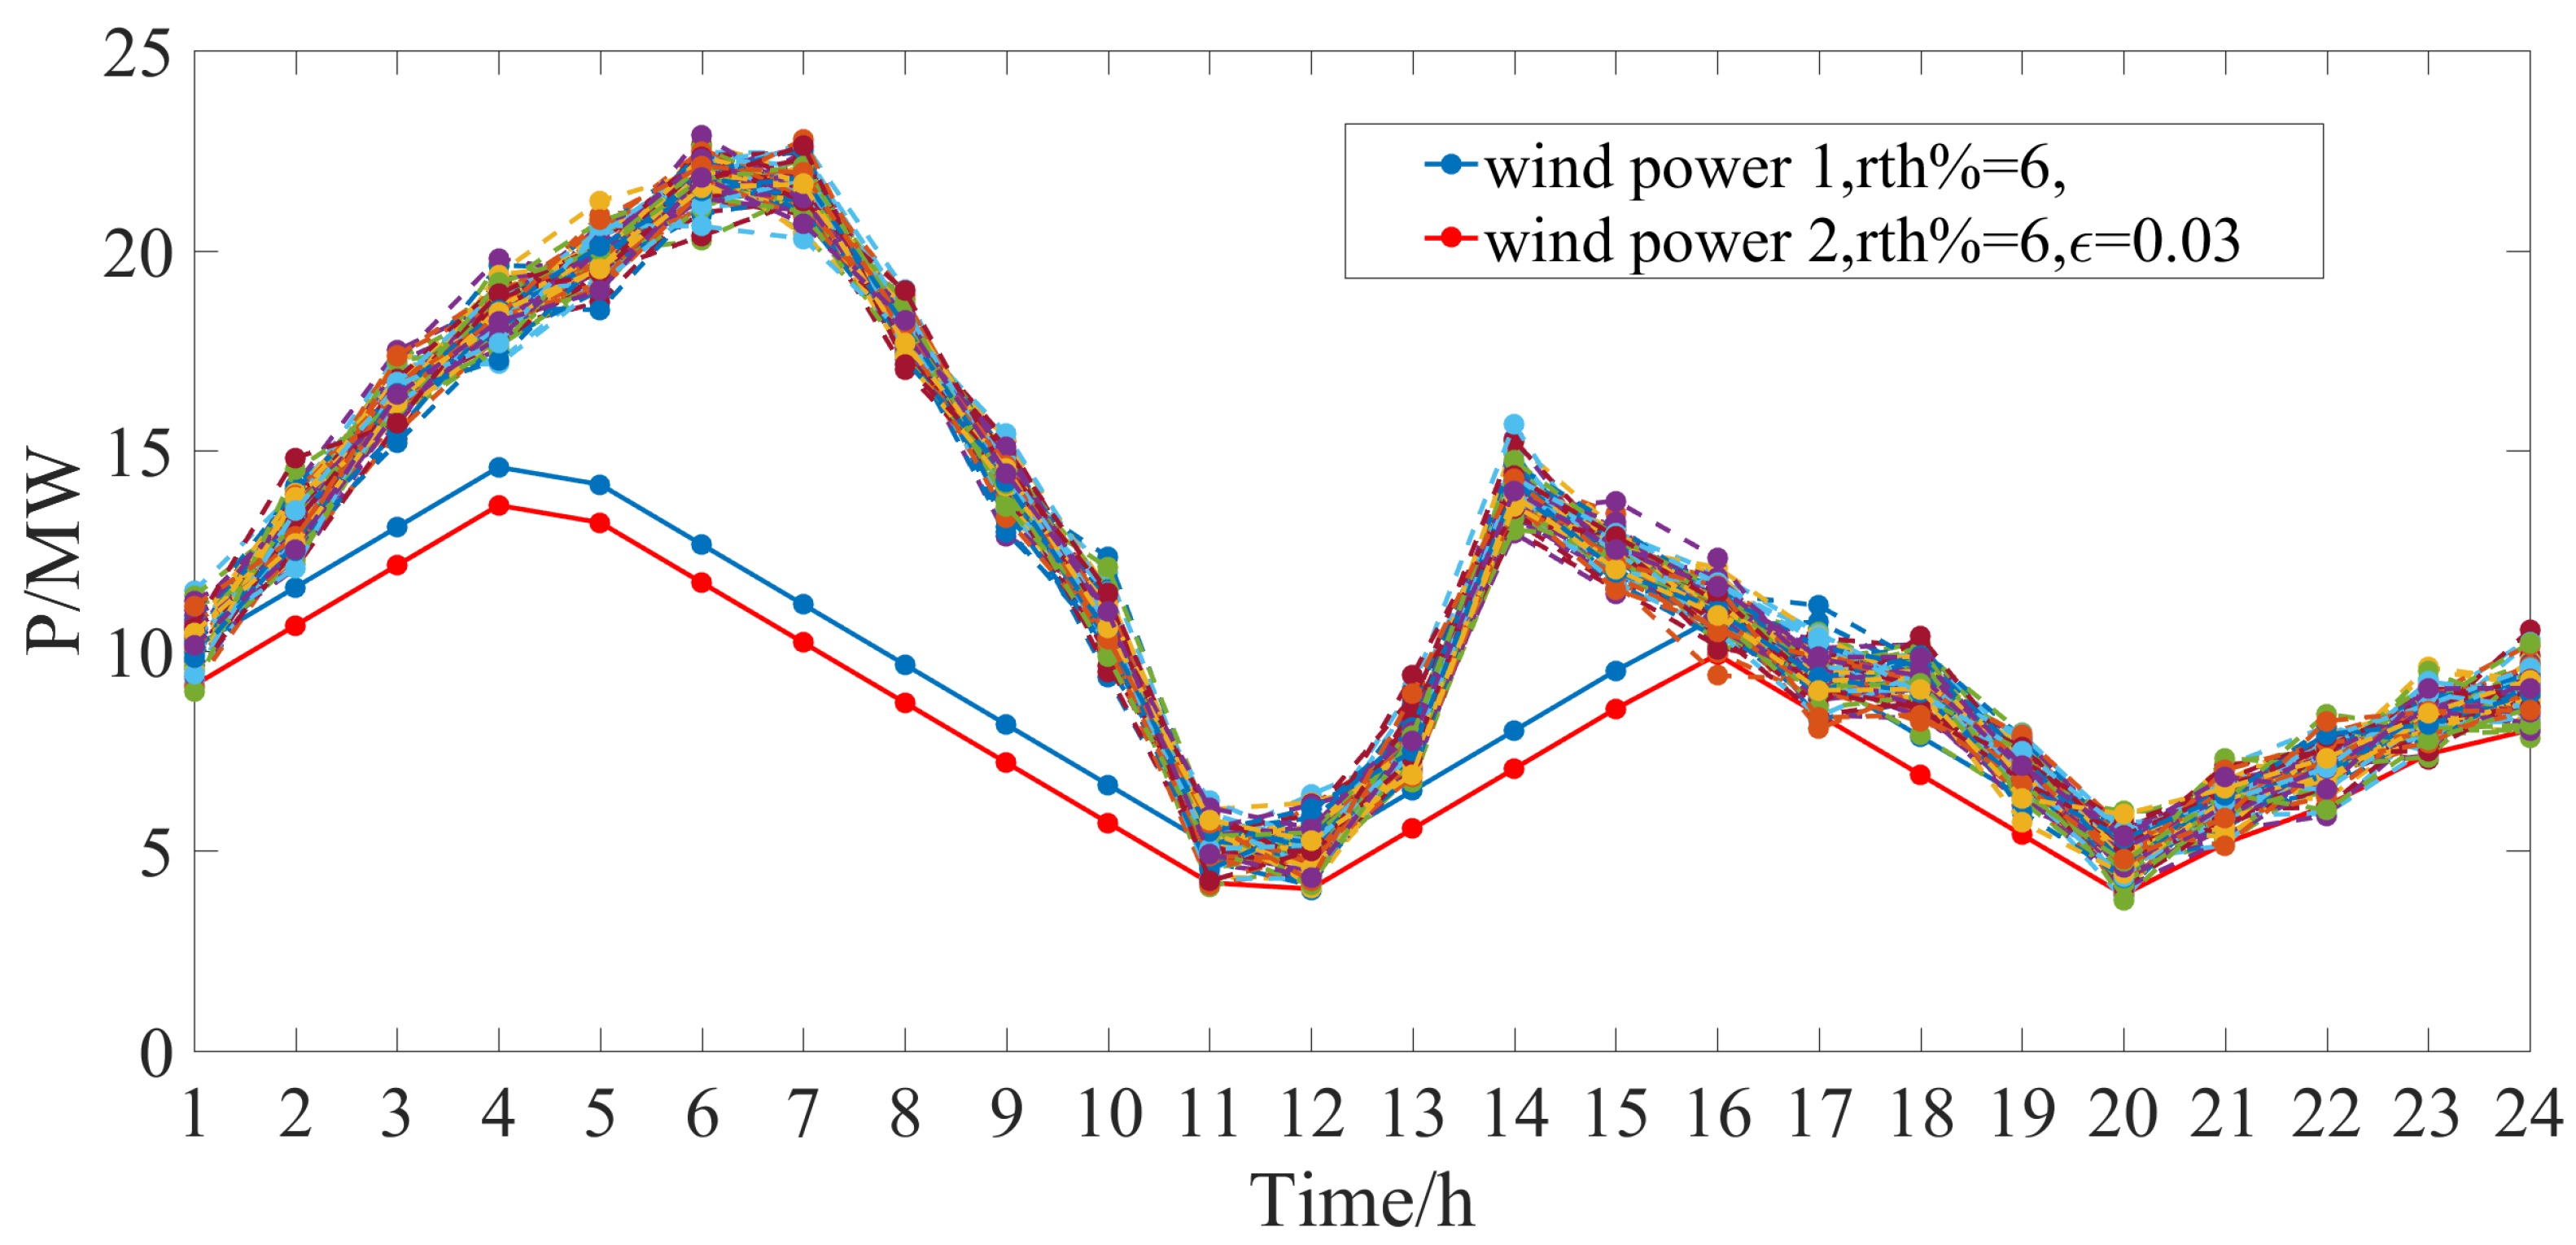
4.2. Offshore Wind Power Ramp Control under Extreme Weather Conditions

In this section, based on the wind power and ramp prediction results in Section 4.1, we verify the proposed wind power ramp control strategy on a test power system containing six thermal units, two ESSs, and the wind farm described in Section 4.1. Specifically, we used the time interval between the 239th and the 262nd sampling points in Figure 5 as the day-ahead wind power ramp control time interval (1 h, 24 h). During this (1 h, 24 h) interval, both ramp-down and ramp-up events existed; hence, offshore wind power ramp control implementation was required. The fuel cost coefficients of the thermal units [36] are shown in Table 2. We used a standard normal distribution with μ = 0.0117 and σ = 0.1 to formulate the prediction error of wind power uncertainties [37]. The charge and discharge efficiencies of energy storage were set to 0.9 [38]. The charge and discharge cost coefficients of the energy storage were set to 210 USD/MWh [39], the capacity of the ESSs was limited to 20 MW [39], and the wind curtailment cost coefficient was set to 73 USD/MWh [40].
Figure 6 presents the ramp control results for r th % = 0.06 . Specifically, Figure 6a shows that thermal units 5 and 2 generated far more power compared to the other units due to their comparatively cheaper costs per unit, which is reflected in their smaller cost coefficients. From 1 h to 3 h, the offshore wind farm experienced two consecutive ramp-up events (i.e., the first two red-line segments in the zoomed-in area in Figure 5). Meanwhile, the load demand gradually increased from 56.47 MW to 78.76 MW between 1 h and 3 h, as shown in Figure 7. In order to satisfy the threshold value r th % = 0.06 , the offshore wind farm could not help but curtail wind power. The wind power curtailment and the increase in load demand during this time period aggravated the power deficit. Due to the ramp limits of thermal units, even cheap thermal units could not immediately balance this power deficit. Therefore, as shown in Figure 6c, the most expensive ESSs needed to discharge power to support the extra load demand between 2 h and 3 h. After 3 h, the load demand decreased from a peak of 78.76 MW, and the ESSs reduced the discharge power to prevent increasing costs, even though the wind farm continued to curtail wind power to satisfy the threshold ramp value. The remaining power imbalance was handled by the cheaper thermal units (unit 5 and unit 2), which had accumulated sufficient power through the ramp-up process. In the remaining control interval (4 h–24 h), the cheapest unit (5) reached the upper generation limit and supported most of the load demand. The wind farm curtailed power based on the ramp-ups or ramp-downs from the baseline wind power profile. The remaining power imbalance was cooperatively handled by the remaining thermal units to achieve the minimal ramp control cost.
Figure 8 depicts the stabilized wind power profiles after implementing the wind power ramp control under different wind power ramp threshold values r th % . ε was set to 0.03. The corresponding wind power ramp control costs are presented in Table 3. In Figure 6, we can see that both the wind power ramp-up and ramp-down events were effectively suppressed, satisfying the corresponding threshold value r th % . Also, as the system operator imposed stricter grid connection requirements for offshore wind farms by decreasing the permissible threshold r th % , the degree of wind power ramp suppression increased. The smaller the permissible threshold r th % , the higher the degree of suppression and the smoother the controller wind power curve. Nevertheless, this enhanced suppression came at the expense of higher wind power ramp control costs. The stricter grid connection requirement (smaller r th % ) meant that the system operator should dispatch more ramp control sources (thermal units, ESSs, and wind power curtailment) to alleviate the ramp, causing more operational costs for the thermal units, ESSs, and wind power curtailment. As Table 3 shows, with the decrease in r th % , the operational cost of the thermal units increased from USD 103,866 to USD 104,811; the operational cost of the ESSs increased from USD 1552 to USD 1867; and the wind power curtailment cost increased from USD 2652 to USD 5572.
Further, we studied the influence of a confidence interval of 1 ε on the ramp control results. We focused on the cost change under different ε by fixing r th % = 6 . Figure 9 shows the stabilized wind power profile under different ε , and Table 4 presents the operational costs of the different ramp control resources. With the decrease in the confidence interval 1 ε (i.e., an increase in ε ), the stabilized wind power moved upward, as shown in Figure 9, meaning that the wind power curtailment decreased as the confidence interval decreased. The smaller the confidence interval, the looser the requirement (33), meaning that more uncertain wind power was allowable and less wind power curtailment was required. Therefore, the wind power curtailment cost decreased from USD 4661 to USD 4151, as shown in Table 4. Meanwhile, less wind power curtailment meant that less thermal unit generation was required to compensate for the curtailment-driven power imbalance. Therefore, the thermal unit cost also decreased from USD 104,516 to USD 104,347. ESSs had the most expensive per unit cost. As the wind power curtailment changed with the confidence interval, only the thermal units were dispatched to minimize the cost. Therefore, the cost of ESSs remained the same under different confidence interval values.
In order to show the advantages of the proposed ramp control strategy, we used the deterministic wind ramp control strategy without considering chance constraints. We compared the post-event wind power P w ( t ) after implementing either the deterministic or the proposed wind power ramp control strategy. Based on (28), it can be inferred that the original wind power P w , a ( t ) was uncertain. Theoretically, the post-event wind power P w ( t ) should be lower than the original wind power P w , a ( t ) . Nevertheless, under the deterministic strategy, the uncertainty of P w , a ( t ) was not considered (i.e., the stochastic prediction error P w , p err was disregarded). Consequently, the post-event wind power P w ( t ) was more likely to exceed the original wind power P w , a ( t ) with a higher probability. In contrast, the proposed method, which considers chance constraints, generated a more conservative post-event wind power; hence, the post-event wind power P w ( t ) was more likely to exceed the original wind power P w , a ( t ) with a lower probability. Figure 10 depicts the post-event wind power profiles and the cluster of the original wind power curves. Since the original wind power contained uncertainties, we used Monte Carlo sampling methods to generate a cluster of wind power curves. Figure 10 shows that the post-event wind power (wind power 1) after implementing deterministic ramp control was greater than the post-event wind power (wind power 2) after implementing the proposed ramp control, showing the conservatism and security of the proposed ramp control strategy. Due to the wind power curtailment under the ramp control strategy, the post-event wind power curves under both the deterministic and the proposed ramp control strategies were much lower than the original wind power (the cluster), and there was no violation. However, when the wind power curtailment was removed (e.g., 16 h–24 h), both post-event wind power curves intersected with the original wind power curves, and the violation occurred.
To quantitatively describe the degree of the violation, we calculated the average accumulative positive power differences P ε , considering all the original power curves in the cluster:
P ε = 1 N s t j F P w t P w , a j t
where j denotes the index of original wind power curves in the cluster; and N s is the total number of original power curves in the cluster. The piecewise function F is expressed as:
F x = x , x > 0 0 , x 0
Since the non-positive difference P w t P w , a j t does not generate a violation, we let F ( x ) = 0 if x 0 . We present the results of P ε under different r th % in Table 5.
Table 5 further quantitatively verifies that the average accumulative positive power difference under the proposed ramp control strategy was much lower than that under the deterministic ramp control strategy. In addition, with the decrease in r th % , the wind power curtailment increased, and the likelihood of P w t violating P a t decreased. Hence, the average accumulative positive power difference decreased with the decrease in r th % .

5. Conclusions

This paper presents a novel integrated strategy for forecasting and controlling wind power ramps in an offshore wind farm during extreme weather events. With the aid of real-world offshore wind farm data and data on ramp control resources, the main conclusions can be summarized as follows: First, the MGMM-based wind power ramp prediction can effectively identify future wind power ramp phenomena using the real-world wind power profile, with a prediction accuracy of up to 97.3%. Second, the proposed offshore wind farm ramp control strategy can effectively stabilize the real-world wind power profile to meet the threshold requirement for grid connection of the offshore wind farm. Third, a less stringent requirement of grid connection (smaller r th % ) leads to reduced wind power ramp control effort and lower control costs. The most expensive ESSs are not dispatched until the cheap thermal units are unable to compensate for the power imbalance between the load demand and wind power (after curtailment). Fourth, a lower confidence level results in reduced wind power curtailment and lower costs.

Author Contributions

Conceptualization, Y.J. and B.R.; methodology, Y.J. and B.R.; software, Q.L.; validation, C.W. and D.W.; formal analysis, X.Z.; investigation, C.W. All authors have read and agreed to the published version of the manuscript.

Funding

This research was funded by the Science and Technology Project of the State Grid Jiangsu Electric Power Company under grant J2023070 “Prediction and Mitigation Techniques for Offshore Wind Power Ramp Events under Extreme Weather Condition”.

Data Availability Statement

Data can be accessed from case studies.

Conflicts of Interest

The authors declare no conflict of interest.

References

  1. Cui, M.; Zhang, J.; Feng, C.; Florita, A.R.; Sun, Y.; Hodge, B.M. Characterizing and analyzing ramping events in wind power, solar power, load, and netload. Renew. Energy 2017, 111, 227–244. [Google Scholar] [CrossRef]
  2. Ohba, M. The impact of global warming on wind energy resources and ramp events in Japan. Atmosphere 2019, 10, 265. [Google Scholar] [CrossRef]
  3. Probst, O.; Minchala, L.I. Mitigation of short-term wind power ramps through forecast-based curtailment. Appl. Sci. 2021, 11, 4371. [Google Scholar] [CrossRef]
  4. Logothetis, S.A.; Salamalikis, V.; Nouri, B.; Remund, J.; Zarzalejo, L.F.; Xie, Y.; Wilbert, S.; Ntavelis, E.; Nou, J.; Hendrikx, N.; et al. Solar Irradiance Ramp Forecasting Based on All-Sky Imagers. Energies 2022, 15, 6191. [Google Scholar] [CrossRef]
  5. Abuella, M.; Chowdhury, B. Forecasting of solar power ramp events: A post-processing approach. Renew. Energy 2019, 133, 1380–1392. [Google Scholar] [CrossRef]
  6. Zhu, W.; Zhang, L.; Yang, M.; Wang, B. Solar power ramp event forewarning with limited historical observations. IEEE Trans. Ind. Appl. 2019, 55, 5621–5630. [Google Scholar] [CrossRef]
  7. Alkesaiberi, A.; Harrou, F.; Sun, Y. Efficient wind power prediction using machine learning methods: A comparative study. Energies 2022, 15, 2327. [Google Scholar] [CrossRef]
  8. Yuan, D.D.; Li, M.; Li, H.Y.; Lin, C.J.; Ji, B.X. Wind power prediction method: Support vector regression optimized by improved jellyfish search algorithm. Energies 2022, 15, 6404. [Google Scholar] [CrossRef]
  9. Wang, L.; He, Y.; Li, L.; Liu, X.; Zhao, Y. A novel approach to ultra-short-term multi-step wind power predictions based on encoder–decoder architecture in natural language processing. J. Clean. Prod. 2022, 354, 131723. [Google Scholar] [CrossRef]
  10. Quan, H.; Zhang, W.; Zhang, W.; Li, Z.; Zhou, T. An Interval Prediction Approach of Wind Power Based on Skip-GRU and Block-Bootstrap Techniques. IEEE Trans. Ind. Appl. 2023, 59, 4710–4719. [Google Scholar] [CrossRef]
  11. Ye, L.; Dai, B.; Li, Z.; Pei, M.; Zhao, Y.; Lu, P. An ensemble method for short-term wind power prediction considering error correction strategy. Appl. Energy 2022, 322, 119475. [Google Scholar] [CrossRef]
  12. Zhu, N.; Dai, Z.; Wang, Y.; Zhang, K. A contrastive learning-based framework for wind power forecast. Expert Syst. Appl. 2023, 230, 120619. [Google Scholar] [CrossRef]
  13. Li, Y.; Wang, R.; Li, Y.; Zhang, M.; Long, C. Wind power forecasting considering data privacy protection: A federated deep reinforcement learning approach. Appl. Energy 2023, 329, 120291. [Google Scholar] [CrossRef]
  14. Zucatelli, P.; Nascimento, E.; Santos, A.; Arce, A.; Moreira, D. An investigation on deep learning and wavelet transform to nowcast wind power and wind power ramp: A case study in Brazil and Uruguay. Energy 2021, 230, 120842. [Google Scholar] [CrossRef]
  15. Ouyang, T.; Zha, X.; Qin, L.; He, Y.; Tang, Z. Prediction of wind power ramp events based on residual correction. Renew. Energy 2019, 136, 781–792. [Google Scholar] [CrossRef]
  16. Cui, Y.; He, Y.; Xiong, X.; Chen, Z.; Li, F.; Xu, T.; Zhang, F. Algorithm for identifying wind power ramp events via novel improved dynamic swinging door. Renew. Energy 2021, 171, 542–556. [Google Scholar] [CrossRef]
  17. Liu, W.; Li, C.; Liu, Y.; Wu, Q. Predictive control of wind turbine for load reduction during ramping events. Int. J. Electr. Power Energy Syst. 2017, 93, 135–145. [Google Scholar] [CrossRef]
  18. Liu, W.; Gong, Y.; Geng, G.; Jiang, Q. Refined ramp event characterisation for wind power ramp control using energy storage system. IET Renew. Power Gener. 2019, 13, 1731–1740. [Google Scholar] [CrossRef]
  19. Ma, L.; Xie, L.; Ye, L.; Ye, J.; Ma, W. A wind power smoothing strategy based on two-layer model algorithm control. J. Energy Storage 2023, 60, 106617. [Google Scholar] [CrossRef]
  20. Abou Daher, N.; Raoofat, M.; Saad, M.; Mougharbel, I.; Asber, D.; Beltran-Galindo, J. Improve the HVAC contribution in wind power smoothing. Electr. Power Syst. Res. 2019, 171, 219–229. [Google Scholar] [CrossRef]
  21. Kumar, D.S.; Maharjan, S.; Srinivasan, D. Ramp-rate limiting strategies to alleviate the impact of PV power ramping on voltage fluctuations using energy storage systems. Sol. Energy 2022, 234, 377–386. [Google Scholar] [CrossRef]
  22. Qi, Y.; Liu, Y. Wind power ramping control using competitive game. IEEE Trans. Sustain. Energy 2016, 7, 1516–1524. [Google Scholar] [CrossRef]
  23. Cui, M.; Zhang, J. Estimating ramping requirements with solar-friendly flexible ramping product in multi-timescale power system operations. Appl. Energy 2018, 225, 27–41. [Google Scholar] [CrossRef]
  24. Sreekumar, S.; Sharma, K.C.; Bhakar, R. Multi-interval solar ramp product to enhance power system flexibility. IEEE Syst. J. 2020, 15, 170–179. [Google Scholar] [CrossRef]
  25. Li, B.; Feng, C.; Siebenschuh, C.; Zhang, R.; Spyrou, E.; Krishnan, V.; Hobbs, B.F.; Zhang, J. Sizing ramping reserve using probabilistic solar forecasts: A data-driven method. Appl. Energy 2022, 313, 118812. [Google Scholar] [CrossRef]
  26. Das, K.; Guo, F.; Nuño, E.; Cutululis, N.A. Frequency stability of power system with large share of wind power under storm conditions. J. Mod. Power Syst. Clean Energy 2020, 8, 219–228. [Google Scholar] [CrossRef]
  27. National Hurricane Center. Tropical Cyclone Climatology. 2019. Available online: https://www.nhc.noaa.gov/climo/?text (accessed on 8 June 2023).
  28. Yang, M.; Shi, C.; Liu, H. Day-ahead wind power forecasting based on the clustering of equivalent power curves. Energy 2021, 218, 119515. [Google Scholar] [CrossRef]
  29. Wang, Y.; Zou, R.; Liu, F.; Zhang, L.; Liu, Q. A review of wind speed and wind power forecasting with deep neural networks. Appl. Energy 2021, 304, 117766. [Google Scholar] [CrossRef]
  30. Kamath, C. Associating weather conditions with ramp events in wind power generation. In Proceedings of the 2011 IEEE/PES Power Systems Conference and Exposition, Phoenix, AZ, USA, 20–23 March 2011; pp. 1–8. [Google Scholar]
  31. Zhang, D.; Dai, Y.; Zhang, X.; Zhang, J.; Wang, Z.; Xue, L. Review and prospect of research on wind power ramp events. Power Syst. Technol. 2018, 42, 1783–1792. [Google Scholar]
  32. Li, Z.; Xu, Y.; Wu, L.; Zheng, X. A risk-averse adaptively stochastic optimization method for multi-energy ship operation under diverse uncertainties. IEEE Trans. Power Syst. 2020, 36, 2149–2161. [Google Scholar] [CrossRef]
  33. Li, Z.; Xu, Y.; Wang, P.; Xiao, G. Coordinated preparation and recovery of a post-disaster multi-energy distribution system considering thermal inertia and diverse uncertainties. Appl. Energy 2023, 336, 120736. [Google Scholar] [CrossRef]
  34. Li, Z.; Wu, L.; Xu, Y.; Wang, L.; Yang, N. Distributed tri-layer risk-averse stochastic game approach for energy trading among multi-energy microgrids. Appl. Energy 2023, 331, 120282. [Google Scholar] [CrossRef]
  35. Xiao, M.; Smaisim, G.F. Joint chance-constrained multi-objective optimal function of multi-energy microgrid containing energy storages and carbon recycling system. J. Energy Storage 2022, 55, 105842. [Google Scholar] [CrossRef]
  36. Yang, L.; Luo, J.; Xu, Y.; Zhang, Z.; Dong, Z. A Distributed Dual Consensus ADMM Based on Partition for DC-DOPF With Carbon Emission Trading. IEEE Trans. Ind. Inform. 2020, 16, 1858–1872. [Google Scholar] [CrossRef]
  37. Hodge, B.M.; Milligan, M. Wind power forecasting error distributions over multiple timescales. In Proceedings of the 2011 IEEE Power and Energy Society General Meeting, Detroit, MI, USA, 24–28 July 2011; pp. 1–8. [Google Scholar]
  38. Ju, C.; Wang, P.; Goel, L.; Xu, Y. A Two-Layer Energy Management System for Microgrids With Hybrid Energy Storage Considering Degradation Costs. IEEE Trans. Smart Grid 2018, 9, 6047–6057. [Google Scholar] [CrossRef]
  39. Dui, X.; Zhu, G.; Yao, L. Two-Stage Optimization of Battery Energy Storage Capacity to Decrease Wind Power Curtailment in Grid-Connected Wind Farms. IEEE Trans. Power Syst. 2018, 33, 3296–3305. [Google Scholar] [CrossRef]
  40. Bird, L.; Cochran, J.; Wang, X. Wind and Solar Energy Curtailment: Experience and Practices in the United States. Available online: https://www.osti.gov/biblio/1126842 (accessed on 8 June 2023).
Figure 1. Examples of wind power ramps based on wind power curves.
Electronics 12 04443 g001
Figure 2. General framework of integrated wind power ramp forecasting and control during extreme storms.
Electronics 12 04443 g002
Figure 3. Offshore wind power profile.
Electronics 12 04443 g003
Figure 4. Offshore wind power forecast results.
Electronics 12 04443 g004
Figure 5. Offshore wind power ramp prediction results.
Electronics 12 04443 g005
Figure 6. Wind power ramp control results r th % = 0.06 .
Electronics 12 04443 g006
Figure 7. Load demand profile.
Electronics 12 04443 g007
Figure 8. The stabilized wind power under different r th % .
Electronics 12 04443 g008
Figure 9. The stabilized wind power values under different ε .
Electronics 12 04443 g009
Figure 10. Post-event wind power profiles and the cluster of original wind power curves.
Electronics 12 04443 g010
Table 1. Offshore wind power prediction performance index.
IndexMAEMSERMSE
Value0.0520.0050.073
Table 2. Cost coefficients of thermal units.
No. a g b g c g
10.0071222.26370
20.0039819.7450
30.0021116.5560
40.00216.6625
50.0003117.26670
60.0004816.19800
Table 3. Wind power ramp control costs under different r th % .
r th % Thermal Unit Cost (USD)ESS Cost (USD)Curtailment Cost (USD)Total Cost (USD)
10103,8661552265210,870
8104,13216573481109,270
6104,42817624394110,584
4104,81118675572112,250
Table 4. Wind power ramp control costs under different ε .
ε Thermal Unit Cost (USD)ESS Cost (USD)Curtailment Cost (USD)Total Cost (USD)
0.01104,51617624661110,939
0.03104,42817624394110,584
0.05104,38117624252110,395
0.07104,34717624151110,260
Table 5. Average accumulative positive power differences P ε under different r th % .
r th % P ε under the Deterministic Ramp Control Strategy P ε under the Proposed Ramp Control Strategy
10 % 2.2070.049
8 % 1.9490.039
6 % 1.6510.029
4 % 0.9470.005
Disclaimer/Publisher’s Note: The statements, opinions and data contained in all publications are solely those of the individual author(s) and contributor(s) and not of MDPI and/or the editor(s). MDPI and/or the editor(s) disclaim responsibility for any injury to people or property resulting from any ideas, methods, instructions or products referred to in the content.

