
Multi-Wavelength Path Loss Model for Indoor VLC with Mobile Human Blockage

1
State Key Laboratory of Information Photonics and Optical Communications, Beijing University of Posts and Telecommunications, Beijing 100876, China
2
State Key Laboratory of Networking and Switching Technology, Beijing University of Posts and Telecommunications, Beijing 100876, China
3
China Mobile Research Institute, Beijing 100053, China
*
Author to whom correspondence should be addressed.
Electronics 2023, 12(24), 5036; https://doi.org/10.3390/electronics12245036
Submission received: 7 October 2023
/
Revised: 29 November 2023
/
Accepted: 2 December 2023
/
Published: 18 December 2023
(This article belongs to the Special Issue Channel Measurement, Modeling and Simulation of 6G)
Abstract
:Visible light communication (VLC) is one of the candidate technologies for the sixth generation (6G) networks. The path loss model is particularly important for link budget estimation and network planning in VLC. Due to the wideband nature and the extremely poor diffraction capacity of light, the path loss of the VLC channel is susceptible to wavelength dependence and blockage effect. In this paper, we propose a novel path loss model which can characterize the impact of wavelength dependence combined with mobile human blockage for both the single-LED (light emitting diode) and the multi-LED scenario. When there is no blockage in the channel, the multi-wavelength path loss under free space propagation is modeled with a small standard deviation of 0.262 in the single-LED scenario and a small root mean square error of 0.009 in the multi-LED scenario which indicates the high accuracy of the model. When considering the mobile human blockage, the blockage probability (BP) is modeled with full consideration of realistic human mobility and human body shadowing. The results indicate that the BP in single-LED scenario can reach 0.08, while the BP in multi-LED scenario is 0.022. This demonstrates that the distributed deployment of transmitters can effectively reduce the occurrence of the blockage state in VLC.
1. Introduction
With the commercialization of the fifth-generation (5G) networks, the exploration of the sixth-generation (6G) mobile communication system has been carried out [1,2]. Given that the dearth of spectrum in the conventional radio frequency (RF) bands coupled with increasing wireless traffic, industry and academia are inclined to consider employing visible light communication (VLC) as one of the candidate technologies for the next generation of wireless access networks. VLC is a high-speed communication technology that uses an unauthorized spectrum ranging from 400 to 800 THz, which can provide a huge communication capacity. Moreover, VLC can use the light emitting diode (LED) to realize lighting and communication functions simultaneously [3], which can be used to fulfill the high capacity demand in indoor scenarios where the maximum data usage occurs [4]. At the same time, the dual-use of LED makes the VLC close to the “zero energy consumption” communication of light source which can help to achieve the goals of “carbon peaking” and “carbon neutralization”. Therefore, VLC can be used as a supplement to the existing RF system and can become one of the key technologies supporting 6G.
In the designing and optimizing of VLC systems, since channel properties determine the performance limit of wireless communication systems, VLC channel modeling is regarded as a foundational step. Also, the visible light channel model can be used to evaluate the performance of VLC technologies [5]. Notably, in the VLC channel, because the wavelength of visible light signals is extremely short, and the size of the receiver is usually millions of square wavelengths, the small-scale fading of signals over several wavelengths will not occur [6]. And, it is the path loss that dominates VLC performance that has critical importance in accurately estimating the link budget and the capacity of the VLC channel [7,8]. Therefore, an accurate path loss model plays a decisive role in VLC system design, performance evaluation, and testing.
Due to the propagation nature of light, the path loss of the VLC channel is susceptible to wavelength dependence and blockage effect [9,10]. Firstly, the path loss shows a dependence on the visible light signal wavelength due to the inherently wideband (380–780 nm) of the light source in VLC. The variation of signal wavelength will lead to a significant change in the reflection coefficient of the reflecting material, thus changing the propagation characteristics of the VLC channel. According to Friis free space path loss formula, the higher the signal frequency, that is, the lower wavelength, the greater the path loss is. And, it has been verified by measurements that there is an increase of 2.26 dB between the path loss under 405 nm and that under 625 nm at the transceiver distance of 10 m [11].
What’s more, in wireless transmission, path loss is susceptible to human blockage due to the human body obstructing the line-of-sight (LoS) component and it is particularly severe for VLC systems [12]. Taking an example of the millimeter wave signal, there will appear four states when encountering blockage: falling, blocking, rising, and returning to the unblocked state. In the process of falling and rising, the signal intensity remains high for a certain period, which can maintain communication between transceivers. However, it should be highlighted that for VLC, the wavelength of light is only a few hundred nanometers, and it is almost impossible for light to bypass the macro blockages by diffraction [13]. Once encountering blockage during propagation, the signal intensity will rapidly fluctuate on a large scale and fall to an extremely small level without the process of rising and falling. Consequently, the receiving position can hardly receive any signal once blockage occurs, reducing the stability of the VLC system [12]. Therefore, it is eminent to propose a path loss model which can characterize the wavelength dependence properties and the human blockage effect for VLC.
In following, we will give a review of the research on path loss which takes into account the wavelength dependence and the human blockage for the visible light channel.
1.1. Literature Review
Looking from the existing literature, there are many studies that pay attention to path loss in indoor scenarios for VLC. For instance, the channel path losses for various receiving positions in indoor environments was presented in [14]. An optical ray-tracing approach for minimizing path loss in a variable link was discussed in [15]. The distance (CI) model of VLC was derived in [16]. The impact of transceiver characteristics on path loss was studied in [17]. However, in these studies, wavelength dependence and human blockage were not considered.
Furthermore, some works investigate the impact of wavelength dependence on path loss without considering the human blockage effect. In [11], a measurement campaign was conducted and a wavelength-dependent path loss model was proposed based on the measurement data. In [9,18], the path loss was investigated with consideration of the radiant power spectral density (PSD) of white LED and the wavelength-dependent spectral reflection coefficient in obtaining the channel impulses response (CIR). Based on the derived CIR, in [9], a path loss model was proposed in the form of the close-in (CI) model which is a distance-dependent function. In [18], the path loss was modeled as a logarithmic function of two parameters by curve fitting. The influence of material reflection characteristics on path loss was explored and the model parameters were given under two kinds of specific reflection materials. However, in these works, the wavelength dependence is integrated within the proposed model and the relationship between the wavelength and the path loss has not been reflected.
Moreover, the path loss is investigated with the presence of human blockage without considering the wavelength dependence. In [19], it was conducted a measurement campaign with realistic human blockage during office hours in an office scenario. In [20], a solution framework was proposed to enhance the communication performance in a realistic indoor environment where blockage from both the static objects and mobile human persons exists. In [21], a measurement campaign was conducted to study path loss with a human body staying in a fixed position. However, in a realistic application scenario, the human is usually moving and the path loss with the static human blockage can not reflect the link instability induced by human mobility. Also, in [21], there is no proposed model to describe the impact of human blockage on path loss. To involve human mobility in the investigation, path loss with human blockage was studied based on a human moving trajectory. In [22], the human moving trajectory was generated by a random trajectory generator algorithm in which step direction angle and step length are chosen uniformly. In [18], the human moving trajectory was a fixed route next to the wall and furniture. And, in [18,22], the path loss with mobile human blockage was both modeled as a random variable with the log-normal distribution. However, in these works, the human moving trajectory which dominates the variation in the channel states does not exhibit the characteristics of realistic human walking behavior, thereby reducing the accuracy of the path loss model.
In a word, the research on path loss that considers the impact of wavelength dependence and the human blockage has been done in some literature. However, due to the lack of a realistic human moving trajectory, the existing path loss model can not accurately reflect the effect of mobile human blockage. Furthermore, to the best of the authors’ knowledge, there is no standardized channel model or a comprehensive model which can characterize the impact of both the wavelength dependence and the mobile human blockage on path loss for indoor VLC channels.
1.2. Contribution of This Paper
In order to address the limitations of the existing works and hence offer an accurate tool for proper characterization of the path loss for indoor VLC channels, we have carried out the following contributions herein paper:
- A novel path loss model is proposed which contains the multi-wavelength path loss under free space propagation and the blockage probability (BP) caused by the mobile human blockage. To the authors’ knowledge, this is the first path loss model that considers the impact of wavelength dependence combined with mobile human blockage.
- The wavelength dependence of path loss is investigated in both the single-LED and the multi-LED scenarios. The multi-wavelength path loss under free space propagation is modeled to describe the path loss in the non-blockage state. The small RMSE of the derived parameters shows that our proposed models have the goodness of fit to the simulated data.
- The impact of mobile human blockage on path loss is studied in both the single-LED and the multi-LED scenarios. The BP is modeled based on a realistic human moving trajectory and a geometry-based human body shadowing calculation method. A human moving trajectory generating algorithm is established which is capable of producing trajectories with realistic human walking behavior in the indoor scenario.
1.3. Paper Organization
The rest of this paper is organized as follows. In Section 2, the path loss model with human blockage is described in detail. In Section 3, the multi-wavelength path loss models under free space propagation in both the single-LED scenario and the multi-LED scenario are given. In Section 4, the BP modeling in both the single-LED scenario and the multi-LED scenario are presented. Finally, conclusions are drawn in Section 5.
2. Multi-Wavelength Path Loss Model with Human Blockage
This section will show the multi-wavelength Path Loss Model with Human Blockage in both the single-LED scenario and the multi-LED scenario. Firstly, the VLC channel model which is used to obtain the path loss under free space propagation is presented. Secondly, the path loss models in the single-LED scenario and the multi-LED scenario which contain the multi-wavelength path loss under free space propagation and the BP are presented respectively.
2.1. VLC Channel Model
A VLC system consists of three parts: the transmitter, the receiver, and the visible light channel. At present, light-emitting diode (LED) and photodiode (PD) are the commonly used transmitter and receiver, respectively. As for the description of the visible light channel, the recursive model is used due to its advantages of high accuracy.
Generally, LED adopts the Lambert radiation pattern [23], and the radiant intensity at each direction angle is [24]
where is the angle of irradiance which is commonly denoted as the angle of departure. m is the mode number of the radiation lobe, which expresses the directivity of the source beam and it is related to the LED semi-angle at half-power as
A mode of corresponds to a traditional Lambertian source.
Light is emitted from the LED and transmitted through the visible light channel. Due to the multi-path effect, the light from the LED source S will reach the receiver R through multiple different paths. For the LoS component, the channel impulse response (CIR) can be calculated according to the LED radiation pattern as [25]
where is the angle of arrival. is the width of the field of vision (FoV) of the PD. D is the distance between the LED and the PD. is the area of the PD. The received power of the LoS link is [26]
where is the average transmitted power of LED.
For the non-line-of-sight (NLoS) component, the CIR can be calculated by utilizing the recursive model. In the recursive method, the NLoS process is treated as multiple LoS process. For example, the first reflection path can be regarded as two LoS processes. Firstly, each effective scatterer is divided into small reflecting elements with a total number of n. Each reflecting element is considered as both the receiver of the first LoS () with an effective area and a position of , and the transmitter of the second LoS () whose radiation pattern is described by the transmitter radiation pattern. By using convolution operation to connect between these two processes, the CIR of the first reflection can be obtained. Through multiple recursive operations, k-th reflection can be obtained. Consequently, the CIR of the rays experiencing k-th reflection can be expressed as [25]
Here, denotes the wavelength-dependent reflection coefficient of the reflecting element. In an indoor scenario, the typical scatterer, i.e., walls, are made of plaster materials. The wavelength-dependent reflection coefficient of plaster material is illustrated in Figure 1. It is observed that there is a significant increase in the reflection coefficient with the increasing signal wavelength which leads to the wavelength dependence of the visible light channel.
Theoretically, the number of reflections is infinite for visible light signals. In previous studies, it is reported that the contribution from the second-order reflection is about 0.7 dB [27] and this is in good agreement with the result outlined in [28]. It is about a 2% decrease in the received power, which is not significant from the practical systems point of view. Therefore, in this paper, considering the tradeoff between accuracy and complexity, we calculated the first reflection path for the NLoS component. The power of the NLoS component can be calculated as
At the receiver, the non-imaging concentrator with gain and optical filter with gain are usually used to enhance the system performance. The gain of the concentrator can be given by
where n denotes the refractive index of the lens at the PD. If the VLC system is not equipped with a concentrator nor an optical filter, then the corresponding optical gains can be set as 1, that is, . Therefore, the received power can be calculated by
Here, indicates the optical power reaching the receiver after channel transmission which is the superposition of the LoS and NLoS components.
If there is no blockage for all the rays, then the path loss can be obtained by
2.2. Multi-Wavelength Path Loss with Human Blockage in Single-LED Scenario
In this subsection, we analyze and model the path loss in the single-LED scenario with the presence of human blockage. When there is a person exists in the environment, the visible light signal in some specific directions will be cut off by the human body resulting in a shadowing area on the receiving plane. The shadowing area is the communication blind area which destroys the full coverage of VLC, as illustrated in Figure 2. In mobile VLC systems, the human body will move along a trajectory, and the position of the human body will vary with time. The shadowing area caused by human blockage will change accordingly. For a receiving position, there will be two states, i.e., in the shadowing area with the blockage state and in the unshadowed area with the free space propagation state. The percentage of time that it is in the shadowing area is the BP. Therefore, to characterize the two-state properties in the single-LED scenario, the conventional distance-dependent path loss model should be modified into the statistical model with two cases. That is, under the BP, the receiving positions can hardly receive any optical signal from the transmitter. While under the other probability, i.e., 1-BP, the path loss is consistent with that under the free space propagation.
To describe the two-state properties, the multi-wavelength path loss model with human blockage in the single-LED scenario is proposed in the form of a piecewise function
Here, indicates the path loss model of the free space propagation to describe the path loss in the unshaded area. In , the Alpha-Beta-Gamma (ABG) model is utilized to simultaneously reflect the wavelength dependence and the distance dependence of path loss. The ABG model can be expressed as
where is the received-power reference point (It is set to 1 m in this paper), and are the distance and wavelength dependence on path loss, respectively. is the optimized offset in path loss. is a zero-mean Gaussian variable with a standard deviation representing the shadowing. In this ABG model, we can see that path loss varies with the wavelength and the spatial distance.
indicates the BP caused by the human blockage in the single-LED scenario. It is a statistical characteristic of the blockage performance in the time domain which indicates the percentage of the time that a receiving position is in the shadowing area. It is worth noting that there are many factors that will influence the distribution of the shadowing area. Firstly, the shape of the human body affects the location distribution of the shadowing area. The increase in human figures will lead to an extension of the shadowing area. Secondly, the human moving trajectory determines the time distribution of a specific shadowing area. To accurately reflect the blockage performance of a mobile VLC system, both the human body shadowing calculation and the human moving trajectory generation should be consistent with that in the realistic application scenario.
2.3. Multi-Wavelength Path Loss with Human Blockage in Multi-LED Scenario
To meet the lighting requirements, multiple LEDs are usually used for lighting simultaneously, which enables multi-LED communication in VLC systems. In this subsection, we discuss path loss with the presence of human blockages in the multi-LED scenario.
The use of multiple LEDs also increases the complexity of the blockage conditions. In the single-LED scenario, the path loss with human blockage shows the two-states properties, while in the multi-LED scenario, signals from different transmitters form different shadowing areas on the receiving plane and thus, result in two-state for each transmitter. For a receiving position, it may receive optical signals from some transmitters, and optical signals from other transmitters will be blocked. The number of blockage conditions depends on the number of transmitters. According to the principle of permutation and combination, when the number of LEDs is N, the number of blockage conditions is . Therefore, at each receiving position, the possible case for path loss is also .
Taking as an example, for the receiving position in the 3-LED scenario, there are 8 cases of blockage conditions, as illustrated in Figure 3. Different from the situation in the single-LED scenario that, once the blockage happens the receiving positions can not receive any optical signal from the transmitter, in the multi-LED scenario, only under the blockage condition where all the signals from the three LEDs are cut off, the receiving position will be in a complete blockage state. While under the other seven cases of blockage conditions, which can be classified into three categories, i.e., no blockage, blockage for one LED, and blockage for two LEDs, the signal can be partially or totally received.
Therefore, the multi-wavelength path loss model with human blockage in the 3-LED scenario is proposed in the form of a piecewise function with 8 cases, which is given by
Here, the path loss for the 8 cases of blockage conditions can be derived by utilizing the multi-wavelength path loss model of free space propagation in the multi-LED scenario. For instance, the cases in which only the signal from LED is blocked can be regarded as the free space propagation of the signal from LED and LED. The path loss of other cases can be derived in a similar way.
Moreover, the probability that the 8 cases of blockage conditions occur can be described by the BP. is the non-blockage probability that all the signals from the three transmitters are received. is the BP that signals from LED are blocked and the signals from the other LEDs are received. is the BP that signals from LED are received and the signals from the other LEDs are blocked. is the complete blockage probability that the signals from three LEDs are all blocked.
Therefore, in the path loss model with mobile human blockage, the value of the path loss for each blockage condition can be characterized by the multi-wavelength path loss model of the free space propagation, and the occurrence probability of each blockage condition can be described by the BP. In the next section, we conduct the multi-wavelength path loss analysis and modeling under free space propagation.
3. Multi-Wavelength Path Loss Analysis and Modeling under Free Space Propagation
This section will show path loss analysis and modeling under free space propagation with consideration of wavelength dependence. Firstly, the multi-wavelength path loss model in the single-LED scenario is proposed in the form of the ABG model. Secondly, the multi-wavelength path loss model in the multi-LED scenario is derived based on the proposed ABG model in the single-LED scenario. In our simulated scenario, the size of the indoor scenario is set as that of a typical conference: 5 m × 5 m × 3 m. The LED is all placed vertically downward in the center of the ceiling and the receiver is placed vertically upward on the floor in a uniform distribution. The other parameter configurations of the VLC system are shown in Table 1.
3.1. Multi-Wavelength Path Loss Model of Free Space Propagation in Single-LED Scenario
Based on the VLC channel model in Section 2, the multi-wavelength path loss of the free space propagation in the single-LED scenario is obtained, as shown in Figure 4. Firstly, we investigate the effect of transceiver distance on path loss. It can be observed that the path loss increase along with the increasing transceiver distance. For instance, the path loss is 54.42 dB at d = 3 m and increases to 61.45 dB at d = 4.60 m. This is mainly because the channel direct current gain for the LoS component is significantly affected by the square of propagation distance with a nonlinear inverse correlation. Therefore, as the receiver moves away from the transmitter, a large path loss occurs. This positive relationship between the transceiver distance and the path loss coincides with the conclusion obtained from the measurements in [29].
Meanwhile, we investigate the effect of signal wavelength on path loss. It is found that the path loss increase with the increase in signal wavelength. The extra-wide wavelength range of visible light signal from 380 nm to 780 nm can cause a difference of 1.74 dB on the path loss at d = 4.60 m. This can be attributed to the NLoS component of the visible light channel. During reflection, the increase of the light wavelength usually leads to a nonlinear increase in the reflection coefficients of the plaster materials. Therefore, the path loss at a smaller light wavelength suffers more severe decay than that at a larger light wavelength.
Furthermore, we use the ABG model to fit our simulated results. The simulated path loss and the ABG model are plotted in Figure 4. The derived parameters are , , , . has a small value, which shows that the fitted ABG model is in good agreement with the simulation data.
3.2. Multi-Wavelength Path Loss Model of Free Space Propagation in Multi-LED Scenario
According to the theoretical definition, path loss is related to the power of the transmitted signal and the power of the received signal. In the multi-LED scenario, the transmitted power is the sum of the power of the three LEDs which is a pre-known value. The received power can be regarded as the superposition of received power from every single LED. Therefore, the path loss in the multi-LED scenario can be obtained by
According to the (9), the received power from a single LED can be expressed by
where is the proposed ABG model in the single-LED scenario. indicates the distance from the receiver to LED. and indicates the wavelength and the power of LED, respectively. By substituting (14) to (13), the path loss in the multi-LED scenario can be derived as
Due to the utilization of the ABG model, the proposed path loss model in the multi-LED scenario takes into consideration the wavelength dependence and the distance dependence. Moreover, the relationship between path loss and the deployment of multiple LEDs is included through the application of all the transceiver distances. Also, the proposed model is applicable to scenarios with various transceiver deployments.
The path loss of a 3-LED scenario with typical deployment is obtained using both the simulation method and the proposed model by fixing the wavelength at 455 nm. In the indoor scenario, the transmitters are uniformly arranged on the X-axis of the room with a spacing of 1.5 m which is illustrated in Figure 5.
The simulated path loss and the path loss derived from the proposed model are shown in Figure 6. It is found that the path loss shows an obvious correlation with the transmitter deployment. In the scenario with the LED arranged on the X-axis of the indoor scenario, the path loss is also axisymmetric about the room. At the direction of the Y-axis, the path loss on both sides of the X-axis is 56.44 dB for receiving positions with the same distance of 3.16 m from the X-axis. Moreover, the path loss has an increasing trend with the increase of the distance between the receiving position and the X-axis. For example, at the direction of the Y-axis, the increasing distance of 0.91 m can lead to an increase of 4 dB for path loss. And, both the axisymmetric feature and the increasing trend reflect the rationality of the relationship between path loss and transmitter deployment in the multi-LED scenario.
To verify the accuracy of the proposed model, root mean square error (RMSE) is calculated by
where is the number of simulated data. and indicate the simulated data and the data from the proposed model, respectively. The RMSE is 0.0094 indicating that the proposed model is in good agreement with the simulated data.
4. Blockage Probability Analysis and Modeling
In this section, we present human blockage characterization with consideration of human mobility and human body shadowing and conduct the BP modeling in both the single-LED scenario and the multi-LED scenario. Firstly, the human moving trajectory is generated to derive the time allocation and position information of the human body. Secondly, the human body shadowing calculation method is used to determine the extent of the human shadowing area for a specific human position. Then, the human shadowing area is calculated for each human position in the moving trajectory. Finally, for each receiving position, the BP is obtained by calculating the percentage of time that it is in the shadowing area.
4.1. Human Moving Trajectory Generating
In this subsection, we present a human moving trajectory generating algorithm to characterize realistic human walking behavior. In order not to lose authenticity, the semi-Markov renewal process and the Lévy-walk are used to describe human mobility. In a semi-Markov renewal process, a human moving trajectory can be divided into two states: the moving state before reaching a position and the sojourn state at the position. The two states can be used alternately to generate the human moving trajectory in a continuous time period.
In the moving state, three steps need to be performed. Firstly, select the next destination according to the step length and orientation. Secondly, calculate the duration of the moving state based on the step length and the moving speed. Thirdly, select the moving route from the current position to the next destination.
The step length indicates the radial distance between the next destination and the current position. According to [13], the step length is subject to truncated heavy-tailed distribution such as the Pareto distribution, which can be expressed by
in which is the PDF of the step length r. is a positive parameter. and are the minimum and maximum step lengths related to the distance of elements in the destination set. Human movements share similar patterns on any scale since the key statistical characteristics of re-scaled individual trajectories are identical. Hence, this truncated heavy-tail distribution contributes prominently to the indoor trajectories.
The orientation is the direction of the next destination in the local coordinate system (LCS) of the current position. The random orientation of a mobile terminal can be modeled by a polar angle and an azimuth angle. In this paper, we assume that the human body maintains upright while walking, thus the polar angle is stationary at 0 degrees. According to [30], the azimuth angle can be regarded as a random variable subject to uniform distribution between 0 and 360 degrees.
After the selection of the next destination, the human body moves in a straight line from the current position to the next destination. Generally, for the human body moving indoors, the maximum and minimum walking speed is 2.1 m/s [31] and 1 m/s, respectively. The walking speed can be regarded as evenly distributed between the maximum speed and the minimum speed.
When is a heavy-tailed function, the mobility specified by is a Lévy-walk, which is a kind of continuous-time random walk that has the joint space-time probability density function (PDF) [13]:
where is the duration of the moving state can be obtained by dividing the step length by the moving speed. Due to the uniform distribution of moving speed, the duration of the moving state also follows a uniform distribution under the condition that the step length has been obtained. is the conditional probability density that step length r takes time in movement. In the general movement, the bounded Lévy-walk plays the decisive role in each transition [32].
After reaching the next destination, the sojourn state starts. Within a certain sojourn time, the human body remains stationary in the current position. From [32], the sojourn time is also subjected to a truncated Pareto distribution as
in which denotes the sojourn time. corresponds to the positive parameter. and are the minimum and the maximum sojourn times at the current location, respectively. By continually iterate between the sojourn state and the next moving state, the human moving trajectory for a continuous period of time can be obtained.
The detailed human moving trajectory generating procedure is summarized in the Algorithm 1. The parameter settings in our simulation are shown in Table 2.
| Algorithm 1 Human Moving Trajectory Generator |
|
4.2. Human Body Shadowing Calculation Method
There are three factors related to the human body shadowing area: the shape of the human body, the transmitter position, and the human body position. Once these three factors are determined, according to a relative geometrical relationship, the extent and position of the human body shadowing can be derived. Next in this section, the human body is modeled first, and then the shadowing area is calculated based on the geometry-based method.
In this paper, the human body is modeled as a cylinder with height and radius denoted by H and R, respectively [35]. The position of the human body is . The position of the transmitter and the receiver is and , respectively. These position coordinates are their values in the global coordinate system (GCS).
There are two key parameters that determine the extent of the shadowing area: angle range and radius distance. When the horizontal distance between the human body and the transmitter is less than R, the angle range of the shadow is 360 degrees in the LCS of the transmitter, and the shape of the shadow is circular or oval, as shown in Figure 7.
For a specific shadow angle in the LCS of within the angle range, its corresponding radial length is . is the distance between and point E which is the maximum radial length of the shadow. If the distance between a receiving position and the transmitter is less than , the receiving position is in the shadowing area which is in a blockage state. can be expressed as
where is the height of the indoor scenario. Point Q represents the intersection point of the radial distance and the human cylinder on the two-dimensional plane. and are the abscissa and ordinate of point Q. The calculation methods of the position coordinates of point Q will be introduced later.
When the horizontal distance between the human body and the transmitter is greater than R, the angle range is . The shape of the shadow is a part of a fan, as shown in Figure 8.
and are the minimum and maximum coverage angle of the shadow which can be calculated according to the quadrant where is located in the LCS of , as shown in Table 3. can be expressed as
where is the horizontal distance between and . is the angle of the line from to in the LCS of , which can be expressed as
Under this circumstance, the range of radial distance is . is the lower limit of the shadow range on every shadow angle. and can be calculated by [34]
and are the abscissa and ordinate of point , and are the abscissa and ordinate of point . If the distance between the transceiver is greater than and less than , the receiver is located in the shadowing area.
The coordinate value of point Q, point , and point can be calculated by the binary system of equations [35]
where K is the slope of the line between the receiver and the origin in the LCS of . By solving the binary system of equations, we can get two groups of solutions
and
The expression of can be given by
For the case where the horizontal distance between the human body and the transmitter is less than R, if the receiver is in the first quadrant or the fourth quadrant in the LCS of , then . If the receiver is in the second quadrant or the third quadrant in the LCS of , then . For the case where the horizontal distance between the human body and the transmitter is greater than R, equals the larger absolute value of and . equals the smaller absolute value of and .
4.3. Blockage Probability Model in Single-LED Scenario
Based on the human moving trajectory generating algorithm and the human body shadowing calculation method, the BP can be obtained by calculating the percentage of time that the receiving position is in the shadowing area. The BP in the single-LED scenario is depicted in Figure 9.
It is founded that, on the whole, the BP increases along with the increasing transceiver distance d. For example, in the diagonal direction of the room, the BP is 0.016 at d = 3 m and increases to 0.066 at d = 4.22 m with a difference of 6.15 dB. And in the positive X-axis direction, the BP is 0.016 at d = 3 m and increases to 0.037 at d = 3.9 m which has a difference of 3.64 dB. This is mainly because the human body shadowing is always toward the outward direction of the human body with respect to the transmitter, thus the receiving position with a larger transceiver distance will have a greater probability to be blocked.
Furthermore, the BP of the receiving positions with the same transceiver distance is not exactly the same and has a considerable fluctuation. For example, for the receiving positions where the transceiver distance is 4.6 m, the BP fluctuates in the range from 0.02 to 0.06. What’s more, there are some specific directions where the lower bound of the fluctuated BP appears. It can be observed that the BP is generally lower in the direction of the symmetry axis of the room, i.e., the X-axis and the Y-axis. For instance, for the receiving positions at a transceiver distance of 3.84 m, the BP in the diagonal direction is 0.063. While for the receiving positions at the same transceiver distance in the X-axis direction, the BP decreases to 0.010 which is 7.99 dB lower than that in the diagonal direction. It is obvious that the distribution of BP has a tight connection with the relative position in the environment.
Based on the analysis, it is found that the BP in the single-LED scenario is related to three parameters: the transceiver distance, the distance to the X-axis, and the distance to the Y-axis. Also, the transceiver distance can be expressed by the two other parameters as
where and denote the three-dimensional distance between the receiving position and the X-axis and the Y-axis, respectively. is the fixed vertical distance between the transceiver. Therefore, the BP can be modeled as a two-dimensional function related to and :
where
The derived parameters of the mean value are , , , . The RMSE is 0.006 indicating that our proposed model has the goodness of fit to the simulated data.
4.4. Blockage Probability Model in Multi-LED Scenario
In this subsection, we discussed the modeling of multiple BPs in the multi-LED scenario. To obtain the BP in the multi-LED scenario, the human body shadowing modeling should be conducted for every single LED. In the 3-LED scenario, for every human position in the moving trajectory, three shadowing areas with different shapes and positions exist at the same time. And the eight blockage conditions are the joint effect of the three shadowing areas.
Figure 10 illustrates the probabilities of the eight blockage conditions in the 3-LED scenario. It is observed that all eight probabilities show a common feature, namely symmetry about the X-axis which is the transmitter deployment line. This is due to the deployment of the transmitter determines the directions of the visible light signal. On both sides of the X-axis, the direction of the visible light signal is symmetric, and the positions where the shadowing area appears are symmetric, thus the distributions of BPs are also symmetric. What’s more, except for the common-shared symmetry, the BPs possess unique characteristics that can be attributed to the specific requirements of blockage conditions on the incident signal direction. In order to derive BP models with high accuracy, both the common features and the unique characteristics of the BP need to be well described. In the following, we analyze and model the BP of the eight blockage conditions separately. The model parameters are extracted from the simulated data through the least square (LS) method.
The simulated results and the fitting model of are plotted in Figure 10a. It is found that as the distance to the X-axis becomes larger, the has a nonlinear decrease. The maximum and minimum value of is 0.93 and 0.87, respectively. Moreover, for receiving positions with the same distance from the X-axis, the is almost equivalent. Therefore, is modeled as a function of the distance between the receiving position and the X-axis. The power function is used to fit the nonlinear decreasing trend:
where
Figure 10b presents the simulated results and the fitting model of . It is observed that the is significantly affected by the distance between the receiving position and the LED with a positive correlation. For instance, at the direction of the X-axis, the under the distance of 5 m from is about 23.42 dB larger than that under the distance of 3 m from LED. Moreover, the symmetry with respect to the X-axis is equally applicable for and it is found that the increases along with the increasing . At the receiving positions with a distance of 3 m from LED, the increasing of 0.9 m will result in an increase of 15.94 dB for . Also, at the receiving positions with a distance of 5 m from LED, the under the of 3.9 m is 1.57 dB larger than that under the of 3 m. Therefore, can be modeled as a two-dimensional function of the and distance between the receiver and LED:
where
in which denotes the three-dimensional distance between the receiving position and LED.
Figure 10d presents the simulated results and the fitting model of . Due to the symmetry of the LED deployment as well as the symmetry of the income signal direction required by the blockage condition, has the same trend as and can be modeled in the same form with . The only difference is that is not related to , but to the distance between the receiving position and the LED. Therefore, is modeled as
where
in which denotes the three-dimensional distance between the receiving position and LED.
The simulated results and the fitting model of are plotted in Figure 10c. It is found that as the distance to the X-axis becomes larger, the has a nonlinear increasing trend. For instance, the under the of 3.9 m is 10.97 dB larger than that under the of 3 m. Likewise, for receiving positions with the same distance from the X-axis, the is almost equivalent. Therefore, is modeled as a function of . The power function is used to fit the nonlinear increasing trend:
where
Figure 10e presents the simulated results and the fitting model of . It is observed that the is significantly affected by the distance between the receiving position and the LED with a negative correlation. For instance, at the direction of the X-axis, the under the of 3 m is about 20 dB larger than that under the of 5 m. Moreover, is symmetric about the X-axis and is decreasing along with the increasing . At the receiving positions with a of 4.24 m, the increasing of 0.9 m will result in a decrease of 2.55 dB for . Therefore, can be modeled as a two-dimensional function of the and :
where
Figure 10g presents the simulated results and the fitting model of . The relationship of and is the same as that of and . Thus, to obtain the model, the only transformation that needs to do is to substitute with in the model. Therefore, is modeled as
where
The simulated results and the fitting model of are plotted in Figure 10f. It is obvious that the value of is fixed to 0 on the receiving plane. This can be explained by the relative position relationship of LEDs. LED and LED are located on different sides of LED, so it is difficult to happen that the signal from both sides of LED is blocked while the signal of LED is received, which requires the blocking object to have a larger width and a curved shape.
Figure 10h presents the simulated results and the fitting model of which represents the probability of complete blockage for the multi-LED scenario. It can be found that there is no obvious trend for , which is similar to a random variable, and it has been proved that its distribution conforms to normal distribution. Therefore, is modeled as a normal random variable with a mean of 0.0138 and a variance of :
The RMSEs between the proposed BP models and the simulated data under the eight blockage conditions are small, which are 0.0063, 0.0047, 0.0016, 0.0048, 0.0024, 0, 0.0024 and 0.0040 for , , , , , , and , respectively, indicating that the proposed models fit well with simulated data.
The blockage performance is analyzed comparatively in single-LED and multi-LED scenarios. Firstly, the probability of a complete blockage in the multi-LED scenario is much lower than that in the single-LED scenario. We calculate the expectation of complete BP for all receiving positions on the receiving plane in both scenarios. The expectation of complete BP is 0.037 in the single-LED scenario and 0.013 in the multi-LED scenario, which has a decline of 4.54 dB. What’s more, the peak value of the complete BP in the multi-LED scenario is 0.022 which is 3.89 dB lower than that in the single-LED scenario. The results indicate that the distributed arrangement of transmitters can prevent the occurrence of ultra-high BP at the local position of the receiving plane. This is due to the separation of the transmitter enables the angle of arrival (AoA) of the income signal to expand from a single value to multiple values. And, it is much more difficult to simultaneously block the signals from several AoAs than just block the signals from a single AoA, thereby reducing the probability of complete blockage.
Based on the multi-wavelength path loss model under the free space propagation and the BP models of the blockage condition, the path loss for the 3-LED scenario can be expressed by a piecewise function with seven cases, which is given by
5. Conclusions
In this paper, we conduct path loss modeling with consideration of wavelength dependence and mobile human blockage for the indoor VLC channel. Firstly, a novel path loss model which can characterize the impact of wavelength dependence and mobile human blockage is proposed in both the single-LED and the multi-LED scenarios. Moreover, the multi-wavelength path loss of free space propagation is presented to describe the path loss in the non-blockage state. The multi-wavelength path loss in the single-LED scenario is modeled in the form of the ABG model with a wavelength dependence coefficient of −0.007 and a small standard deviation of 0.262. The multi-wavelength path loss in the multi-LED scenario is derived based on the proposed ABG model. Furthermore, the BP caused by the mobile human blockage is investigated based on realistic human mobility and human body shadowing calculation. In the single-LED scenario, the complete BP can reach 0.08 and the lower bound of the BP shows a strong correlation with the relative direction of the transceiver. Moreover, in the multi-LED scenario, the complete BP is about 4.54 dB lower than that in the single-LED scenario, indicating that the distributed deployment of transmitters can effectively reduce the complete BP. Generally, this work can give an insight into the link budget of VLC systems for 6G. However, there are certain limitations of the proposed model. The complexity of the model is high and the computational cost is large. In future work, we will try to reduce the complexity and the computational cost, and provide a path loss model considering mobile human blockage with high accuracy and low complexity.
Author Contributions
P.T., J.Z. and Z.H. are my instructors and give full guidance and English correction during the writing process. Then, Y.Y. carried out the related work, including the construction of the simulation environment, the analysis of the simulation data, and the writing of the original draft. L.X. and G.L. as experts in VLC channel modeling in the company, also provide a lot of guidance on modeling during the data analysis. All authors have read and agreed to the published version of the manuscript.
Funding
This research is supported in part by National Natural Science Foundation of China (62201086, 62101069, 61925102), National Key R&D Program of China (2020YFB1805002), Beijing University of Posts and Telecommunications-China Mobile Research Institute Joint Innovation Center (CMYJY-202000276), and State Key Laboratory of Information Photonics and Optical Communications (Beijing University of Posts and Telecommunications) (No. IPOC2023ZT02), P. R. China.
Data Availability Statement
Data are contained within the article.
Acknowledgments
The authors would like to thank Baobao Liu, Yu Tong and Shuo Liu for their help in preparing and writing this paper.
Conflicts of Interest
Authors Liang Xia, Guangyi Liu were employed by the China Mobile Research Institute. The remaining authors declare that the research was conducted in the absence of any commercial or financial relationships that could be construed as a potential conflict of interest.
References
- Zhang, J.; Lin, J.; Tang, P.; Zhang, Y.; Xu, H.; Gao, T.; Miao, H.; Chai, Z.; Zhou, Z.; Li, Y.; et al. Channel measurement, modeling, and simulation for 6G: A survey and tutorial. arXiv 2023, arXiv:2305.16616. [Google Scholar]
- Zhang, J.; Tang, P.; Yu, L.; Jiang, T.; Tian, L. Channel measurements and models for 6G: Current status and future outlook. Front. Inf. Technol. Electron. Eng. 2020, 21, 39–61. [Google Scholar] [CrossRef]
- Yin, Y.; Tang, P.; Liu, B.; Zhang, J.; Xia, L.; Liu, B. The comparison and analysis of different noise models for visible light communication. In Proceedings of the International Conference on Frontiers of Electronics, Information and Computation Technologies, Seoul, Republic of Korea, 19–21 February 2021. [Google Scholar]
- Khreishah, A.; Shao, S.; Gharaibeh, A.; Ayyash, M.; Elgala, H.; Ansari, N. A hybrid RF-VLC system for energy efficient wireless access. IEEE Trans. Green Commun. Netw. 2018, 2, 932–944. [Google Scholar] [CrossRef]
- Hussain, B.; Li, X.; Che, F.; Yue, C.P.; Wu, L. Visible light communication system design and link budget analysis. J. Light. Technol. 2015, 33, 5201–5209. [Google Scholar] [CrossRef]
- Alsalami, F.M.; Aigoro, N.; Mahmoud, A.A.; Ahmad, Z.; Haigh, P.A.; Haas, O.C.; Rajbhandari, S. Impact of vehicle headlights radiation pattern on dynamic vehicular VLC channel. J. Light. Technol. 2021, 39, 3162–3168. [Google Scholar] [CrossRef]
- Mmbaga, P.F.; Thompson, J.; Haas, H. Performance analysis of indoor diffuse VLC MIMO channels using angular diversity detectors. J. Light. Technol. 2015, 34, 1254–1266. [Google Scholar] [CrossRef]
- Sharda, P.; Reddy, G.S.; Bhatnagar, M.R.; Ghassemlooy, Z. A comprehensive modeling of vehicle-to-vehicle based VLC system under practical considerations, an investigation of performance, and diversity property. IEEE Trans. Commun. 2022, 70, 3320–3332. [Google Scholar] [CrossRef]
- Zhu, X.; Wang, C.; Huang, J.; Chen, M.; Haas, H. A novel 3D non-stationary channel model for 6G indoor visible light communication systems. IEEE Trans. Wirel. Commun. 2022, 21, 8292–8307. [Google Scholar] [CrossRef]
- Hussein, A.T.; Elmirghani, J.M. Mobile multi-gigabit visible light communication system in realistic indoor environment. J. Light. Technol. 2015, 33, 3293–3307. [Google Scholar] [CrossRef]
- Tong, Y.; Tang, P.; Zhang, J.; Yin, Y.; Liu, S.; Liu, B.; Liu, B.; Liu, G.; Xia, L. Measurement-based optical path loss model for indoor visible light communication. In Proceedings of the 2022 IEEE Globecom Workshops (GC Wkshps), Rio de Janeiro, Brazil, 4–8 December 2022. [Google Scholar]
- Singh, A.; Ghatak, G.; Srivastava, A.; Bohara, V.A.; Jagadeesan, A.K. Performance analysis of indoor communication system using off-the-shelf LEDs with human blockages. IEEE Open J. Commun. Soc. 2021, 2, 187–198. [Google Scholar] [CrossRef]
- Wu, Z.; Ismail, M.; Kong, J.; Serpedin, E.; Wang, J. Channel characterization and realization of mobile optical wireless communications. IEEE Trans. Commun. 2020, 68, 6426–6439. [Google Scholar] [CrossRef]
- Fahimeh, A.; Hossien, B.; Lina, B.; Sami, M.; Murat, U. Comparative characterization of indoor VLC and MMW communications via ray tracing simulations. IEEE Access 2023, 11, 90345–90357. [Google Scholar]
- Faheem, A.; Sathisha, R.; Jyothsna, M.; Varun, R. Path-Loss optimized indoor laser-based visible light communication system for variable link length gigabit-class communication. IEEE Photonics J. 2020, 12, 1–12. [Google Scholar]
- Feng, L.; Yang, H.; Hu, R.; Wang, J. MmWave and VLC-based indoor channel models in 5G wireless networks. IEEE Wirel. Commun. 2018, 25, 70–77. [Google Scholar] [CrossRef]
- Liu, S.; Tang, P.; Tong, Y.; Yin, Y.; Li, L.; Niu, A.; Xia, L.; Zhang, J. Impact of device specifications on VLC path loss and system performance: An empirical study. In Proceedings of the 2023 IEEE/CIC International Conference on Communications in China (ICCC), Dalian, China, 10–12 August 2023. [Google Scholar]
- Miramirkhani, F. A path loss model for link budget analysis of indoor visible light communications. Electrica 2021, 21, 242–249. [Google Scholar] [CrossRef]
- Bielsa, G.; Palacios, J.; Loch, A.; Steinmetzer, D.; Casari, P.; Widmer, J. Indoor localization using commercial off-the-shelf 60 GHz access points. In Proceedings of the 2018 IEEE Conference on Computer Communications (INFOCOM), Honolulu, HI, USA, 16–19 April 2018. [Google Scholar]
- Huo, Y.; Dong, X.; Ferdin, N. Distributed reconfigurable intelligent surfaces for energy-efficient indoor terahertz wireless communications. IEEE Internet Things J. 2023, 10, 2728–2742. [Google Scholar] [CrossRef]
- Xiang, Y.; Zhang, M.; Kavehrad, M.; Chowdhury, M.S.; Liu, M.; Wu, J.; Tang, X. Human shadowing effect on indoor visible light communications channel characteristics. Opt. Eng. 2014, 53, 086113. [Google Scholar] [CrossRef]
- Donmez, B.; Miramirkhani, F. Path loss and RMS delay spread model for VLC-based patient health monitoring system. In Proceedings of the 2022 4th West Asian Symposium on Optical and Millimeter-wave Wireless Communications (WASOWC), Kumamoto, Japan, 23 April 2022. [Google Scholar]
- Miramirkhani, F.; Uysal, M. Channel modeling and characterization for visible light communications. IEEE Photonics J. 2015, 7, 7905616. [Google Scholar] [CrossRef]
- Ghassemlooy, Z.; Popoola, W.; Rajbhandari, S. Optical Wireless Communications: System and Channel Modelling with Matlab; CRC Press: Boca Raton, FL, USA, 2019. [Google Scholar]
- Barry, J.R.; Kahn, J.M.; Krause, W.J.; Lee, E.A.; Messerschmitt, D.G. Simulation of multipath impulse response for indoor wireless optical channels. IEEE J. Sel. Areas Commun. 1993, 11, 367–379. [Google Scholar] [CrossRef]
- Lee, K.; Park, H.; Barry, J.R. Indoor channel characteristics for visible light communications. IEEE Commun. Lett. 2011, 15, 217–219. [Google Scholar] [CrossRef]
- Chvojka, P.; Zvanovec, S.; Haigh, P.A.; Ghassemlooy, Z. Channel characteristics of visible light communications within dynamic indoor environment. J. Light. Technol. 2015, 33, 1719–1725. [Google Scholar] [CrossRef]
- Komine, T.; Nakagawa, M. Fundamental analysis for visible light communication system using LED lights. IEEE Trans. Consum. Electron. 2004, 50, 100–107. [Google Scholar] [CrossRef]
- Eldeeb, H.B.; Uysal, M.; Mana, S.M.; Hellwig, P.; Hilt, J.; Jungnickel, V. Channel modelling for light communications: Validation of ray tracing by measurements. In Proceedings of the 2020 12th International Symposium on Communication Systems, Networks and Digital Signal Processing (CSNDSP), London, UK, 23–26 October 2020. [Google Scholar]
- Soltani, M.D.; Purwita, A.A.; Zeng, Z.; Haas, H.; Safari, M. Modeling the random orientation of mobile devices: Measurement, analysis and LiFi use case. IEEE Trans. Commun. 2018, 67, 2157–2172. [Google Scholar] [CrossRef]
- Mohler, B.J.; Thompson, W.B.; Creem-Regehr, S.H.; Pick, H.L.; Warren, W.H. Visual flow influences gait transition speed and preferred walking speed. Exp. Brain Res. 2007, 181, 221–228. [Google Scholar] [CrossRef]
- Rhee, I.; Shin, M.; Hong, S.; Lee, K.; Kim, S.J.; Chong, S. On the levy-walk nature of human mobility. IEEE/ACM Trans. Netw. 2011, 19, 630–643. [Google Scholar] [CrossRef]
- Hosseinianfar, H.; Lian, J.; Brandt-Pearce, M. Probabilistic shadowing model for indoor optical wireless communication systems. In Proceedings of the 2019 53rd Asilomar Conference on Signals, Systems, and Computers, Pacific Grove, CA, USA, 3–6 November 2019. [Google Scholar]
- Tang, T.; Shang, T.; Li, Q.; Qian, P.H. Shadowing effects on indoor visible light communication channel modeling. In Proceedings of the 2020 Information Communication Technologies Conference (ICTC), Nanjing, China, 29–31 May 2020. [Google Scholar]
- Tang, T.; Shang, T.; Li, Q. Impact of multiple shadows on visible light communication channel. IEEE Commun. Lett. 2020, 25, 513–517. [Google Scholar] [CrossRef]
Figure 1.
Reflection coefficient of plaster material.
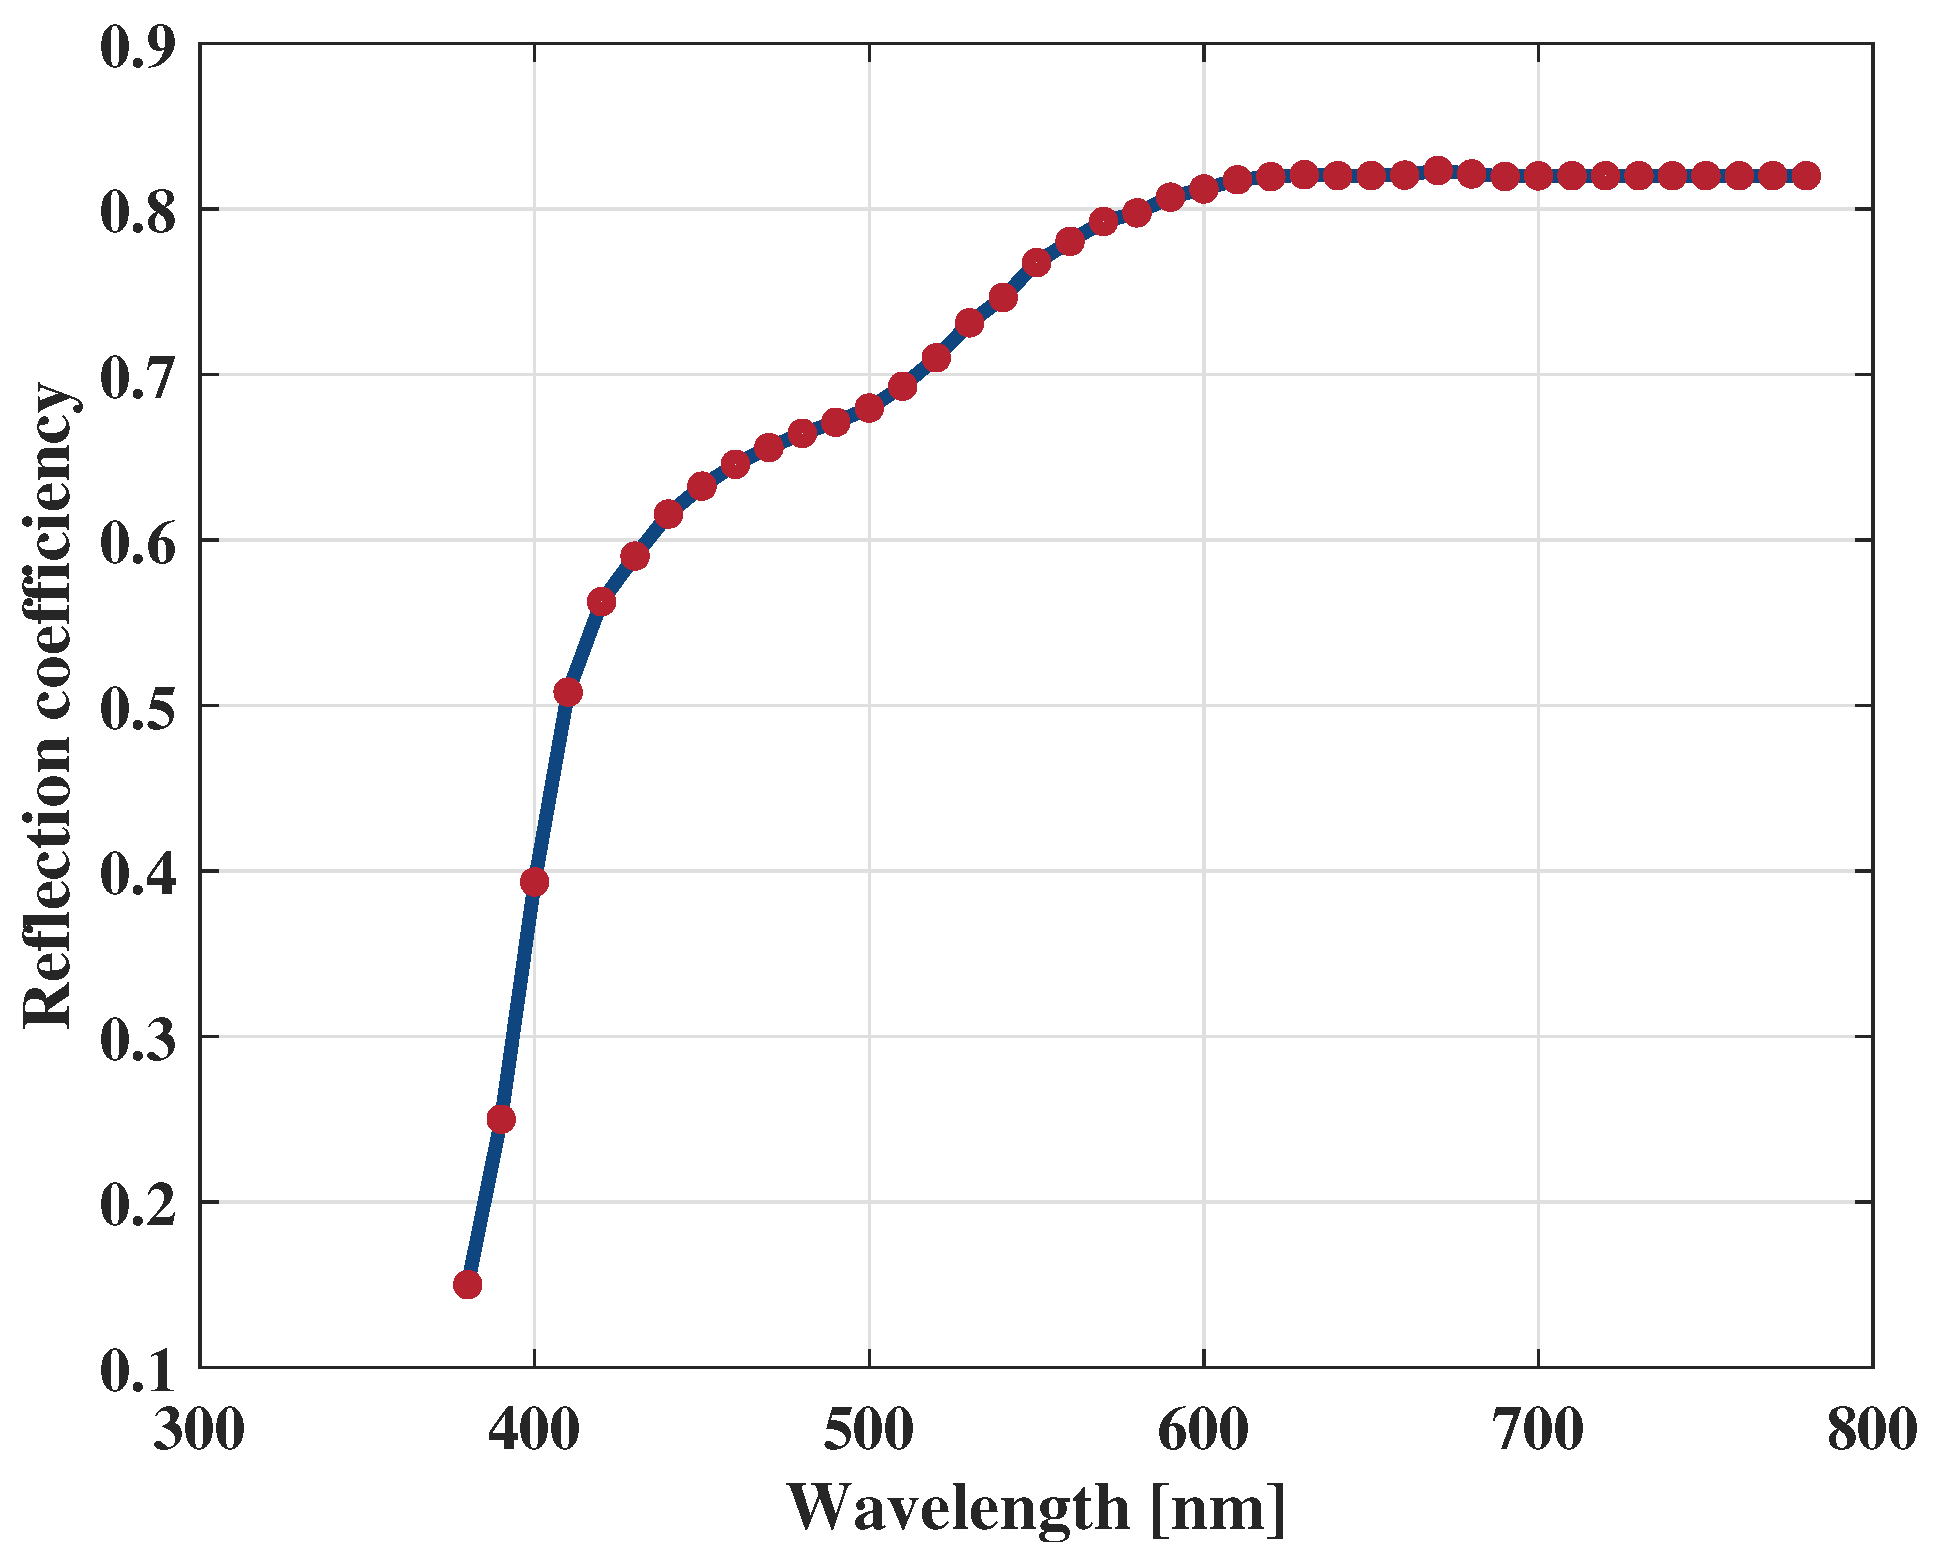
Figure 2.
Human blockage in the single-LED scenario.
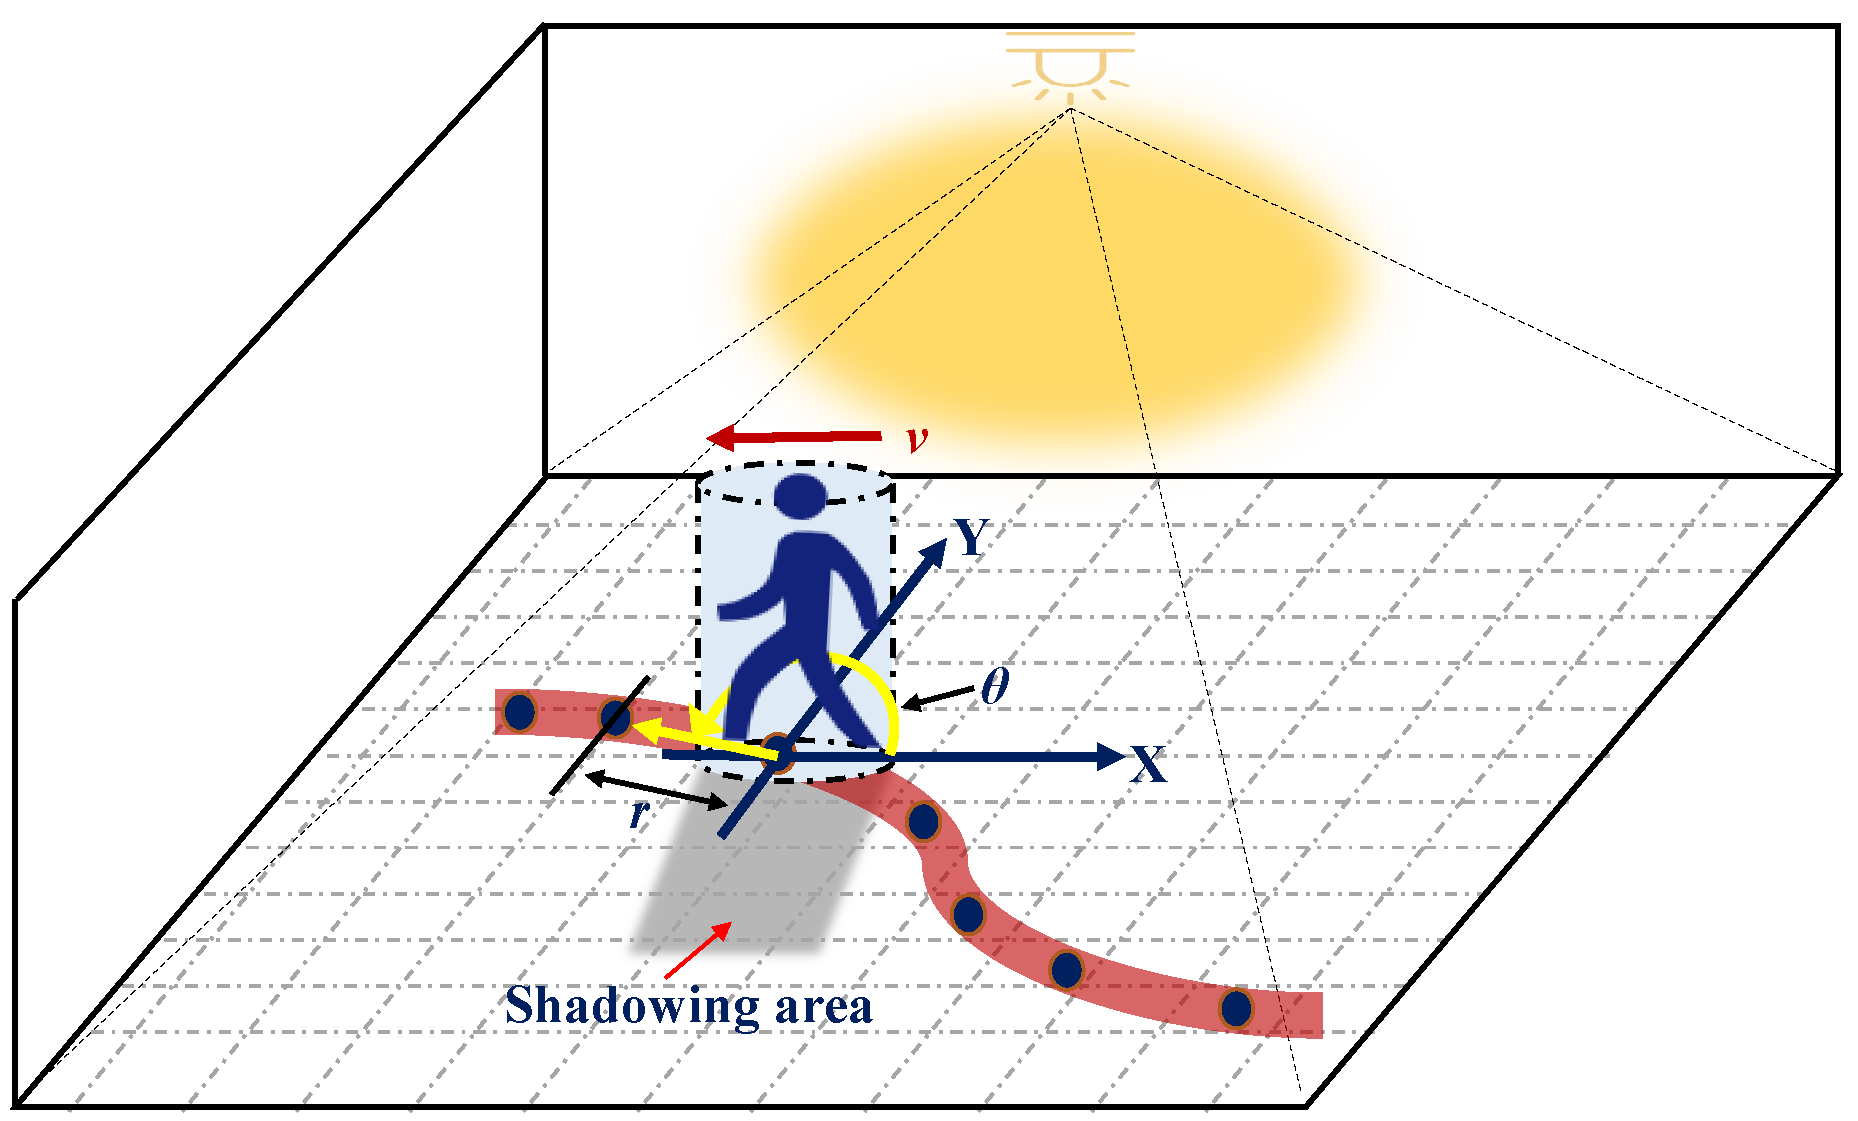
Figure 3.
Human blockage in the 3-LED scenario (This figure represents typical human blockage conditions in the 3-LED scenario. If there is a change in the human body position, the blockage conditions will change accordingly).
Figure 3.
Human blockage in the 3-LED scenario (This figure represents typical human blockage conditions in the 3-LED scenario. If there is a change in the human body position, the blockage conditions will change accordingly).
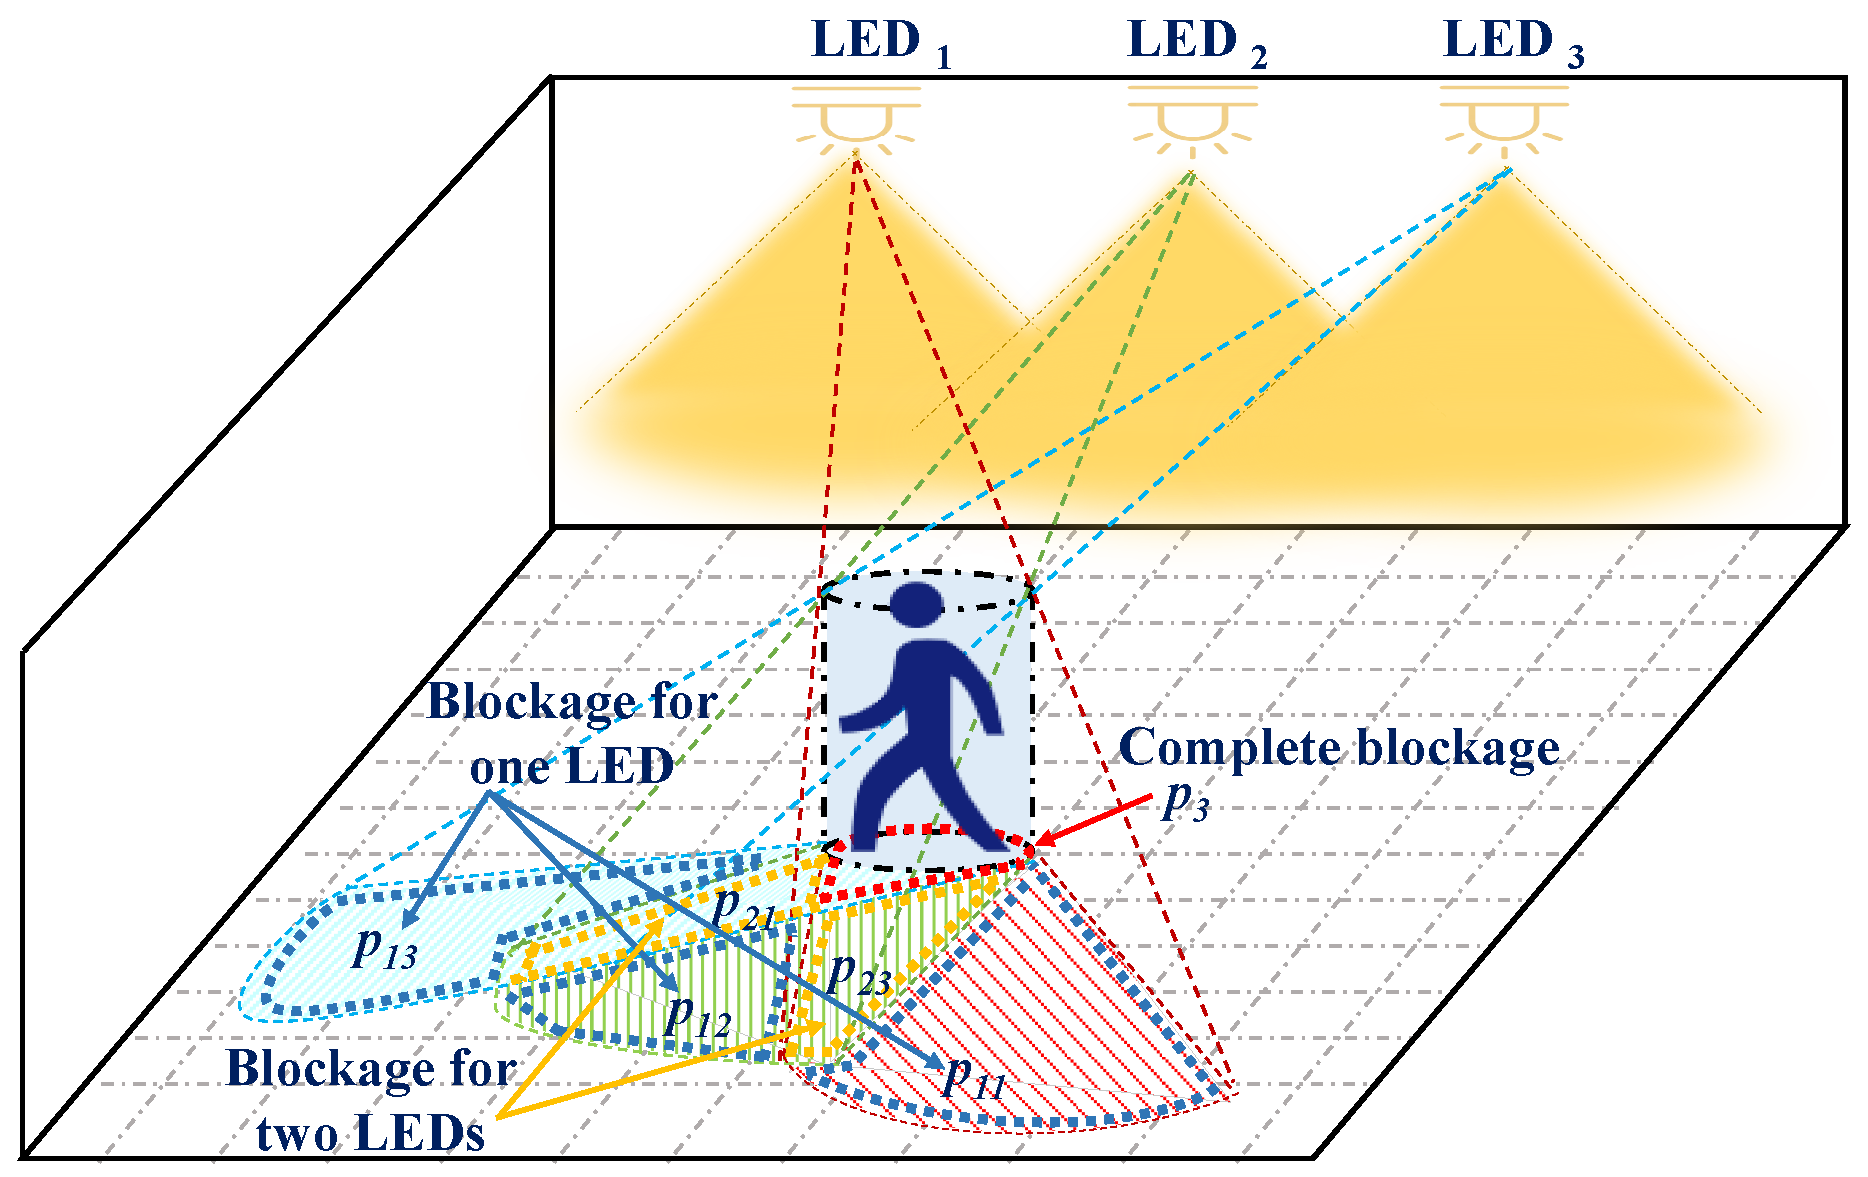
Figure 4.
Muti-wavelength path loss model for the single-LED scenario.
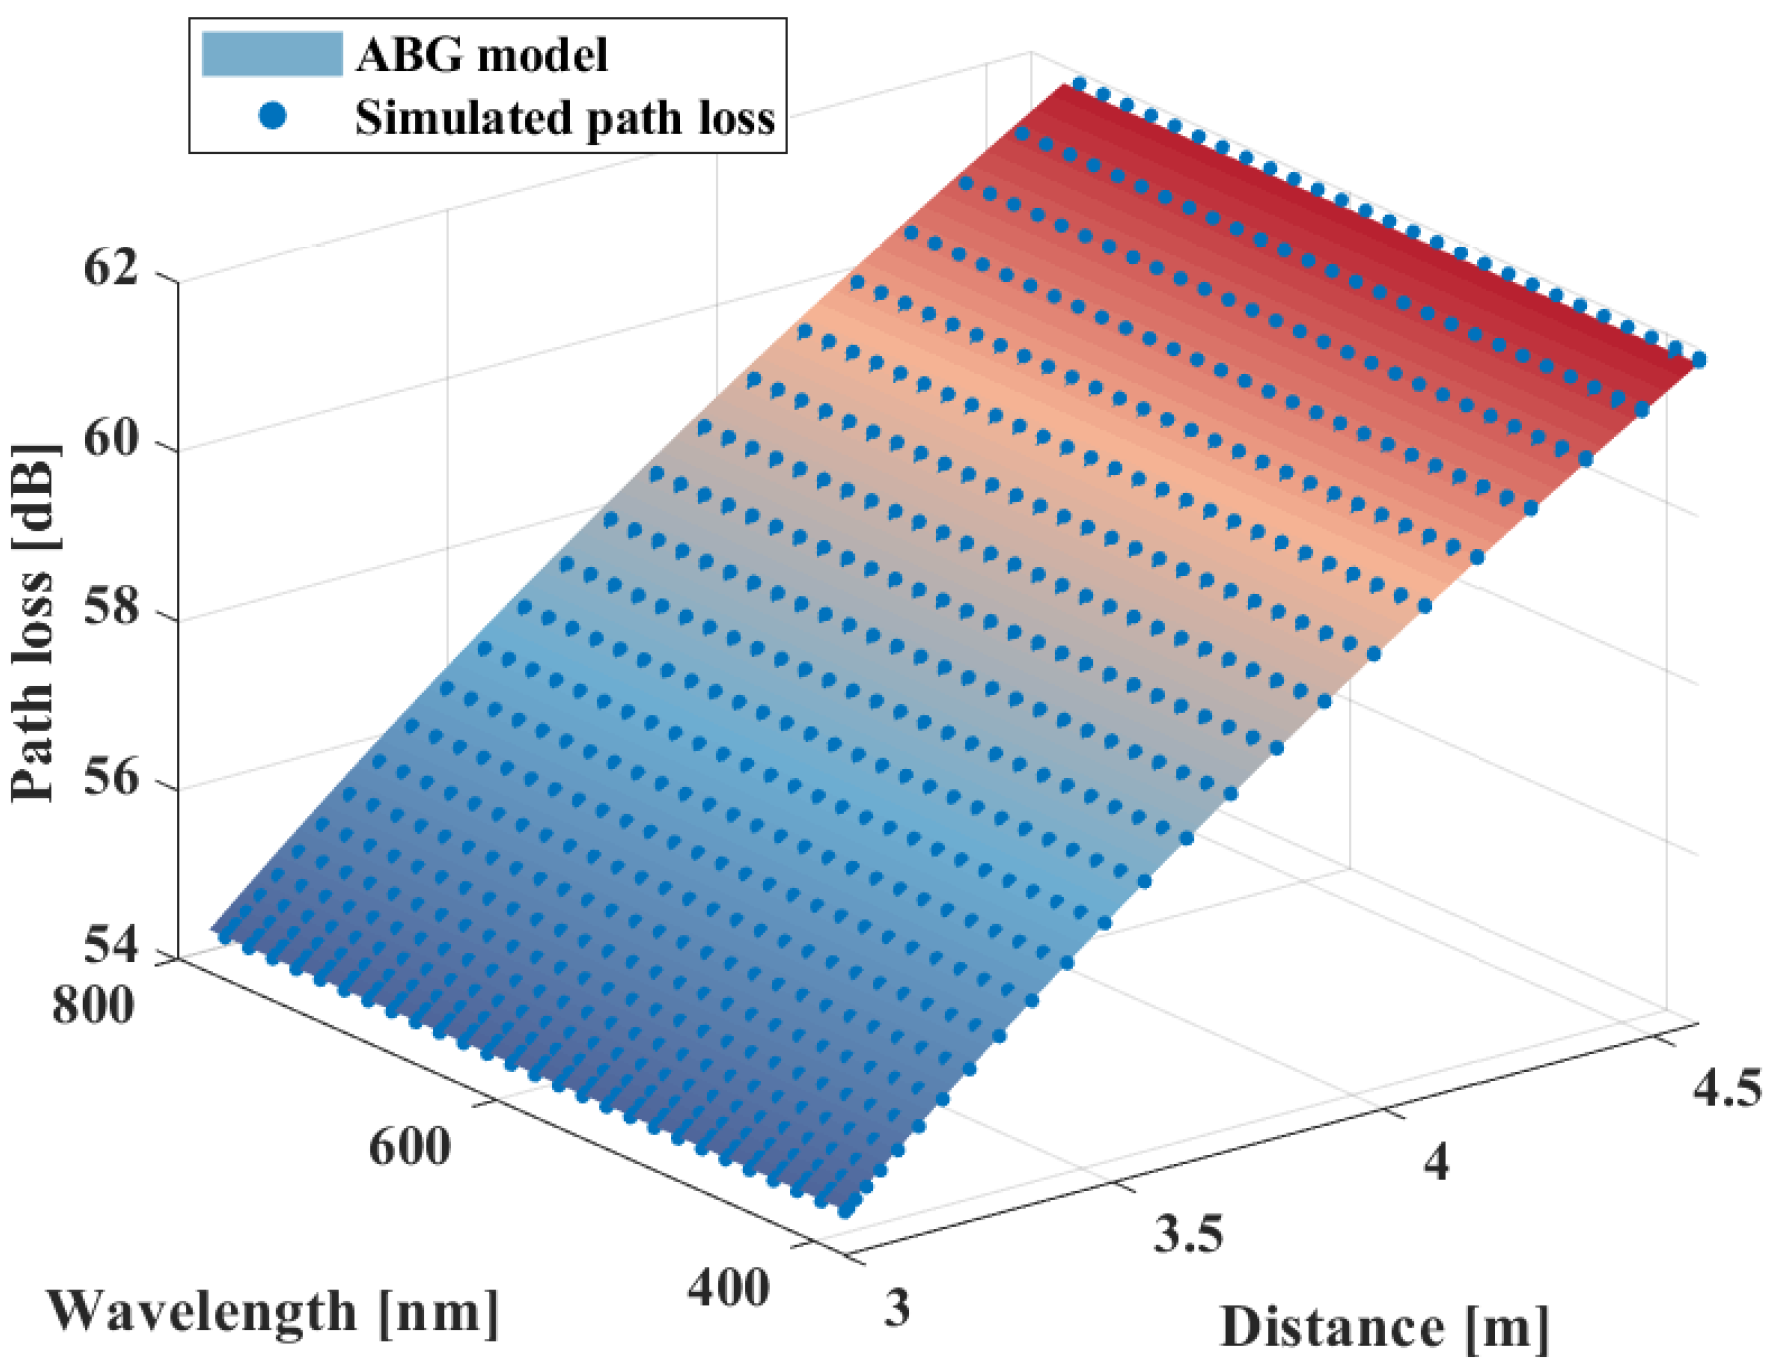
Figure 5.
LED layout for the 3-LED scenario.
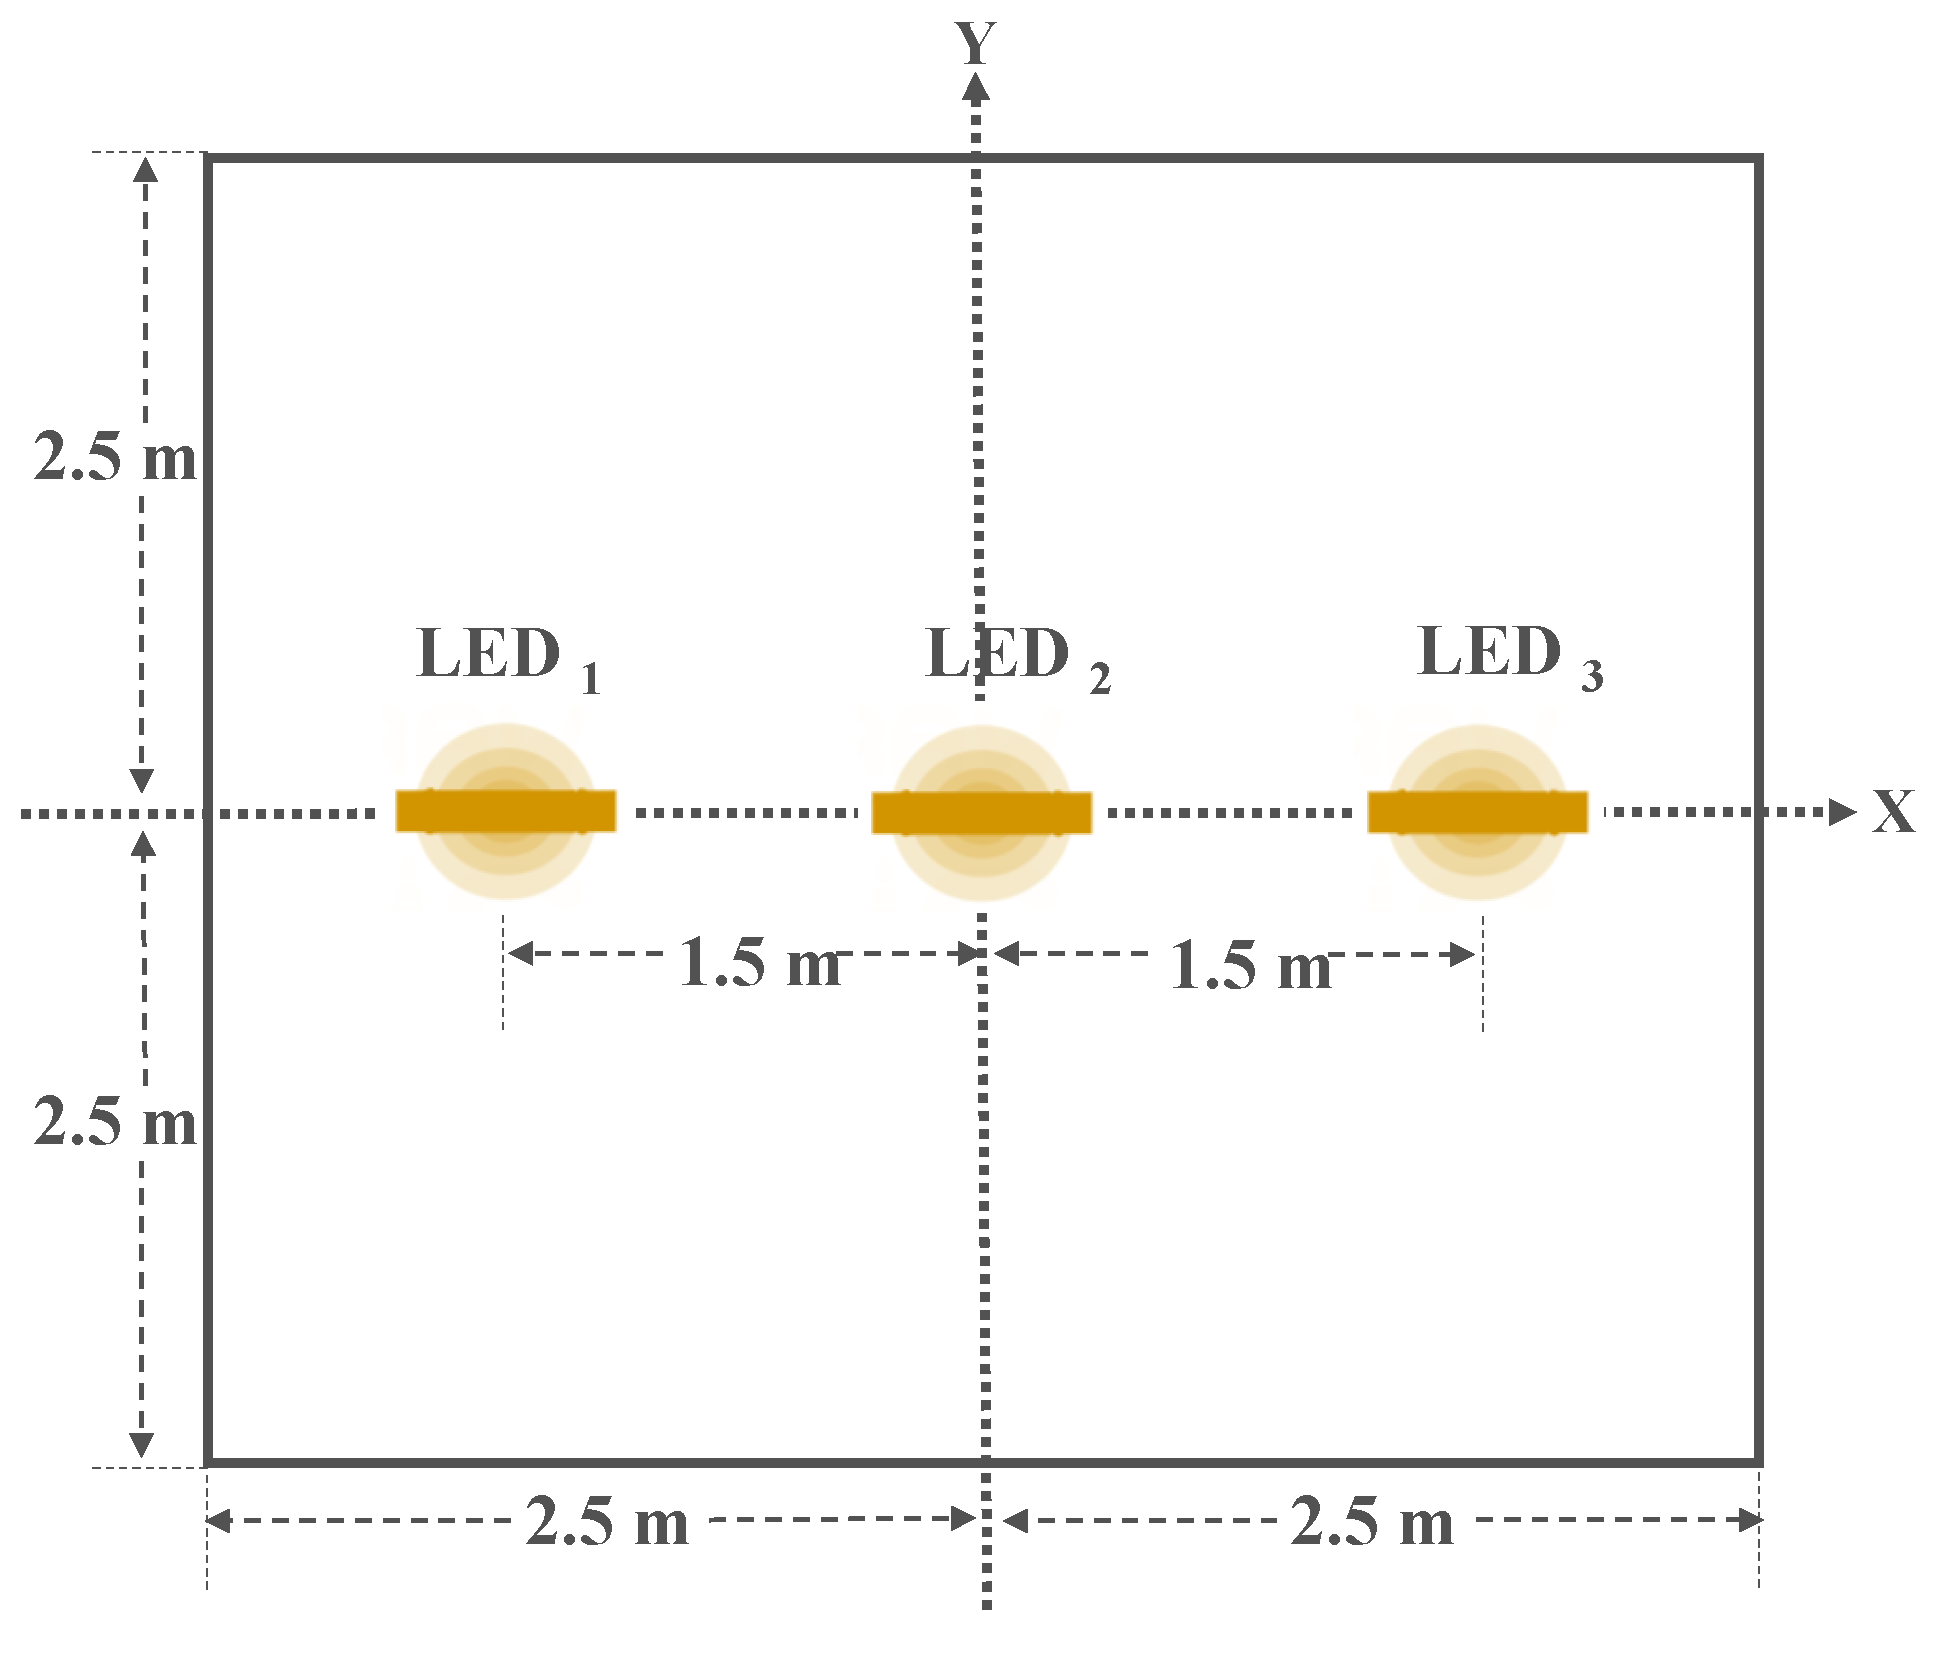
Figure 6.
Path loss for the 3-LED scenario with nm.
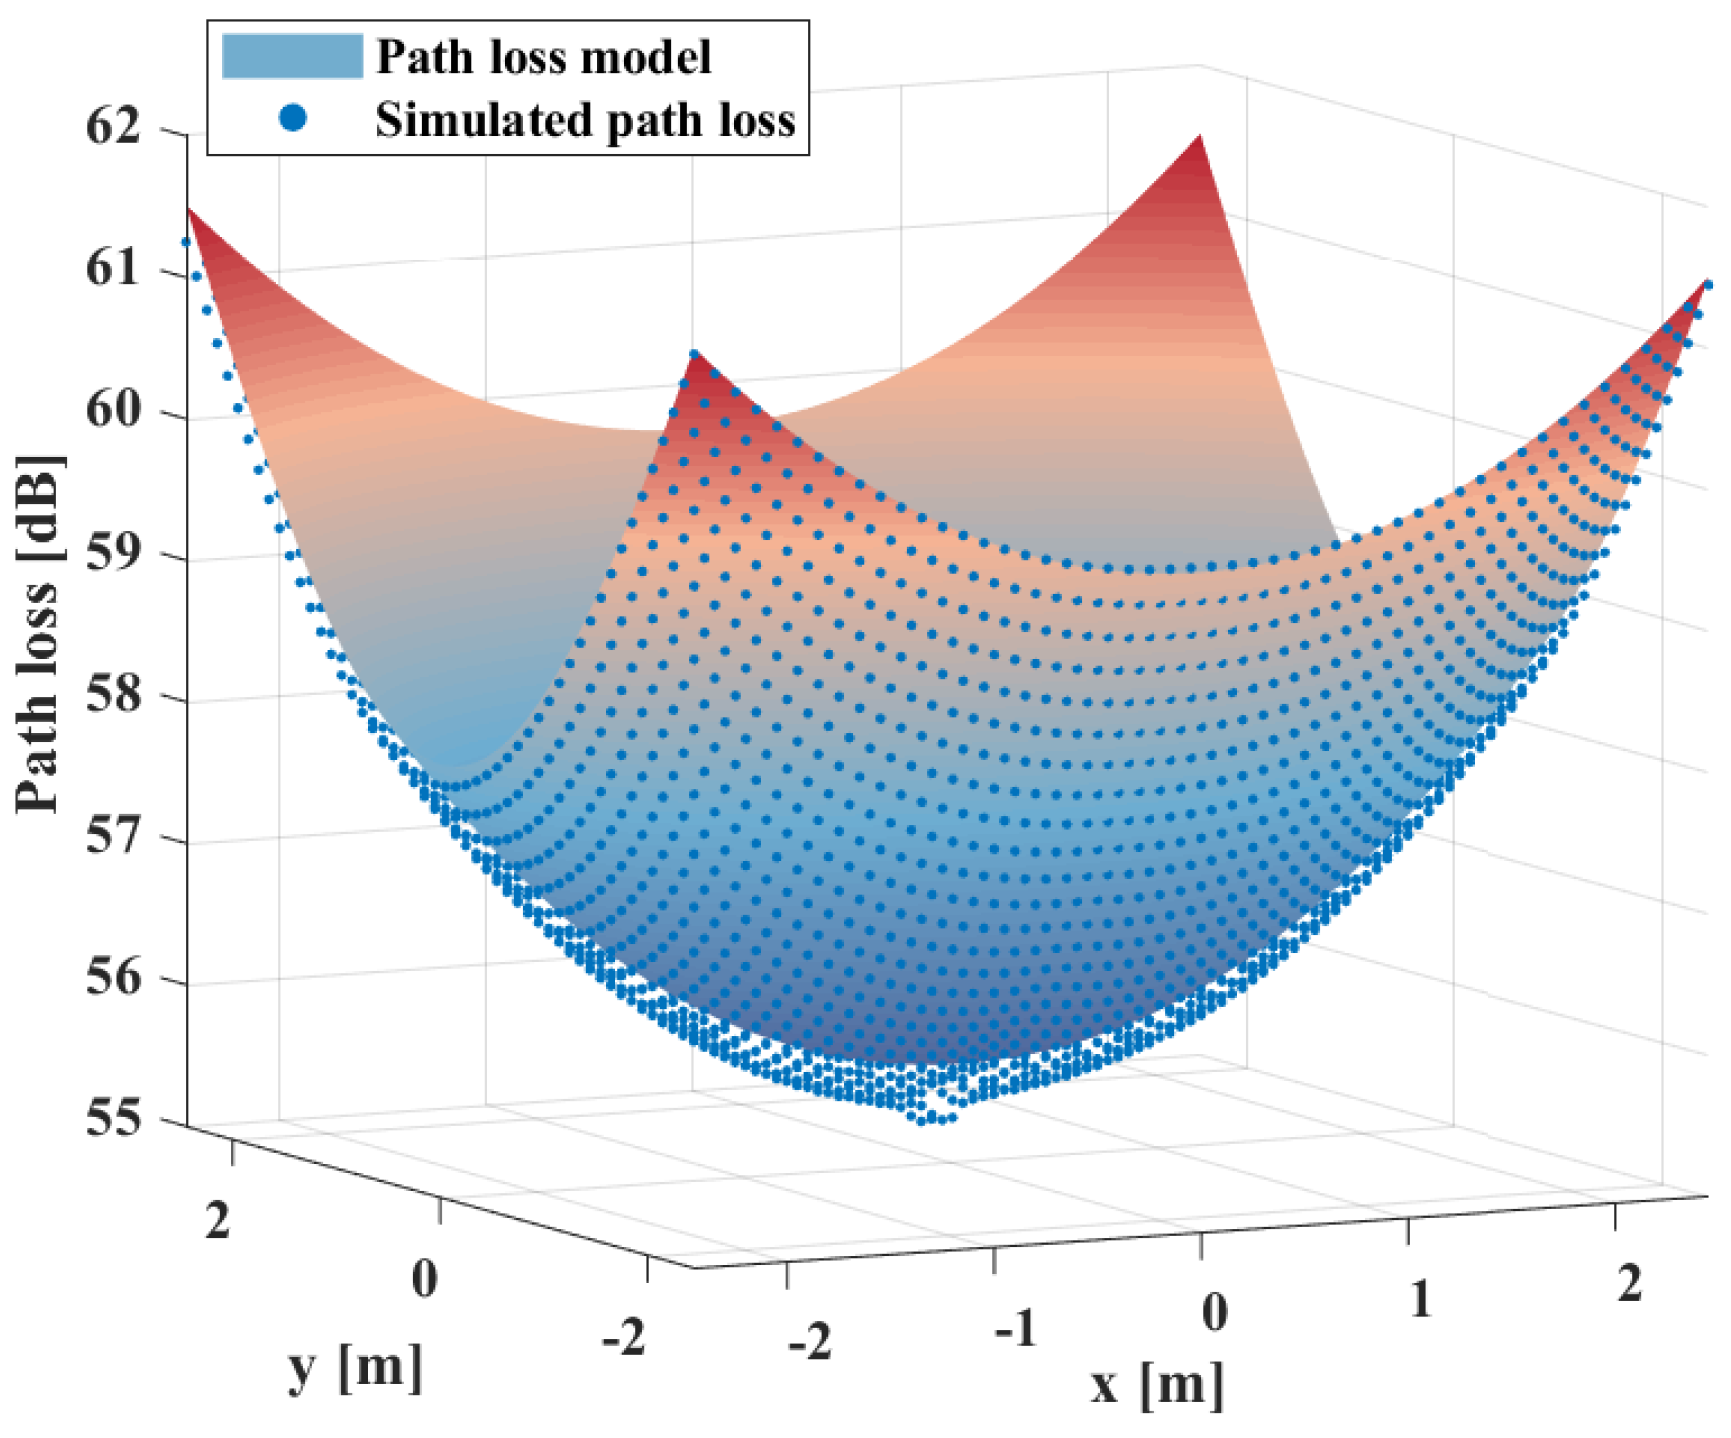
Figure 7.
3-D model of the oval human body shadowing.
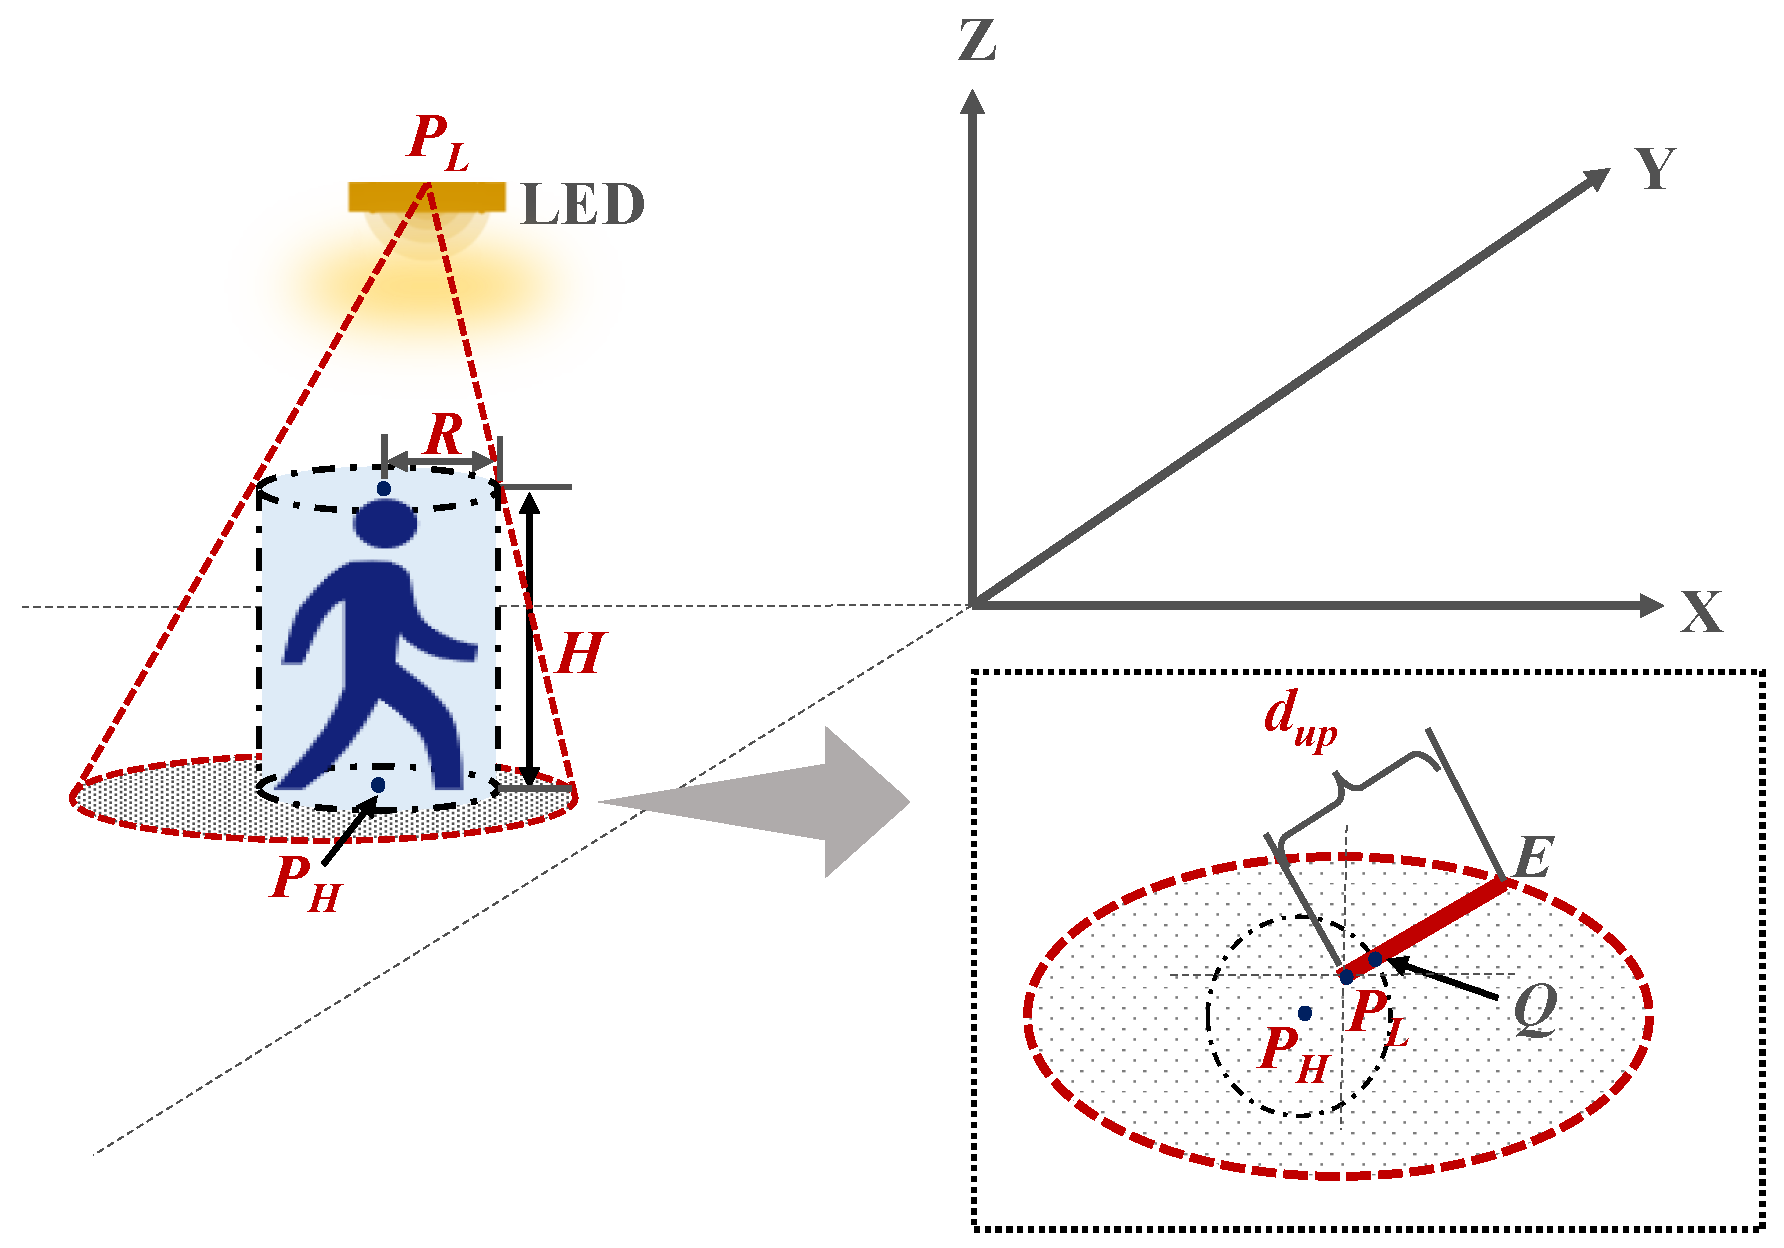
Figure 8.
3-D model of the fan human body shadowing.
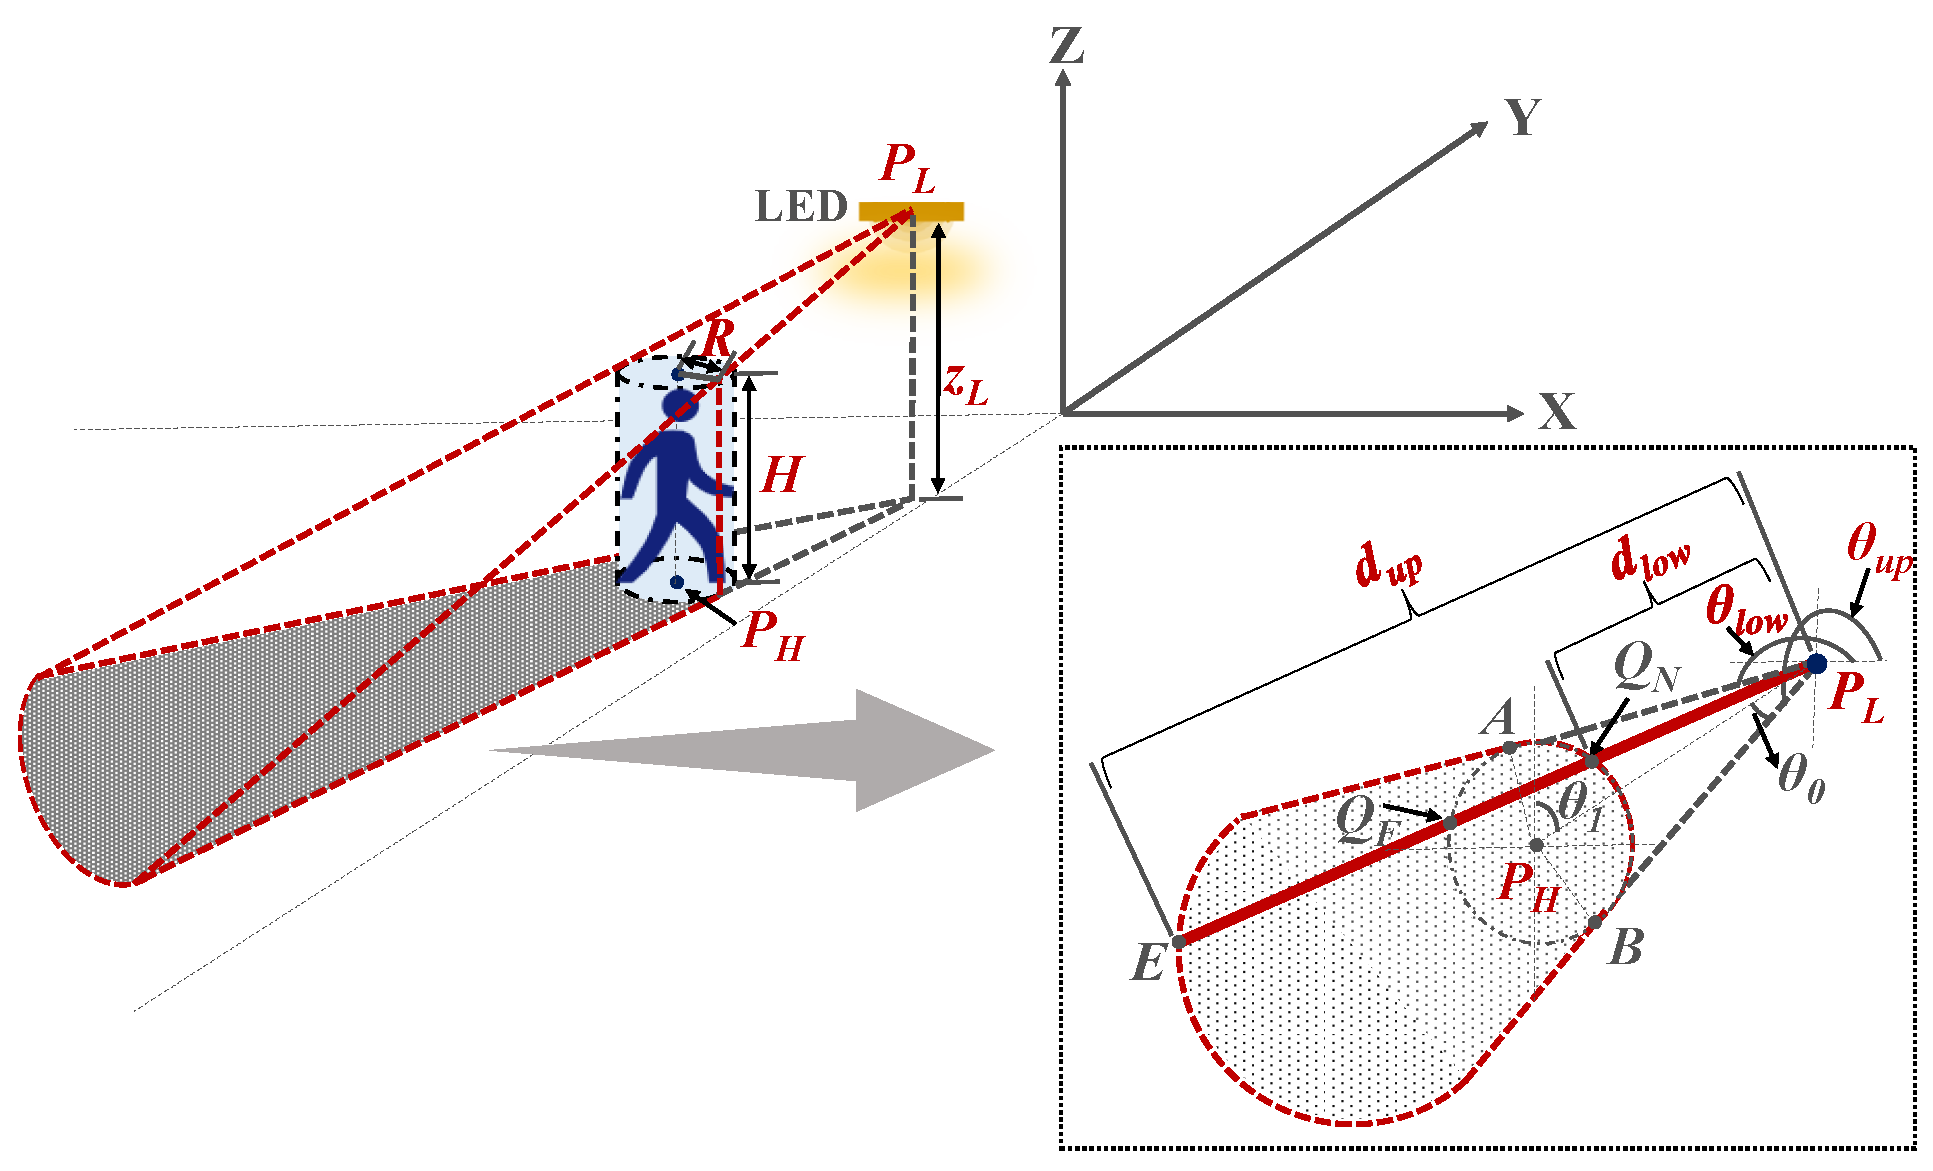
Figure 9.
Blockage probability for the single-LED scenario.
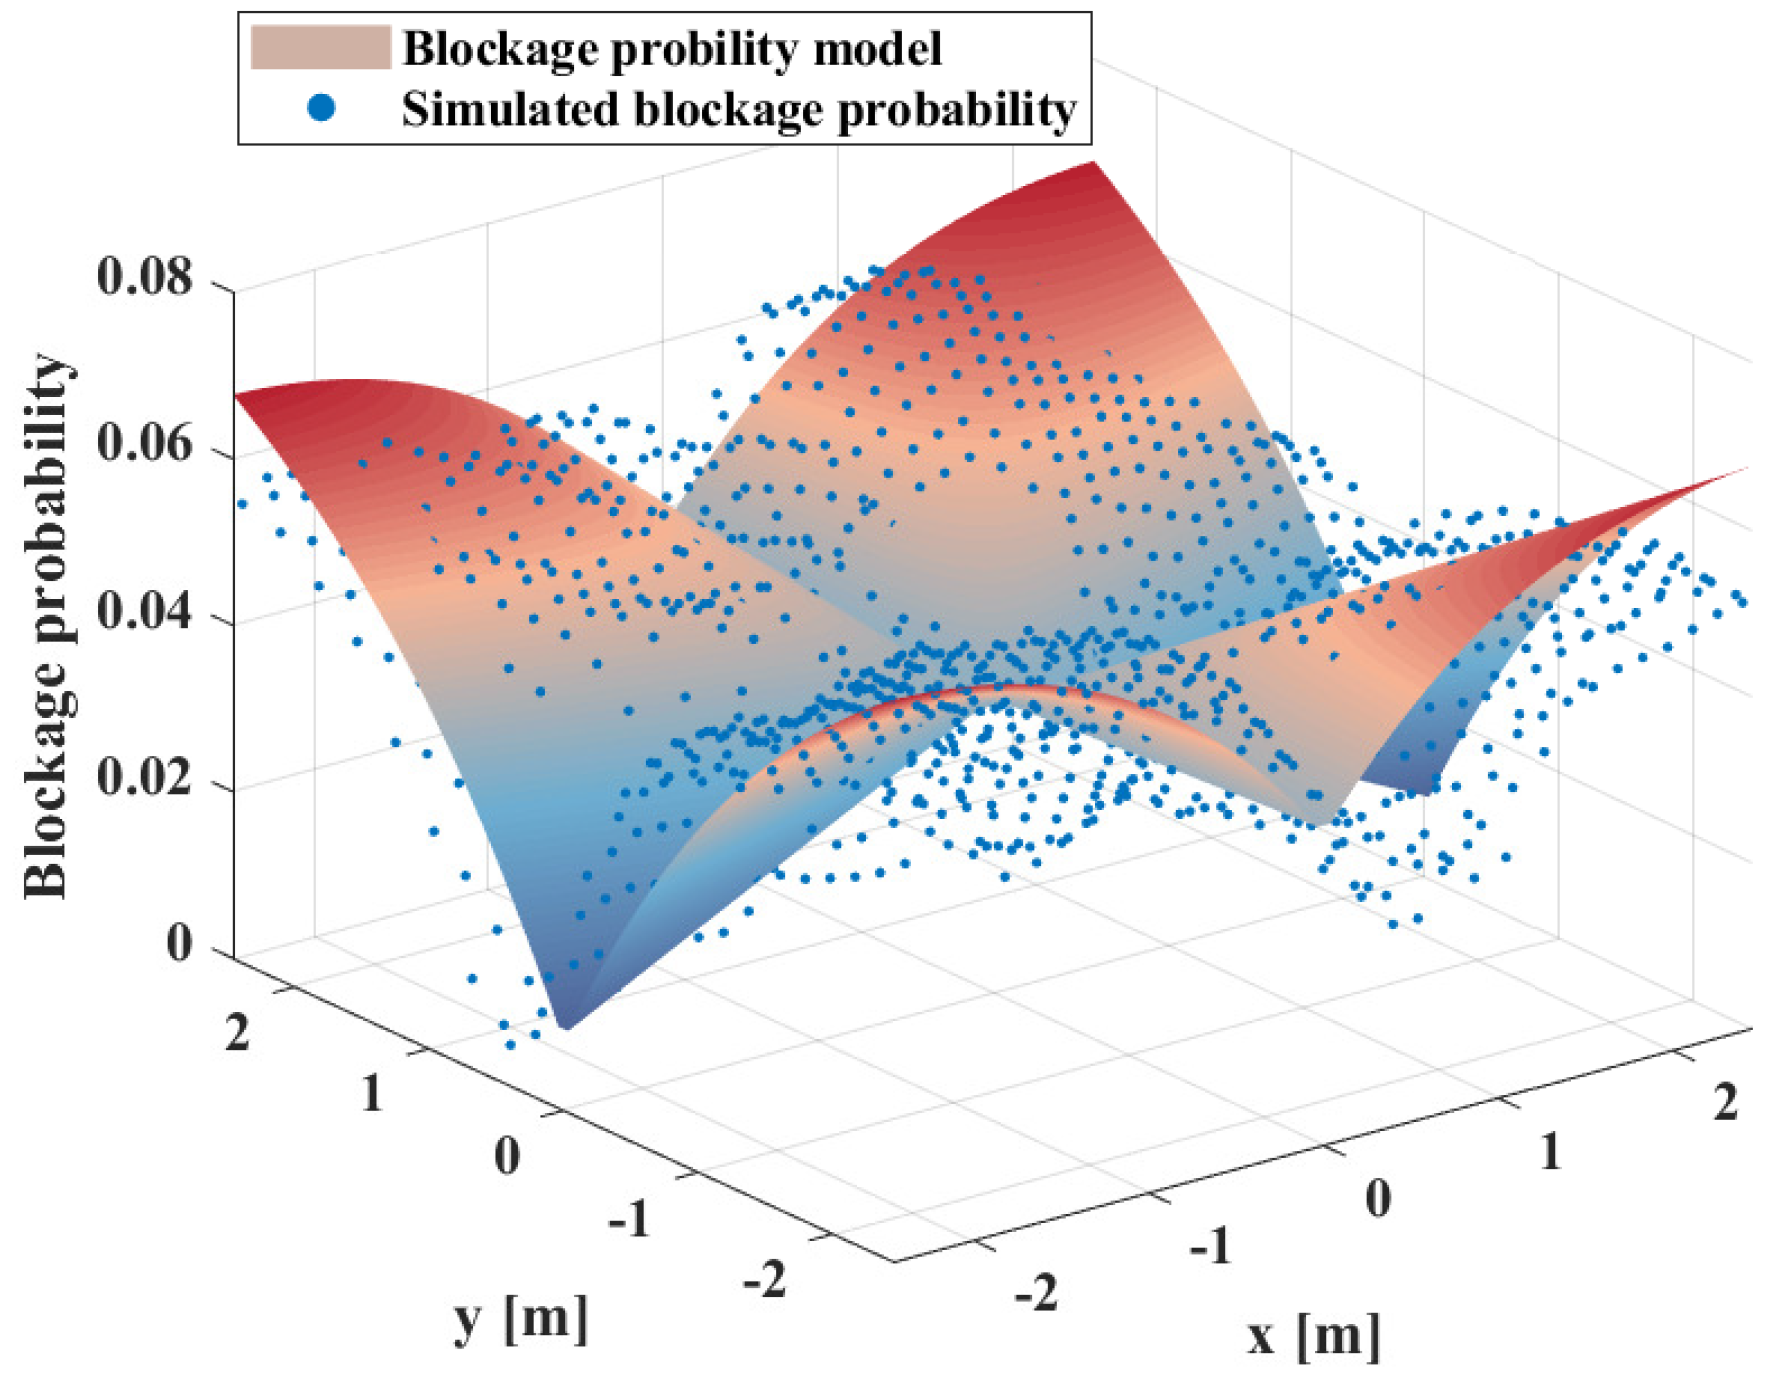
Figure 10.
Blockage probabilities in the 3-LED scenario.


Table 1.
The VLC system setup.
| Parameter | Value |
|---|---|
| Scenario size | 5 m × 5 m × 3 m |
| LED Power in the single-LED scenario | 1 W |
| LED Power in the 3-LED scenario | 0.33 W |
| Semi-angle at half power | |
| Mode number | 1 |
| Coating material | Plaster |
| Reflection coefficient | Wavelength-dependent |
| Length of reflecting elements | 0.1 m |
| Field of vision | |
| Physical area of PD | 1 |
| Transmission coefficient of the optical filter | 1 |
| Refractive index of len at PD | 1 |
Table 2.
The trajectory generation setup.
| Parameter | Value |
|---|---|
| Human height | 1.71 m [33] |
| Human weight | 0.30 m [34] |
| Number of generated steps | 20,000 |
| Time resolution | 1 s |
| The maximum speed | 2.1 m/s |
| The minimum speed | 1 m/s |
| The maximum sojourn time | 2 s |
| The minimum sojourn time | 1 s |
| Positive parameter | 0.5 [13] |
| Positive parameter | 1 [13] |
Table 3.
The calculation formula of and .
| Quadrant | ||
|---|---|---|
| 1 | ||
| 2 | 90 + | 90 + |
| 3 | ||
| 4 | 270 + | 270 + |
Disclaimer/Publisher’s Note: The statements, opinions and data contained in all publications are solely those of the individual author(s) and contributor(s) and not of MDPI and/or the editor(s). MDPI and/or the editor(s) disclaim responsibility for any injury to people or property resulting from any ideas, methods, instructions or products referred to in the content. |
© 2023 by the authors. Licensee MDPI, Basel, Switzerland. This article is an open access article distributed under the terms and conditions of the Creative Commons Attribution (CC BY) license (https://creativecommons.org/licenses/by/4.0/).
Share and Cite
MDPI and ACS Style
Yin, Y.; Tang, P.; Zhang, J.; Hu, Z.; Xia, L.; Liu, G. Multi-Wavelength Path Loss Model for Indoor VLC with Mobile Human Blockage. Electronics 2023, 12, 5036. https://doi.org/10.3390/electronics12245036
AMA Style
Yin Y, Tang P, Zhang J, Hu Z, Xia L, Liu G. Multi-Wavelength Path Loss Model for Indoor VLC with Mobile Human Blockage. Electronics. 2023; 12(24):5036. https://doi.org/10.3390/electronics12245036
Chicago/Turabian StyleYin, Yue, Pan Tang, Jianhua Zhang, Zheng Hu, Liang Xia, and Guangyi Liu. 2023. "Multi-Wavelength Path Loss Model for Indoor VLC with Mobile Human Blockage" Electronics 12, no. 24: 5036. https://doi.org/10.3390/electronics12245036
Note that from the first issue of 2016, this journal uses article numbers instead of page numbers. See further details here.