1. Introduction
In recent times, the role of emotions in the learning process has become a relevant topic in the scientific community. According to [
1], emotions stimulate students’ attention and trigger the learning process, affecting what is learned and retained. Numerous studies in a variety of disciplines, including neuroscience, education, and psychology, have revealed that emotions play an important role in learning. According to [
2], an emotion is a subjective state accompanied by reactions and physiological responses to some conditions, actions, and events to which an individual is exposed. Additionally, Ref. [
3] suggests that emotions are multifaceted phenomena and can be evoked by certain stimuli, such as events or experiences. In [
2], it is indicated that some researchers have considered emotions to be a significant factor directly or indirectly associated with a student’s achievement, satisfaction, motivation, and, consequently, academic performance.
In this order of ideas, as expressed by [
4], emotions, such as the commitment that a student exhibits, are essential for the success of any educational process, including language learning. In this way, according to [
5], the use of mobile applications in the area of second-language learning provides many activities in such a way that their learning barriers, tensions, and anxieties are greatly reduced, which results in a significant increase in students’ motivation, interest, and engagement. In this way, according to [
6], the detection and analysis of these emotions and behaviors allow the learning platform or experts to make decisions based on the information detected, such as reducing the difficulty of tasks when students are confused or making changes to the graphical interface to make it more exciting when students are bored. In relation to these mobile applications, according to [
7], at present, some of the most popular applications are Babbel, Busuu, Duolingo, and Memrise.
The above is fully aligned with the concept of learning analytics, which Ref. [
8] defines as the measurement, collection, analysis, and reporting of student data in an educational context. In this field, studies of the motivation for and emotions connected with learning often use innovative designs and evaluation methods, where the reports presented by the participants currently predominate [
9]. Furthermore, to date, there is a lack of validated measures for intensive longitudinal studies, and attempts to change that through open item repositories are just beginning to occur [
10]. Other aspects of emotions are evaluated through sensors, including heart rate variability or facial expressions [
11], and authors such as [
12] have argued that these sensor data can accompany rather than replace the information revealed by the self-reports. For example, in a study conducted by [
12], the extraction and visualization of the emotions of a group of students are presented for the detection of their commitment to online learning. The foregoing study, based on computer vision techniques, analyzes student videos.
Regarding the evaluation of emotions through sensors, it is important to mention brain–computer (BCI) interfaces, which, according to [
13], are devices that allow the capture of brain activity while participants are interacting with a scenario or controlling external devices based on mental patterns. For example, in a study conducted by [
14], a BCI device called Emotiv Insight was used for the purpose of capturing and evaluating emotions or performance metrics, such as engagement, interest, excitation, focus, stress, and relaxation, in tasks with haptic feedback. The result was that engagement and relaxation are emotions that could be useful to identify demanding situations. On the other hand, in [
15], an emotional characterization of students was performed from emotional metrics collected through an Emotiv Epoc in an augmented-reality environment. This emotional characterization was performed by applying clustering techniques, obtaining as a result that the groups presented good differentiation in the trends of different metrics.
However, as expressed by [
16], the direct and real-time inspections of emotional metrics in realistic environments has become a challenge. In this way, these authors present continuously annotated signals of emotion (CASE), a dataset that provides a solution focused on continuously annotated emotional data, capturing and annotating the emotions from the visualization of stimulating videos validated by the participants. However, at an educational level, the datasets that consolidate emotional values and present an annotation at the level of user interaction are limited.
This paper aims to present the construction and release of a public dataset for emotional analysis, consolidating metrics such as engagement, excitation, stress, relaxation, interest, and focus. These metrics are captured using Emotiv Insight during the interaction of a group of 19 participants with 4 Portuguese language learning lessons provided by the Babbel mobile application. This dataset presents an annotation of the type of activity that the participant was performing at each moment of time during their interaction, and the results obtained from the questions asked by the application during the development of their activities. Furthermore, based on the generated dataset, a preliminary visualization approach is performed. The main objective of this dataset is to promote emotional analysis in learning environments; to broaden its applicability in areas such as machine learning, deep learning, the recommendation of activities, and the resources obtained from emotional variables; to group similar behaviors among the various interactions and emotions observed; and, finally, to adapt and individualize the learning of students based on the emotions they experienced and the quantitative results that we obtained.
The organization of the paper is as follows:
Section 2 presents some related works;
Section 3 is the materials and methods section, presenting the data collection, processing, and annotation and a summary of the results, in addition to the preliminary visualization approach;
Section 4 provides the results and their respective analyses; and, finally,
Section 5 presents the conclusions and future work.
2. Related Works
According to [
17], there is no doubt that emotions influence our behavior and learning outcomes. When we are in a good mood, we learn more successfully. For this reason, research on emotions and learning has become a popular topic. There are some studies that explore the impact of emotions on learning performance: for example, in [
18], a review of 186 studies examining emotions in technology-based learning environments (TBLEs) published between 1965 and 2018 was conducted. As a result, the hypothesis that positive emotions have an impact on the learning process is supported. In [
19], the authors compared models of self-regulated learning (SRL), including aspects of cognitive, motivational, behavioral, and emotional-affective learning. The authors concluded that, by involving these aspects, students can be taught to be more strategic and successful.
As expressed by [
20], in a school learning environment, the teacher has a face-to-face relationship with the student and can present an appropriate reaction according to the action or perspective of the student. However, in an online educational system, the structure of the learning domain and the content are usually presented in a static way, without considering the emotions of the learners and without interactivity and feedback from the instructor. However, considering feelings and emotions improves the quality of learning. To deal with this situation, various methods for emotion recognition have been proposed over time, such as asking the user, monitoring implicit parameters, and using voice recognition, facial-expression recognition, vital signs, gesture recognition, and hybrid methods.
According to [
21], emotions play a vital role both in learning in general and in foreign-language (FL) learning in particular. Positive emotions, such as enjoyment, hope, and pride, can promote students’ motivation to learn, and improve their attention, use of deep-learning strategies, and academic performance. As part of FL learning, to date, there are various platforms and mobile applications for learning foreign languages. One of them is Babbel (
www.babbel.com, accessed on 19 April 2022), which directly focuses on building conversational and speaking skills [
22]. According to [
22], Babbel’s lessons are more challenging than many other programs, and the platform features a unique and powerful speech-recognition system. It presents the possibility of learning 14 languages, including English, Spanish, German, French, and Portuguese. Another app is Duolingo (
www.duolingo.com, accessed on 19 April 2022), which is an online language-learning platform that was launched in 2012 and offers courses in 27 different languages [
23]. Similarly, there is the Busuu application (
www.busuu.com, accessed on 19 April 2022) whose premise is that users acquire linguistic skills, such as speaking, reading, writing, and listening, based on vocabulary and grammar components [
24]. Another language learning application is Memrise (
www.memrise.com, accessed on 19 April 2022), which specializes in vocabulary learning with an algorithmic revision system [
25].
In the fields of learning analytics, emotions, and second-language learning, study [
26] was presented, where the authors presented EMODASH, which is an interactive dashboard that supports the retrospective awareness of tutors concerning the emotions of students in a videoconferencing learning environment. Using this, the tutors, who were already sensitive to students’ emotions, incorporated more affective elements into their reports, suggesting a greater awareness of students’ emotions. The authors of [
27] presented a comparison of several sentiment-analysis classification models based on the opinions provided in an intelligent learning environment. The best model obtained was EvoMSA, with an accuracy of 93%. On the other hand, the authors of [
28] developed a text classification model to automatically detect emotional and cognitive engagement from students’ text interactions with massive open online courses (MOOCs); in this study, it was concluded that the dominant role of emotional engagement was cognitive engagement, which can provide suggestions for improving student performance.
As previously mentioned, one of the ways to capture and analyze emotions in learning environments is through vital signs or signals emitted by the human body. For this purpose, there are brain–computer interfaces that are communication systems in which the signals, messages, or commands produced by brain activity can be translated to external devices [
29]. The use of BCIs in the area of emotions and learning can be observed in a study conducted by [
30], where time-series techniques were applied for the evaluation of emotions obtained from the interaction with an immersive environment, capturing these emotions through a BCI called Emotiv Epoc. The results of this study show an average increasing trend of 60% among the group of participants, representing their interest, engagement, focus, relaxation, and stress when interacting with the immersive environment. In [
31], the authors presented an analysis of power spectral density (PSD) measured using a BCI device in an educational context through an online course platform. The participants solved two tasks: the first consisted of solving a set of matrix products, while the second involved solving mathematical logic problems. The authors showed that the theta and alpha bands decreased with the increasing difficulty level of the cognitive task.
At present, there are several datasets that focus on emotion recognition, for example, AffecNet [
32], for emotion detection from facial expressions, and ascertain [
33], which is a multimodal dataset composed of electroencephalograms (EEGs), electrocardiograms (ECGs), and galvanic skin response (GSR) and facial activity data. There is also EMOTIC [
34], which consists of a set of images of people in real environments labeled with their apparent emotions. Other datasets are presented in [
35], where data mining is applied to analyze the emotions obtained from a collection of 1.1 million posts from an online platform.
Based on the above, this study aimed to introduce EDaLI (Emotional Data L2 Interaction), a dataset used for emotional analysis based on metrics such as engagement, excitation, stress, relaxation, interest, and focus. These metrics were captured through Emotiv Insight during the interaction of a group of participants with four Portuguese language learning lessons. These lessons were provided by the Babbel mobile application. The dataset presented the annotation of the type of activity that the participant was conducting at each instant of time during their interaction along with the results obtained.
3. Materials and Methods
This section presents a step-by-step description of the study divided into the following sections. First,
Section 3.1 presents the procedure that was followed to capture the emotional metrics during interactions with Babbel’s Portuguese lessons.
Section 3.2 describes the processing performed on the data to create a general structure generating time series.
Section 3.3 explains the activity annotation process for the dataset.
Section 3.4 presents the process of consolidating the results obtained for the questions asked via the platform and the total interaction time. Subsequently,
Section 3.5 presents the general structure of the constructed dataset. Finally,
Section 3.6 details a preliminary visualization approach proposed to make use of the generated dataset.
3.1. Data Collection
Data collection was conducted through different components. These components included to a second-language learning mobile platform. In this case, this was the Babbel application, designed for the purpose of learning a foreign language, such as Portuguese. Another component was the BCI that was used to capture emotional metrics during people’s interactions with the second-language learning application. In this instance, Emotiv Insight [
36] was used. The emotional metrics that the BCI allowed us to capture were interest, excitation, focus, relaxation, stress, and engagement.
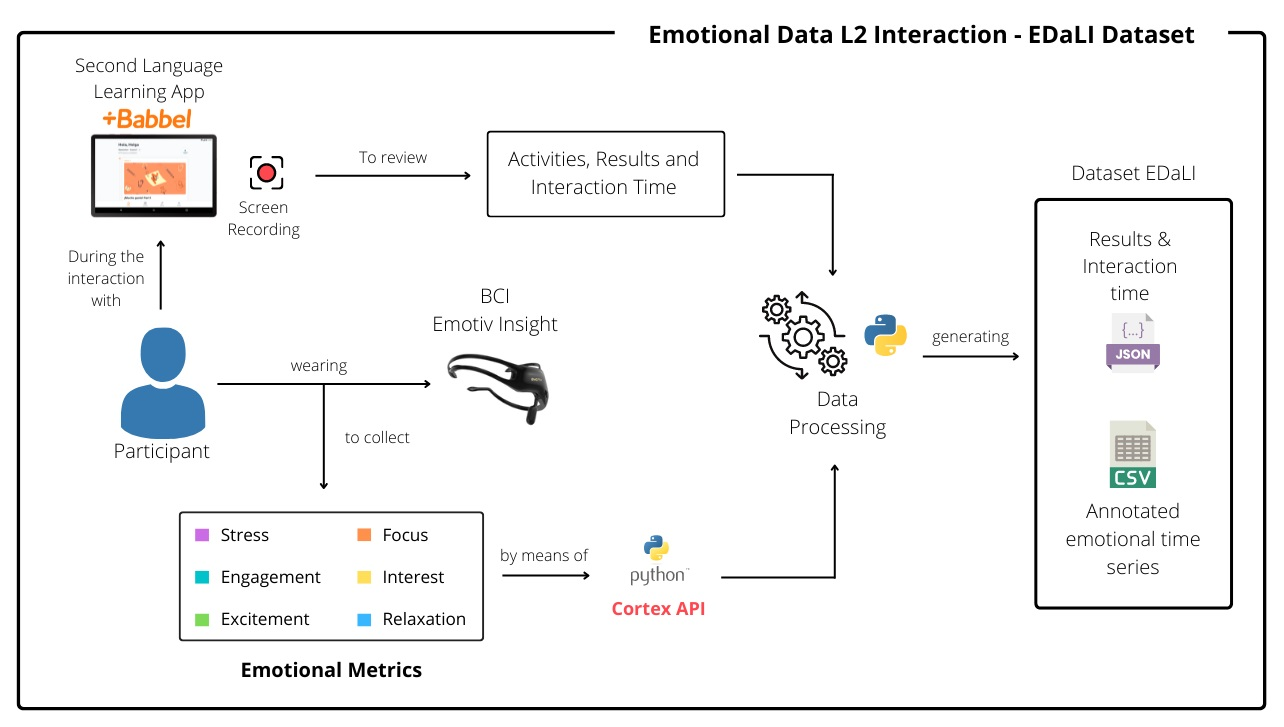
Figure 1 presents the data collection process in a general way.
From
Figure 1, the general procedure for data capture can be observed. Initially, the Babbel second-language learning application was installed on a mobile device, in this case a tablet with basic software and hardware features. Moreover, tablet had an application that recorded the screen during the participant’s interaction with the Babbel application. This allowed the recording of each of the participant’s interactions with and the instructions they received from the platform. Additionally, it allowed the identification of the type of activity the participants were engaged in at each moment of the interaction time and the results obtained. The language of learning selected was Portuguese, since none of the participants who participated in the data collection had previous knowledge of this language. All of the participants were native speakers of Spanish, and, according to [
37], having knowledge of Spanish makes learning a new language, such as Portuguese, easier. The selection of this language had the purpose of not creating biased results concerning the emotions experienced. If the chosen language was English, some of the participants would probably have had prior knowledge, which could modify their perceptions, contrary to the experience of a completely new language. According to this, it was possible to maintain a high level of homogeneity in the group of participants.
During the participant’s interactions with the platform, they wore an Emotiv Insight device on their heads. This device is a brain–computer interface (BCI) that is non-invasive, and, through its sensors or electrodes, allows the recording of brain activity for the detection of various mental actions [
14]. In this way, the Emotiv Insight device provided, in addition to the brain signals directly measured from the sensors, six measures of mental performance estimated from brain activity, which were stress, focus, engagement, excitement, interest, and relaxation [
38]. The use of the Python programming language was necessary to make the connection between the Emotiv Insight device and a computer to obtain and store, every 10 s, the values of the emotional metrics in a range of 0 to 1, where 1 indicated greater exposure to that emotion and 0 less exposure. The connection process between Python and Emotiv Insight was made through an application programming interface (API) [
39], which was created by the company that created this device.
The following sections explore Emotiv Insight and the Babbel platform as the components used for data collection.
3.1.1. Emotiv Insight for Data Collection
The Emotiv Insight headset is a low-cost brain–computer interface device, designed for capturing day-to-day brain activity. It contains five electrodes for the acquisition of brain activity, presenting a sampling frequency of 128 Hz. These sensors are made of hydrophilic semi-dry-polymer material, which is easy and comfortable for the participant to use [
40]. This device can be connected to a computer by a controller or Bluetooth.
The company that created this device developed and presented to the public Emotiv Cortex, which is the centerpiece of Emotiv technology, since it brings the BCI to the consumer. Essentially, it is an API that is based on JSON and WebSockets, which makes it easy to access from a variety of programming languages, including Python. Thus, anyone with programming knowledge can develop an application that directly interacts with an Emotiv device and its data. Data such as movement signals, mental commands, facial expressions, frequency bands, sensor contact quality, battery level, and performance metrics (emotions) are obtained. The latter can be obtained through Emotiv Cortex and an Emotiv Insight device at a low resolution of 0.1 Hz, which indicates the obtaining of data every 10 s. Additionally, through paid subscriptions, EEG data and performance metrics can be captured at a frequency of 2 Hz, that is, every 0.5 s.
To capture the emotional metrics, it was necessary to implement a script in the Python programming language. This script automatically authenticates itself in API Cortex, checks the connection status and contact quality of the Emotiv Insight, and streams the emotional metrics at a 0.1 Hz resolution. Additionally, the script was responsible for obtaining these data and storing them in a type of structure that could be loaded and processed following data capture. This data structure was an N-dimensional array created using Numpy [
41] and stored using the Pickle library. The data consolidated every 10 s presented two key fields: the values of the emotional metrics and the timestamp associated with those values.
Figure 2 presents an example of the stored-data structure.
3.1.2. Babbel Platform for Data Collection
To select a base platform or application for learning a second language, such as Portuguese, applications, such as Duolingo, Babbel, Memrise, Busuu, among others, were explored. Babbel is the most financially successful language learning app in the world, with more than 10 million subscriptions sold since its launch in 2008 and millions of active, paying subscribers worldwide [
42]. This platform was selected with the support of an expert in second-language teaching. Moreover, characteristics such as the diversity of exercises, the availability of listening practice, the association of terms, the pronunciation of words, the learning structure, and the duration of the activities, were taken into account, and these were presented in study [
43]. Furthermore, the activities presented in the lessons were not so quickly resolved and generated the possibility of at least a complete cycle of 10 s, which was in line with the fact that, according to Cortex API, data collection was performed every 10 s.
Additionally, with the help of the expert, it was decided to use the first 4 lessons of course number 1, called “the first steps,” from the Babbel platform for Portuguese. During the first three lessons, the new language was introduced with explanations and initial activities, and, in the fourth lesson, there were review activities for the new concepts acquired in the previous lessons.
Going deeper into these selected lessons, lesson 1 had the purpose of acquiring certain concepts such as greetings and giving thanks. Lesson 2 presented explanations and activities related to singular personal pronouns. Lesson 3 dealt with goodbyes and concepts referring to the first lesson. Finally, Lesson 4 presented a review, where only activities that could be performed using the previously acquired concepts were employed.
Figure 3 illustrates the topic explanation for lesson 1, where participants needs to select a vowel “a” or “o” according to the sentences.
During the review of these lessons, it was determined to group and classify the activities involved.
Table 1 presents the activities.
Figure 4 gives an example of vocabulary learning by presenting the greeting term “hello” in both Spanish and Portuguese, as well as its respective pronunciations. This is presented in lesson 1 of the first-steps course.
In this way, it was necessary to generate a classification into sub-activities for the option-selection activity, considering that this exercise could be presented in different ways, such as translation, listening, or pronunciation exercises, among others.
Table 2 presents the sub-activities set for the option-selection activity.
Figure 5 presents an example for the option-selection (OP) activity and the listen and complete (LIS) sub-activity. This is presented in lesson 2.
This process of classifying and grouping activities and sub-activities was useful during the annotation of the collected data. The annotations specify in which activity and sub-activity the participants were engaged at each moment of time. Annotation was carried out following the processing of the collected data.
3.2. Data Processing
Once the data structure of the metrics associated with the participants’ interactions with the four lessons in Portuguese was stored, the data were processed. This processing step consisted of obtaining each of the structures and separating the ‘timestamp’ and ‘data’ fields. Initially, the date was extracted from the timestamp. Subsequently, the newly generated date field and the values of the metrics associated with that date were obtained. Once this date field was created, the timestamp column was deleted. Then, the user-identifier and lesson-number fields were added. A DataFrame-type data structure was generated using the Pandas library. However, at this point, data were still being presented every 10 s. Therefore, to generate a dataset that had a specificity of 1 s, the linear interpolation technique was applied to the data. We attempted to mitigate the lack of a high-resolution, paid Emotiv license that would have allowed these samples to be obtained every second. In addition, the kinds of activities undertaken by the participants had a relatively short duration. Therefore, the least degree of specification was required in the factor of the data obtained. In this way, the spectrum of the algorithms and studies that could be implemented was broadened, since increased data were available.
After applying the interpolation, a DataFrame was obtained, which was basically a data structure consisting of rows and columns. This dataframe was obtained for each participant for each lesson and contained the user identifier; lesson; date, associated with its respective hour, minute, and second; and the values of the engagement, excitement, stress, relaxation, interest, and engagement metrics, presenting the data second by second thanks to the interpolation produced. However, the processed dataset overlooked an important factor in the present study: data annotation. This factor is related to the activity and sub-activity of the participant at each instant of time. The following section explores the annotation process.
3.3. Data Annotation
The purpose of this stage was to annotate the activity and sub-activity in which each participant was involved at each instant
t of time during their interaction with the application, once the corresponding module was started. To conduct the steps mentioned above, several activities were required, such as a review of the recordings, the verification of the range of the timestamps of the data associated with the emotional metrics, the generation of a file for the specification of time ranges in each activity, and, finally, data modification without annotation. It is important to mention that, once the participants carried out the activities according to the lessons provided by Babel, the emotional state of each one of them was captured through Emotiv Insight. In those activities that presented some significant change, a video review was carried out with the purpose of corroborating the states that Emotiv Insight captured. Based on this, the recordings of the participants’ interactions with the four Babbel modules were reviewed second by second. Out of that, the amount of time in seconds of the general interaction of the entire module was determined. For the activity and sub-activity of each module, the start and end timestamps were specified, obtaining the seconds of difference, to identify which activity the participant was performing at each instant of time. Once this was performed, the data were consolidated into a file with a JSON extension. Subsequently, using the scripts generated in Python, this file was read, and the previously processed data were modified.
Figure 6 presents the annotation results.
At this point, the data were presented as a set of time series, where, for each instant of time, its respective value of engagement, excitement, stress, relaxation, interest, and engagement was mapped. Additionally, the data structure indicated in which main activity and sub-activity the participant was engaged. Moreover, the interaction with the Babbel application and the selected levels of Portuguese made it possible to determine the number of questions asked per module, the number of questions answered correctly, and the number of incorrect answers and failed attempts. For this reason, the following section presents the process of collecting these data.
3.4. Question Results and Time
As previously mentioned, the application allowed us to obtain the total number of questions asked and the number that were answered correctly at the end of each module. However, it did not allow us to determine this for each activity and sub-activity. For this reason, the captured videos were manually reviewed a second time, during which the interaction of the participants with Babbel was evidenced. Based on this review, the total number of questions and the number of correctly answered questions, incorrectly answered questions, and erroneous attempts were determined.
Table 3 presents these concepts.
From the review of the recordings, a file with a CSV extension was defined. This file contained the sequence of the activities, that is, the order in which they occurred, and the activity that was made up of the activity and sub-activity, concatenated by means of the “-” symbol, and the total number of questions asked, correctly answered questions, incorrectly answered questions, and failed attempts. Once this was performed, with the help of a script coded in Python, a JSON file was generated from the CSV file. The JSON file consolidated the results of the questions for each activity–sub-activity and the total number of seconds that the participant used during each event or activity. In this way, for each participant, the results obtained during their interaction and time were summarized.
Figure 7 presents an example of the file with the generated JSON extension.
3.5. Dataset Emotional Data L2 Interaction—EDaLI
During the data collection for the creation of the Emotional Data L2 Interaction (EdaLI) dataset, a total of 19 people participated. However, for ethical reasons, the personal information of the participants was protected. In general, in this population, there was a total of 4 women and 15 men located in an age range between 20 and 30 years, with a Colombian nationality and Spanish as their native language. The environment of tests was controlled, in a room with good conditions of attentions, without noise and distractions. All of the participants either claimed to be in good health, both physically and psychologically, or said that they were in a situation of emotional instability due to situations external to the test. None of the participants had prior knowledge of the Portuguese language, this being their first experience of that language.
Once the emotional data collection, preprocessing, annotation of activities, results, and time were successfully consolidated, the EDaLI dataset was published and made available to the public via GitHub (
https://github.com/AndresRestrepoRodriguez/Emotional_Dataset_Second_Language_Interaction_EDaLI (accessed on 10 December 2022).) In the repository structure previously mentioned, each participant owned a folder containing a list of each of the lessons, which were also in folders. Within each lesson, there were two files.
Table 4 presents the descriptions of these files.
3.6. Preliminary Visualization Approach
The generated dataset EDaLI had as its main component a set of time series that represented the values of the emotional metrics collected at each instant of time, during a finite period. This period was delimited by the interaction of a participant with the different selected Portuguese lessons. EDaLI presents a summary of the time and results at a general level with a discrimination of activity and sub-activity. According to [
44], the visual analytics produced for time series have received a considerable amount of attention in recent years. For this reason, as an initial step in the use of the EDaLI dataset, a preliminary visualization approach was proposed.
The authors of [
44] performed a literature review of the most important publications in the field of clustering techniques and classifications of time series in visualization analytics. Based on this, and on the visualization techniques that were presented by the authors in their study, our visualization approaches are mainly composed of summary tables, bar charts, histograms, line charts, and pie charts.
The approach to and presentation of the results present the distributions of the emotional metrics of the group for each lesson. In addition, it was possible to view the results obtained by the group in each lesson. Subsequently, lesson 4 was used as a reference, since it was the lesson in which the participants continuously practiced the knowledge and concepts they acquired in previous lessons. In this way, it presented, in a general way, a visualization of the emotional metrics, interaction times, and results for each type of activity that occurred during lesson 4. Considering the above factors, an initial approach to the analysis of EDaLI at the group level was presented. Then, to perform an analysis at the individual level, participant 4 was randomly selected, as well as lesson 4, as described above.
As previously stated, to present the results at the group and individual levels, line graphs, histograms, summary tables, bar graphs, and circular graphs were used. The line graphs were used to visualize the sequential behavior of the emotional metrics collected throughout the interaction. The histograms were able to identify where the accumulation of the values for each metric was discovered, isolating the temporal factor. Finally, through the summary tables, bar charts, and circular graphs, the total interaction times and results obtained at the question level were presented.
The decision to limit the presentation of the results to only one lesson and one individual participant was made based on the high number of visualizations that could be generated. With the graphs mentioned above, approximately 15 visualizations would be generated for each participant, which, when multiplied by the 19 participants, would result in more than 250 visualizations. This number of visualizations would obstruct the presentation of the results, given that this approach is just a first approximation of the visualization application.
The following section presents the graphs obtained from EDaLI and the preliminary approach to the visualization techniques used, with the analysis of the results obtained from each of the implemented graphics.
5. Conclusions and Future Works
In this article, a dataset for emotional analysis was presented based on metrics such as engagement, excitation, stress, interest, relaxation, and focus. These metrics were captured using an Emotiv Insight device during the interaction of 19 participants with 4 Portuguese lessons available on the Babbel app. The dataset includes annotation at the activity level, specifying the activity in which the participant was engaged at each instant of time throughout the interaction and the results obtained.
From this, the entire construction process of the dataset called EDaLI was explained in detail, including the data collection, processing, and annotation and a summary of the results obtained. This was expected to provide a clear structure of the steps and instructions for future generations and constructions of datasets related to the topics covered in this study. However, being able to automate or semi-automate the recording process of these emotional data in learning environments was noted as an aspect for future improvement. For the construction of this type of dataset, certain considerations are necessary, such as previously defining the type of activities that the participant will perform during their learning process, defining how the emotional metrics will be collected in such a way that they can be continuously represented, and determining a process for annotating the participants’ interaction data.
On the other hand, according to the results and the analysis, it can be observed that, from the created dataset, visualization techniques can be applied in a clear way to capture the behavior of a certain participant or group of participants. For example, at the group level, referring to all of the lessons, it was possible to identify the participants’ tendency to exhibit a low level of stress and excitement in most of the lessons, as well as high values of engagement. In addition, we determined that lesson four was where the group presented the highest number of shortcomings, although this lesson contained only exercises or activities related to the evaluation of concepts previously acquired in other lessons. Additionally, in the group analysis for lesson four, it could be concluded that the activity of completing dialogues (OS–DLG) presented difficulties for the group in general. It took about four times longer to complete than the rest of the activities in that lesson and was distinguished by high numbers of failed attempts and incorrect answers. On the other hand, participant number four in lesson four presented a high level of engagement with the activities presented. However, when observing the results, it could be recommended to the student to try to practice exercises based on completing dialogues, since, in this analysis, it was one of the activities where the most errors were made, and it took more time to complete. For this student, other ways to subject them to this type of exercise can be explored, so the experience of the dialogue-type activities could be enhanced.
The purpose of generating a public dataset is to define a series of rules and bases one which to design and construct a dataset to further research in this field of knowledge, i.e., to analyze which types of activities generate the most frustration among the participants depending on the conditions that are being presented, and which ones are easier depending on the content that is being presented, with the purpose of improving the presentation of these lessons and facilitating processes of attention to the participants through. For that reason, in the future work, we propose an expansion of the time-series visualization techniques that can be applied to the dataset, which will generate some contribution to these learning data. Likewise, the analysis should be expanded at a general level, that is, by obtaining a group of participants and performing a general analysis of their behavior based on the metrics and results obtained. Moreover, we plan to advance at the level of granularity in the analysis, that is, to be able to obtain an analysis at the level of specific activities and sub-activities with the purpose of making more specific recommendations for participants’ learning processes. This opens the possibility of adopting different machine learning techniques and algorithms, such as, for example, the application of time-series clustering techniques with variable lengths to determine the participants that present similar behaviors throughout their interactions, based on the consolidated emotional values. Finally, during the activity annotation process in the dataset creation process, the possibility of applying computer vision (CV) and natural language processing (NLP) techniques could be explored for the automatic or semi-automatic activity annotations of the activities performed at each instant of time by the participant.


 and
and 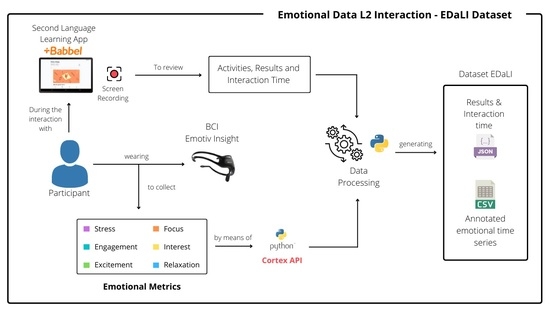


