
3D Imaging with Fringe Projection for Food and Agricultural Applications—A Tutorial

1
Department of Mechanical Engineering, Iowa State University, Ames, IA 50011, USA
2
Department of Agricultural and Biosystems Engineering, Iowa State University, Ames, IA 50011, USA
*
Author to whom correspondence should be addressed.
Electronics 2023, 12(4), 859; https://doi.org/10.3390/electronics12040859
Submission received: 13 January 2023
/
Revised: 28 January 2023
/
Accepted: 6 February 2023
/
Published: 8 February 2023
(This article belongs to the Special Issue Recent Advances in Image Processing and Computer Vision)
Abstract
:The rising global population, in conjunction with the increasing demand, decreasing labor supply, and increasing costs in the agricultural sector, has induced a need for automation in this industry. Many of these tasks are simplified using depth images and are accomplished using the help of 3D sensing technology such as stereo vision and time of flight methods. While there are various merits to these approaches, there is a need for high-speed, high-accuracy 3D profiling approaches in this rapidly advancing industry. Fringe Projection Profilometry is a variation of structured light technology, which has the advantage of having high speed in the kilohertz range, and sub-millimeter accuracy, which could be extremely beneficial for this sector to adopt. In this article, we seek to provide a tutorial on this technology, explain its various principles along with the basic methodology, and expound on its advantages. We demonstrate some example results using soybean roots and spinach leaves to show its utility, discuss potential reasons as to why this has not yet been widely adopted by this industry, review its potential limitations, and examine possible ways those limitations can be addressed so that they do not present a roadblock in its adoption.
1. Introduction
Our population has been increasing at a skyrocketing rate and is currently over 8 billion. The global agricultural sector is struggling to keep up with the demand of feeding the rapidly growing populace, especially the plant-based sector [1]. According to the Food and Agricultural Organization, to feed the anticipated 10 billion people on the planet in 2050, current food production should double to feed the global population [2]. From 2006 to 2050, total agricultural production must climb much more than it did in the same number of years from 1962 to 2006 to close this gap [3]. Around 75 percent of the caloric content of our food supply is made up of wheat, rice, maize, and soybeans, the key world staple food commodities [4], and the demand for these crops is increasing at a staggering rate. The yields in these top four crops are increasing , and per year, non-compounding rates, respectively, which is far lower than the per year rate required to double global production by 2050 [5]. This, combined with decreasing cultivable area relative to the population increase in various parts of the world due to intensive farming practices, urbanization and industrialization, and diminishing availability of water for agriculture [6,7,8,9], has put a massive amount of pressure on the industry to increase its agricultural yield efficiency and produce at a much higher rate. Additionally, the agricultural sector is mired by labor shortages. For instance, young people in North America are seeking a move to urban areas because agricultural jobs involve a lot of manual labor and toil and are viewed as unprofitable. Businesses have to pay a higher wage to attract new employees and retain the ones they have, which cuts into their profitability [10,11]. Steep labor costs combined with crippling labor shortages in many developed countries highlight a potential for automation in agriculture [12]. This has become a catalyst for the industry to learn to operate with fewer workers and embrace automation and 3D sensing to improve productivity and lower cost.
These aforementioned facts necessitate the importance of machine vision and autonomous sensing, which has many applications in this industry. Imaging and sensing are of paramount importance for operations involving crop harvesting such as fruit grading, ripeness detection, fruit counting, and yield estimation, and also support plant health monitoring activities, including weed, insect, disease, phenotyping, and deficiency detection. Machine vision can enable these tasks to be performed with speed and accuracy, thus, increasing crop productivity [13]. The use of machine vision in most of these applications involves the task of image segmentation, which entails separating the plant in question from the background. Most researchers have tackled image segmentation in the agricultural industry using color-based methods, usually used in conjunction with neural networks and other image processing algorithms such as Otsu’s Method, Hough transform, and Maximally Stable Extremal Regions [14,15,16].
For instance, Behroozi-Khazaei and Maleki have developed a color-based image segmentation algorithm utilizing an artificial neural network and the genetic algorithm for segmenting grape clusters from nearby leaves and background [17]. Their algorithm works well for mature, yellow grapes but does not work as well when the color of the grapes is close to the color of the leaves in the background [13]. Qureshi et al. used a method based on texture-based dense segmentation and shape-based fruit detection to count fruit in images of mango tree canopies in an automated fashion [18]. Although the algorithm performed exceedingly well overall, the smaller green mangoes, due to their visual similarity to leaves, were not consistently detected by this method, even with varying image lighting conditions. Gimenez-Gallego et al. developed approaches based on support vector machines and deep learning to segment out leaves from natural non-leaf backgrounds to enable measurement of the crop water stress index. Although these models perform well overall with high F1 scores, they have trouble classifying nonleaf regions that are the same color as the leaves and leaf regions that are of varying colors [19]. Bargoti et al. developed a neural network-based image segmentation method for apple detection and counting wherein they compared the performance of a multi-layer perception and a CNN. According to the authors, “Detection of fruits from background rows, and double-counting or missed detection due to lack of fruit registration” are the main sources of error in fruit detection, which spills over to yield estimation [20]. The availability of pixel-wise depth perception, however, would likely reduce these segmentation errors since the depth values for fruit pixels in background rows, as well as fruits that are partially occluded by the ones in front of them, would clearly be different.
Generally speaking, the main drawback of color-based image segmentation methods that have been developed for agricultural applications is that color may be impacted by lighting [21]. Additionally, for color-based image segmentation applications, if the portion of the image to be segmented out is too similar to auxiliary portions of the image, it can result in incorrect region segmentation and misclassification. Additionally, even in deep learning-based approaches, many color-based misclassifications were observed. These approaches can be made more robust by taking the depth information of these pixels into account. This highlights the importance of depth-based images that can be considered for these systems. One such example of using a depth image for semantic segmentation has been accomplished by Lin et al. [21], who developed a novel algorithm based on color, depth, and shape information that is used to detect cylindrical and spherical fruits on plants. Hu et al. developed the ACNET architecture that selectively gathers features from the RGB and depth branches to segment various images [22]. Xia et al. achieved segmentation of individual plant leaves using a time of flight-based RGB-D Kinect camera [23]. Rosell-Polo et al. developed a Kinect v2 based Mobile Terrestrial Laser Scanner for agricultural applications [24]. Jiang et al. used the time of flight depth sensing technology available in Microsoft Kinect v2 for plant phenotyping [25]. These examples, and many others like them, highlight the importance of using depth sensing in addition to conventional 2D images in the agricultural domain.
Due to the importance of depth sensing and fine-scale characterization in agriculture, as highlighted by the examples above, it is important that the depth measurement utilized in these applications is as accurate as possible. In comparison to some well-known depth sensing techniques, including time of flight, laser scanning, and stereo vision, the structured light technique has the advantage of being highly accurate (with 0.1 mm accuracy or higher) and is capable of achieving simultaneous whole area scanning. Fringe projection profilometry is a variation of the structured light technique that involves projecting multiple phase-shifted sinusoidal fringe patterns onto an object. The projected patterns are deformed according to the geometry of the object, and the images of the fringe pattern-illuminated objects are captured by the camera for 3D geometric reconstruction. This technology provides the most accurate 3D reconstruction results compared to other structured light codification technologies and possesses the capability of fine-scale characterization. Fine-scale characterization can be especially invaluable in potential applications such as plant phenotyping, which often requires a highly accurate geometric profile of components such as leaves, roots, stems, etc. Due to the many advantages of this technology, this work seeks to provide an introduction to it, and review its use and future applications in the food and agriculture domain to encourage adoption by researchers and industry in this field.
Due to its advantages, there has been the utilization of this technology (albeit limited) by researchers in the food and agriculture domain. Cao et al. attempted to measure shrivel development in Kiwifruits using a 360-degree structured light 3D scanner that works based on laser triangulation [26]. They used fringe projection equipment to measure the topography of the kiwi fruit and establish its surface deformation with each weight loss treatment, and also observed differences in topography parameters depending upon the severity of shriveling. Lu et al. used structured light technology to measure the surface profile of Gala apples [27]. Wang et al. used structured light technology from the Kinect V1 to perform size estimation of sweet onions using the RGB-D sensor [28]. As stated by the authors, this approach has industrial relevance due to the high scanning speed, making it suitable for inspection applications on a food production line as well as the commercial availability and affordability of the Kinect sensor. Hao et al. used fringe projection profilometry to acquire the position and height of tea tips, which can aid in the design of an automated tea picking machine [29]. Chen et al. proposed the design of a DSP controller-driven robot with structured light technology attached to calculate the height of the tea leaves for picking green tea flushes with an 85% detection accuracy and an end effector location error of less than 2 mm [30].
In addition to 3D imaging, hyperspectral imaging has also been commonly used in agriculture [31,32,33]. Hyperspectral imaging (x, y, and spectrum) and 3D imaging (x, y, z) provide two unique sensing modalities that complement each other. Thus, researchers started to investigate sensing techniques that simultaneously retrieve spectral and depth information, known as hyperspectral 4D imaging (x, y, z, and spectrum). One straightforward idea is to fuse the hyperspectral data and 3D point clouds during post-processing by identifying reference information or features, such as geographical locations [34,35] and features [36,37] in the scene and extra added reference targets [38]. Though successful, the post-processing for data fusion may introduce additional uncertainties for the accuracy and reliability of hyperspectral 4D imaging. Another idea is to integrate the 3D and hyperspectral imager as a single imaging system to avoid complicated data fusion. Different kinds of 3D imagers are used in the integrated system, which can be divided into active and passive methods. When passive 3D imaging, such as stereo vision [39,40], is used in the integrated system, its accuracy largely depends on the scene’s texture, and it is not suitable for the scene with uniform or repetitive texture. To avoid complicated data fusion and increase the system flexibility, there are potential opportunities to merge a hyperspectral imager and an active 3D imager, such as the fringe projection system, to achieve robust 4D imaging that does not rely on natural features that exist in the imaged scene.
The rest of this paper is organized as follows. Section 2 expounds on the principles of fringe projection profilometry, Section 3 explains the principles of hyperspectral 4D imaging, Section 4 highlights some example results of this technology in the domain of food, Section 5 discusses the advantages and limitations of FPP, talks about some prospective areas it can be applied to in this field in the future; Section 6 is the conclusion.
2. Principles of Fringe Projection Profilometry (FPP)
Fringe projection profilometry (FPP) is a variation of the structured light technique that involves projecting phase-shifted fringe patterns using a projector onto an object. These fringes are deformed by the geometry of the object. The fringe images of the object after being illuminated by the fringe patterns are captured by the camera, and 3D reconstruction is performed after phase-based fringe analysis. Figure 1 shows a typical physical setup of a structured light system.
FPP consists of various steps, including fringe image generation, fringe analysis, phase unwrapping to convert relative phase to absolute phase, calibration, and reconstruction.
2.1. Fringe Pattern Generation
Fringe pattern generation can be classified into digital [41], analog (Moire Patterns, Grating-Based Fringe Projection) [42,43,44,45], and interference-based methods [46]. In this section, we will expound on digital fringe projection methods since they are currently the most modern and widely used method in this field.
2.1.1. Digital Methods
Digital Fringe projection systems have the advantage of being faster and more flexible than analog systems. These systems consist of computer-generated sinusoidal fringe patterns that are projected onto an object. The equation for the sinusoidal pattern projected by a linear projector with a phase shift of delta is given by
The fringe pitch is described by P, is the phase shift, describes the image intensities at pixel location of image I. For the projection of digital fringe patterns, various digital projection technologies can be used, including liquid crystal display (LCD), liquid crystal on silicon (LCoS), and digital light processing (DLP) technologies.
Liquid Crystal Display (LCD)
The concept of LCD involves light entering through a polarizing filter, passing through an electrode and then into a liquid crystal, then into another electrode, and then through a polarizing filter, and then out, as shown in Figure 2. The amount of light exiting the liquid crystal depends on the voltage being passed through it. The higher the voltage applied, the more the amount of light that passes through it. This lets the LCD display any grayscale values almost instantaneously.
An LCD projector typically involves white light from the lamp, passing through an arrangement of dichroic mirrors that split it into its RGB components, and have each component passes through a separate LCD arrangement, and then recombine these components using a dichroic prism to get the output [47].
Digital Light Processing (DLP)
DLP projectors consist of tiny micromirrors that reflect light to generate an image. The projector contains a digital micromirror device (DMD), an optical semiconductor which consists of an array of microscopic mirrors, each of which functions as a light switch. Figure 3 demonstrates the optical switching principle of a micromirror. Electrostatic forces control the cell, and can move the micromirror to an ON () or OFF () position. Each micromirror corresponds to an image pixel, with the grayscale values being controlled by the percentage of ON or OFF times of the mirror per frame of the micromirrors. The image brightness is controlled by the rate of the ON and OFF switching of the mirrors. Figure 4 demonstrates the working principle of a DLP projector. Light enters from a light source and passes through a color filter spinning at high speed, which splits the light into its Red, Green, and Blue components. The DMD chip then projects these Red, Green, and Blue channel images onto a screen. Since the color wheel spins at such a high speed, the human eye can perceive only the resultant image. Grayscale values are produced through time integration [47].
Liquid Crystal on Silicon (LCoS)
Liquid Crystal on Silicon is a technology that varies light intensities by manipulating liquid crystals, but instead of using LCD’s transmissive technology to steer the light, it employs the DLP’s reflective technology as illustrated in Figure 5. The light passes through polarizer , and then enters the liquid crystal to reach the reflective coating that reflects the light back. The silicon layer controlling the liquid crystal is a CMOS semiconductor. The reflected beam passes through the Liquid crystal again and then passes through polarizer and then exits. Changing the voltage applied to the electrodes will modulate the grayscale value of the light emitted. LCoS also starts at a higher resolution compared to the DLP and LCD technologies [47].
2.1.2. Performance Comparison of Digital Methods
Image Contrast
The DLP can provide higher contrast than the LCD and LCoS systems because of the ability of the DMD chip to turn ON and OFF completely. This improved contrast results in a higher signal-to-noise ratio, thereby leading to increased resolution. LCoS can achieve a higher contrast than the LCD system because its filling factor is higher.
Grayscale Generation Speed
LCD and LCoS systems generate grayscale values almost instantaneously while DLP achieves this through time integration, thereby utilizing an entire projection cycle for the same.
Color Generation Speed
The DLP projector uses a single-chip DMD in conjunction with a color wheel to generate R, G, and B values one after the other while LCD and LCoS contain three chips and can generate color simultaneously. Researchers have, however, been able to overcome the DLP’s limitation and still use it for real-time imaging [48].
Camera-Projector Synchronization
Camera Projector synchronization is critical for DFP systems because of the need to switch between and project multiple patterns. The LCD and LCoS, because of their ability to project instantaneously, have a looser synchronization requirement with the camera and are, therefore, flexible. The DLP, however, utilizes the entire projection cycle for projection, due to which it has a strict synchronization requirement [47].
2.2. Fringe Image Analysis
Fringe analysis originated from laser interferometry, where two wavefronts are superimposed together to generate a sinusoidal fringe pattern. This process is explained as follows: the equation of a wave can be described as
Here, c describes the equation of the wave, describes the amplitude, and describes the phase. The pair describes the pixel coordinates of the image. Let denote the wavelength and let h denote the wave displacement, the phase can be described by
In laser interferometry, there are two wavefronts whose interference creates a sinusoidal pattern
where and are the amplitudes of the two waves. The equivalent wave after interference is
If we define the intensity as
and if we rewrite
and
and define the phase difference as:
then we get
which is the fundamental equation for fringe analysis [47].
Different from the conventional fringe projection that uses laser interference to generate sinusoidal patterns for projection, digital fringe projection further increases the flexibility by using digital video projectors to directly project computer-generated sinusoidal patterns, as a result of technological advancements of LCD, DLP, or LCoS techniques as introduced above. Examples of computer-generated sinusoidal patterns can be found in Figure 6. For fringe image analysis, the most critical step is to extract the phase information as it contains the most useful information for 3D geometric reconstruction. The standard N-step phase-shifting algorithm, as the most accurate phase retrieval method, will be introduce next.
2.2.1. Standard N-Step Phase Shifting Algorithm
The basic principle of the N-step phase-shifting algorithm is to generate and project a series of N patterns with rigid phase shifts applied between every two consecutive frames. Within the N phase shifted patterns, the equation for the intensity I of the image with a phase and a phase shift can be written as
where is the average intensity and is the fringe modulation. If the phase shift is equal where k ranges from 1 through N, using the least squares algorithms [49] to solve the three unknowns , , and , we get:
Equation (15) represents the wrapped phase map here that needs to be unwrapped to obtain a continuous phase map for 3D reconstruction. In general, a higher value of N (i.e., more phase shifting steps applies) will result in greater accuracy of phase retrieval but will also result in a lower measurement speed due to more fringe images that need to be captured [50].
Given that there are only three unknowns , , and that need to be solved, the three-step phase-shifting algorithm (), which uses three steps per phase shift of , uses the fewest steps possible to solve for the phase uniquely, making it suitable for high-speed 3D imaging applications [51]. An example of three phase-shifted fringes is demonstrated in Figure 6. Mathematically speaking, the three phase-shifted fringe images and are as follows:
Simultaneously solving these equations gives us the wrapped phase map.
This wrapped phase map is a relative phase map that varies from and needs to be unwrapped to obtain a continuous phase map.
where is the continuous phase map.
We will explain this unwrapping process in the following section.
2.3. Phase Unwrapping
In the previous subsection, we solved for the relative phase . This phase is the wrapped phase and ranges from , with discontinuities. For these discontinuities to be removed, they need to be identified, and an integer multiple of needs to be added to them to make the phase map continuous. If we call this integer multiple k, the phase unwrapping process calculates the k for each point in the phase map in the equation:
Phase unwrapping techniques can be broadly classified into temporal unwrapping and spatial unwrapping techniques. According to Zhang et al. [47,50], spatial phase unwrapping works by referring phase values of other points on the same phase map through local or global optimization. In addition, spatial phase unwrapping can be exceedingly difficult because of noise, surface reflectance changes, and other causes, and despite recent improvements, it is still very difficult to robustly unwrap the complete phase map if the phase data is very noisy. To prevent the error from spreading to many points, higher-quality phase points are unwrapped before lower-quality phase points, according to the basic principle of quality-guided phase unwrapping. This means that the object surface has to have at least one smooth unwrapping path such that the surface geometry will not introduce a phase change of more than between two successive points. A 3D point on the surface is relative to the shape that was recovered from a spatially unwrapped phase map. It is impossible to retrieve the absolute position between various smooth patches [50].
Temporal phase unwrapping, by contrast, does not need neighboring pixel information to perform phase unwrapping, making it highly suited to unwrapping objects with complex shapes. It calculates the absolute phase value at each point instead of measuring each point at an offset [47]. The trade-off is that the measurement speed of temporal phase unwrapping is constrained by the need for a few additional patterns. In the next subsection, we will explain phase unwrapping using the multi-frequency phase-shifting algorithm, a popular temporal phase unwrapping method.
2.3.1. Multi-Frequency Phase Unwrapping Algorithm
When multiple fringe stripes cover the image, there are discontinuities in the phase of the fringe. Typically, higher frequency stripes will lead to a more accurate measurement of the geometric profile of the object, but these stripes will have discontinuities that need to be unwrapped. A common way to unwrap them is to project lower frequency fringe stripes such that the overall equivalent fringe period covers the entire image [52]. Since the equivalent pattern covers the area, its phase has no discontinuities, and we can use this to unwrap the other fringe patterns.
For instance, if we choose two stripes with frequencies and with wavelengths and :
where the overall equivalent wavelength would be
The choice of fringe wavelengths is upon the user, with the only restriction being that they are an integer number as they are represented by pixels in digital images. Fringe patterns with only two wavelengths are typically insufficient in most cases due to noise issues. In many cases, three fringe patterns are needed for phase unwrapping such that the overall equivalent wavelength can cover the entire image [53]. Additionally, it is important to note that the quality of the 3D reconstruction is primarily determined by the fringe patterns with the highest frequency. In general, the higher the frequency chosen, the better the quality of 3D reconstruction that can be obtained.
For instance, if we are looking to cover a 700 × 700 image, we can choose three fringe patterns such that the equivalent pattern period covers the entire area. Since the equivalent pattern covers the area, its phase has no discontinuities and is thereby the absolute phase, and we can use this to unwrap the other fringe patterns. For instance, if we choose three fringe patterns with wavelengths , we get the overall equivalent pattern period
The best way to accomplish unwrapping is to use this equivalent wavelength to unwrap phases of shorter lengths. The longest pattern is first used to unwrap the second longest pattern, which is then used to unwrap the third longest pattern, and so on. This is done to minimize noise, and the process is known as backward phase unwrapping.
The fringe order for each step can be determined by
The phase unwrapping can be performed at each step using:
2.4. Calibration
The most popular way to describe a camera is with a pinhole model, where the extrinsic parameters define the camera’s position and orientation in relation to the world coordinate system, and the intrinsic parameters explain the camera’s internal characteristics. Every point on the object travels via the lens’ optical center before being projected onto the CCD plane, which is located at a distance equal to the focus’ length away from the lens along the optical axis.
The camera’s position in world coordinates, including its coordinates, and rotations about the three axes, are described by the extrinsic matrix. The intrinsic matrix includes variables like the skew factor, the primary points, and the focal lengths in the main axes of the image plane. Similar criteria are also used to describe the projector. A schematic of this system is shown in Figure 7.
A point on the world coordinate system will be projected onto the imaging plane at location where s is a scaling factor. This is described by the equation below:
where is the coordinates of the image point in the image coordinate system, is the object point in the world coordinate system, and and are rotation and translation matrices respectively between the world coordinate system and the camera coordinate system. , the intrinsic parameter matrix of the camera, is
where are the coordinates where the optical axis intersects the imaging sensor plane, and are focal lengths along the principal axes of the image plane and is the skewness parameter. The projector also follows the pinhole model, and its equation is written as
where are the corresponding coordinates of the image point in the projector coordinate system, and is a scale factor. and are rotation and translation matrices, respectively, between the world coordinates system and the projector coordinate system.
The goal of calibration is to calculate the intrinsic and extrinsic matrices of the camera and projector so that we can figure out the projector’s position in relation to the camera as well as both of their intrinsic properties. A very popular method is to use a black and white circle board as pictured in Figure 8 to calibrate the camera-projector system.
The main idea is to place the calibration target at different orientations and capture its images at each location. The circle center points serve as features that link their camera image coordinates with the corresponding world coordinates. The OpenCV’s camera calibration toolbox can be used to solve for the intrinsic matrix of the camera.
The camera and projector both employ linear models. The calibration process for the projector is the same as that for the camera because it is considered as though it “captures” images similarly. By aligning the projector’s pixels and the camera’s image, this is made possible. A point on the camera pixel will translate into a phase line on the projector if only one directional fringe stripe is applied. By projecting fringe stripes that are perpendicular to the previous one, correspondence can then be established at the intersection of the same point of the two perpendicular phase lines on the projector. Following that, all circle center points on the camera images can find their corresponding pairs on the projector imaging plane, and thus, the projector intrinsic parameters can be calibrated using the same calibration procedure for the camera. The extrinsic parameters that define the transformation from the camera coordinate system to the projector coordinate system are computed using the OpenCV stereo calibration toolbox [54].
2.5. 3D Reconstruction
After phase unwrapping and converting the relative phase to the absolute phase , we can correlate the camera and projector coordinates:
Here, is the absolute phase of each camera pixel and is the absolute phase of each projector pixel.
From the equations defined above and the original calibration Equations (32) and (34), we get,
where are elements of the intrinsic parameter matrix of the camera described in Equation (33), and are elements of the intrinsic parameter matrix of the projector described in Equation (34), and and are coordinates of the image points in the camera and projector coordinate systems respectively, as previously defined. In the next section, we will introduce the concept and principles of FPP-based hyperspectral 4D imaging, which finds applications in the food and agricultural industry.
3. Hyperspectral 4D Imaging Based on FPP
3D imaging by FPP can provide valuable geometric information and can be extremely helpful in various applications involving phenotyping and surface morphological characterization. However, pure 3D data may not satisfy the need in many food and agriculture applications, especially when in-depth characterization of physicochemical properties is needed. That leads to the development of 4D hyperspectral imaging, which adds one additional dimension of spectral data on top of the normal 3D data from 3D imaging. This section introduces the recently developed 4D line-scan hyperspectral imaging technology based on FPP developed by our research team [55].
As shown in Figure 9, the 4D line-scan hyperspectral imager contains not only a CMOS camera and a DLP projector that are common in the FPP system but also a visible and near-infrared (VNIR) spectrograph and a linear rail. Figure 10 shows the schematic diagram of the system. The projector projects multiple fringe pattern images to illuminate the object’s surface, and the camera observes the scene. In each shot, the light at a specific scene location can pass through the slit and then get scattered onto the camera imaging plane. As the index of the imaging plane is related to wavelength, the camera can only capture a small line of the scene at different wavelengths in one shot. To get the complete scan of the object, the object moves with the linear rail in a perpendicular direction to the slit. By stitching all the scans at the different specific indexes of the imaging plane, the camera can acquire the entire scene at different wavelengths in a line-scanning manner. Note that the projector and camera imaging planes in Figure 10 are supposed to be set parallel but they are not drawn parallel for simplification and better visualization.
We adopted the three-step phase-shifting algorithm mentioned in Section 2.2.1 and the three-frequency phase unwrapping algorithm mentioned in Section 2.3.1 to get the absolute phase information. Moreover, we also calculated the phase information of a reference plane, where depth . Based on [55], given a fringe illuminated image, its image center and phase differences map (corresponding to the reference plane), the 3D geometrical information at any pixel can be recovered by:
where , , , , and are constant parameters for the proposed system. It is worth mentioning that since here the line-scanning mode was implemented and a parallel setup of the camera-projector was employed in this system, here we did not adopt the triangulation-based 3D reconstruction as introduced in Section 2.5. In the meantime, given that a line spectrograph is used for the camera, the images are acquired in the format of hyperspectral images, which makes the system a 4D (i.e., 3D + spectral data) imaging system.
4. Example Results
4.1. Example Application of 3D Imaging with FPP—Plant Phenotyping
Plant phenotyping is an important application in agriculture where high-throughput high-accuracy characterization of phenotype traits is extremely important. This will provide opportunities for the FPP technology, given its capabilities of high-speed fine-scale 3D shape measurements. Example measurement results of soybean root structures are illustrated in Figure 11, where Figure 11a–d show the photographs of the measured root samples, and Figure 11e–h show the corresponding 3D shape measurement result using the FPP technology, with sub-millimeter accuracy. The result clearly shows the merit of FPP in terms of fine-scale local characterization of detailed features such as small root branches. Given the high-speed nature of the FPP technique, such technology has a high potential for future phenotyping of roots or other structures such that the high-fidelity characterization of phenotype traits (e.g., number of root branches, root lengths, root diameters, root angle) can be realized with high throughputs.
4.2. Example Application of 4D Imaging with FPP—Leafy Greens Nondestructive Evaluations
As a non-destructive detection tool, the 4D line-scan hyperspectral imager can be applied to evaluate vegetable products’ quality and detect defects. The accuracy of this system, as computed on a white sphere of diameter mm, was shown to be greater than mm [55]. As shown in Figure 12a, we selected spinach leaves at the different fresh levels. The fresh level of leaves decreases from leaves A to E. Based on spectral images from the system, the reflectances [31] of each leaf are calculated and illustrated in Figure 12b. The reflectance values present a general increase from leaf A to leaf E, corresponding to leaf quality deteriorating gradually. Moreover, we also computed the normalized difference vegetation index (NDVI) [56] for each leaf, as shown in Figure 12c. Figure 12c presents that NDVI value decreases gradually from leaf A to leaf E, which indicates the decline of the spinach leaf’s quality.
Besides spectral data for evaluating the average or overall leaves quality, spatial data might benefit local defect detection on leaves. In Figure 13a, there is an obvious defect on leaf B. We already obtained 3D reconstructed geometry and the NDVI image of leaf B as shown in Figure 13b,e. Based on 3D geometry, we can extract the profile and vein of leaf B using morphology methods, as illustrated in Figure 13d. From the NDVI image shown in Figure 13e, the NDVI values at the edges, veins, and defects are relatively smaller than their neighbors. Based on the k-nearest neighbors (KNN) algorithm [57], we highlighted the edges, veins, and defects of leaf B, as presented in Figure 13g. Combining the extracted profile and vein from 3D geometry and the highlighted edges, vein, and defects, defects can be marked out, and others are ruled out, as illustrated in Figure 13h.
5. Discussion
We have so far discussed the principles and advantages of FPP, examples of its utilization by researchers in the agricultural domain, and have also demonstrated a few potential applications in the section prior. However, despite all of its obvious advantages, in comparison to other 3D imaging techniques such as scanning using time-of-flight cameras, laser scanning, and stereo vision technology, FPP has not yet been adopted as widely by the agricultural domain. The reason for this could be the affordability, popularity, and ease of use with the other technology as compared to structured light. However, as previously stated, FPP has the advantage of very high speed, sub-millimeter accuracy, and fine-scale characterization abilities that could be extremely valuable for this domain.
From the applications detailed in Section 1 on the works of Rosell-Polo et al., Wang et al., Xia et al., and Jiang et al. [23,24,25,28] it is clear that the Microsoft Kinect is a popular tool used in agriculture for depth sensing applications. Starting in 2014, the new version of this tool, the Microsoft Kinect v2, switched from structured light to time of flight-based depth sensing technology. Owing to its ease of use and affordability, it seems researchers have persisted with this device, and it is a popular tool for depth sensing in this industry. The Kinect does, however, have its disadvantages. While it is true that the speed of this sensor is sufficient for numerous applications, it is also true that it can fall short in a number of other situations. Firstly, while it is currently enough to keep up with the existing sorting line speeds of produce such as tomatoes and onions, should there be potential for an increase in line speeds, the existing machine vision technology could result in being a bottleneck for such lines. It would be ideal for these industries to use "future proof" machine vision technology so that they do not encounter this issue, and to that end, a high speed FPP-based machine vision system can be a better solution than adding multiple lines for the multiple lower speed sensors. There are also other applications, such as online crop phenotyping, that require a higher line speed (over 30 units per second) than the Kinect can handle. The FPP technique, when aided by the high-speed bitwise binary defocusing techniques, can perform image acquisition in the range of kilohertz [47], and is thus, a highly suited technology for these kinds of applications. Figure 14 demonstrates the depth images generated using the FPP system and the Kinect V2’s TOF camera for a tree branch. It is evident that the FPP system can capture the fine-scale features of the branch better than the Kinect, and is further proof of why it should be adopted in this domain.
However, the FPP technique is also not without its caveats. Firstly, despite being superfast, since most complex geometries would require to be unwrapped temporally rather than spatially, this technique will need the projection and acquisition of multiple fringe patterned images, which would be difficult to freeze the scene in applications where the required mechanical movements of tested samples are extremely rapid. In addition, specular and reflective surfaces may lead to saturation and, thereby, loss of fringe information, which leads to a decrease in the accuracy of FPP when attempting to recover the geometric profile of these objects. Additionally, regions engulfed by shadows and occlusions can disrupt the accuracy of this technique.
To address these limitations, researchers have made recent advances using deep learning-based techniques in conjunction with FPP. Zheng et al. has developed a U-NET-based network to predict the geometry of an object using only a single fringe image [58]. Wang et al. has developed a direction-aware spatial context module-based network to detect shadow regions and a generative adversarial network in conjunction with image processing techniques to repair the shadow-based regions using only a single fringe image [59]. Ueda et al. used a U-NET with residual blocks to remove the saturation seen on fringe images due to specularity, leading to increased accuracy when performing phase unwrapping and reconstruction on the repaired images [60]. With the use of computer graphics software such as Blender and Unity to create accurate digital twins of structured light systems [58,60], it has also become incredibly cheap and easy to construct training datasets for structured light-based neural networks. Thus, if the limitations of FPP seem a stumbling block in the adoption of this highly useful technology in the agricultural industry, it is promising that this method could be adopted in combination with deep learning methods to increase its robustness and make it ubiquitous in the future.
6. Conclusions
The food and agriculture industry’s need for depth sensing is highlighted, and its current tool of choice for this endeavor were discussed. The principles of FPP are discussed in detail, example results are demonstrated to showcase its utility, its current sparing use in the agriculture industry is discussed, and potential applications are discussed. Clearly, there is a need for the adoption of this technology by the agriculture and food domain because of the advantages it possesses over other depth imaging technology in terms of speed, accuracy, and fine-scale characterization, and in case its limitations turn out to be a stumbling block, it can be combined with deep learning approaches to act as a high speed, robust machine vision tool for this industry.
Author Contributions
Writing—original draft preparation, B.B., J.L. and B.L.; writing—review and editing, L.L.; supervision, B.L.; data acquisition, J.L. and B.L.; project administration, L.L. and B.L. All authors have read and agreed to the published version of the manuscript.
Funding
This research is partially supported by the U.S. Department of Energy Bioenergy Technologies Office (BETO) under award number EE0010295. The views expressed here are those of the authors and are not necessarily those of the BETO.
Data Availability Statement
The data presented in this study are available on request from the corresponding author.
Acknowledgments
The authors would like to specifically thank Baskar Ganapathysubramanian, Asheesh K. Singh, and Kevin Falk for their assistance in root phenotyping data acquisition.
Conflicts of Interest
The authors declare no conflict of interest.
References
- Giampieri, F.; Mazzoni, L.; Cianciosi, D.; Alvarez-Suarez, J.M.; Regolo, L.; Sánchez-González, C.; Capocasa, F.; Xiao, J.; Mezzetti, B.; Battino, M. Organic vs conventional plant-based foods: A review. Food Chem. 2022, 383, 132352. [Google Scholar] [CrossRef] [PubMed]
- Xu, R.; Li, C. A modular agricultural robotic system (MARS) for precision farming: Concept and implementation. J. Field Robot. 2022, 39, 387–409. [Google Scholar] [CrossRef]
- Timsina, J. Can Organic Sources of Nutrients Increase Crop Yields to Meet Global Food Demand? Agronomy 2018, 8, 214. [Google Scholar] [CrossRef]
- Roberts, M.J.; Schlenker, W. Identifying Supply and Demand Elasticities of Agricultural Commodities: Implications for the US Ethanol Mandate. Am. Econ. Rev. 2013, 103, 2265–2295. [Google Scholar] [CrossRef]
- Ray, D.K.; Mueller, N.D.; West, P.C.; Foley, J.A. Yield Trends Are Insufficient to Double Global Crop Production by 2050. PLoS ONE 2013, 8, e66428. [Google Scholar] [CrossRef]
- Ye, S.; Song, C.; Shen, S.; Gao, P.; Cheng, C.; Cheng, F.; Wan, C.; Zhu, D. Spatial pattern of arable land-use intensity in China. Land Use Policy 2020, 99, 104845. [Google Scholar] [CrossRef]
- Egidi, G.; Salvati, L.; Falcone, A.; Quaranta, G.; Salvia, R.; Vcelakova, R.; Giménez-Morera, A. Re-Framing the Latent Nexus between Land-Use Change, Urbanization and Demographic Transitions in Advanced Economies. Sustainability 2021, 13, 533. [Google Scholar] [CrossRef]
- Ziem Bonye, S.; Yenglier Yiridomoh, G.; Derbile, E.K. Urban expansion and agricultural land use change in Ghana: Implications for peri-urban farmer household food security in Wa Municipality. Int. J. Urban Sustain. Dev. 2021, 13, 383–399. [Google Scholar] [CrossRef]
- Hawkesford, M.J.; Araus, J.L.; Park, R.; Calderini, D.; Miralles, D.; Shen, T.; Zhang, J.; Parry, M.A.J. Prospects of doubling global wheat yields. Food Energy Secur. 2013, 2, 34–48. [Google Scholar] [CrossRef]
- Ghobadpour, A.; Monsalve, G.; Cardenas, A.; Mousazadeh, H. Off-Road Electric Vehicles and Autonomous Robots in Agricultural Sector: Trends, Challenges, and Opportunities. Vehicles 2022, 4, 843–864. [Google Scholar] [CrossRef]
- Richards, T.J.; Rutledge, Z. Agricultural Labor and Bargaining Power. SSRN 2022. [Google Scholar] [CrossRef]
- Martin, T.; Gasselin, P.; Hostiou, N.; Feron, G.; Laurens, L.; Purseigle, F.; Ollivier, G. Robots and transformations of work in farm: A systematic review of the literature and a research agenda. Agron. Sustain. Dev. 2022, 42, 66. [Google Scholar] [CrossRef]
- Mavridou, E.; Vrochidou, E.; Papakostas, G.A.; Pachidis, T.; Kaburlasos, V.G. Machine Vision Systems in Precision Agriculture for Crop Farming. J. Imaging 2019, 5, 89. [Google Scholar] [CrossRef] [PubMed]
- Otsu, N. A Threshold Selection Method from Gray-Level Histograms. IEEE Trans. Syst. Man Cybern. 1979, 9, 62–66. [Google Scholar] [CrossRef]
- Illingworth, J.; Kittler, J. A survey of the Hough transform. Comput. Vis. Graph. Image Process. 1988, 44, 87–116. [Google Scholar] [CrossRef]
- Matas, J.; Chum, O.; Urban, M.; Pajdla, T. Robust wide-baseline stereo from maximally stable extremal regions. Image Vis. Comput. 2004, 22, 761–767. [Google Scholar] [CrossRef]
- Behroozi-Khazaei, N.; Maleki, M.R. A robust algorithm based on color features for grape cluster segmentation. Comput. Electron. Agric. 2017, 142, 41–49. [Google Scholar] [CrossRef]
- Qureshi, W.S.; Payne, A.; Walsh, K.B.; Linker, R.; Cohen, O.; Dailey, M.N. Machine vision for counting fruit on mango tree canopies. Precis. Agric. 2017, 18, 224–244. [Google Scholar] [CrossRef]
- Giménez-Gallego, J.; González-Teruel, J.D.; Jiménez-Buendía, M.; Toledo-Moreo, A.B.; Soto-Valles, F.; Torres-Sánchez, R. Segmentation of Multiple Tree Leaves Pictures with Natural Backgrounds using Deep Learning for Image-Based Agriculture Applications. Appl. Sci. 2020, 10, 202. [Google Scholar] [CrossRef]
- Bargoti, S.; Underwood, J.P. Image Segmentation for Fruit Detection and Yield Estimation in Apple Orchards. J. Field Robot. 2017, 34, 1039–1060. [Google Scholar] [CrossRef] [Green Version]
- Lin, G.; Tang, Y.; Zou, X.; Xiong, J.; Fang, Y. Color-, depth-, and shape-based 3D fruit detection. Precis. Agric. 2020, 21, 1–17. [Google Scholar] [CrossRef]
- Hu, X.; Yang, K.; Fei, L.; Wang, K. ACNET: Attention Based Network to Exploit Complementary Features for RGBD Semantic Segmentation. In Proceedings of the IEEE International Conference on Image Processing (ICIP), Taipei, Taiwan, 22–25 September 2019; pp. 1440–1444. [Google Scholar] [CrossRef]
- Xia, C.; Wang, L.; Chung, B.K.; Lee, J.M. In Situ 3D Segmentation of Individual Plant Leaves Using a RGB-D Camera for Agricultural Automation. Sensors 2015, 15, 20463–20479. [Google Scholar] [CrossRef] [PubMed]
- Rosell-Polo, J.R.; Gregorio, E.; Gené, J.; Llorens, J.; Torrent, X.; Arnó, J.; Escolà, A. Kinect v2 Sensor-Based Mobile Terrestrial Laser Scanner for Agricultural Outdoor Applications. IEEE/ASME Trans. Mechatronics 2017, 22, 2420–2427. [Google Scholar] [CrossRef]
- Jiang, Y.; Li, C.; Paterson, A.H. High throughput phenotyping of cotton plant height using depth images under field conditions. Comput. Electron. Agric. 2016, 130, 57–68. [Google Scholar] [CrossRef]
- Cao, R. Describing Shrivel Development in ‘SunGold™’ Kiwifruit Using Fringe Projection and Three-Dimension Scanner: A Thesis Presented in Partial Fulfilment of the Requirements for the Degree of Master of Food Technology at Massey University, Manawatu, New Zealand. Master’s Thesis, Massey University, Manawatu, New Zealand, 2021. [Google Scholar]
- Lu, Y.; Lu, R. Structured-illumination reflectance imaging coupled with phase analysis techniques for surface profiling of apples. J. Food Eng. 2018, 232, 11–20. [Google Scholar] [CrossRef]
- Wang, W.; Li, C. Size estimation of sweet onions using consumer-grade RGB-depth sensor. J. Food Eng. 2014, 142, 153–162. [Google Scholar] [CrossRef]
- Hao, Z.; Yong, C.; Wei, W.; GuoLu, Z. Positioning method for tea picking using active computer vision. Nongye Jixie Xuebao 2014, 45, 61–78. [Google Scholar]
- Chen, J.; Chen, Y.; Jin, X.; Che, J.; Gao, F.; Li, N. Research on a Parallel Robot for Tea Flushes Plucking. In Proceedings of the 2015 International Conference on Education, Management, Information and Medicine, Shenyang, China, 24–26 April 2015; Atlantis Press: Dordrecht, The Netherlands, 2015; pp. 22–26. [Google Scholar] [CrossRef]
- Liu, H.; Bruning, B.; Garnett, T.; Berger, B. Hyperspectral imaging and 3D technologies for plant phenotyping: From satellite to close-range sensing. Comput. Electron. Agric. 2020, 175, 105621. [Google Scholar] [CrossRef]
- Adão, T.; Hruška, J.; Pádua, L.; Bessa, J.; Peres, E.; Morais, R.; Sousa, J.J. Hyperspectral imaging: A review on UAV-based sensors, data processing and applications for agriculture and forestry. Remote. Sens. 2017, 9, 1110. [Google Scholar]
- Sahoo, R.N.; Ray, S.; Manjunath, K. Hyperspectral remote sensing of agriculture. Curr. Sci. 2015, 108, 848–859. [Google Scholar]
- Tolt, G.; Shimoni, M.; Ahlberg, J. A shadow detection method for remote sensing images using VHR hyperspectral and LIDAR data. In Proceedings of the 2011 IEEE international geoscience and remote sensing symposium, Vancouver, BC, Canada, 24–29 July 2011; IEEE: Piscataway, NJ, USA, 2011; pp. 4423–4426. [Google Scholar]
- Ghosh, A.; Fassnacht, F.E.; Joshi, P.K.; Koch, B. A framework for mapping tree species combining hyperspectral and LiDAR data: Role of selected classifiers and sensor across three spatial scales. Int. J. Appl. Earth Obs. Geoinf. 2014, 26, 49–63. [Google Scholar]
- Sima, A.A.; Buckley, S.J. Optimizing SIFT for matching of short wave infrared and visible wavelength images. Remote. Sens. 2013, 5, 2037–2056. [Google Scholar] [CrossRef] [Green Version]
- Monteiro, S.T.; Nieto, J.; Murphy, R.; Ramakrishnan, R.; Taylor, Z. Combining strong features for registration of hyperspectral and lidar data from field-based platforms. In Proceedings of the 2013 IEEE International Geoscience and Remote Sensing Symposium-IGARSS, Melbourne, VIC, Australia, 21–26 July 2013; IEEE: Piscataway, NJ, USA, 2013; pp. 1210–1213. [Google Scholar]
- Buckley, S.; Kurz, T.; Schneider, D.; Sensing, R. The benefits of terrestrial laser scanning and hyperspectral data fusion products. Int. Arch. Photogramm. Remote. Sens. Spat. Inf. Sci. 2012, 39, 541–546. [Google Scholar]
- Behmann, J.; Mahlein, A.K.; Paulus, S.; Kuhlmann, H.; Oerke, E.C.; Plümer, L. Calibration of hyperspectral close-range pushbroom cameras for plant phenotyping. ISPRS J. Photogramm. Remote. Sens. 2015, 106, 172–182. [Google Scholar] [CrossRef]
- Yao, M.; Xiong, Z.; Wang, L.; Liu, D.; Chen, X. Computational Spectral-Depth Imaging with a Compact System. In Proceedings of the SIGGRAPH Asia 2019 Posters, Brisbane, Australia, 17–20 November 2019; pp. 1–2. [Google Scholar]
- Xu, J.; Zhang, S. Status, challenges, and future perspectives of fringe projection profilometry. Opt. Lasers Eng. 2020, 135, 106193. [Google Scholar] [CrossRef]
- Malacara, D. (Ed.) Optical Shop Testing, 2nd ed.; Wiley: New York, NY, USA, 1992. [Google Scholar]
- Stoykova, E.; Minchev, G.; Sainov, V. Fringe projection with a sinusoidal phase grating. Appl. Opt. 2009, 48, 4774. [Google Scholar] [CrossRef] [PubMed]
- Anderson, J.A.; Porter, R.W. Ronchi’s Method of Optical Testing. Astrophys. J. 1929, 70, 175. [Google Scholar] [CrossRef]
- Wust, C.; Capson, D.W. Surface profile measurement using color fringe projection. Mach. Vis. Appl. 1991, 4, 193–203. [Google Scholar] [CrossRef]
- Deck, L.; De Groot, P. High-speed noncontact profiler based on scanning white-light interferometry. Appl. Opt. 1994, 33, 7334–7338. [Google Scholar] [CrossRef]
- Zhang, S. High-Speed 3D Imaging with Digital Fringe Projection Techniques; CRC Press: Boca Raton, FL, USA, 2018. [Google Scholar]
- Zhang, S.; Royer, D.; Yau, S.T. GPU-assisted high-resolution, real-time 3-D shape measurement. Opt. Express 2006, 14, 9120–9129. [Google Scholar] [CrossRef]
- Abdi, H. The method of least squares. Encycl. Meas. Stat. 2007, 1, 530–532. [Google Scholar]
- Zhang, S. Absolute phase retrieval methods for digital fringe projection profilometry: A review. Opt. Lasers Eng. 2018, 107, 28–37. [Google Scholar] [CrossRef]
- Suresh, V.; Liu, W.; Zheng, M.; Li, B. High-resolution structured light 3D vision for fine-scale characterization to assist robotic assembly. Dimens. Opt. Metrol. Insp. Pract. Appl. X 2021, 11732, 1173203. [Google Scholar] [CrossRef]
- Cheng, Y.Y.; Wyant, J.C. Two-wavelength phase shifting interferometry. Appl. Opt. 1984, 23, 4539–4543. [Google Scholar] [CrossRef]
- Cheng, Y.Y.; Wyant, J.C. Multiple-wavelength phase-shifting interferometry. Appl. Opt. 1985, 24, 804–807. [Google Scholar] [PubMed]
- Li, B.; Karpinsky, N.; Zhang, S. Novel calibration method for structured-light system with an out-of-focus projector. Appl. Opt. 2014, 53, 3415–3426. [Google Scholar] [CrossRef] [PubMed]
- Li, J.; Zheng, Y.; Liu, L.; Li, B. 4D line-scan hyperspectral imaging. Opt. Express 2021, 29, 34835–34849. [Google Scholar]
- Cui, D.; Li, M.; Zhang, Q. Development of an optical sensor for crop leaf chlorophyll content detection. Comput. Electron. Agric. 2009, 69, 171–176. [Google Scholar]
- Cover, T.; Hart, P. Nearest neighbor pattern classification. IEEE Trans. Inf. Theory 1967, 13, 21–27. [Google Scholar]
- Zheng, Y.; Wang, S.; Li, Q.; Li, B. Fringe projection profilometry by conducting deep learning from its digital twin. Opt. Express 2020, 28, 36568–36583. [Google Scholar] [CrossRef] [PubMed]
- Wang, C.; Pang, Q. The elimination of errors caused by shadow in fringe projection profilometry based on deep learning. Opt. Lasers Eng. 2022, 159, 107203. [Google Scholar] [CrossRef]
- Ueda, K.; Ikeda, K.; Koyama, O.; Yamada, M. Absolute phase retrieval of shiny objects using fringe projection and deep learning with computer-graphics-based images. Appl. Opt. 2022, 61, 2750–2756. [Google Scholar] [CrossRef] [PubMed]
Figure 1.
Physical setup of a FPP system.
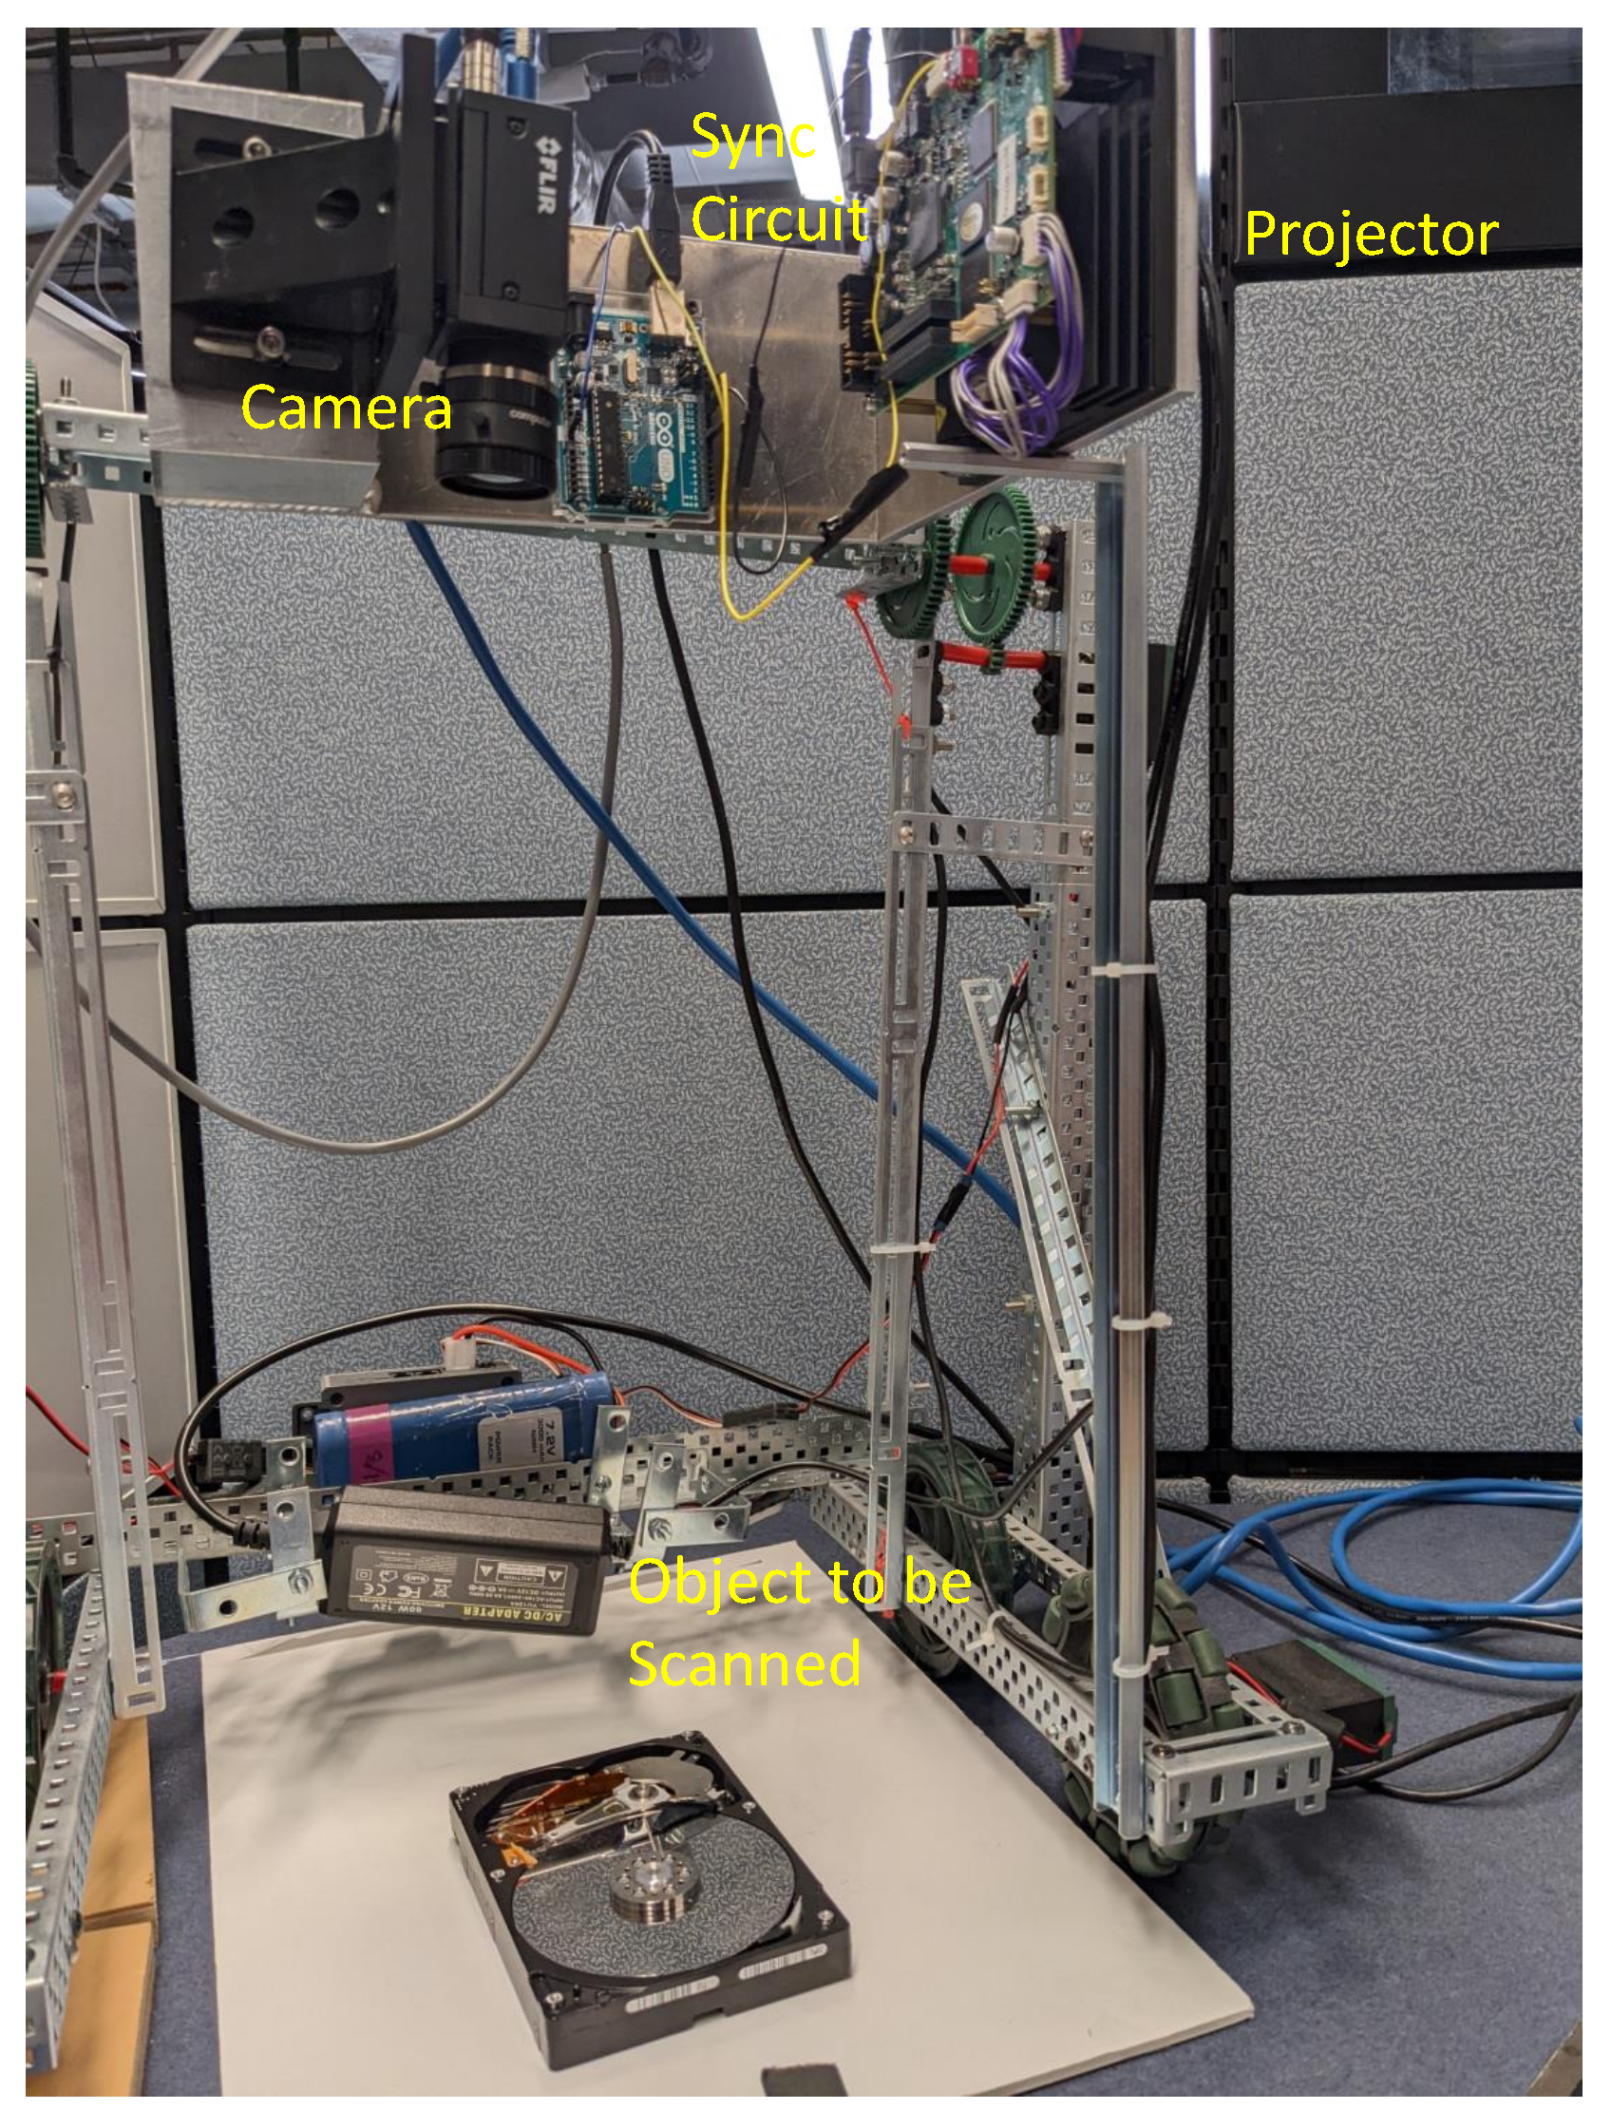
Figure 2.
Operating Principle of Liquid Crystal Display.
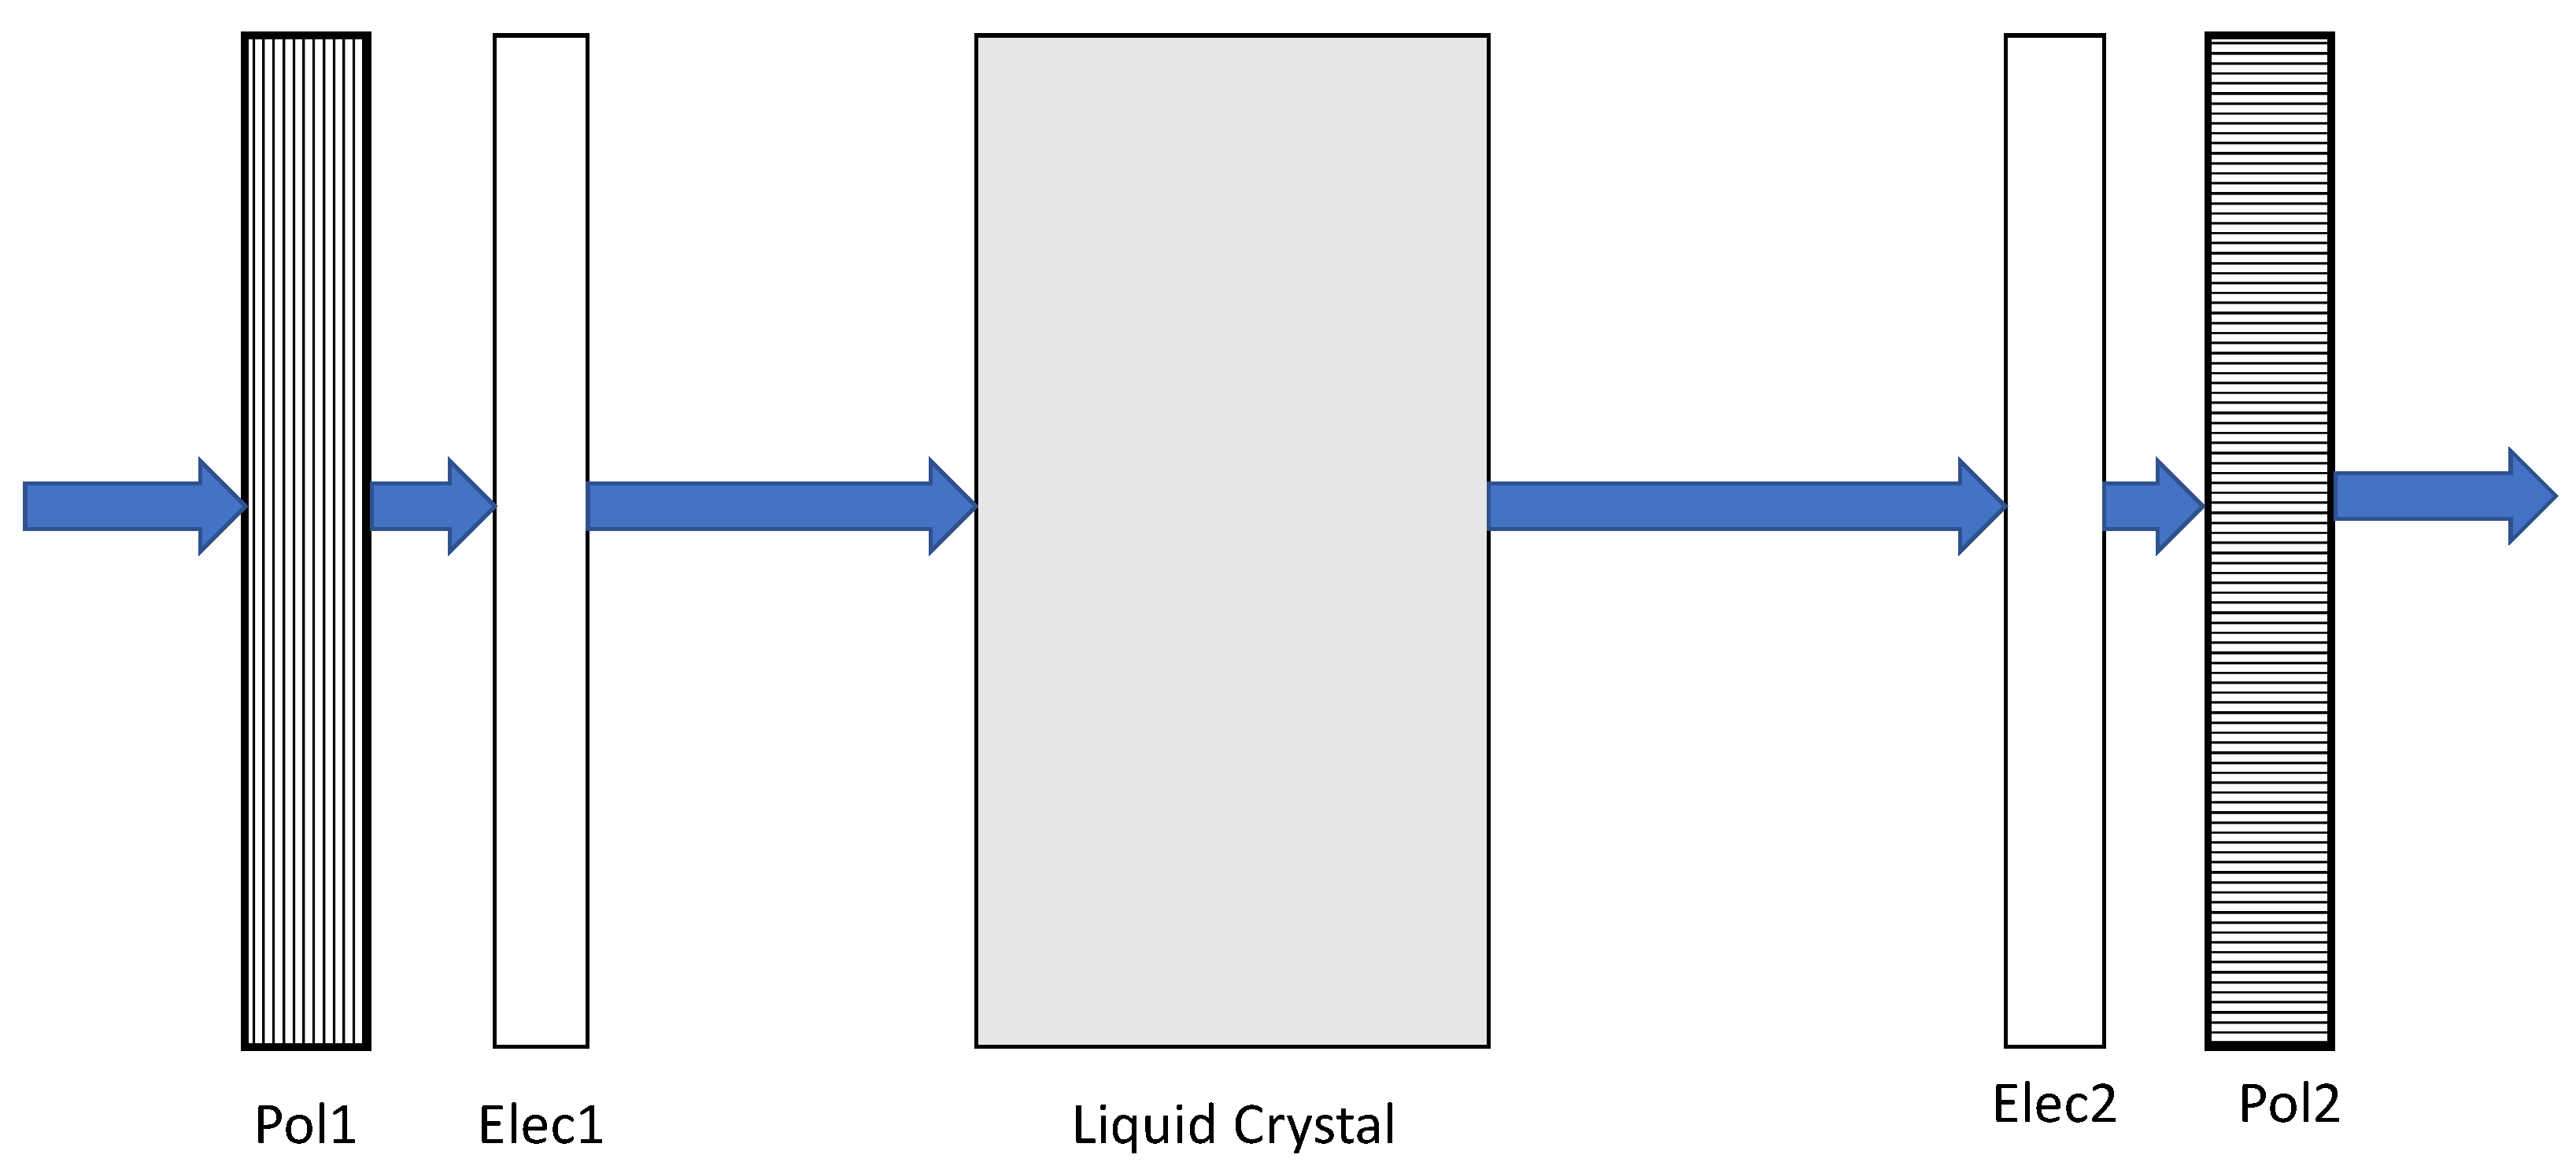
Figure 3.
Optical Switching Principle of Digital Micromirror Device.
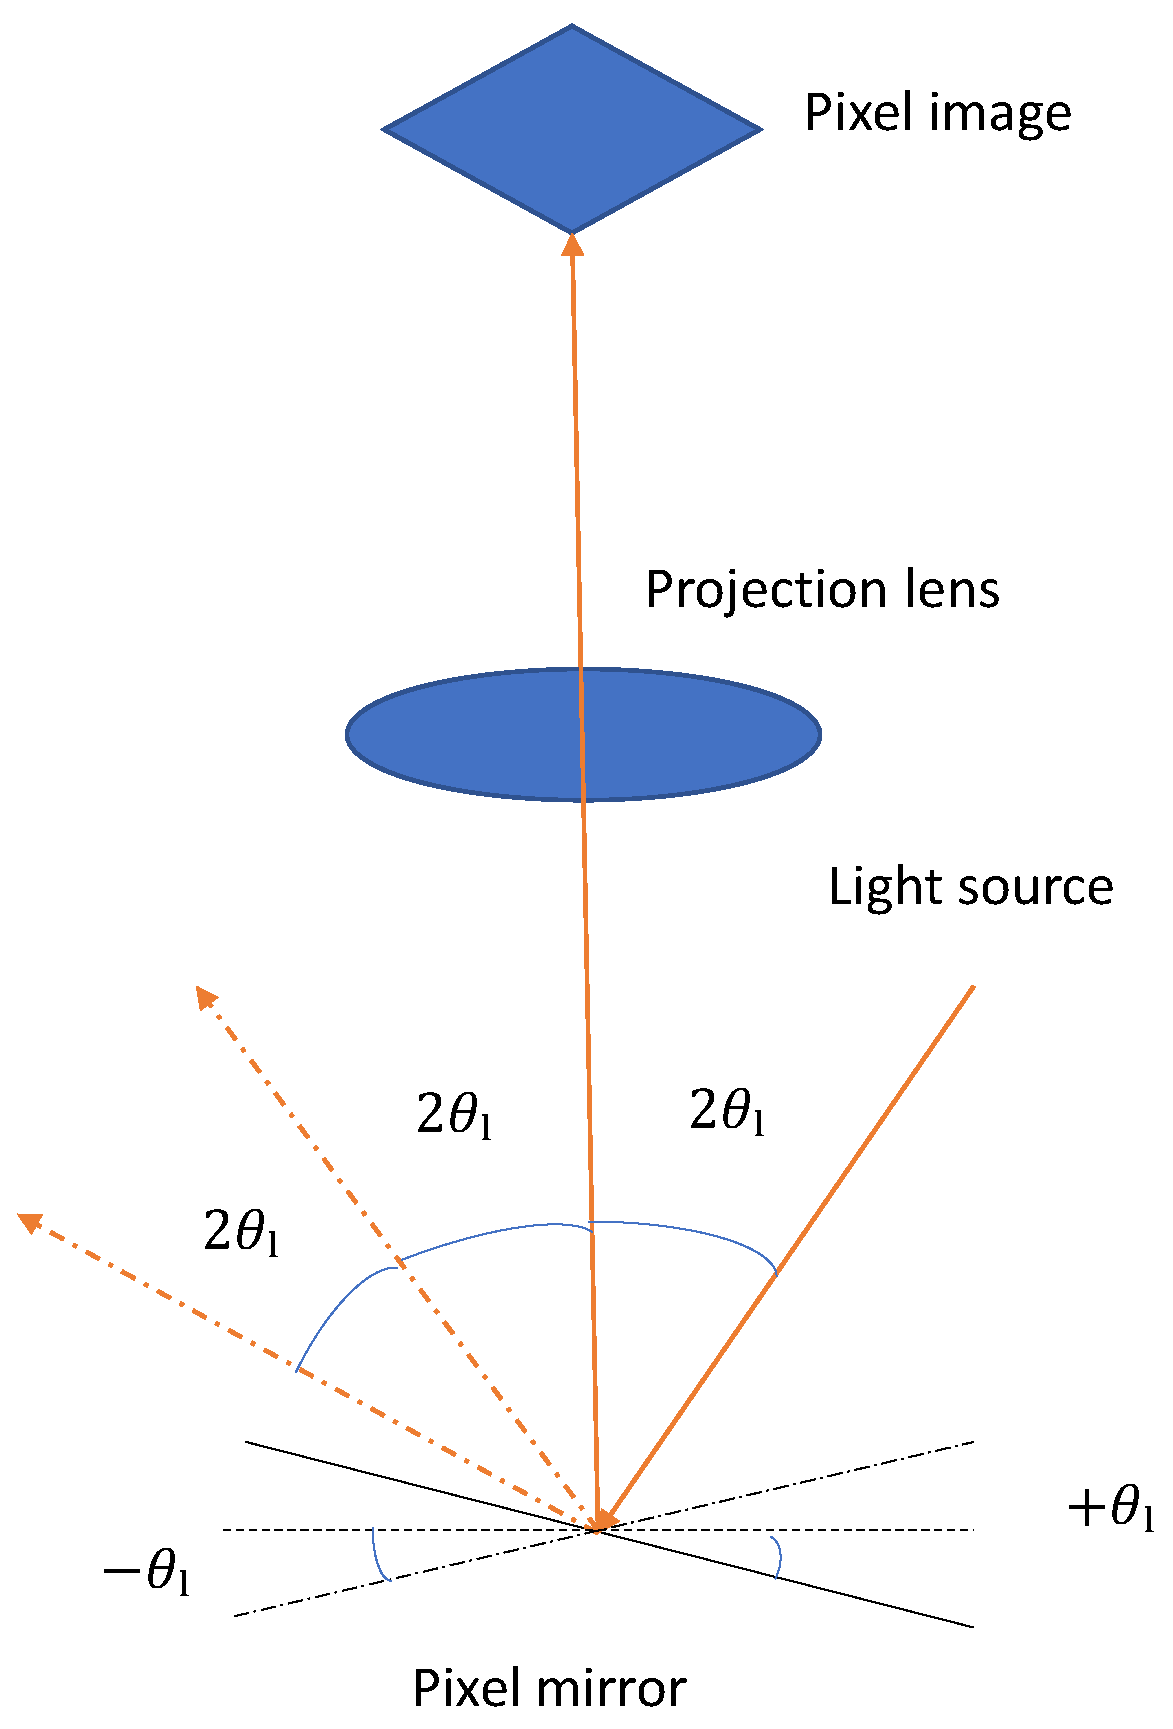
Figure 4.
Configuration of a DLP Projector.
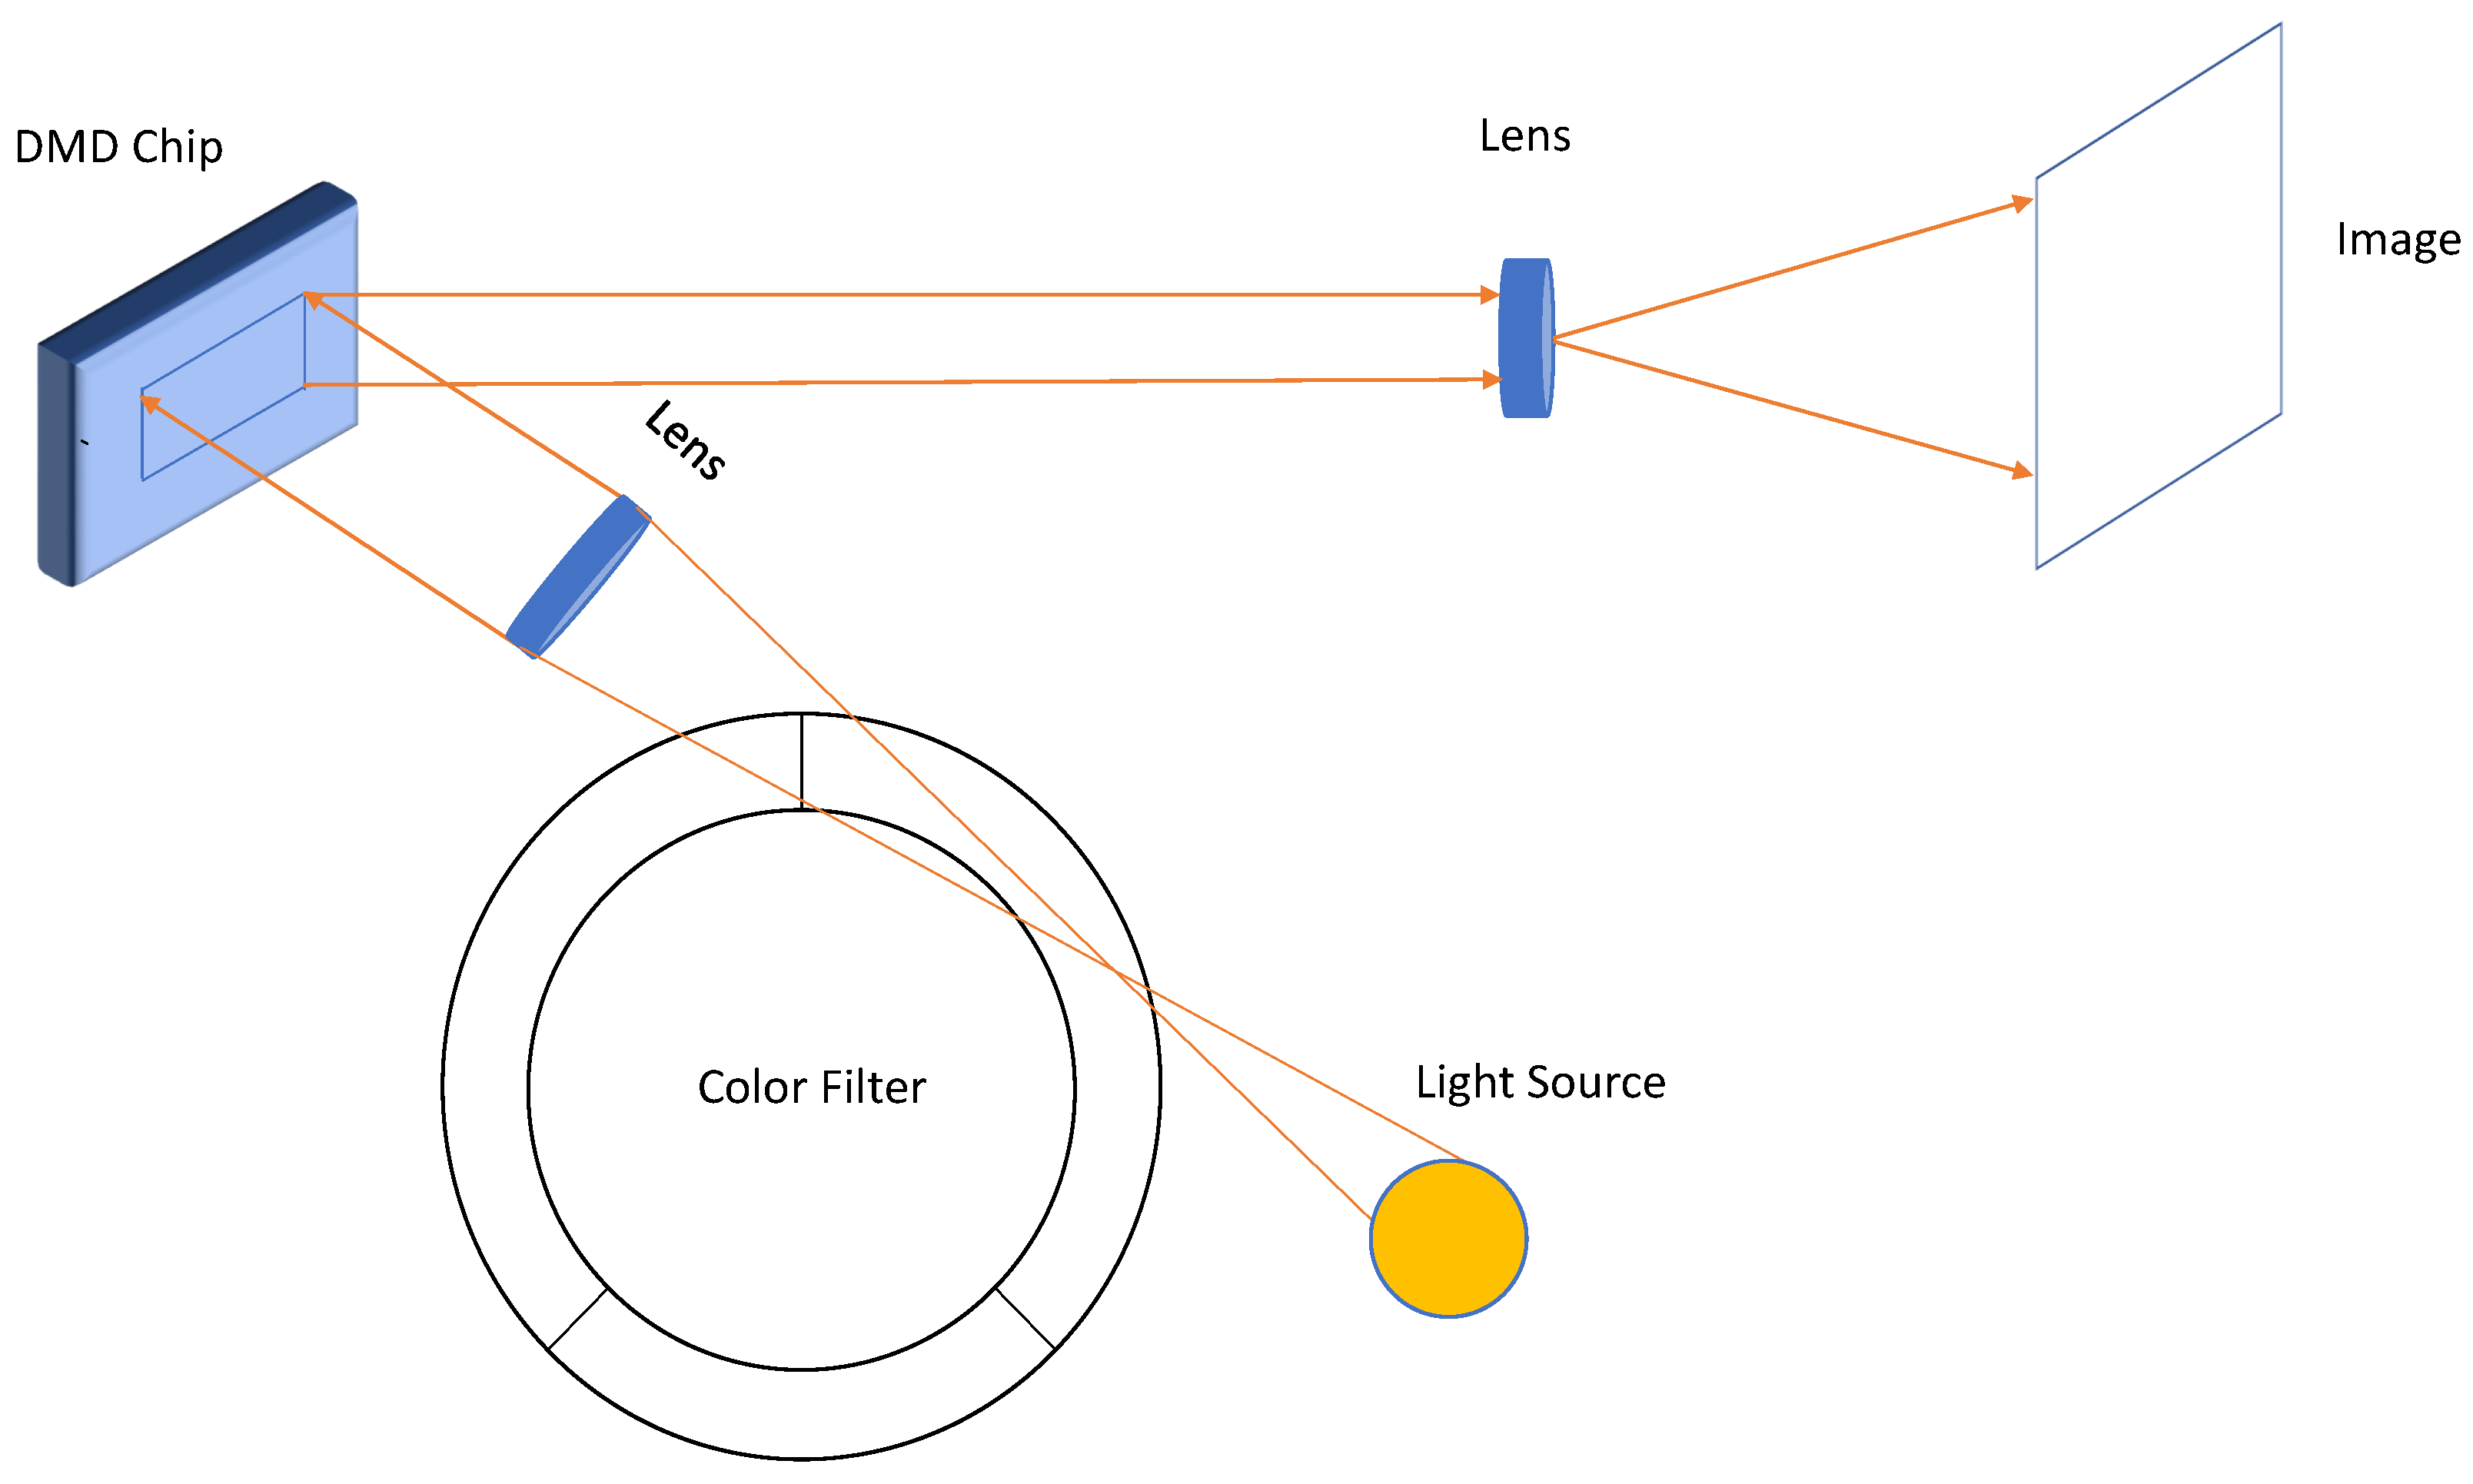
Figure 5.
Operating Principle of Liquid Crystal On Silicon.
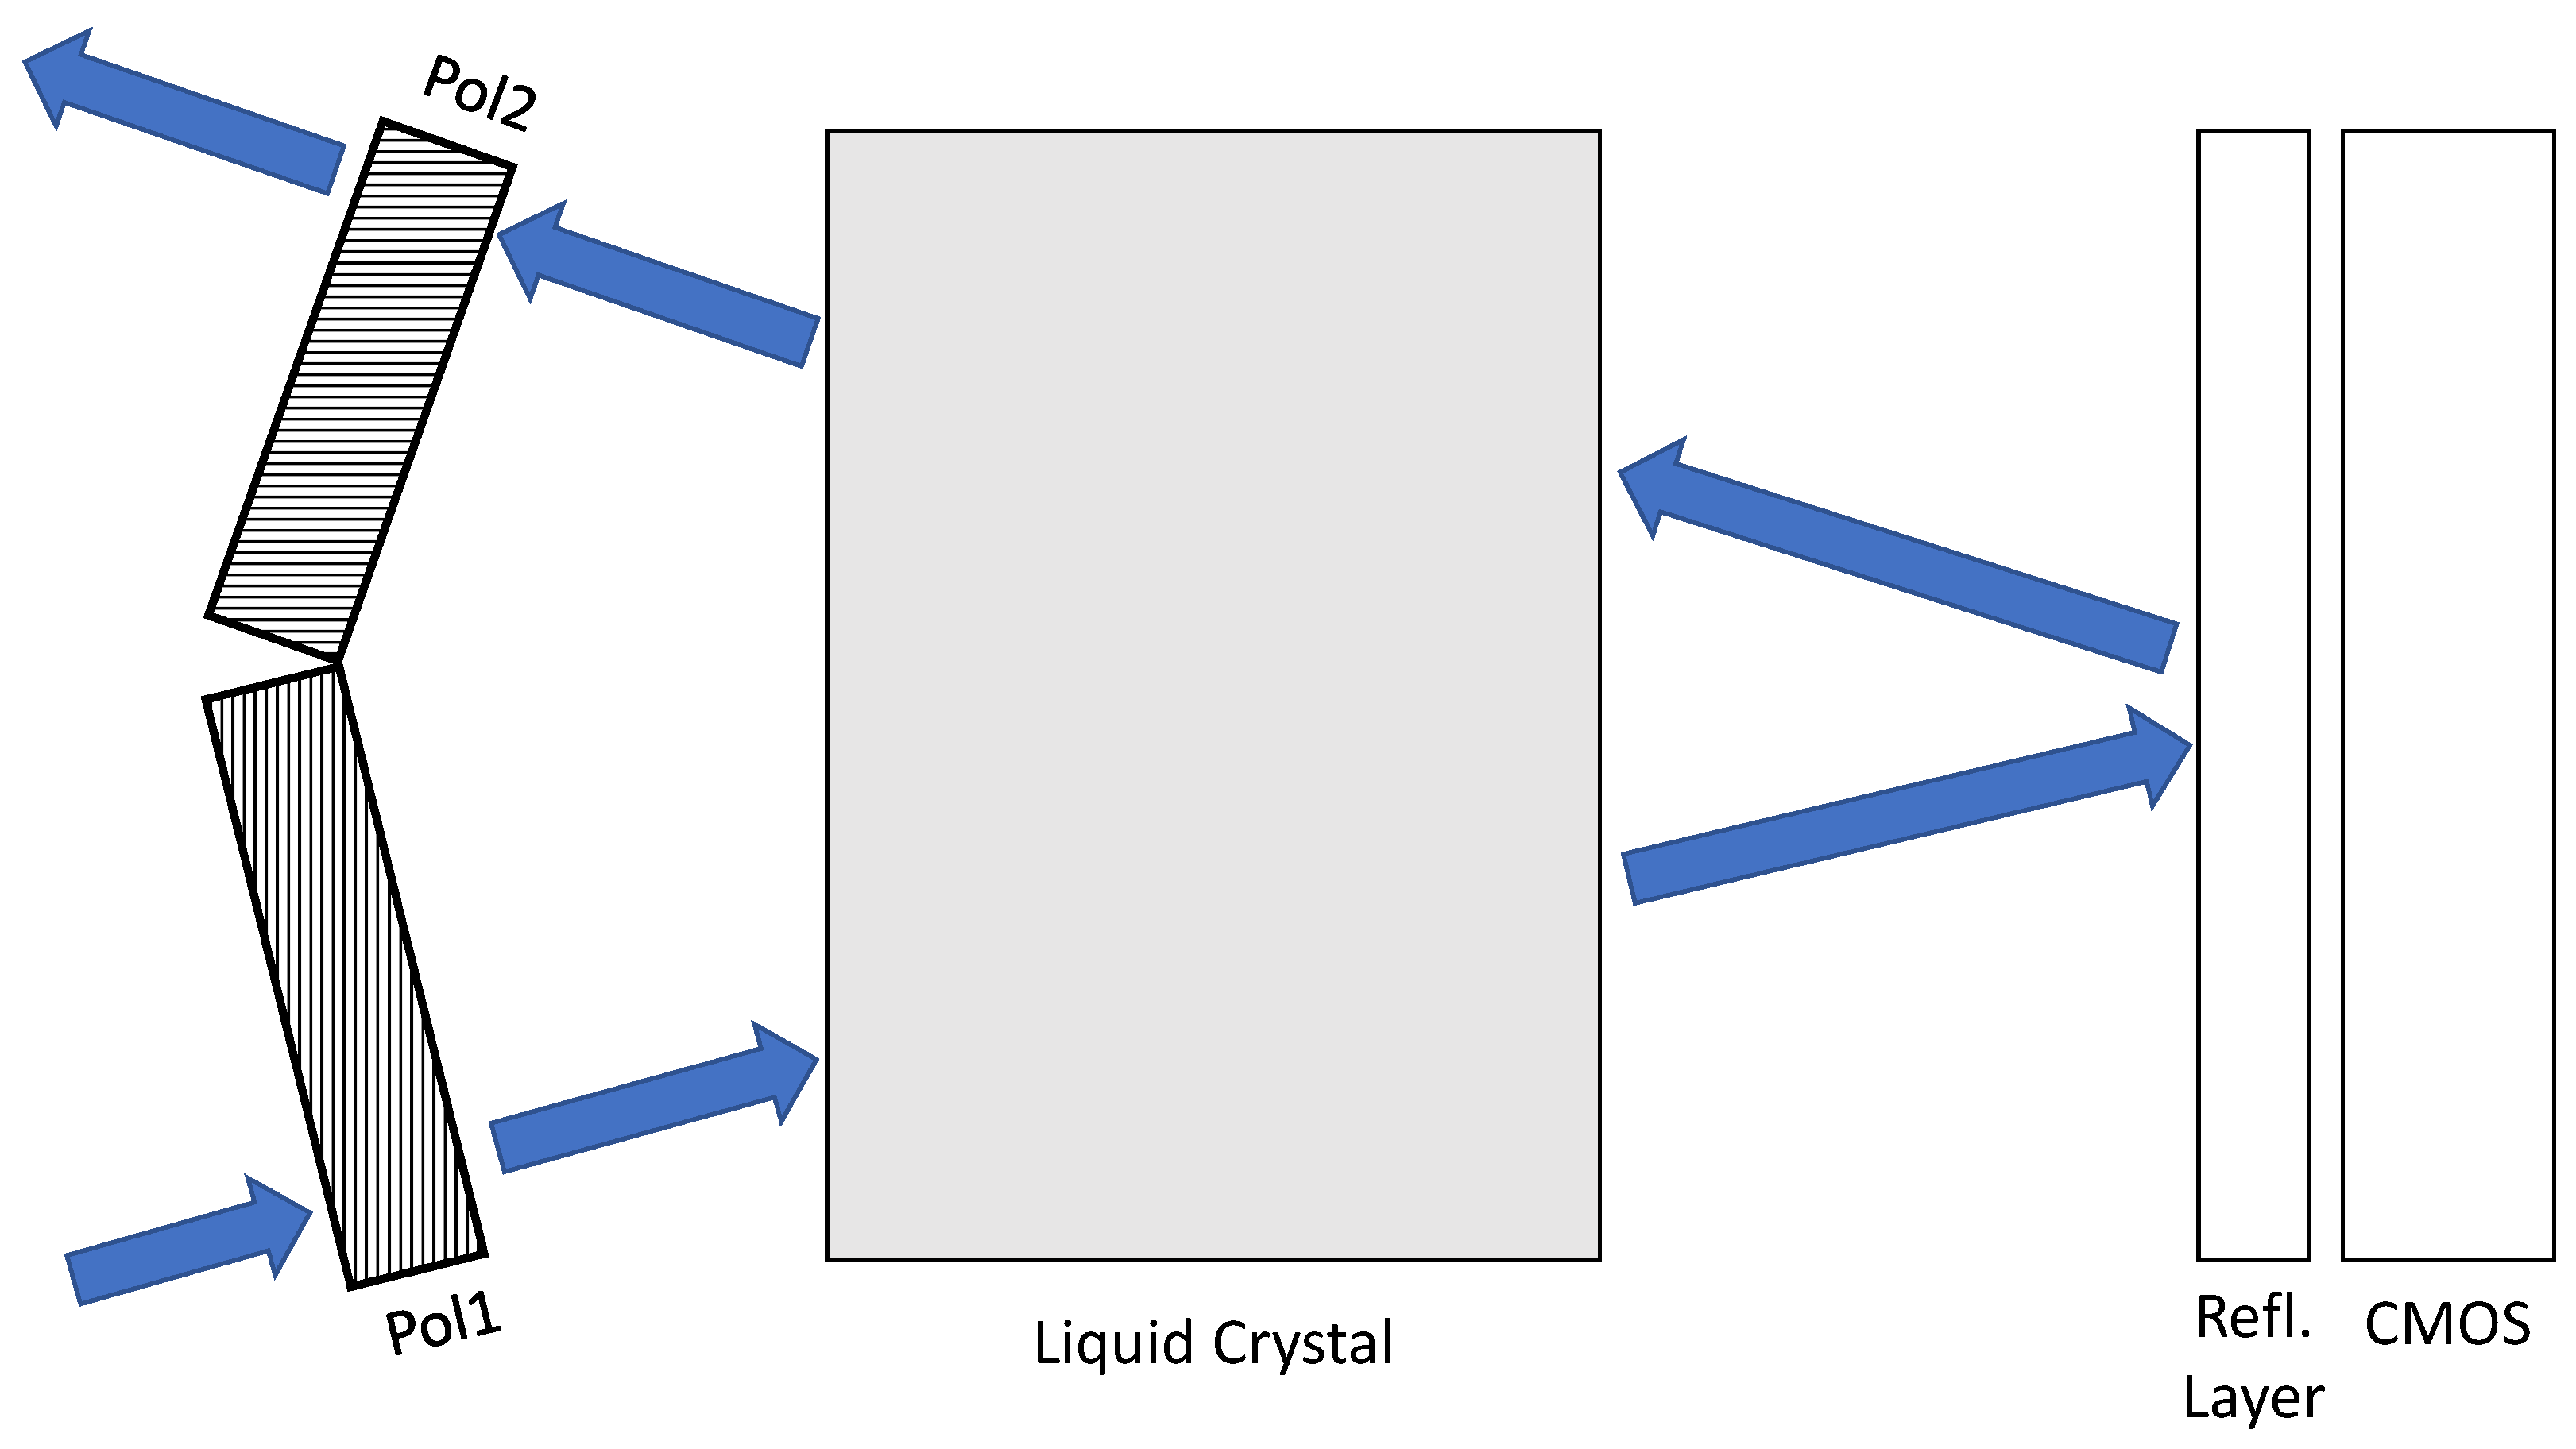
Figure 6.
Example Sinusoidal Phase Shifted Fringe Patterns.
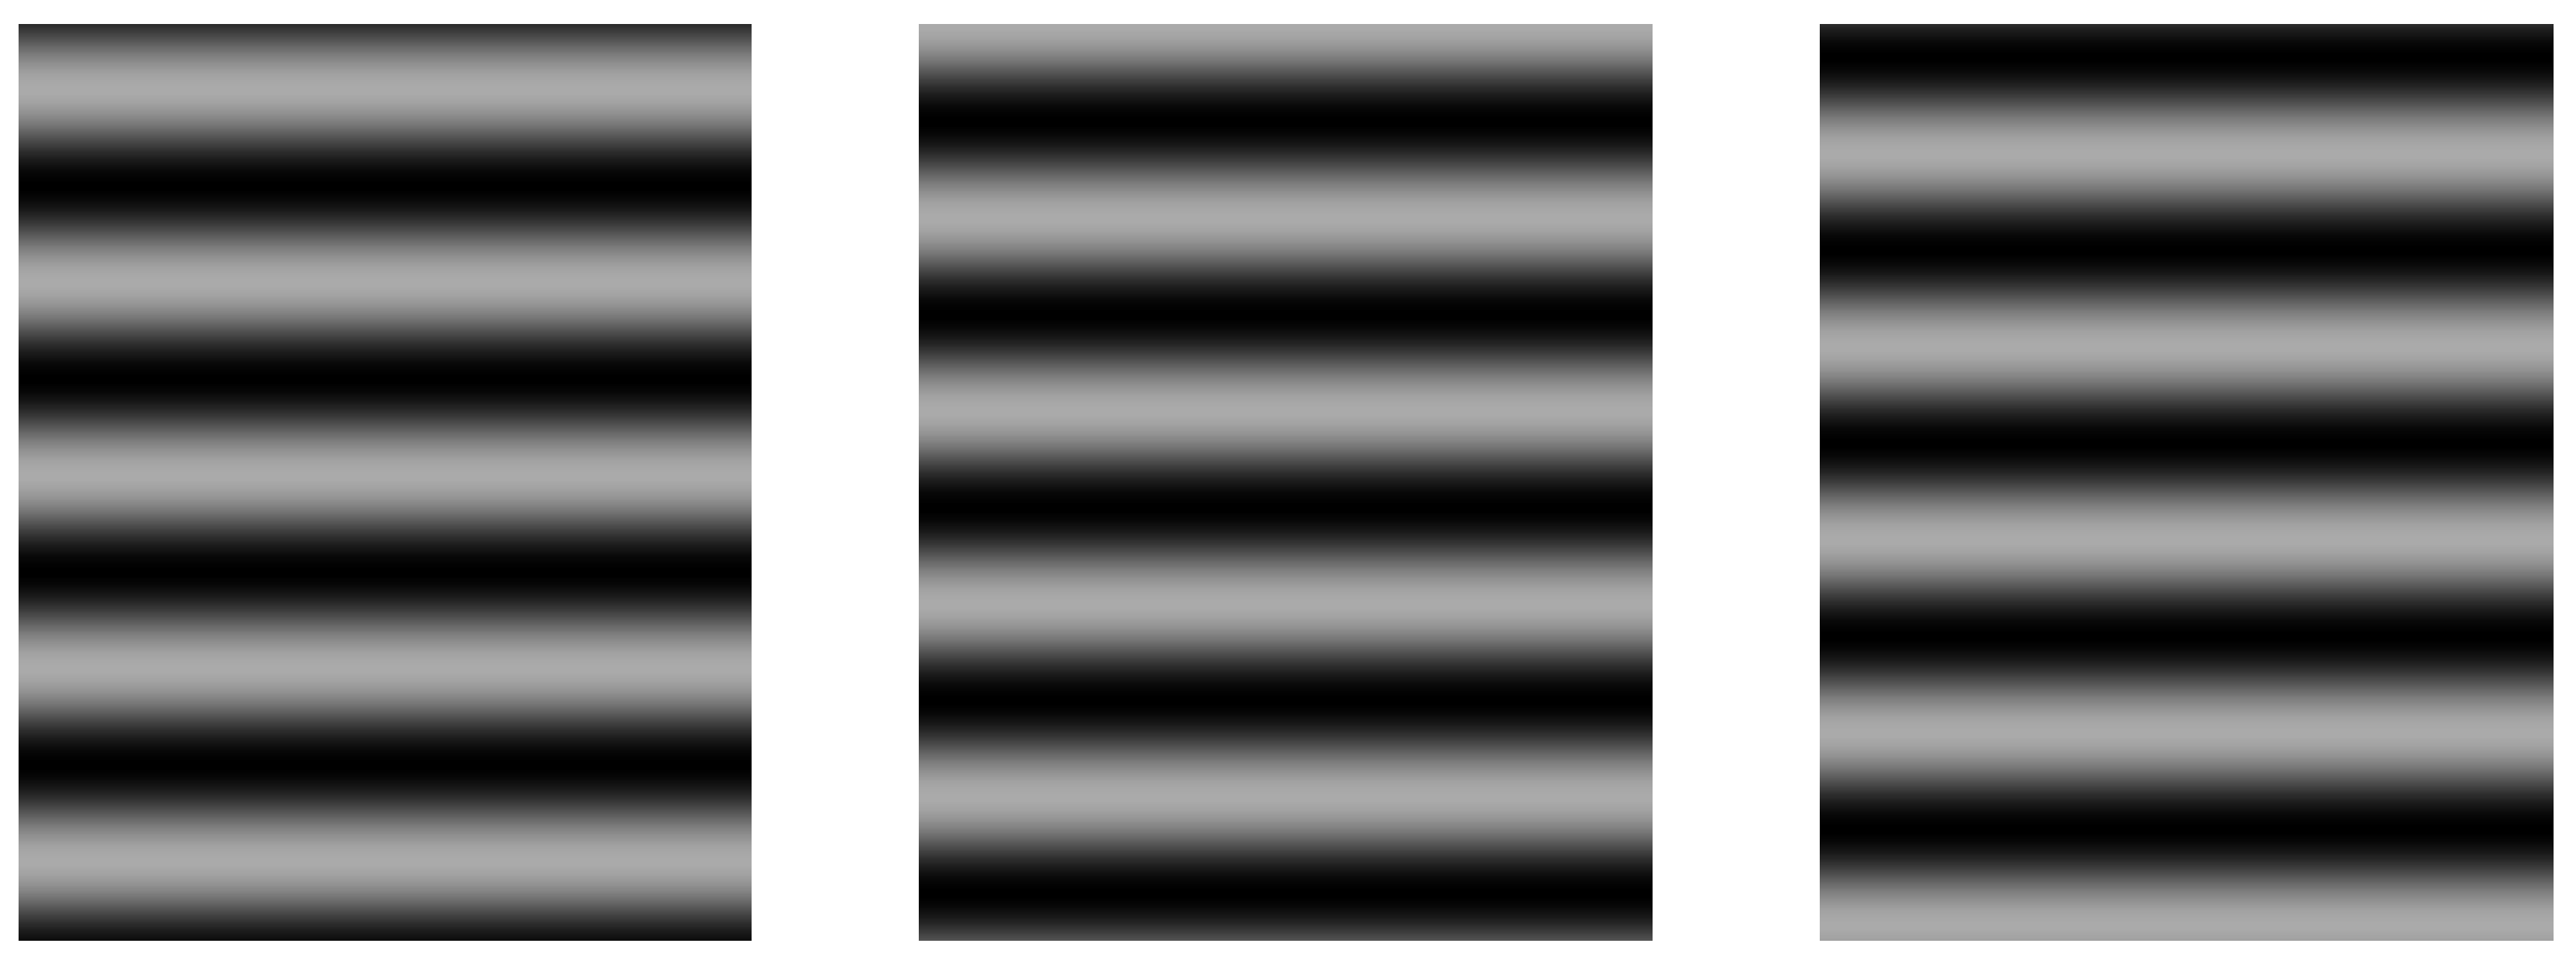
Figure 7.
Schematic of structured light system.
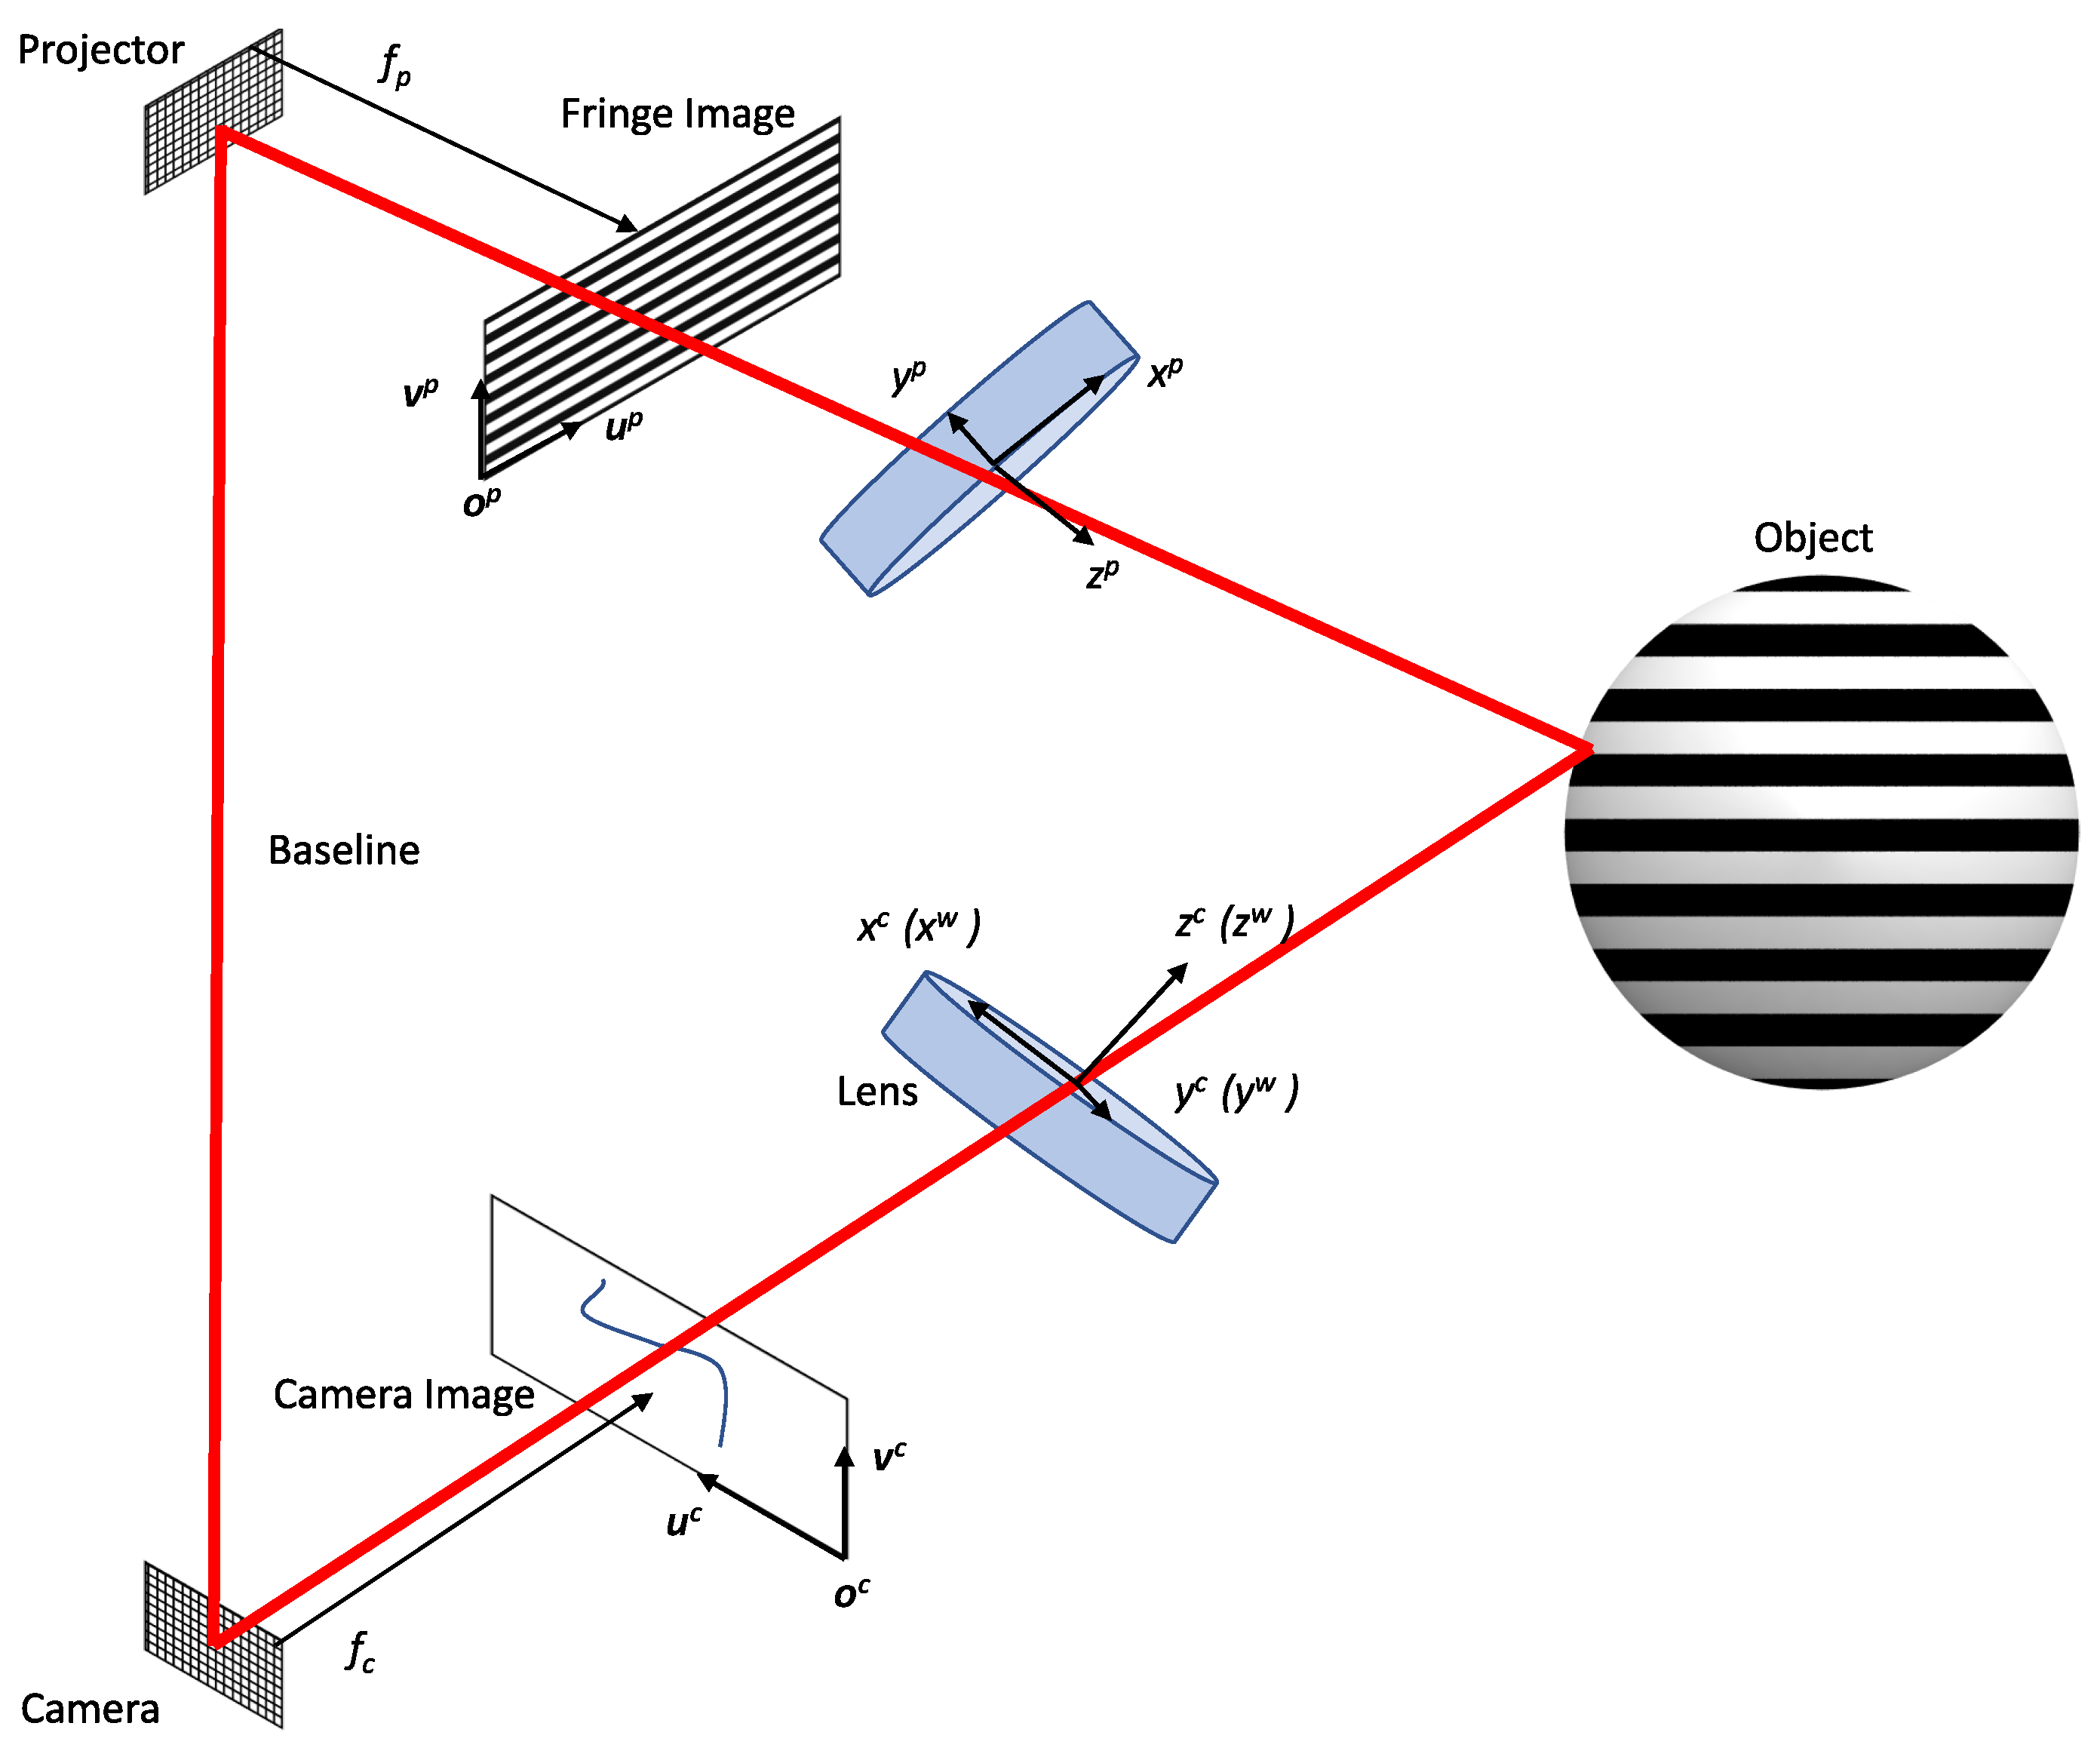
Figure 8.
7 × 21 circle board used for calibration.
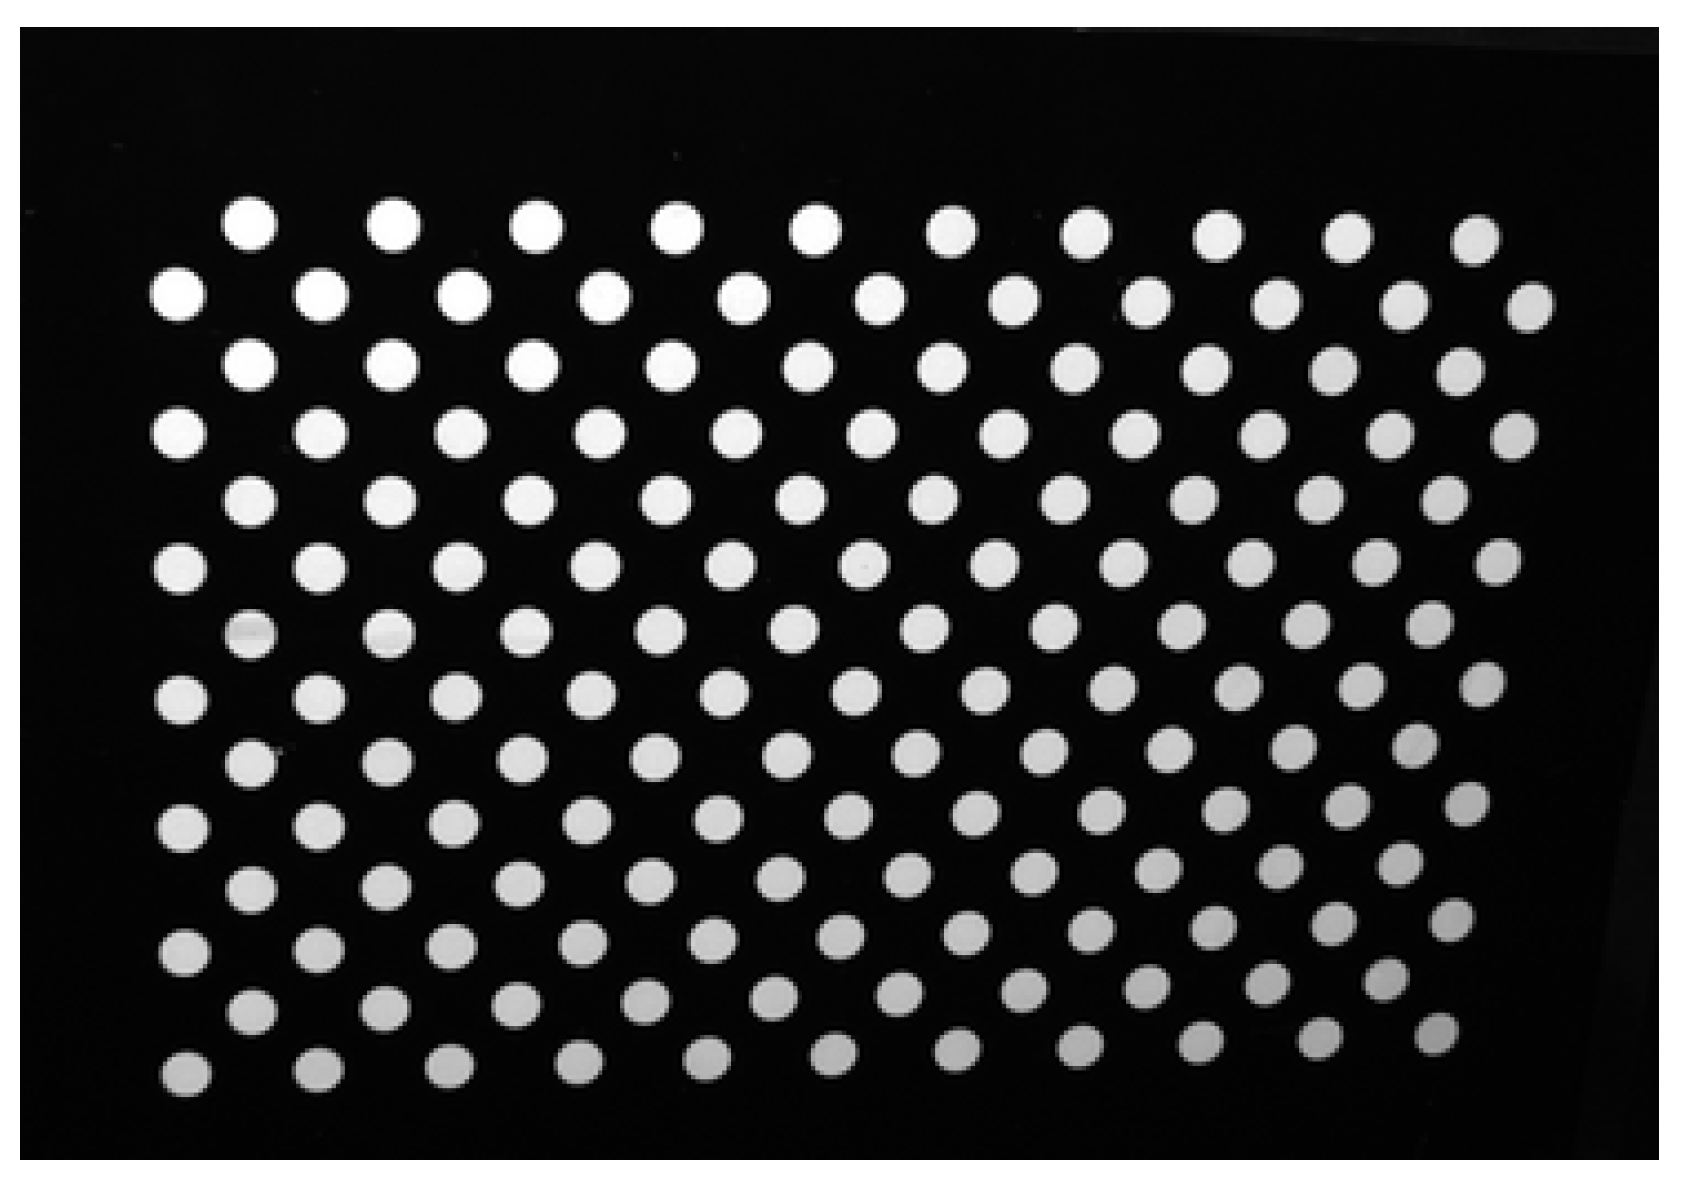
Figure 9.
Physical setup of 4D line-scan hyperspectral imager (reprinted with permission from [55] © The Optical Society).
Figure 9.
Physical setup of 4D line-scan hyperspectral imager (reprinted with permission from [55] © The Optical Society).
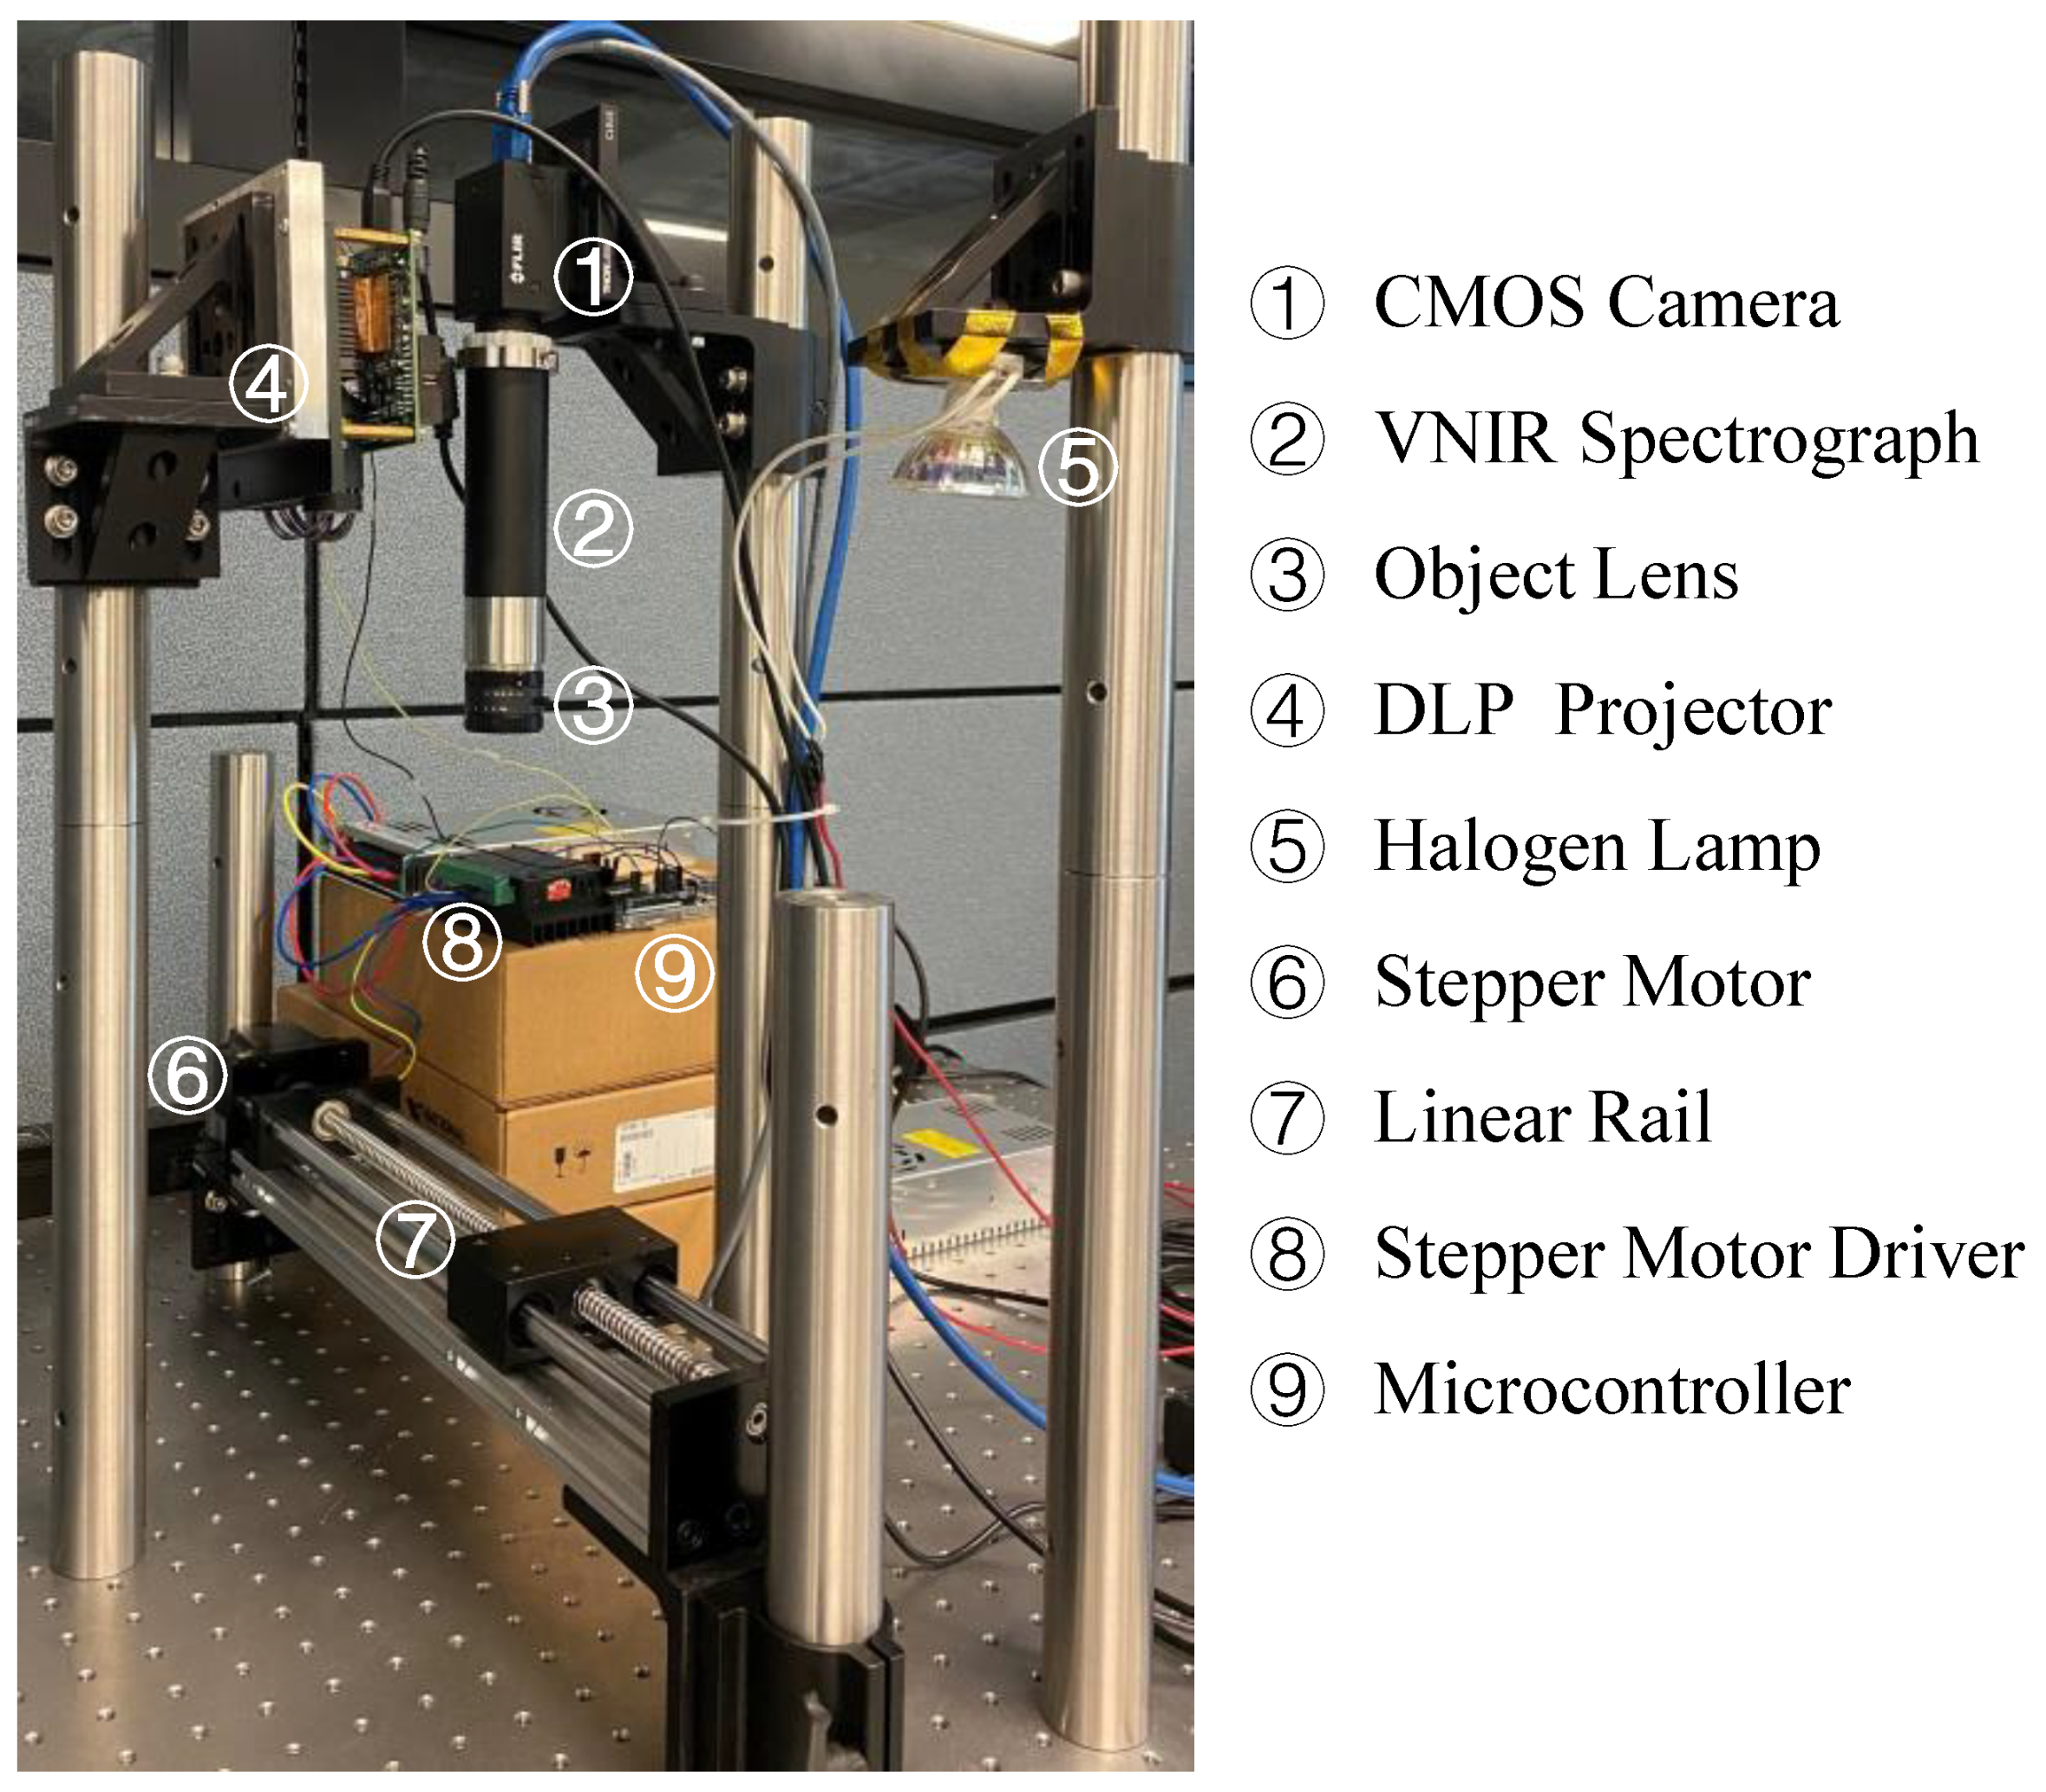
Figure 10.
Schematic diagram of the 4D line-scan hyperspectral structured light imager combining fringe patterns projection, stage moving, and slit images acquisition (reprinted with permission from [55] © The Optical Society).
Figure 10.
Schematic diagram of the 4D line-scan hyperspectral structured light imager combining fringe patterns projection, stage moving, and slit images acquisition (reprinted with permission from [55] © The Optical Society).
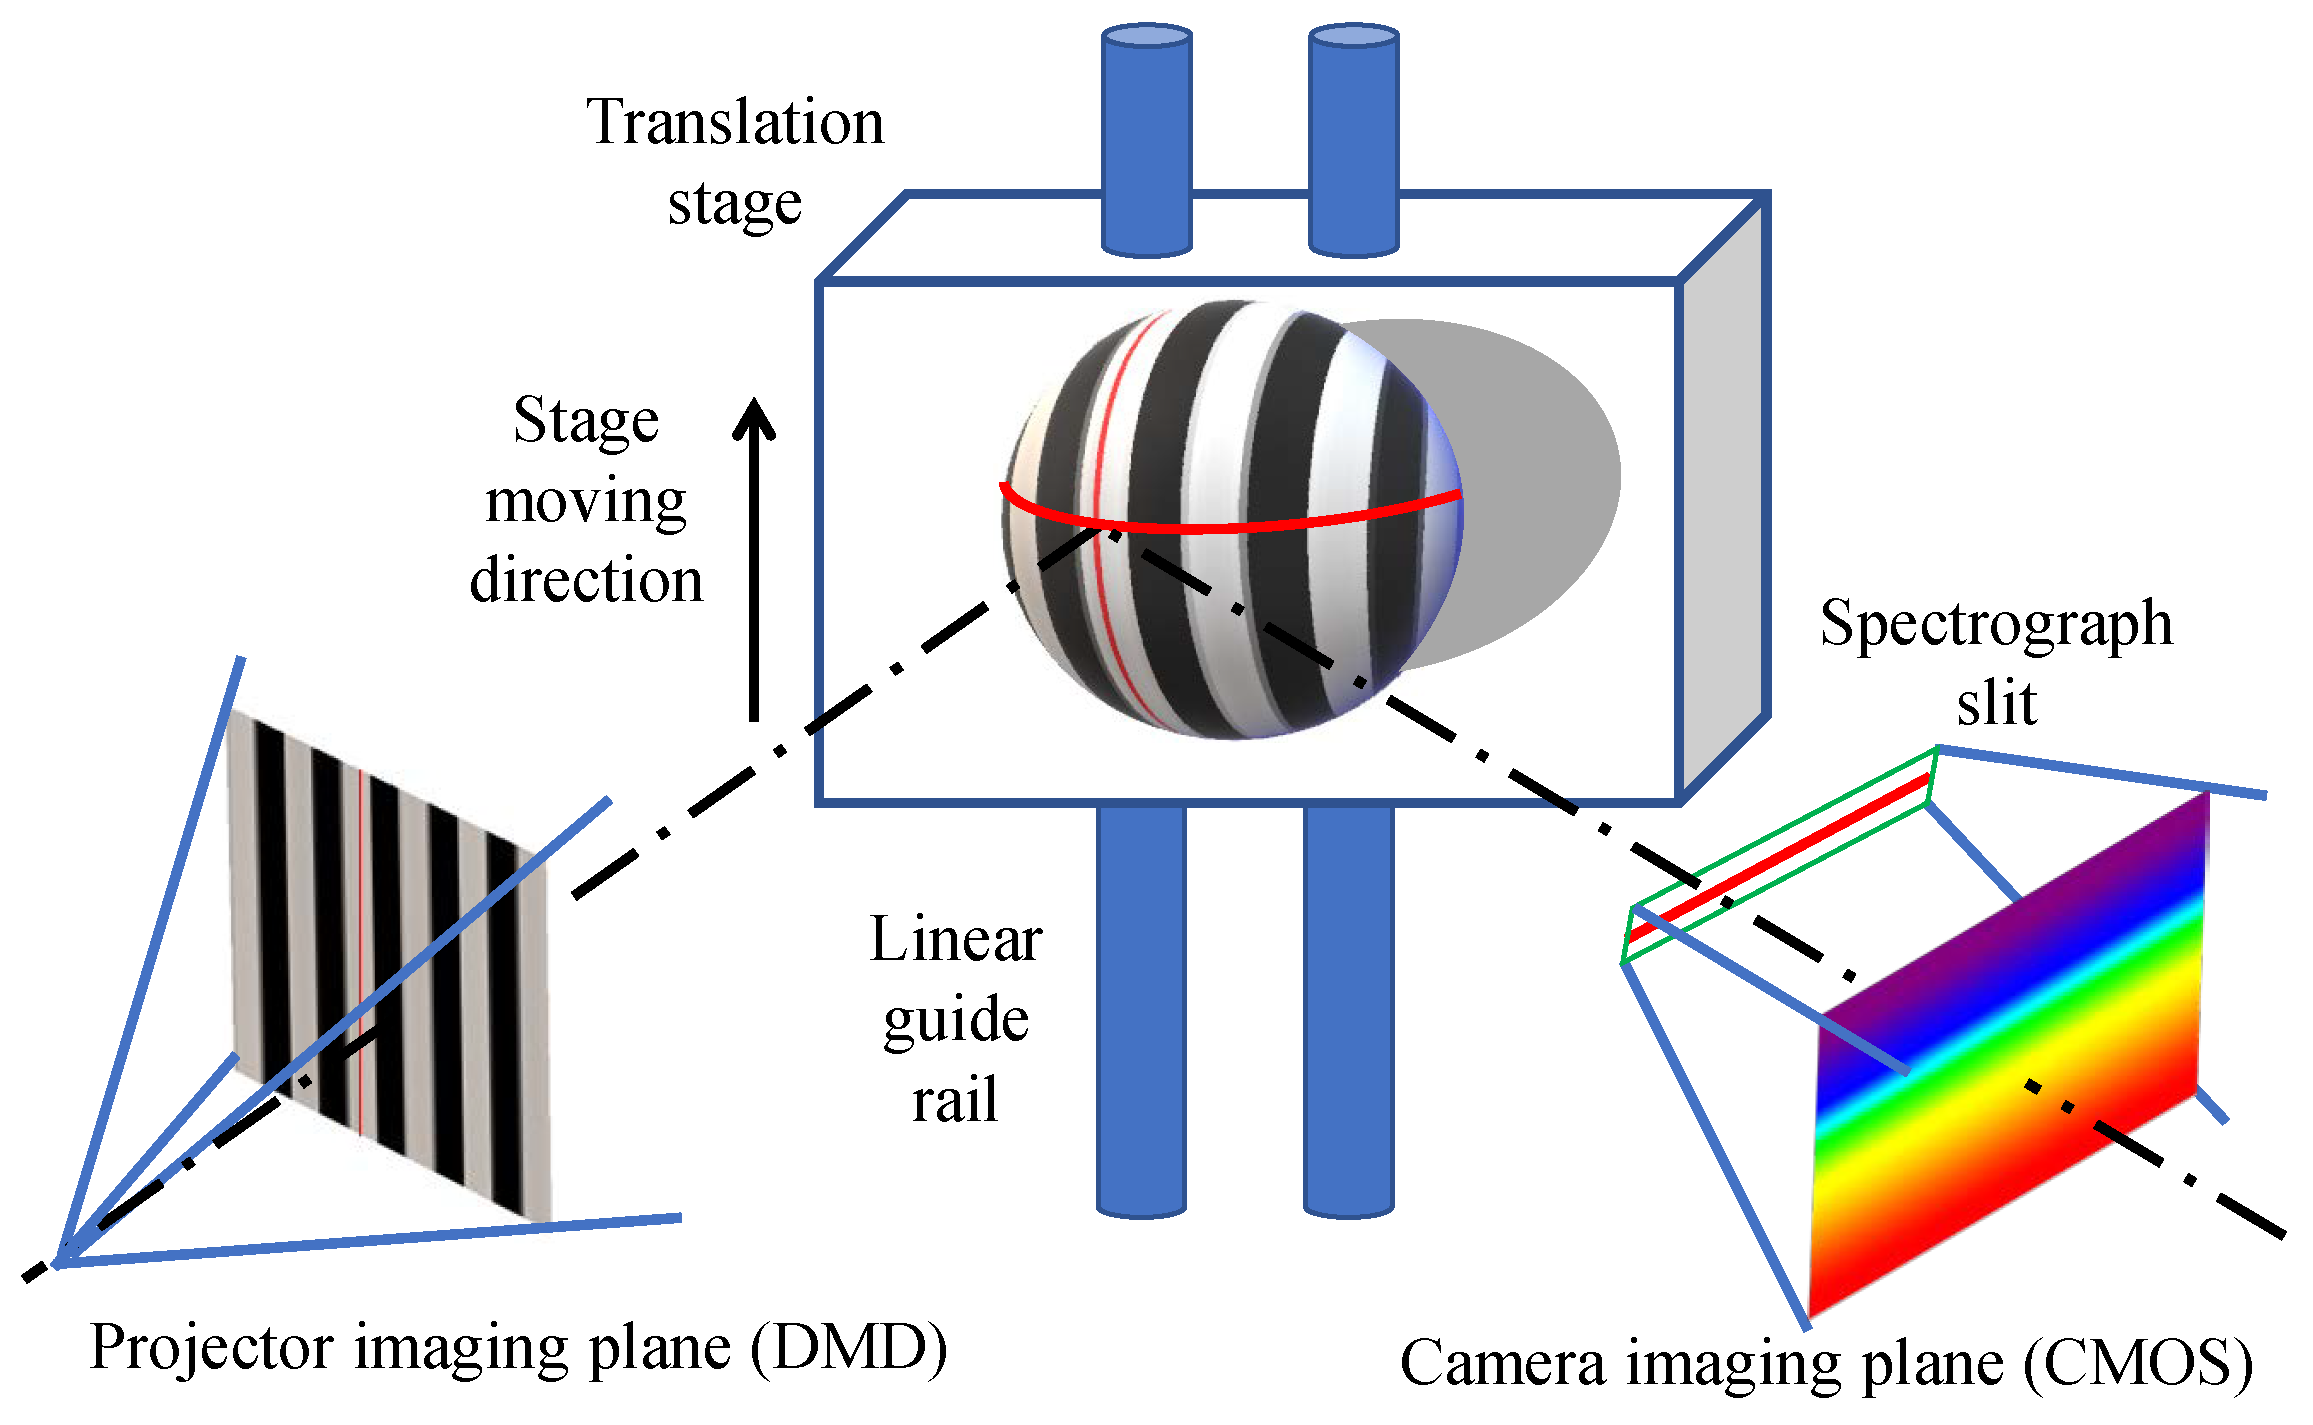
Figure 11.
Sample measurement results of soybean roots with complicated morphology using the FPP technology. (a–d) photographs of the measured root samples; (e–h) corresponding 3D measurement results.
Figure 11.
Sample measurement results of soybean roots with complicated morphology using the FPP technology. (a–d) photographs of the measured root samples; (e–h) corresponding 3D measurement results.

Figure 12.
Reflectance and NDVI of spinach leaves at different fresh levels. (a) RGB images; (b) Reflectance; (c) NDVI images. Pictures reprinted with permission from [55] © The Optical Society.
Figure 12.
Reflectance and NDVI of spinach leaves at different fresh levels. (a) RGB images; (b) Reflectance; (c) NDVI images. Pictures reprinted with permission from [55] © The Optical Society.
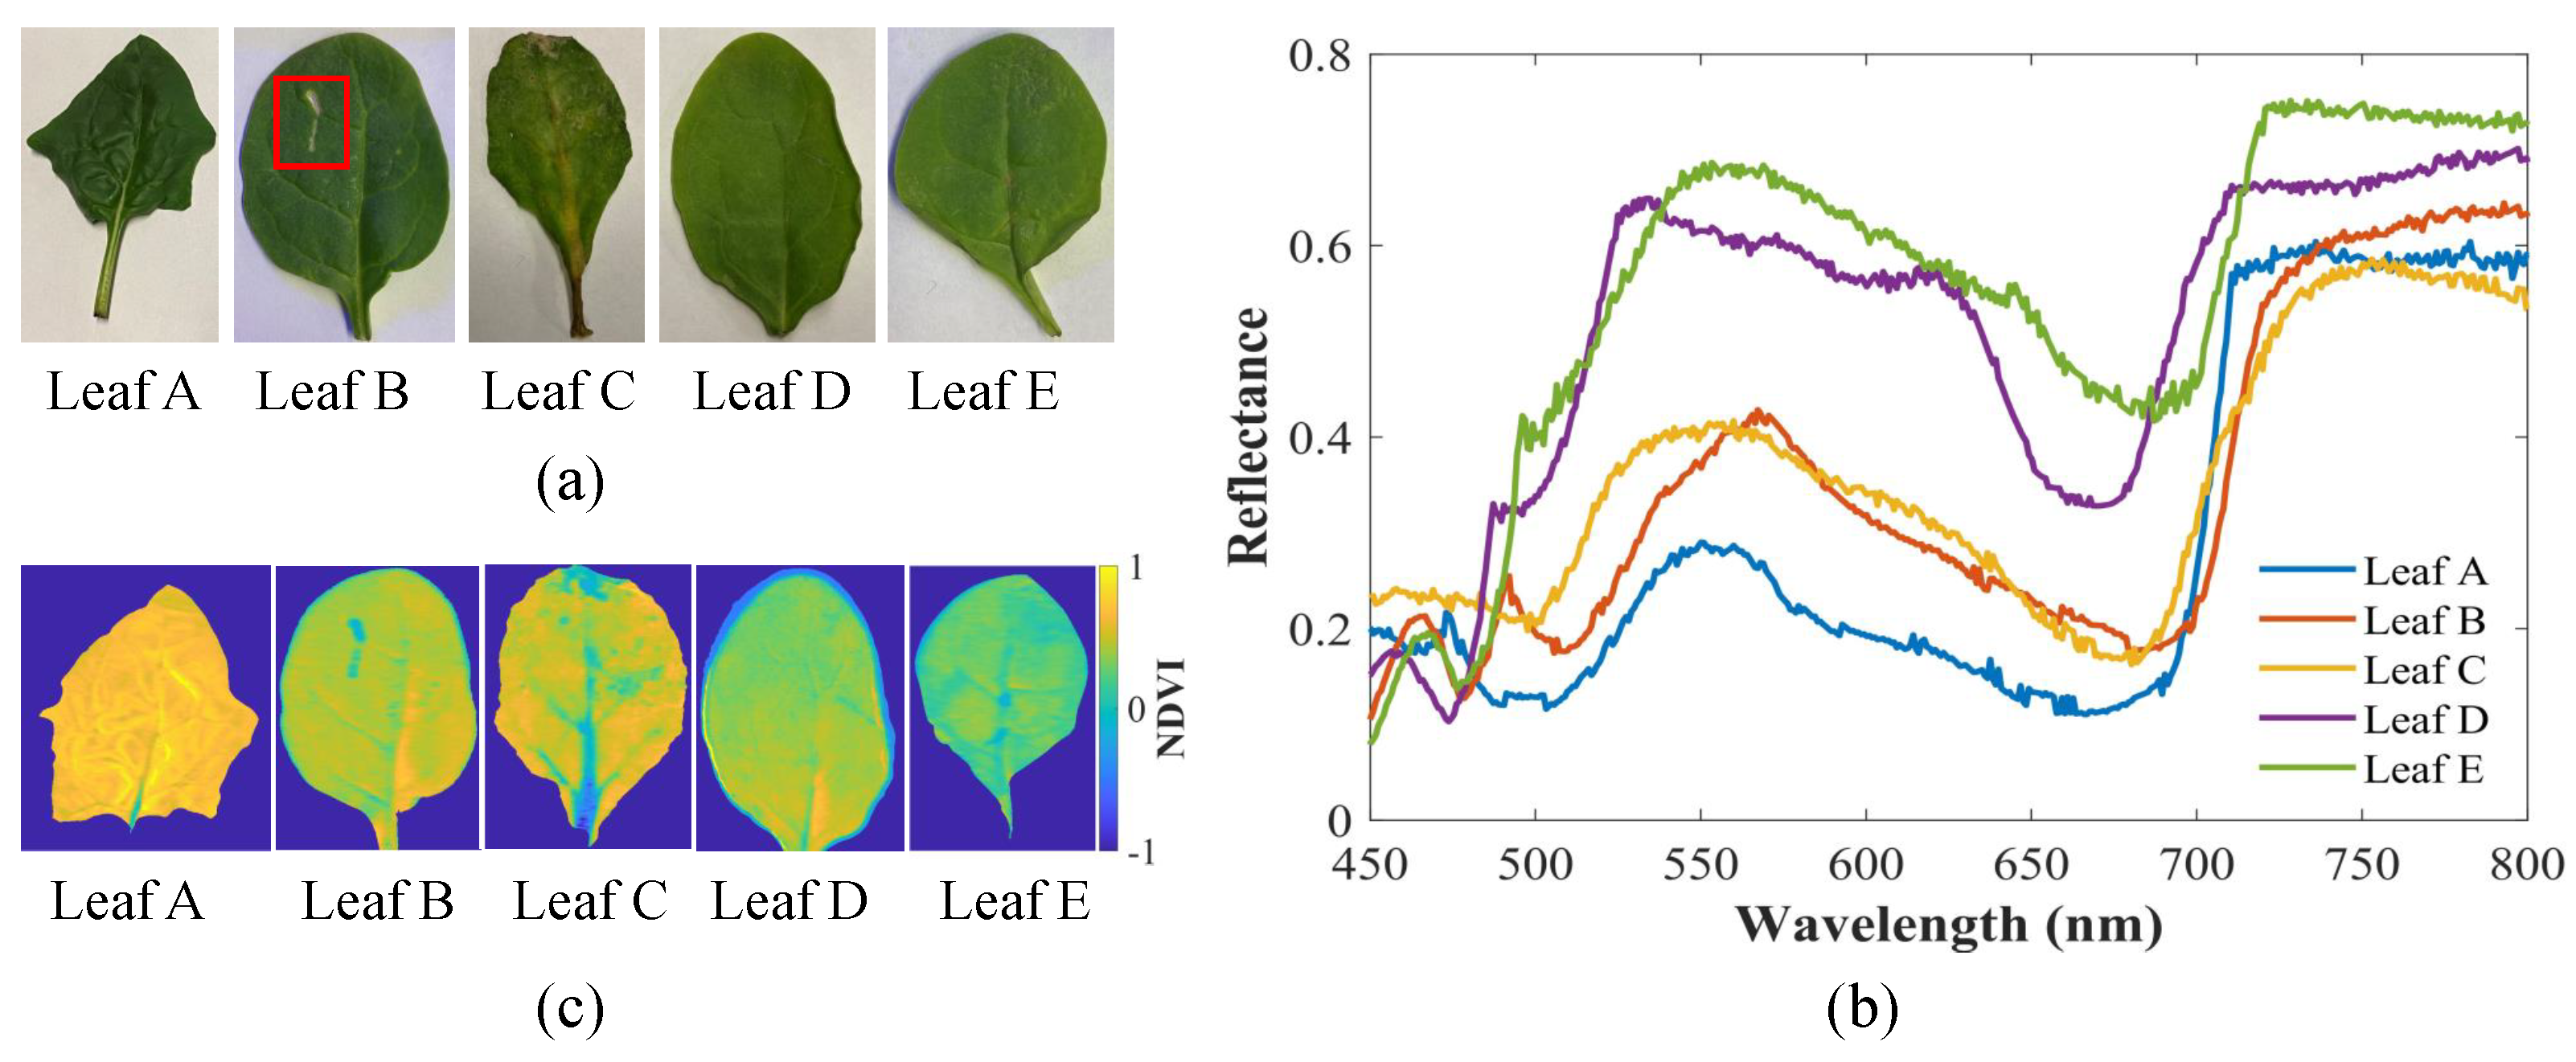
Figure 13.
Defect detection on spinach leaves. (a) RGB image of leaf B with a defect; (b) reconstructed 3D geometry of leaf B; (c) depth gradient of leaf B; (d) Profile and vein of leaf B; (e) NDVI image (f) Reconstructed 3D geometry with NDVI value rendering; (g) results of KNN method; (h) marked defect. Pictures reprinted with permission from [55] © The Optical Society.

Figure 14.
FPP vs. Kinect V2’s TOF Depth Image of a Tree Branch. Both of these images are generated with the resolution of 512 × 424.
Figure 14.
FPP vs. Kinect V2’s TOF Depth Image of a Tree Branch. Both of these images are generated with the resolution of 512 × 424.

Disclaimer/Publisher’s Note: The statements, opinions and data contained in all publications are solely those of the individual author(s) and contributor(s) and not of MDPI and/or the editor(s). MDPI and/or the editor(s) disclaim responsibility for any injury to people or property resulting from any ideas, methods, instructions or products referred to in the content. |
© 2023 by the authors. Licensee MDPI, Basel, Switzerland. This article is an open access article distributed under the terms and conditions of the Creative Commons Attribution (CC BY) license (https://creativecommons.org/licenses/by/4.0/).
Share and Cite
MDPI and ACS Style
Balasubramaniam, B.; Li, J.; Liu, L.; Li, B. 3D Imaging with Fringe Projection for Food and Agricultural Applications—A Tutorial. Electronics 2023, 12, 859. https://doi.org/10.3390/electronics12040859
AMA Style
Balasubramaniam B, Li J, Liu L, Li B. 3D Imaging with Fringe Projection for Food and Agricultural Applications—A Tutorial. Electronics. 2023; 12(4):859. https://doi.org/10.3390/electronics12040859
Chicago/Turabian StyleBalasubramaniam, Badrinath, Jiaqiong Li, Lingling Liu, and Beiwen Li. 2023. "3D Imaging with Fringe Projection for Food and Agricultural Applications—A Tutorial" Electronics 12, no. 4: 859. https://doi.org/10.3390/electronics12040859
Note that from the first issue of 2016, this journal uses article numbers instead of page numbers. See further details here.