Article

Nonlinear Magnetic Model of IPMSM Based on the Frozen Permeability Technique Utilized in Improved MTPA Control

1
Faculty of Technical Sciences, University of Novi Sad, Trg Dositeja Obradovića 6, 21102 Novi Sad, Serbia
2
School of Electrical Engineering, University of Belgrade, Bulevar Kralja Aleksandra 73, 11060 Belgrade, Serbia
*
Author to whom correspondence should be addressed.
Electronics 2024, 13(4), 673; https://doi.org/10.3390/electronics13040673
Submission received: 28 December 2023 / Revised: 18 January 2024 / Accepted: 22 January 2024 / Published: 6 February 2024
(This article belongs to the Special Issue Advances in Control for Permanent Magnet Synchronous Motor (PMSM))

Abstract

:
In this paper, the enhanced nonlinear magnetic model of the low voltage interior permanent magnet synchronous machine (IPMSM) is developed using the frozen permeability (FP) technique in finite element analysis (FEA) FEMM 4.2 software. The magnetic model is derived by obtaining flux saturation maps for a wide range of dq stator currents. Furthermore, the FEA FP technique accounts for the corresponding offset in the flux maps due to the excitation of the permanent magnets, and well as for fitting the coefficients for the curve-fitting procedure. In order to demonstrate the usefulness of the proposed magnetic model, a nonlinear control strategy based on the maximum torque per ampere (MTPA) optimal algorithm for IPMSM is employed. The magnetic model and the MTPA control strategy are validated through a variety of computer simulations based on FEMM 4.2 and MATLAB R2023a software, as well as on a real IPMSM electric vehicle (EV) traction drive experimental setup.

1. Introduction

High power-torque density and good flux-weakening capability are the main features of synchronous machines with magnetically salient rotors, which are widely used in traction drive hybrid and electric vehicle applications [1,2,3]. In this field of application, interior permanent magnet synchronous machines (IPMSM) stand out due to their high efficiency and robustness. In addition to these superior characteristics, various nonlinearity phenomena should also be taken into account when the control strategy for electric vehicle (EV) high performance IPMSM is developed. The process of the initial development of the design and control strategies for these drives, which run at various speeds, with high-performance demands in a variety of working conditions, remains a challenging task.
Operational modes with a wide range of currents and speeds inevitably lead to pronounced local saturations of the IPMSM magnetic circuit. These conditions are additionally expressed in low-voltage drives due to the high current densities, as compared to those of conventional drives. These saturation phenomena induce significant variations in the inductance values along the d and q axes, which are considered constants in the classical magnetic models of IPMSM [4]. Even permanent magnet flux linkage suffers variation due to pronounced magnetic saturation [5,6]. Therefore, parameter variation adversely affects the performance of traditional control strategies based on classical magnetic models [7,8,9]. Due to the magnetic nonlinearity of IPMSM and the emergence of its accompanying issues, the necessity for its more accurate and physically inspired modeling becomes significant [10,11,12,13,14]. The term “magnetic model” of an electric machine refers to the relationship between the currents and their related magnetic flux linkages in the stator windings. It is possible to represent these analytical functions by the stator flux functions of the d and q axis stator currents, or alternatively, by their inverses (the stator current functions of the d and q axis stator fluxes). This is the most effective model for studying the nonlinear behavior of IPMSM, especially in the case of pronounced magnetic saturation and the cross-saturation effect.
Different analytical prototype functions for fitting flux linkage maps are addressed in the overview of Ref. [10]. In Ref. [11], model predictive control for nonlinear PMSM drives is implemented, based on flux linkage maps in which self-saturation and cross-saturation effects are noticeable. In Ref. [12], a simple bivariate quadratic prototype polynomial function to approximate the flux linkage maps of PMSM is proposed. However, the shortcoming of this approach using a low order polynomial function is that it is not suitable for the profoundly nonlinear functions of highly utilized drives. To solve this sort of problem, Ref. [13] introduces several sets of parameters for different ranges of currents to fit flux maps in the whole operational range of drive. This method of defining the prototype function requires the use of a large number of parameters and a piecewise continuous function, which is not a globally differential function. An artificial intelligence approach using a neural network is proposed in Ref. [14] in order to obtain flux maps of highly nonlinear PMSM drives. The development of a complex radial basis function neural network requires a vast number of parameters, causing a high computational burden.
Certainly, approaches using FEA for flux map calculation are also widespread in the literature [8,15,16,17]. In Ref. [15], the magnetic model is based on a classical approach using FEA, where values of inductivities in the d and q axes and permanent magnet flux linkage for different operating points of IPMSM are calculated and stored in the standard look-up table (LUT) form. For the design process optimization of a hybrid permanent magnet variable-flux machine [16], frozen permeability is effectively employed for torque component separation. The inverse flux maps of IPMSM were obtained using FEA in Ref. [17], but this technique does not account for the offset in the inverse flux map resulting from the excitation caused by permanent magnets. The frozen permeability technique is also used in Ref. [8], where it was solely applied to determine the inductance, which was subsequently employed in a straightforward manner as constant values in the control algorithms. Unquestionably, improved magnetic models are highly useful for implementing advanced control techniques [18,19,20].
The magnetic model in this paper is derived using the frozen permeability technique, enabling the improved and more precise modeling and fitting of inversed flux maps for a wide range of stator currents. The novelty of such derived inversed flux maps is that their utilization is appropriate for high performance IPMSM electric vehicle (EV) traction drives in which nonlinearity and parameter uncertainties are frequently expressed.
The application of advanced control structures is essentially focused on ultimately accounting for magnetic nonlinearity effects in order to achieve the intrinsic superior performance of IPMSM drives. A nonlinear control strategy based on the maximum torque per ampere (MTPA) optimal algorithm for IPMSM has been implemented using the developed nonlinear magnetic model to demonstrate its effectiveness and accuracy.
Using both an experimental IPMSM traction drive setup and computer simulations based on FEMM 4.2 and MATLAB R2023a software, the suggested highly accurate magnetic model and improved MTPA control technique are validated. A very good match with the trajectories generated using the suggested nonlinear magnetic model is confirmed, based on the optimal MTPA trajectory that has been determined experimentally.

2. State-Space Nonlinear Model of IPMSM

For the purpose of developing the nonlinear magnetic model IPMSM in the form of the proposed inverse flux maps, it is necessary to make some alterations to the conventional models. The conventional voltage vector equations of IPMSM in the dq reference frame must be represented in a different manner to obtain a state-space form, in which the state variables are stator flux linkages. Therefore, the stator voltage equations are rewritten as:
d ψ d s d t = V d s R s i d s + ω m ψ q s d ψ q s d t = V q s R s i q s ω m ψ d s
where i d s and i q s are the stator current components, ψ d s and ψ q s are the stator flux linkage components, V d s and V q s are the voltage components, ω m is the synchronous electric angular speed of the rotor, and R s is the stator resistance.
In highly saturated modes of operation, where the nonlinearities of the magnetic model cannot be neglected, IPMSM drives cannot be controlled by magnetic models based on constant parameters such as d and q axis inductivities and permanent magnet flux linkage. To solve this problem and to devise a highly accurate magnetic model of the machine, the inversed flux maps for a wide range of stator currents in the dq axis current plane must be obtained. The inverse flux linkages are then precisely defined as nonlinear functions of both current components of the dq reference frame as:
i d s = f 1 ψ d s , ψ q s   i q s = f 2 ψ d s , ψ q s  
The nonlinearity of IPMSM inverse flux maps is originally a natural effect caused by self- and cross-saturation of the magnetic circuit. The electromagnetic torque ( T e ) of IPMSM is physically produced from the interaction of currents and flux linkages, as described by Equation (3):
T e = 3 2 p ψ d s i q s ψ q s i d s
where p   represents the pole pairs.
To complete the basic set of IPMSM model equations, a mechanical equation is defined as:
d ω m d t = p J m T e T L B ω m
where J m   is the drive moment of inertia, T L is the load torque, and B is the frictional coefficient.
In order to show the complete structure of the dq model of IPMSM in Figure 1, Equation (1) is expressed in the appropriate matrix notation:
d d t ψ d s ψ q s = V d s V q s R s i d s i q s ω m 0 1 1 0 · ψ d s ψ q s

3. Frozen Permeability Technique for FEA Modeling of IPMSM

3.1. The Low Voltage Highly Utilized IPMSM for EV Traction Drive

In this paper, the 36-slot, eight-magnet pole, three-phase low voltage highly utilized IPMSM for EV traction drive is analyzed. The cross-section of the rotor and stator structures is presented in Figure 2a, while the main dimensions and basic parameters of the referenced IPMSM are depicted in Table 1. Furthermore, Figure 2b illustrates the relationship between the magnetic flux density and the magnetic field (B–H curve) of material M250-35A, used for the motor’s magnetic core construction.

3.2. Basic Principle of Frozen Permeability Technique

Due to the non-linearity of the magnetic circuits of electric machines, it is not easy to strictly quantify the contributions of different magnetic field sources in the total magnetic field of the machines. This also directly refers to the flux linkage components of IPMSM used in Equations (1)–(3). Conventional magnetic models use an unambiguous separation of the excitation components of the flux linkages [21,22,23]. In this way, the superposition method is employed in a nonlinear system, which undoubtedly leads to inaccurate magnetic models. Flux linkages naturally consist of components resulting from the excitation currents along the d and q axes and a component caused by the existence of permanent magnets. All these excitation components are interdependent, so none of them can be considered as an independent or constant quantity, as described by Equation (6):
ψ d s = ψ d e x i d s , i q s + ψ d P M i d s , i q s     ψ q s = ψ q e x i d s , i q s + ψ q P M i d s , i q s  
where ψ d e x and ψ q e x are the flux components due to stator current excitation only, and ψ d P M and ψ q P M are the flux components as a result of permanent magnet existence.
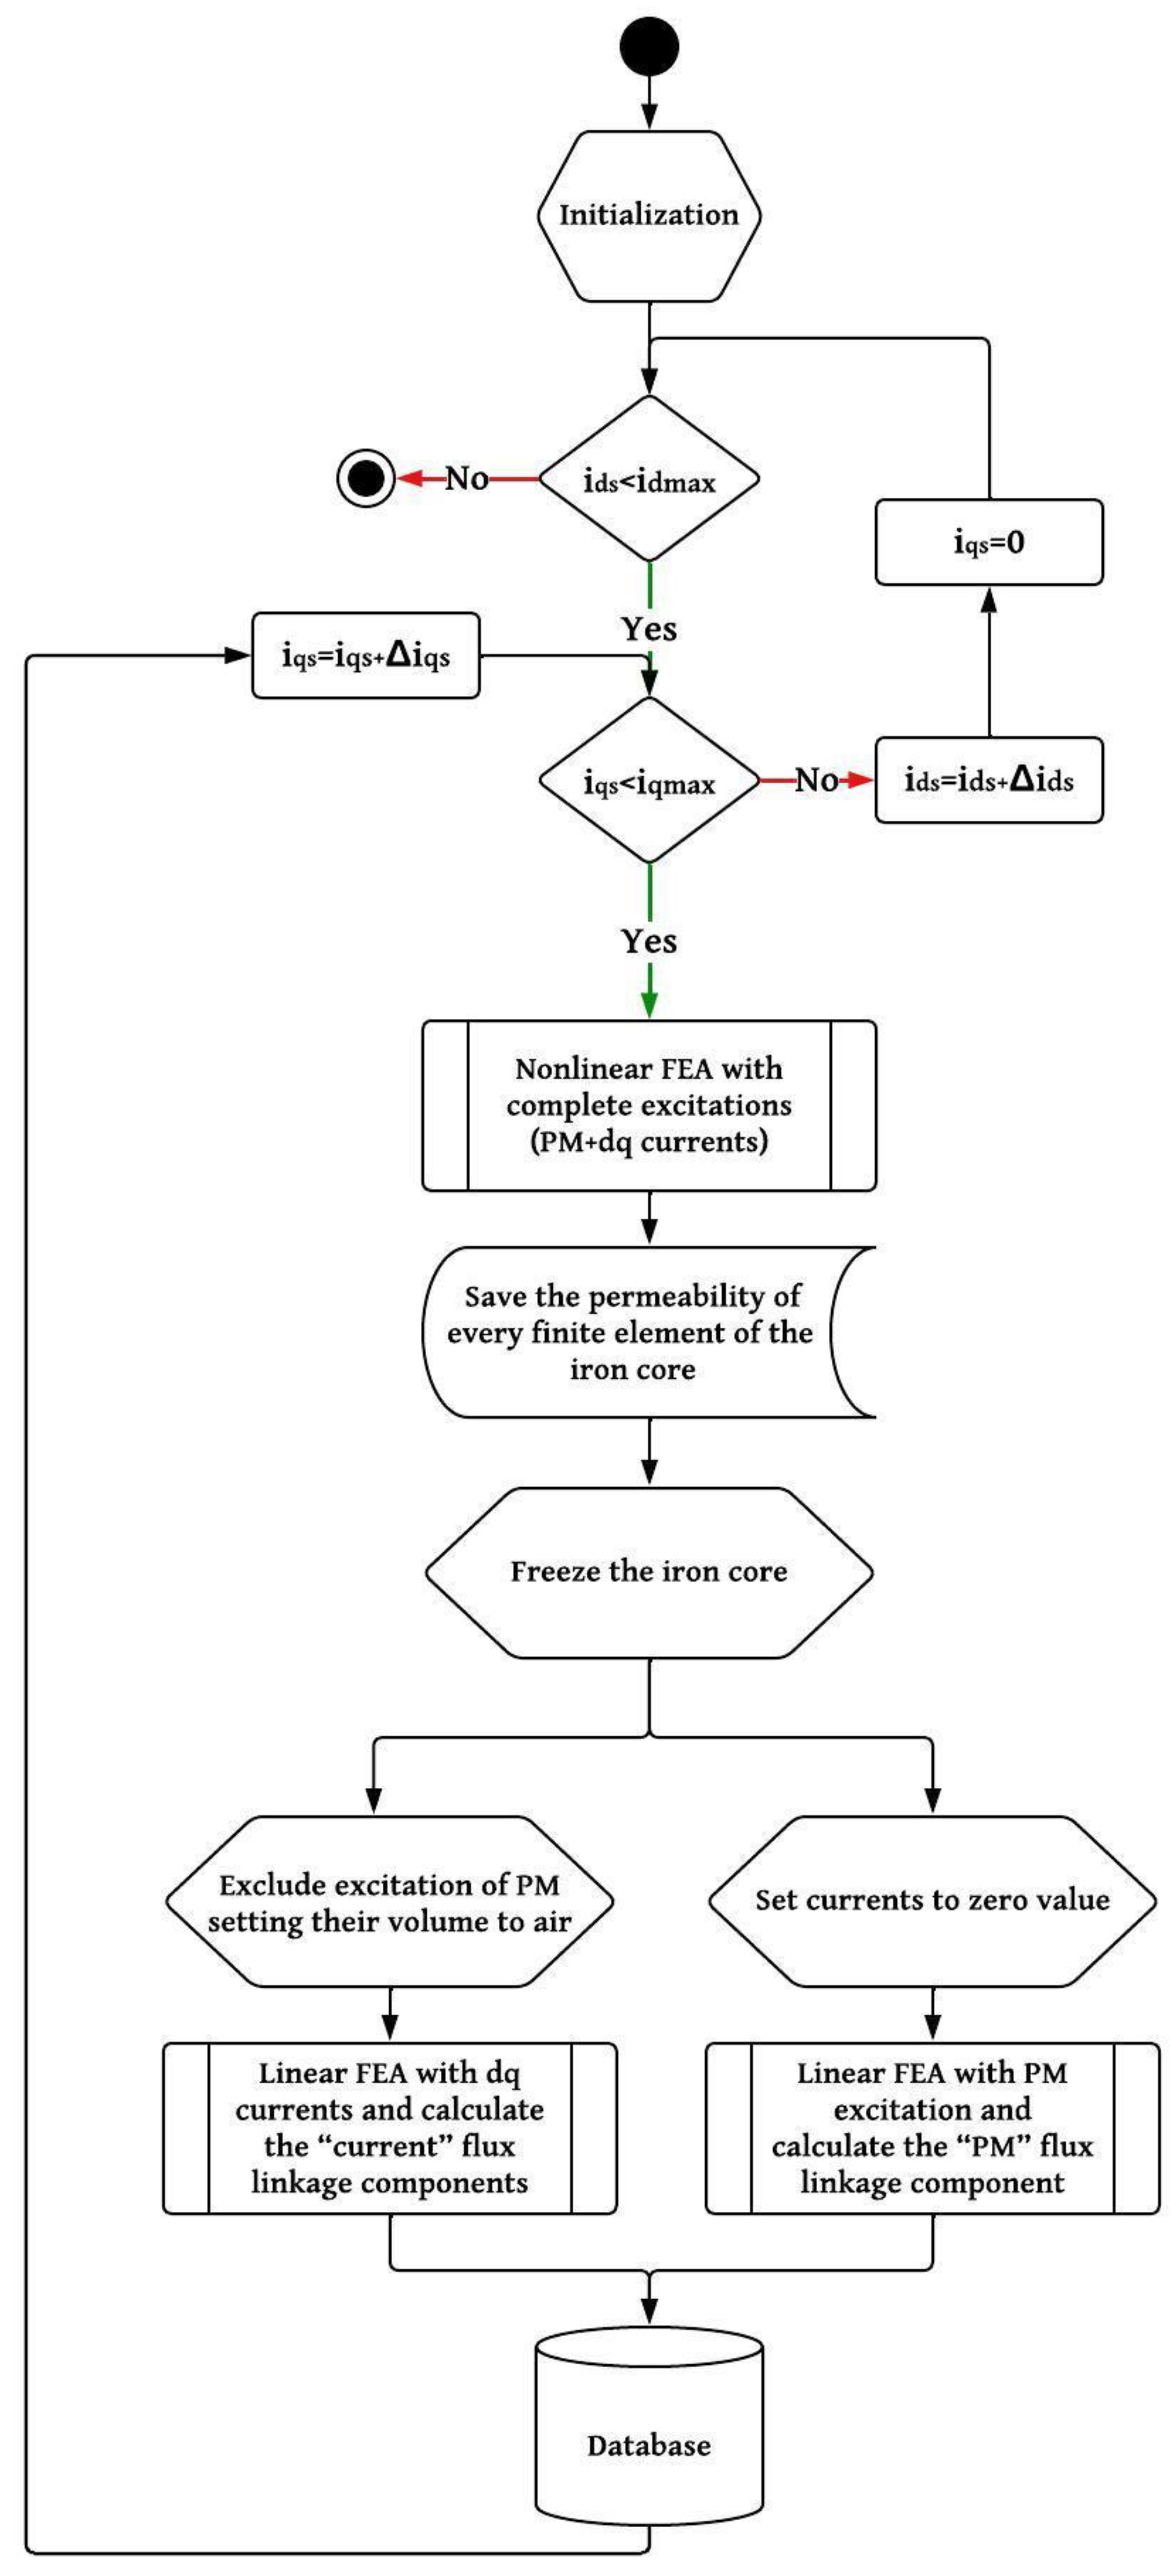
The frozen permeability technique is used in numerical FEA simulations to separate the contributions from different excitations to the total flux linkages of electric machines. The main benefits of using the frozen permeability technique in order to obtain an extremely precise magnetic model of a highly utilized IPMSM drive are presented through the flow chart algorithm in Figure 3.
The purpose of applying the frozen permeability technique is to numerically obtain the true dependencies described by Equations (2) and (6) in the widest range of possible operating modes of the machine. These dependencies are frequently unattainable in experimental setups because of drive constraints. For this purpose, the algorithm first implements a nonlinear FEA simulation with predefined values of dq currents, in which all excitations act together. The result of this simulation is the field distribution comparable to that in the real working condition of the machine with referenced dq currents. Then, the next and crucial step in the frozen permeability technique is to save (freeze) the values of relative permeability in all finite elements of the complete magnetic circuit of the IPMSM.
With frozen permeability, the core now becomes magnetically linear, and the contributions of different excitations can be considered separately. From this point, the algorithm branches into two paths, separating the excitation influence of only the dq currents or permanent magnets. From now on, two separate FEA simulations are performed on the magnetic linear core. In the first path’s FEA simulation, only the contribution of the dq currents is investigated by excluding the presence of the permanent magnets and replacing their domain with air. In this way, the influence of the excitation of the dq currents in the flux linkages can be accurately distinguished, while preserving the magnetic conditions present in a fully excited machine. In the second path of the algorithm, the contribution of the permanent magnets is determined using a similar procedure by setting the excitation of the dq currents at zero value.
In all FEA simulations, the rotor of the analyzed IPMSM model is in a stationary position, in which the d axis of the machine is aligned with the magnetic axis of the phase a winding. During the simulations, the q current as the carrier of the fundamental torque component took only positive values. At the same time, the d current component, which affects the development of the reluctance torque component, but also the flux weakening feature, was set only to the negative values. In the set of simulations, the q current varied from 0 to 700 A, while the d current changed from −700 to 0 A. The change in the dq current values in the simulations was completed in increments of 14 A, resulting in a total of 2601 FEA simulations.
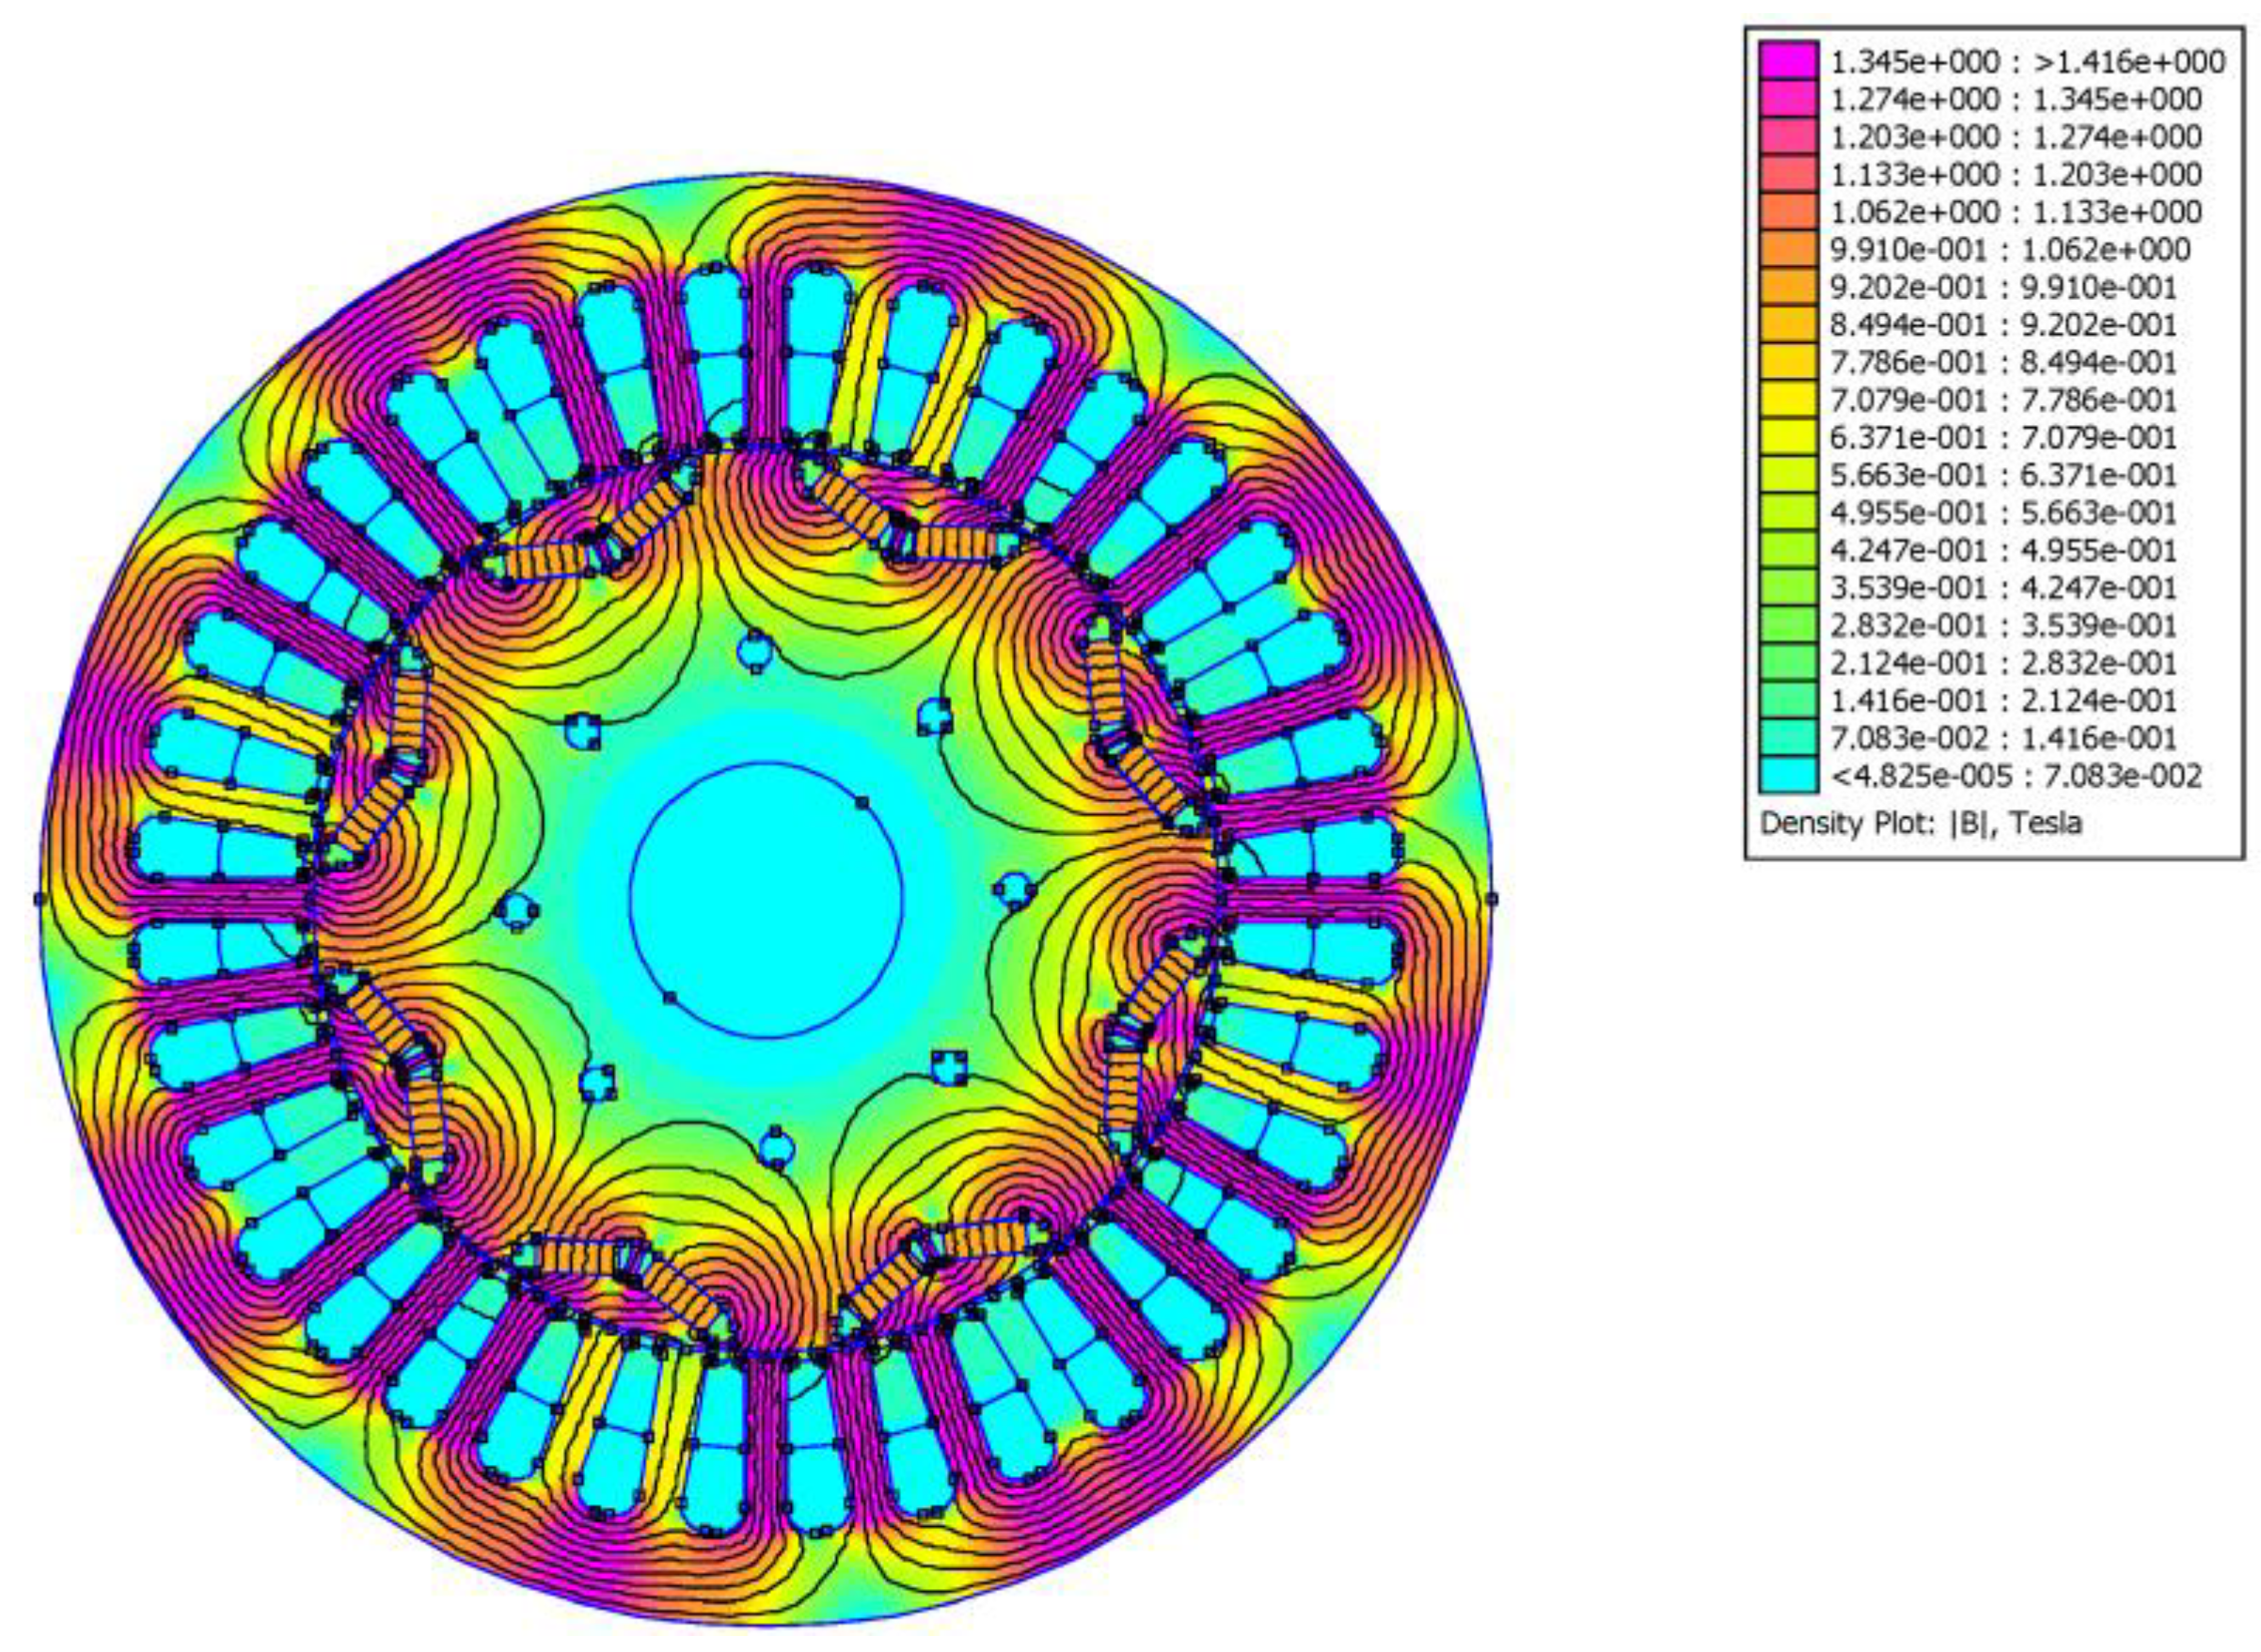
The result of the performance of one nonlinear FEA simulation is presented in Figure 4, where the distribution of the flux density when simulated with whole excitation is offered. The values of the d and q current components, for instance, are set to −100 A and 200 A, respectively.
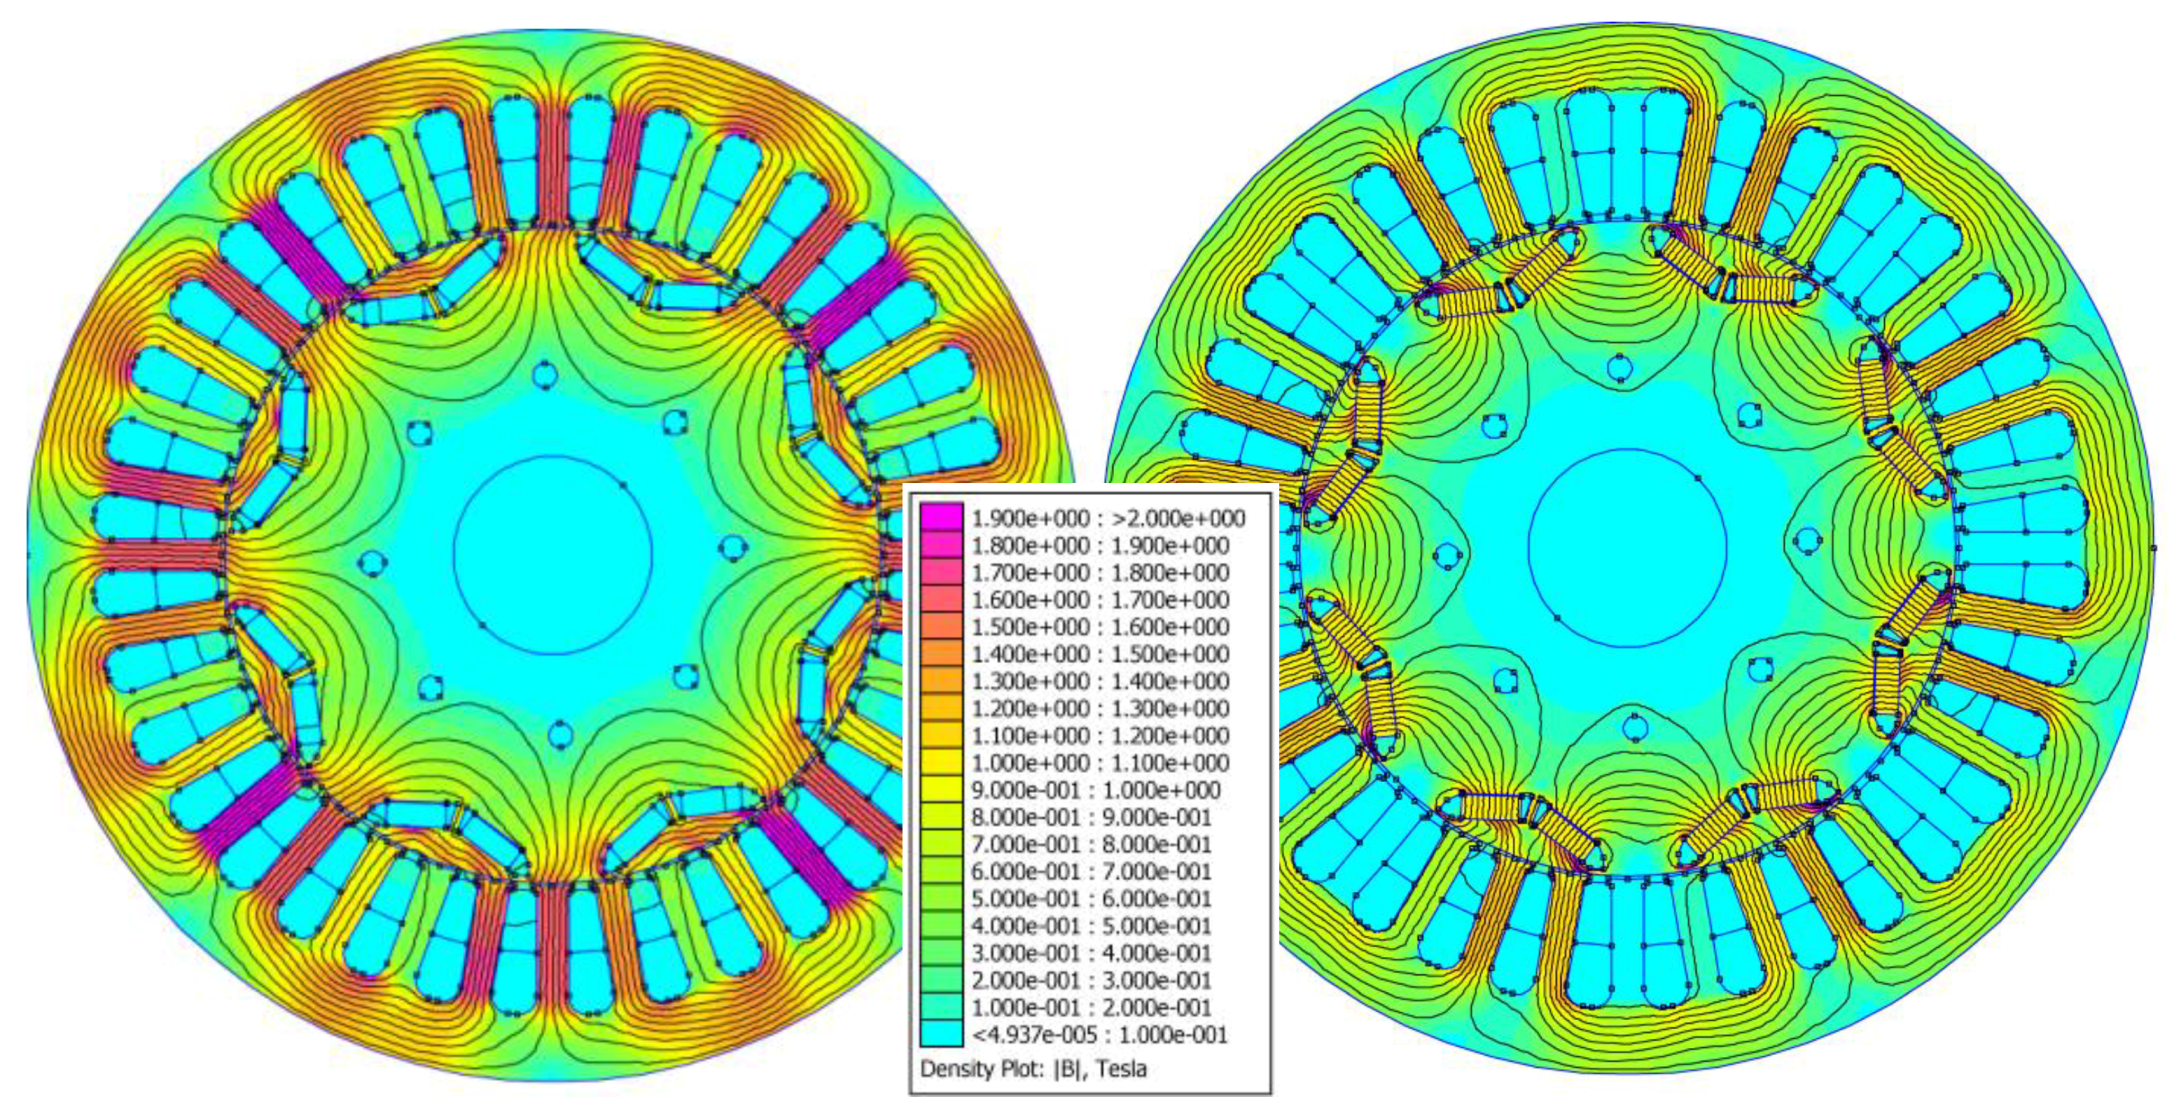
The effective separation of the flux linkage components, based on the proposed algorithm, is shown in Figure 5. The left flux density distribution is a result of linear frozen permeability simulation, with the permanent magnet excitation excluded. The excitations of the dq currents are set to the same values as those in the Figure 4 (the d and q currents components are set to −100 A and 200 A). The right flux density distribution is the result of a linear FEA simulation, with the presence of only permanent magnet excitation, with the permeability of every iron core finite element saved (frozen) to the value of nonlinear simulation.

3.3. Results of the Frozen Permeability Technique

In this section, the relevant and most important results obtained by applying the frozen permeability technique will be presented. The complete standard dq flux linkage maps are obtained using a set of 2601 simulations, with the dq current variations as defined in the proposed algorithm, which is in case of d axis displayed in Figure 6.
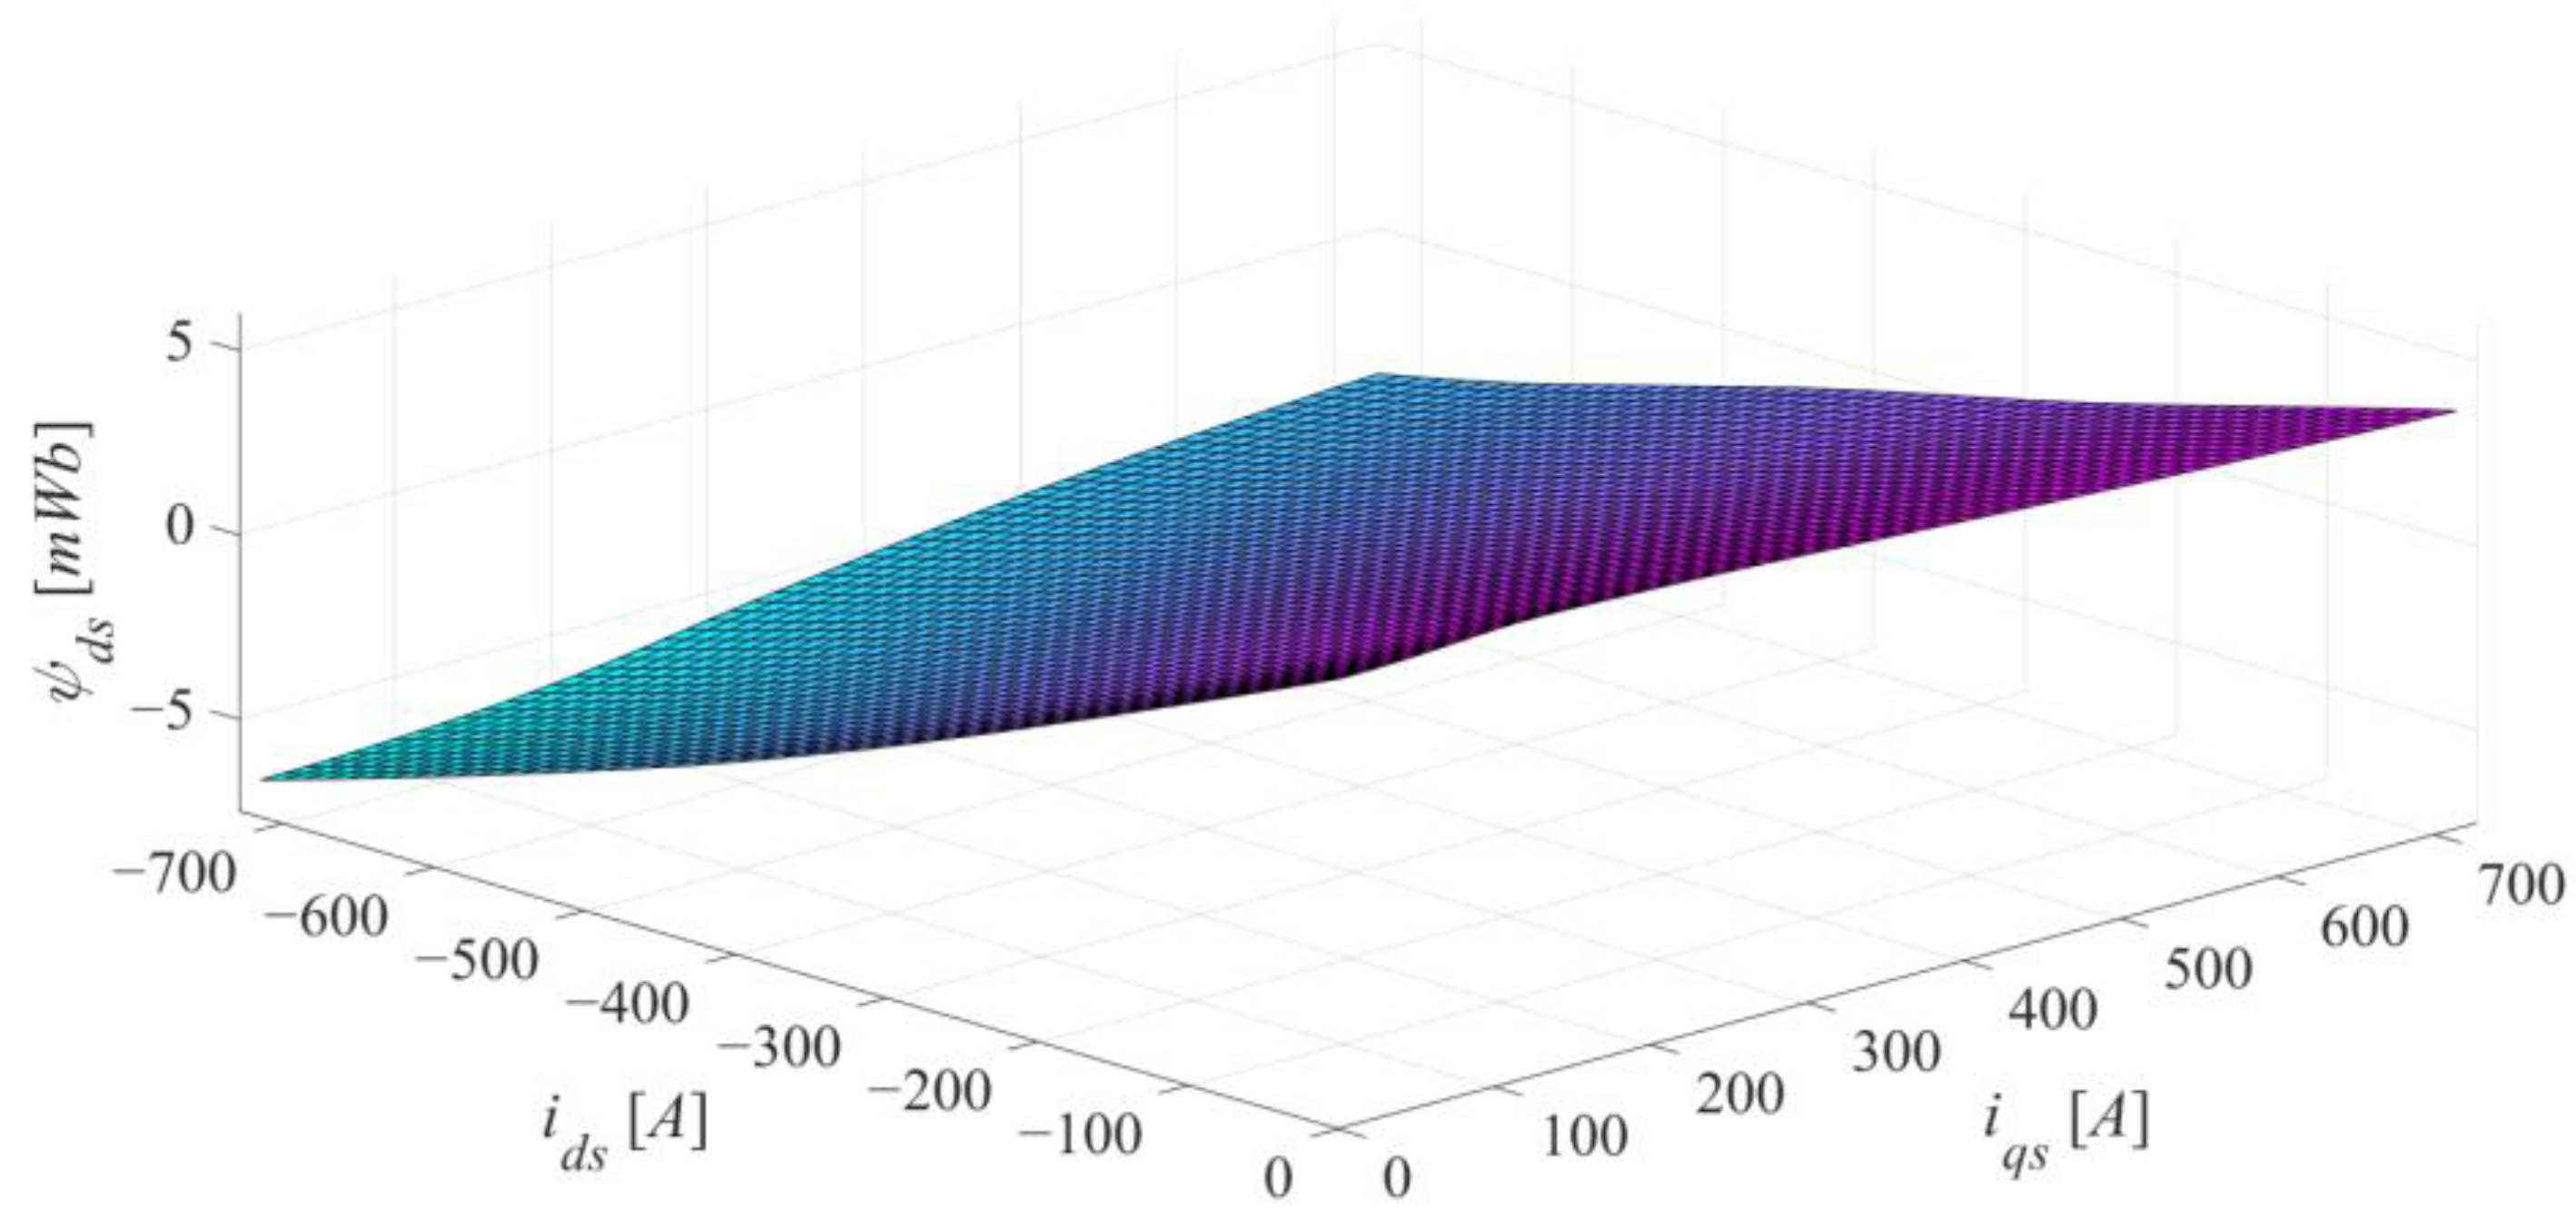
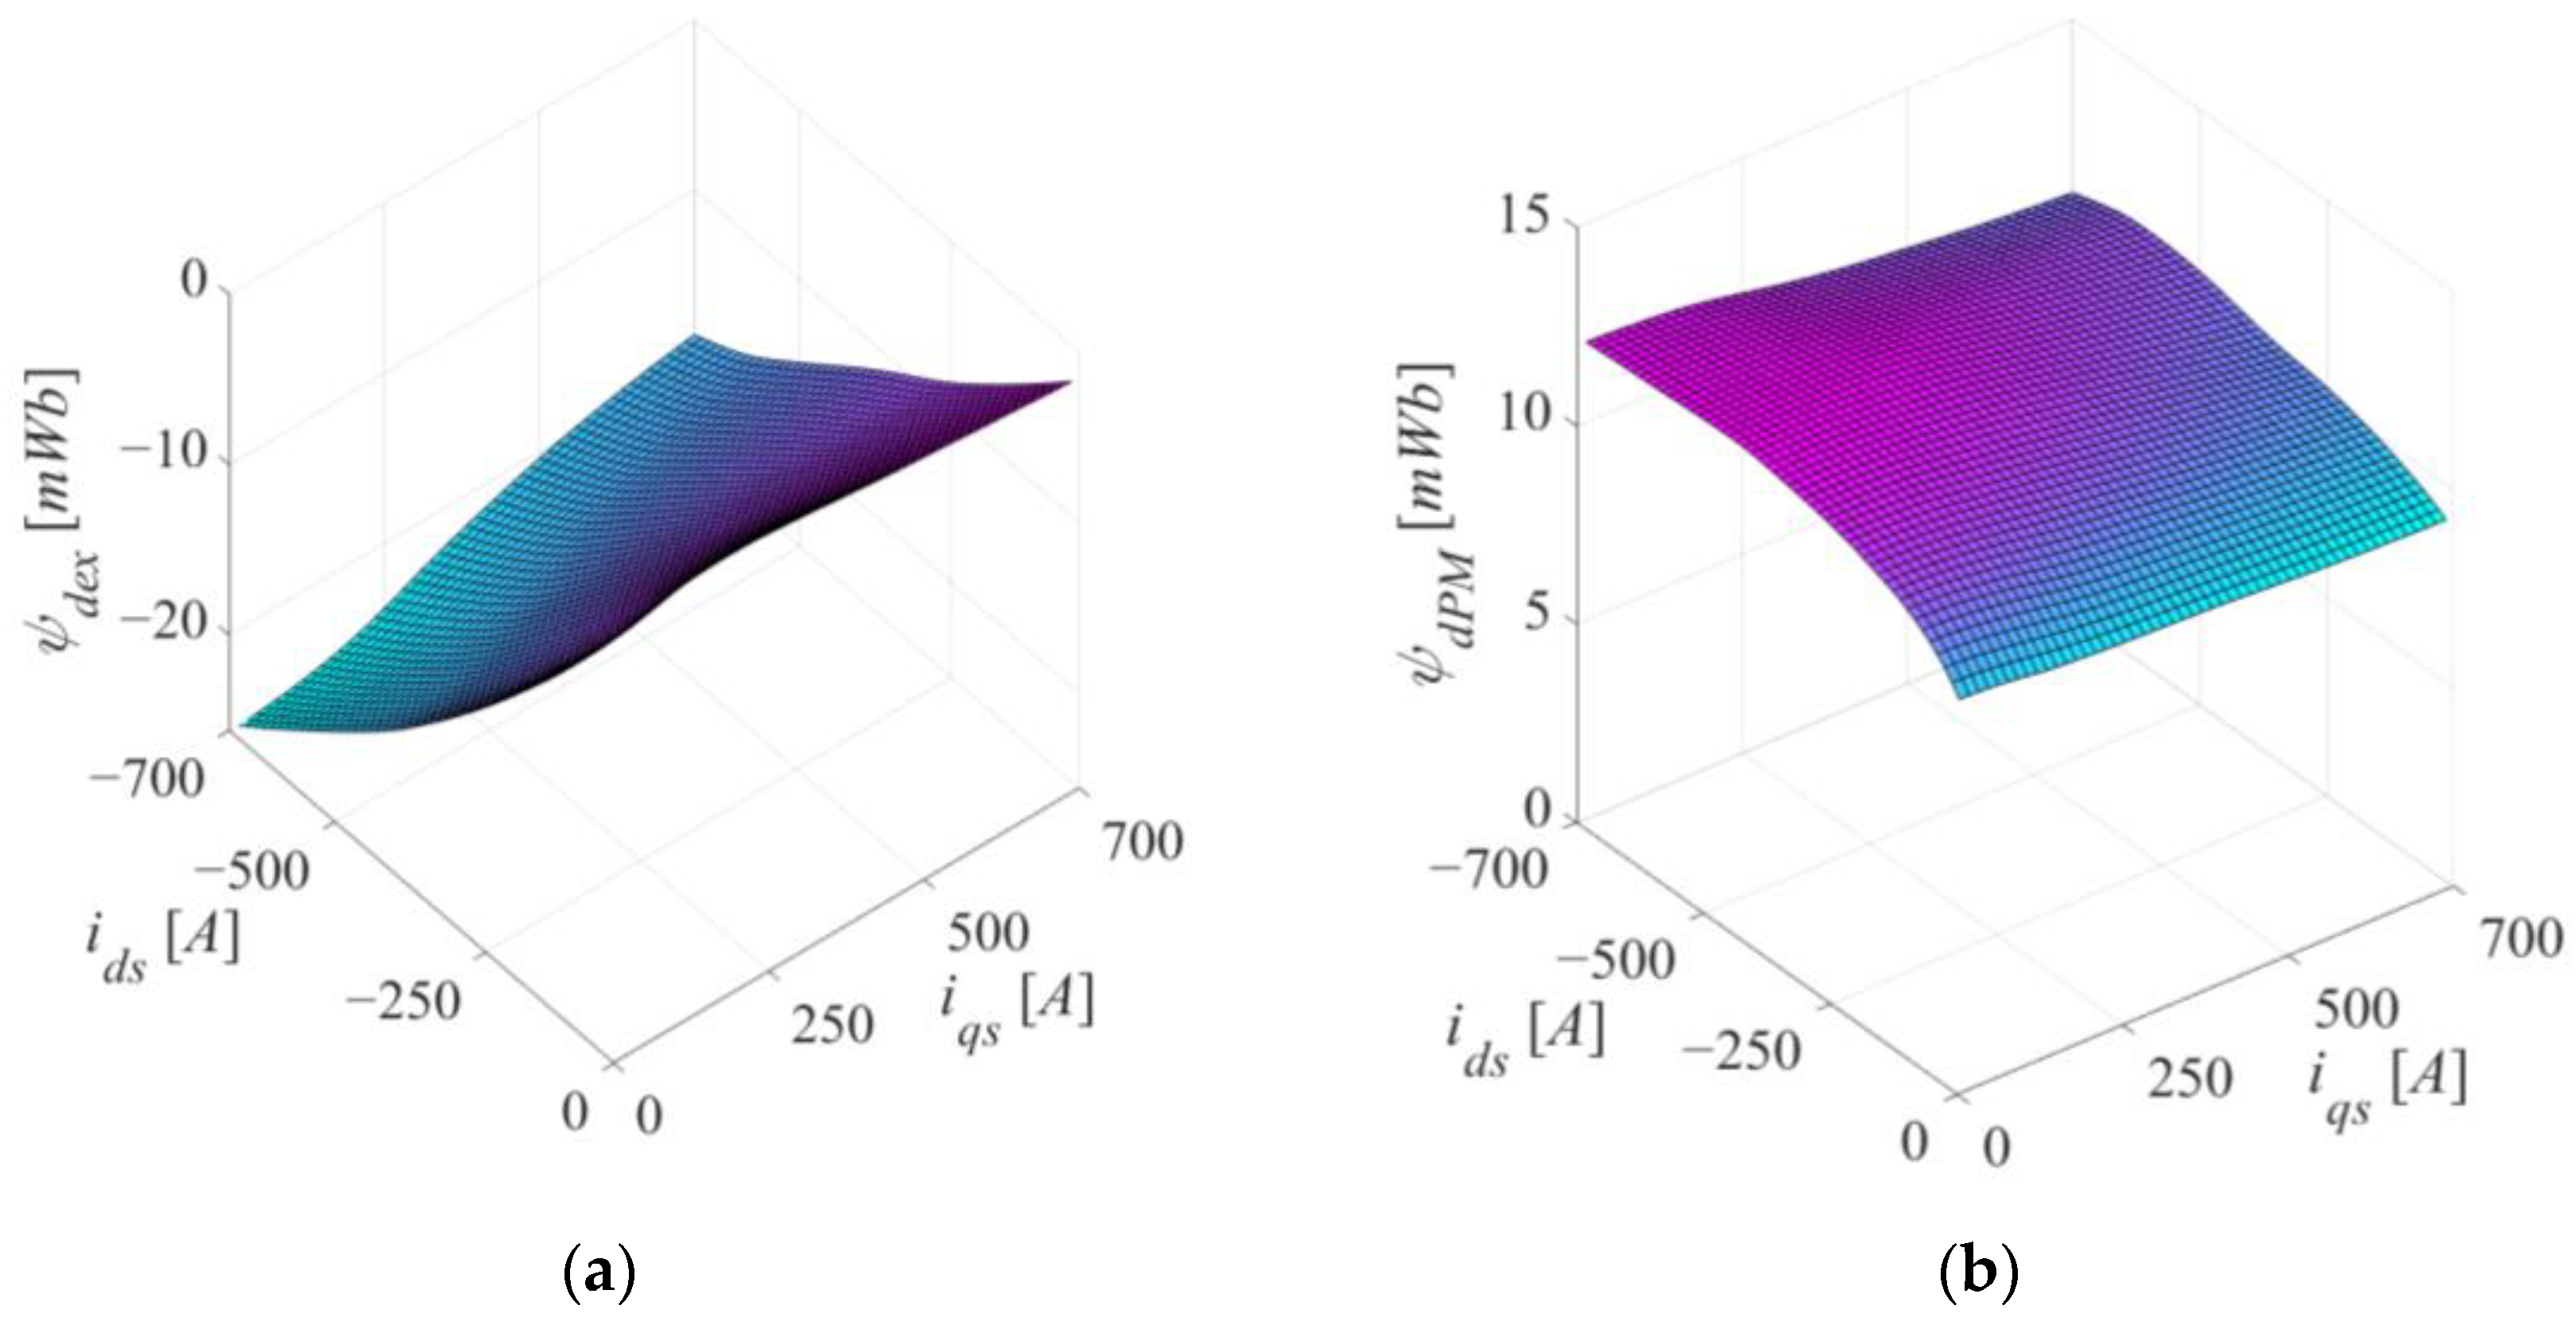
As expected, the combined action of the stator d axis currents and the permanent magnets produces the significant influence of the saturation of the magnetic circuit along the d axis. Based on the proposed algorithm of frozen permeability, Figure 7 depicts the outcomes of the separation of the flux components along the d axis due to the separated excitations. In Figure 7a, the value of the displayed flux component is primarily influenced by the current variation along the d axis, while the contribution of the current variation along the q axis is noticeably less prominent.
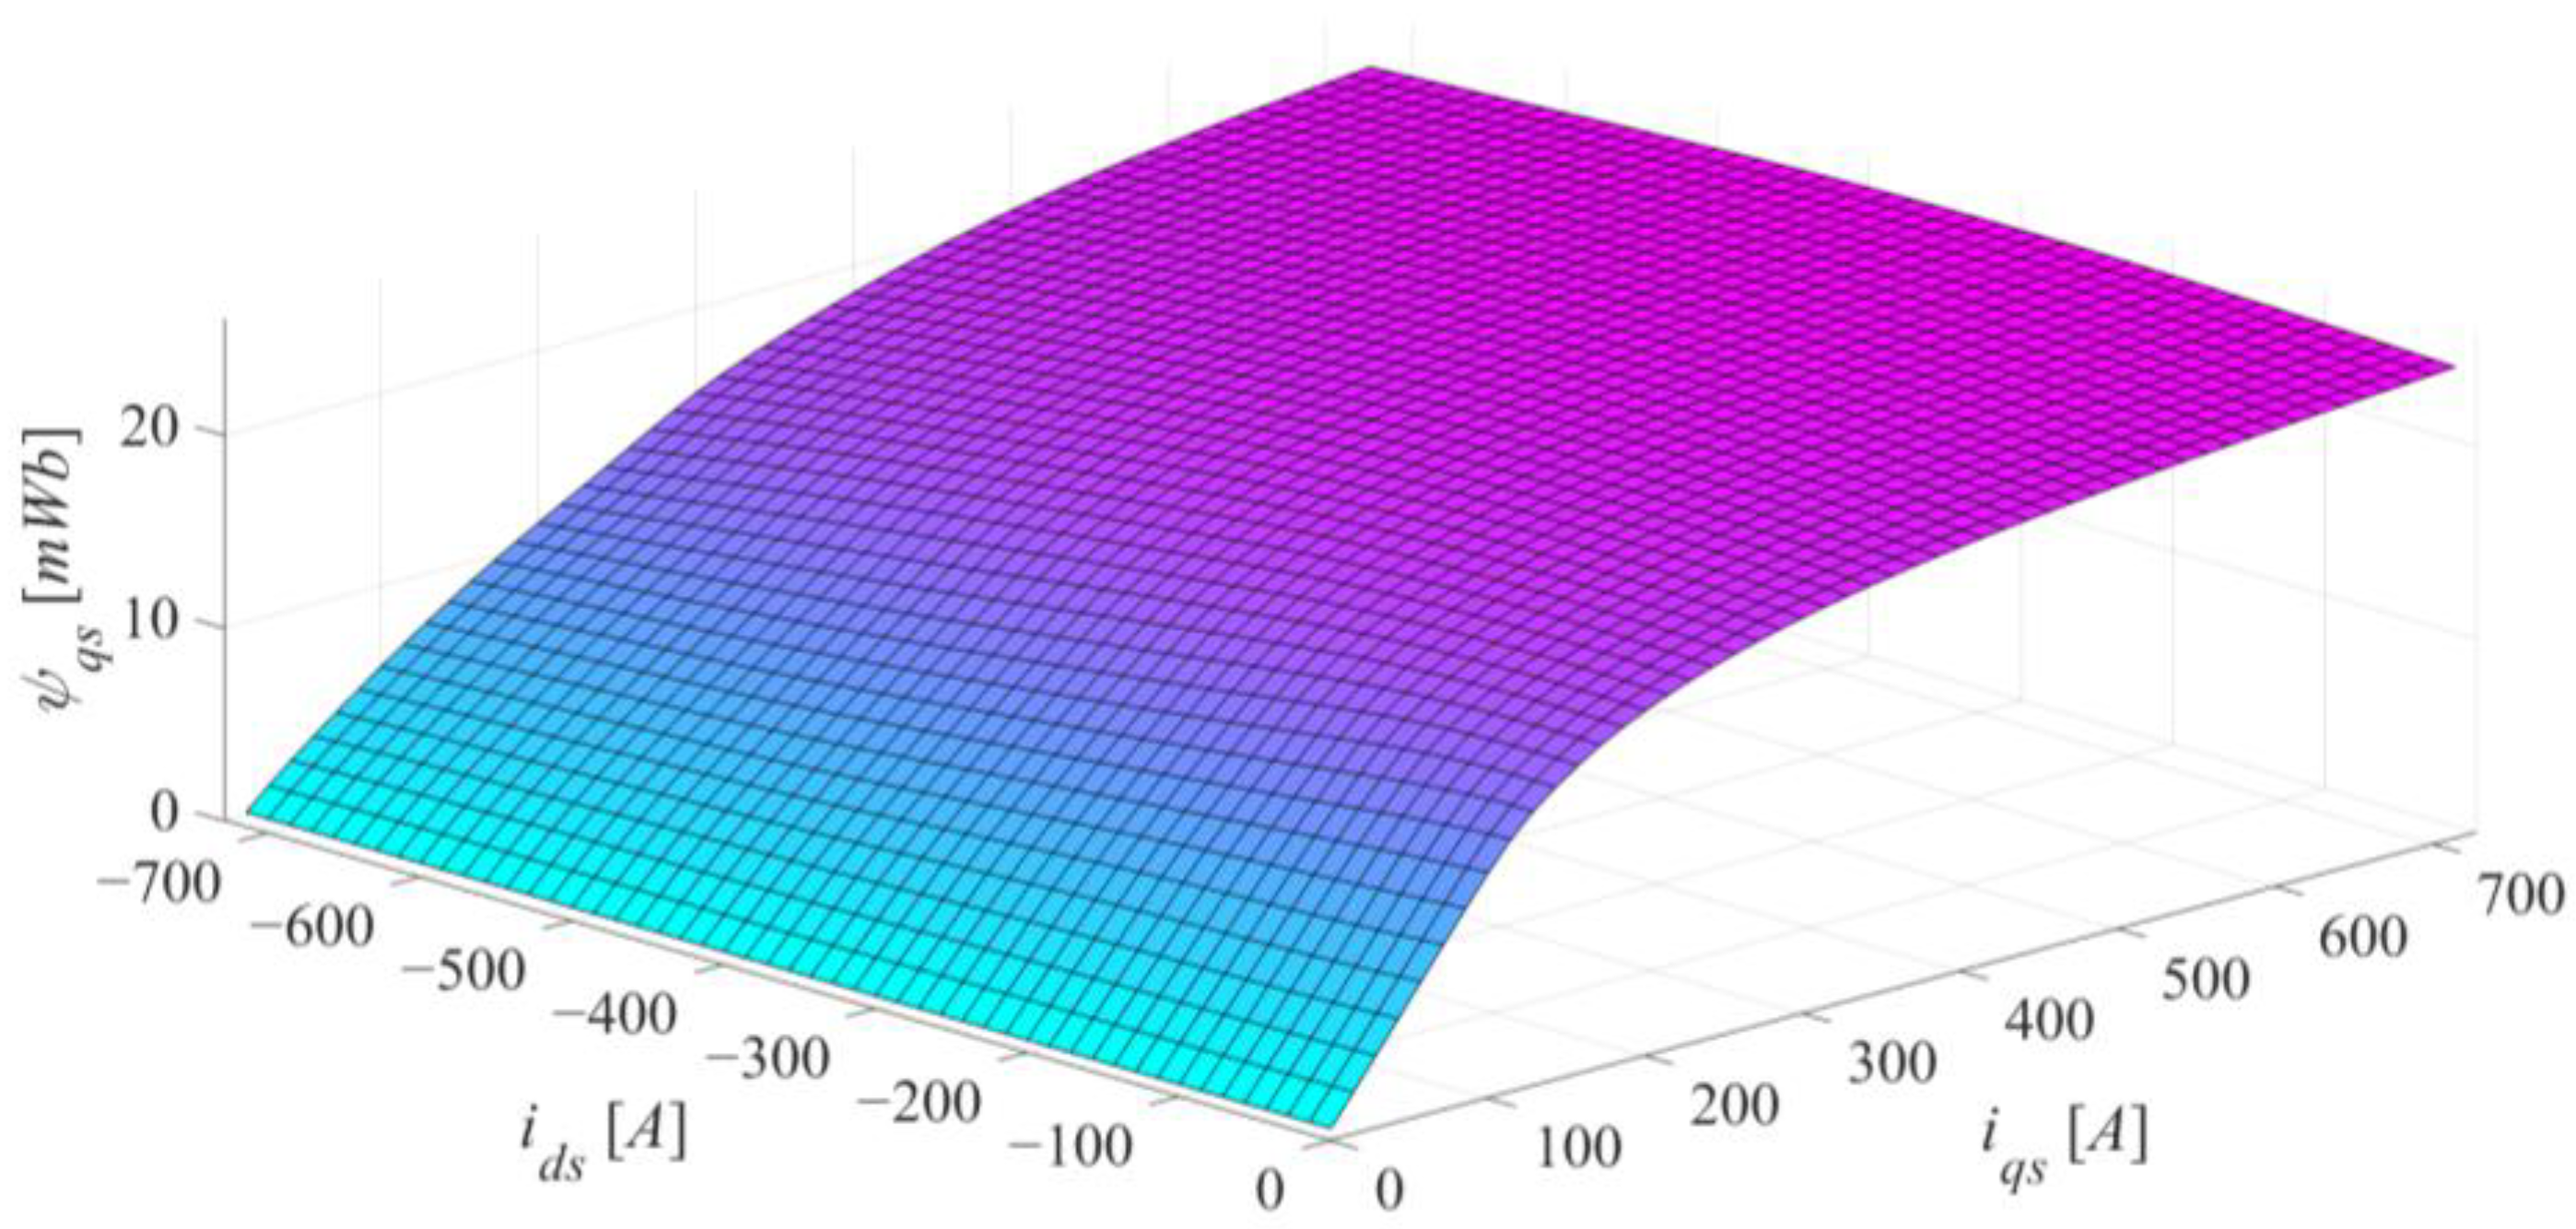
One of the more notable outcomes of the algorithm is illustrated in Figure 7b, where the flux linkage component along the d axis is solely attributable to excitation by permanent magnets. In this case, the flux linkage caused by permanent magnets along the d axis, which is typically taken to be constant, exhibits considerable value fluctuations. This is specifically the case when there are significant changes in the value of the d axis current, while the contribution of the q axis current variation is fairly negligible. The results observed in Figure 7a,b can be simply superimposed, owing to the frozen permeability technique, yielding the response shown in Figure 6. Figure 8 depicts the flux’s dependency along the q axis in the dq current plane, in a manner similar to Figure 6.
In Figure 9a, the current variation along the q axis has the strongest influence on the value of the mapped flux component, whereas the contribution of the current variation along the d axis is less significant. The flux linkage component in the q axis, caused by permanent magnets, should be exactly equal to zero according to all classical theories. However, Figure 9b clearly demonstrates that the cross-saturation effect combined with the presence of permanent magnets still affects the flux linkage along the q axis, to a small extent. Only the application of the frozen permeability technique makes it possible to separate the flux component of the permanent magnets along the q axis.

4. Algebraic Magnetic Model Representation

The magnetic model of IPMSM, interpreted by inverse flux functions (Equation (2)), requires quantification in the form of a certain algebraic expression. The magnetic model representation in the form of LUTs, which directly represents the correlation between flux linkages and currents in the dq reference frame, is the most common representation of conventional flux maps [19,24]. The primary issue in obtaining inverse flux maps is that the excitation of the dq currents is referenced and controlled during simulations or experiments, and corresponding flux linkages are acquired for that specific operating point, and not vice versa. This is a consequence of the fact that currents are a physically natural cause of the magnetization of electrical machines. The conventional flux maps shown in Figure 6 and Figure 8 are determined by ordered pairs of dq currents acting as excitation, which results in ordered pairs of flux linkages. On the other hand, the representation of the same data presented in inverse dependence would not lead to ordered pairs of currents and flux linkages in the dq reference system. This problem can be overcome by numerically fitting the obtained corresponding pairs of data points with a suitable mathematical function.
For the numerically fitting of the inverse flux map, a modified polynomial function was used, originally suggested in Ref. [25]. The fitting model described in Ref. [25] was originally developed for use on synchronous reluctance machines, and it was eventually expanded to be applied to the fitting of inverse flux maps of PMSM [19]. In order to account for the presence of permanent magnets, the proposed inversed function for the d axis should be offset. Additionally, the model is normalized, and the following functions are proposed:
i d s = a d 0 + a d d ψ d s k d A + a d q ψ d s k d B ψ q s k q C ψ d s k d i f
i q s = a q 0 + a q q ψ q s k q D + a q d ψ d s k d E ψ q s k q F ψ q s k q
where i f   is the equivalent offset current that replaces the contribution of permanent magnets, while A ,   B ,   C ,   D ,   E ,   and F are nonnegative exponents, and a d 0 ,   a d d ,   a d q ,   a q 0 ,   a q q , a q d , and k d   ,   k q are nonnegative coefficients. A ,   B ,   C ,   D ,   E ,   and F are specified beforehand as being natural numbers, with values based on the degree of the polynomial function that is specified. Expressions (7) and (8) consider both the self-saturation and cross-saturation characteristic of inverse flux maps.
The proposed fitting functions must certainly incorporate intrinsic magnetic properties that are physically motivated. These functions are employed to model a nonlinear inductor, which from the energy conservation rule, should not produce or dissipate electrical energy [26,27]. If the given reciprocity rule is satisfied, then the following equation should hold:
i d s ψ d s , ψ q s ψ q s = i q s ψ d s , ψ q s ψ d s
Passive formalism would be satisfied by adhering to the reciprocity rule for coefficient selection, leading to a stable physically motivated algebraic magnetic model. Using the reciprocity rule (9) on the fitting functions (7) and (8), the following constraint problem is obtained:
C · a d q k q · ψ d s k d B + 1 ψ q s k q C 1 = E · a q d k d · ψ d s k d E 1 ψ q s k q F + 1
where a correlation between the parameters should be given in the following form to satisfy constraint problem:
C F = 2 ,     E B = 2 ,     a d q a q d = C E · k q k d
In order to satisfy the reciprocity rule and obtain the optimal fitting function, it is recommended to choose C = E = 2 , for simplicity. This also implies that exponents F and B must be equal to zero due to the reciprocity rule. There are also non recognizable effects of self-saturation in the d axis using this IPMSM machine, according to the FEA results, so it is reasonable that the exponent A is equal to zero. This additionally physically motivated magnetic property of IPMSM results from the fact that the d current was set only to the negative values, leading to an equivalent demagnetization effect in the d axis. Since Equation (7) does not model the effect of self-saturation in the d axis, the parameters that describe it can have predefined values of   a d 0 = 1 ,   a d d = 0 .
Conversely, the significant effects of self-saturation are noticed in the q axis, which is not an unreasonable phenomenon, considering the magnetic flux paths within the q axis. As a result, selecting an exponent D with a high degree, accounting for the self-saturation in the q axis, is advisable. It is also important to recognize that the exponent D should be limited to an even value number in order to achieve the symmetry rule in the q axis:
i d s = f 1 ψ d s , ψ q s = i d s = f 1 ψ d s , ψ q s   i q s = f 2 ψ d s , ψ q s = i q s = f 2 ψ d s , ψ q s  
while the symmetry rule is not applicable to the d axis due to the existence of permanent magnets.
The non-negative coefficients a d q ,   a q 0 ,   a q q , and   a q d must be determined as accurately as possible during the fitting procedure. When used as intended, the reciprocity rule incorporates a limiting factor into the calculation of these coefficients:
a d q a q d = k q k d
In order to satisfy this condition, the coefficient a d q is obtained by fitting the function given by Equation (7), while the coefficient a q d remains predefined from Equation (13).
Additionally, the normalization process requires the pre-introduction of coefficients k d   and k q in order to bring the d axis flux linkage to the same scale of physical size as the offset current   i f . The coefficients k d   and k q and the offset current i f were derived from the separated components of the flux linkage excitations obtained by the frozen permeability technique. Based on flux component decomposition given in Equation (6), the flux components derived from dq currents excitation were utilized to determine the k d   and k q coefficients. By using a linear approximation, the flux components in Figure 8a and Figure 10a provide the values of the necessary coefficients k d   and k q , respectively. The coefficients calculated in this manner offer a much better starting point for a physically motivated proposed fit.
The equivalent offset current i f is obtained on the basis of the permanent magnet flux component given in Figure 7b. The offset current i f was obtained by relying on a less pronounced variation in relation to the other flux components. It was therefore defined as a mode function in the limited operation range of the d axis permanent magnet flux linkage component. The polynomial functions have been criticized in Ref. [10] for having a limited range of extensibility. In order to overcome these issues, in this paper, inverse flux maps were fitted in a wider range of dq currents. Being allowed to conduct experiments without limits of real drives is one of the main benefits of using the FEA methods instead of real experiments.
The relative contribution of the flux of permanent magnets along the q axis is substantially lower than that along the d axis, and as a result, its impact can be appropriately disregarded. Therefore, it is not necessary to introduce the equivalent of the offset current along the q axis.
In order to express and verify the advantages of the frozen permeability technique, fitting was also performed with the coefficients k d   and k q obtained from the standard non-linear FEA simulation. The parameters k d   and k q were obtained from the standard flux maps shown in Figure 6 and Figure 8, while the value of the offset current in the d axis was obtained from the rated permanent magnet flux linkage magnitude. The parameters for the proposed fitting function equations based on two different FEA approaches are provided in Table 2. Predefined parameter values are displayed in the left section of Table 2, while other parameters are given in the right columns. The FEA column contains data obtained by employing the standard approach for coefficient calculation using non-linear FEA. Diversely, column FP-FEA shows the results of the parameters obtained using the proposed frozen permeability FEA.
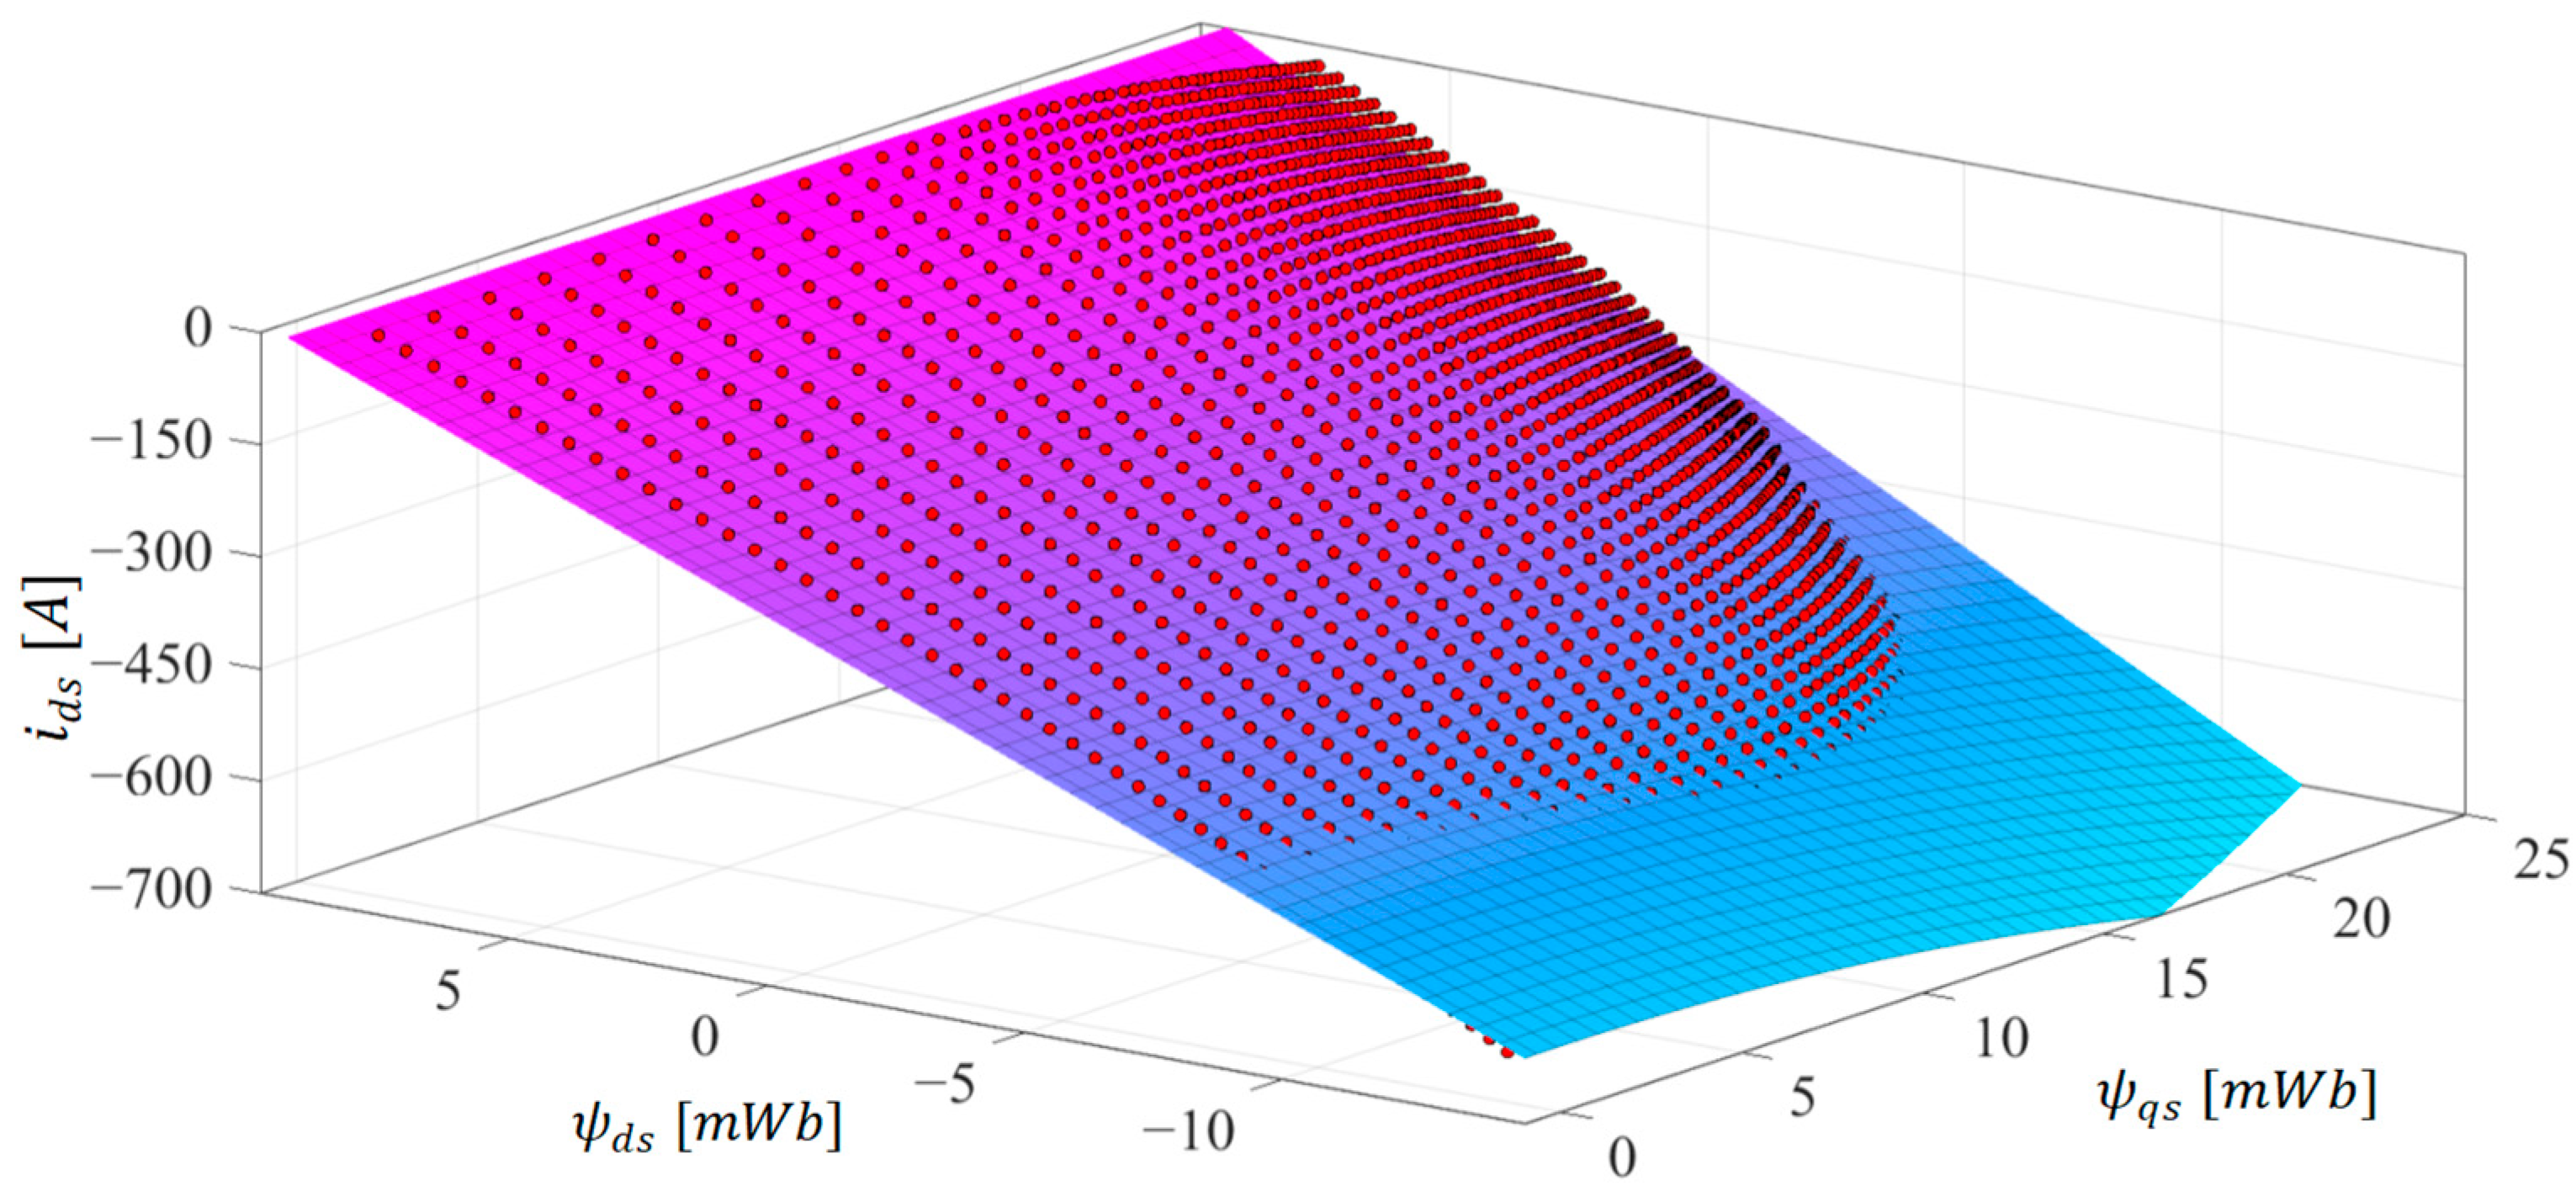
The inversed d axis flux linkage map is depicted in Figure 10. This map shows how the current along the d axis is inversely dependent on the corresponding dq flux linkages. In Figure 10, the red spheres indicate the data obtained using FEA simulations, and the mesh surfaces correspond to the fitted model in the d axis, with FP-FEA fitting coefficients (7).
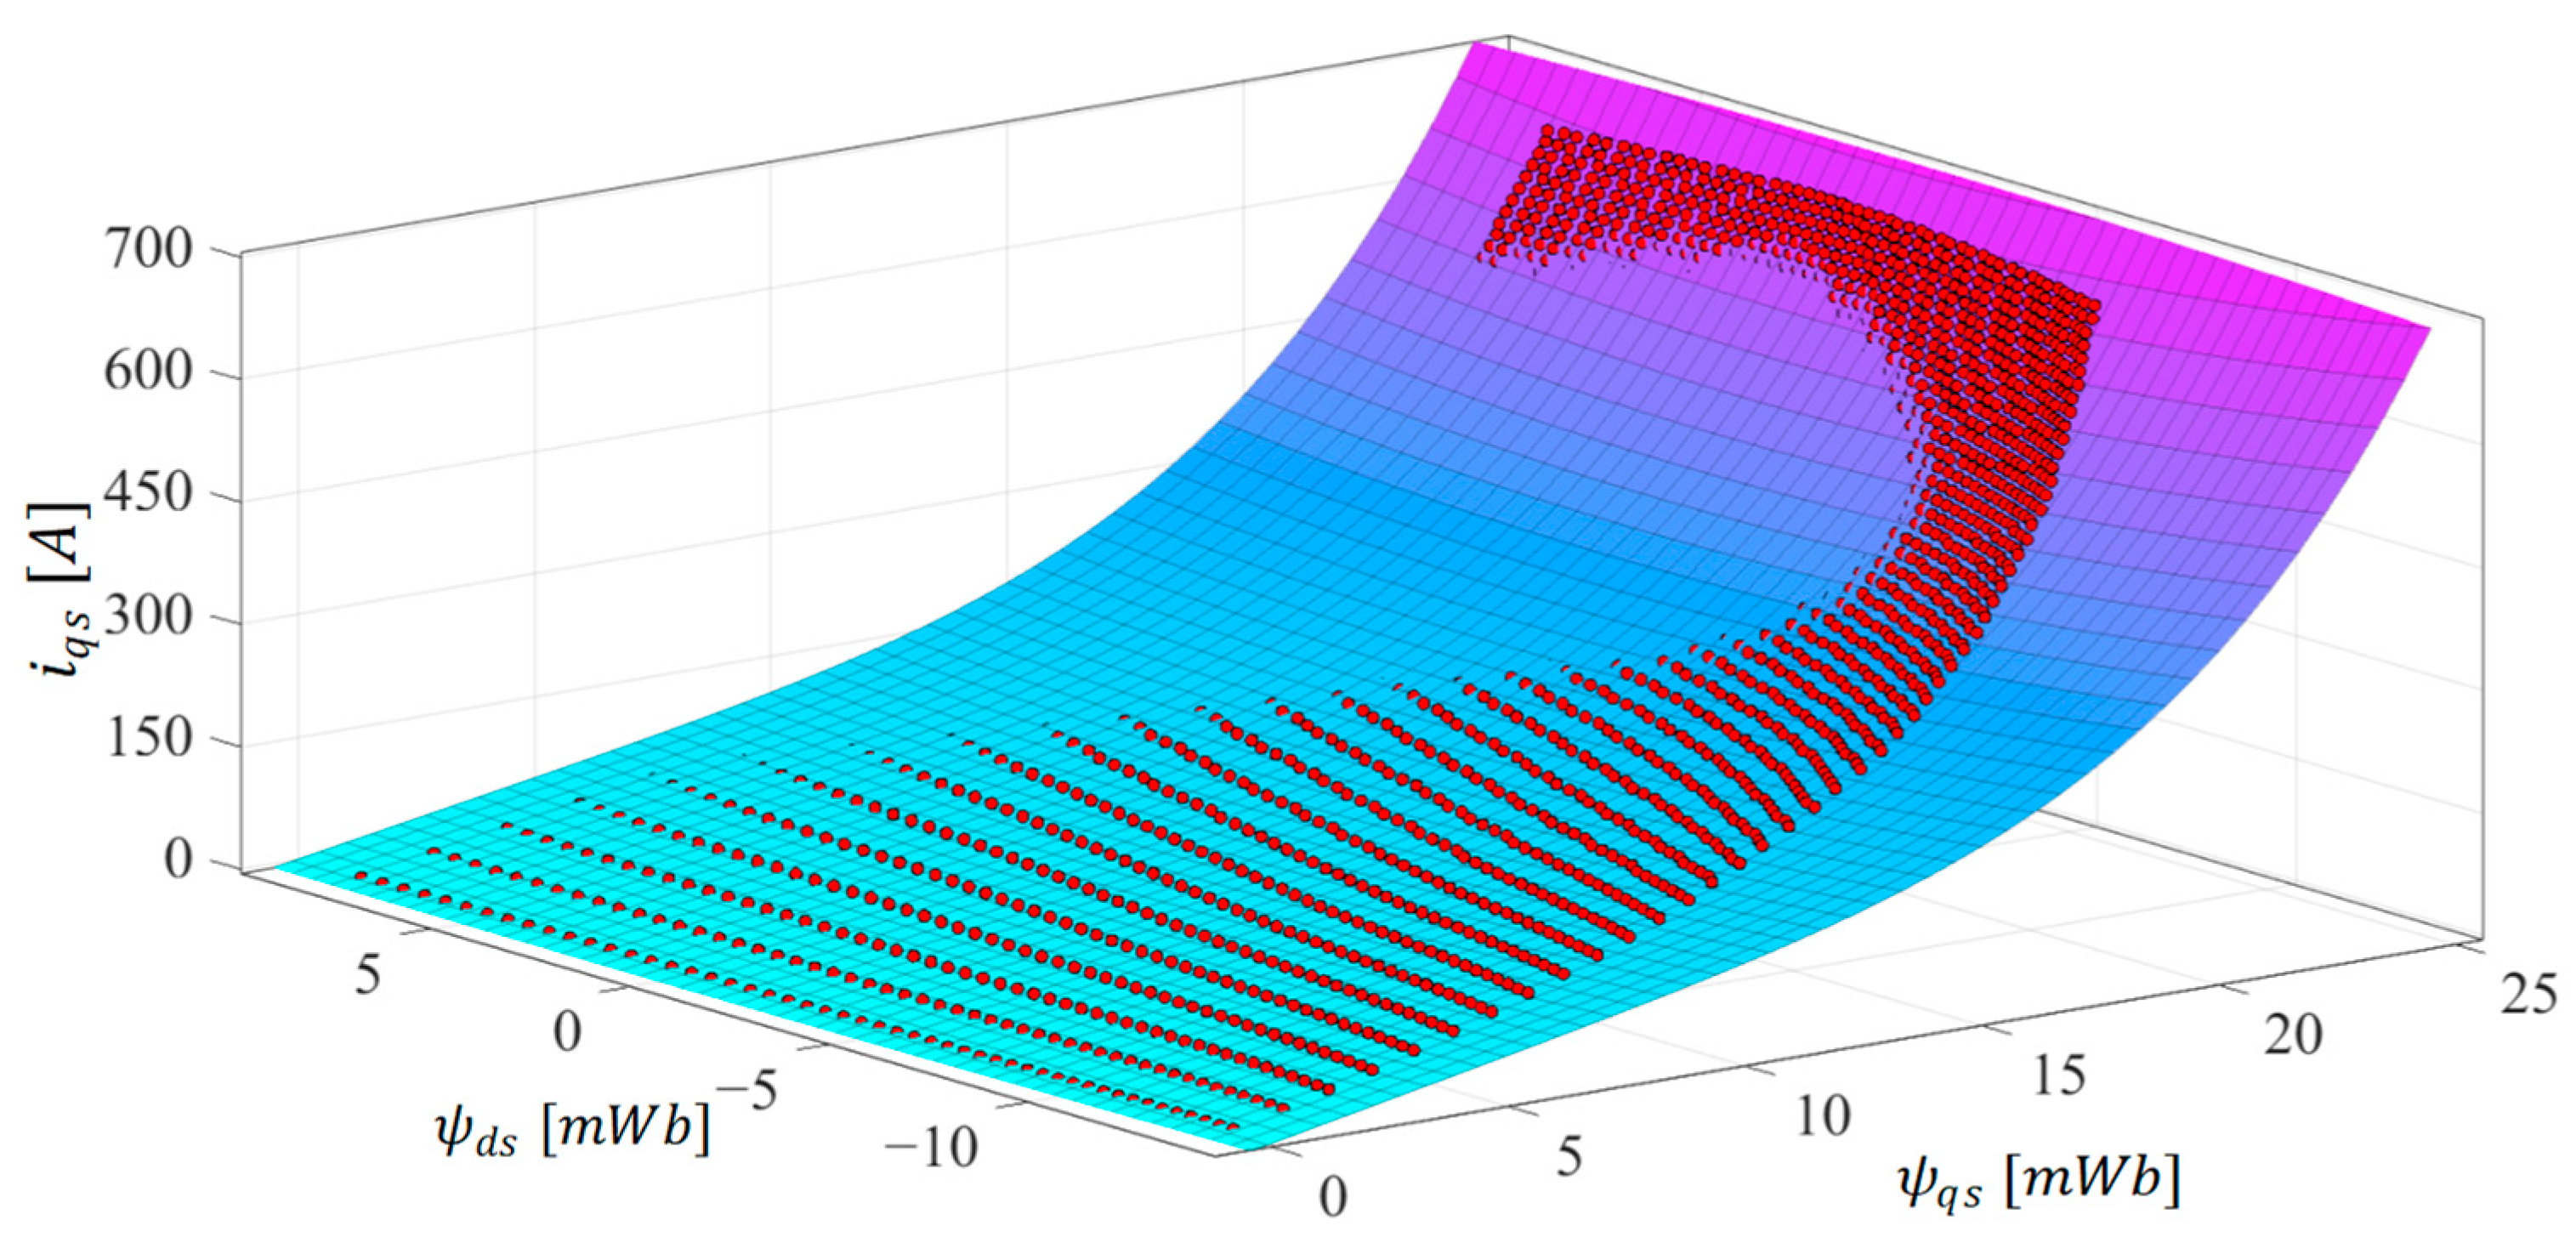
The equivalent representation, in the form of an inverse q axis flux linkage map, is illustrated in Figure 11. Figure 10 and Figure 11 illustrate how, in some intervals, the results from FEA simulations and the fitted model with FP-FEA fitting coefficients do not match perfectly. The statistical fitting parameters for both FEA fitting approaches, displayed in Table 3, demonstrate that the fitting results are reliable, and that there is little variation between the fitted functions and the FEA simulation results.
Important statistical parameters representing the quality of the fit are presented in Table 3 and generated by using the MATLAB R2023a integrated curve fitting tool (CFTOOL). The sum of squares due to error (SSE) statistical parameter calculates the total deviation of the fit response values to the response values. Statistical parameter R-square measures how successful the fit function is in explaining the variation of the data. The statistical parameter known as root mean squared error (RMSE) represents the square root of the second sample moment of the differences between the response values and the values predicted by the fit function, or the quadratic mean of these differences.
The IPMSM magnetic model’s precision increases, as indicated by the fitting statistics using the FP FEA technique. Certainly, this improvement leads to the better performance of control strategies of IPMSM, which utilized inverse flux maps. Furthermore, the proposed magnetic model satisfies important physically inspired properties like energy conservation (reciprocity rule), the symmetry rule (in the q axis only), and differentiability throughout the complete definition areas of the prototype functions. Likewise, by expanding the FEA simulations to an extensive set of dq currents, the extensibility range of the fitted function is improved.
By using physically motivated algebraic functions to fit the magnetic models of the inverse flux maps, the potential to utilize them both as LUTs and/or explicit functions, if needed, is created.

5. MTPA Control Based on the Proposed Magnetic Model

IPMSM is known for its superior performance, primarily due to high efficiency and enhanced power density. The IPMSM’s overall torque is produced by the simultaneous existence of the electromagnetic and reluctance torque components due to the rotor circuit saliency. In order to utilize these advantage, maximum torque strategies and loss minimization control are regularly utilized for high performance EV drive applications, generating optimal control variables to attain the desired performances [8,23,28,29].
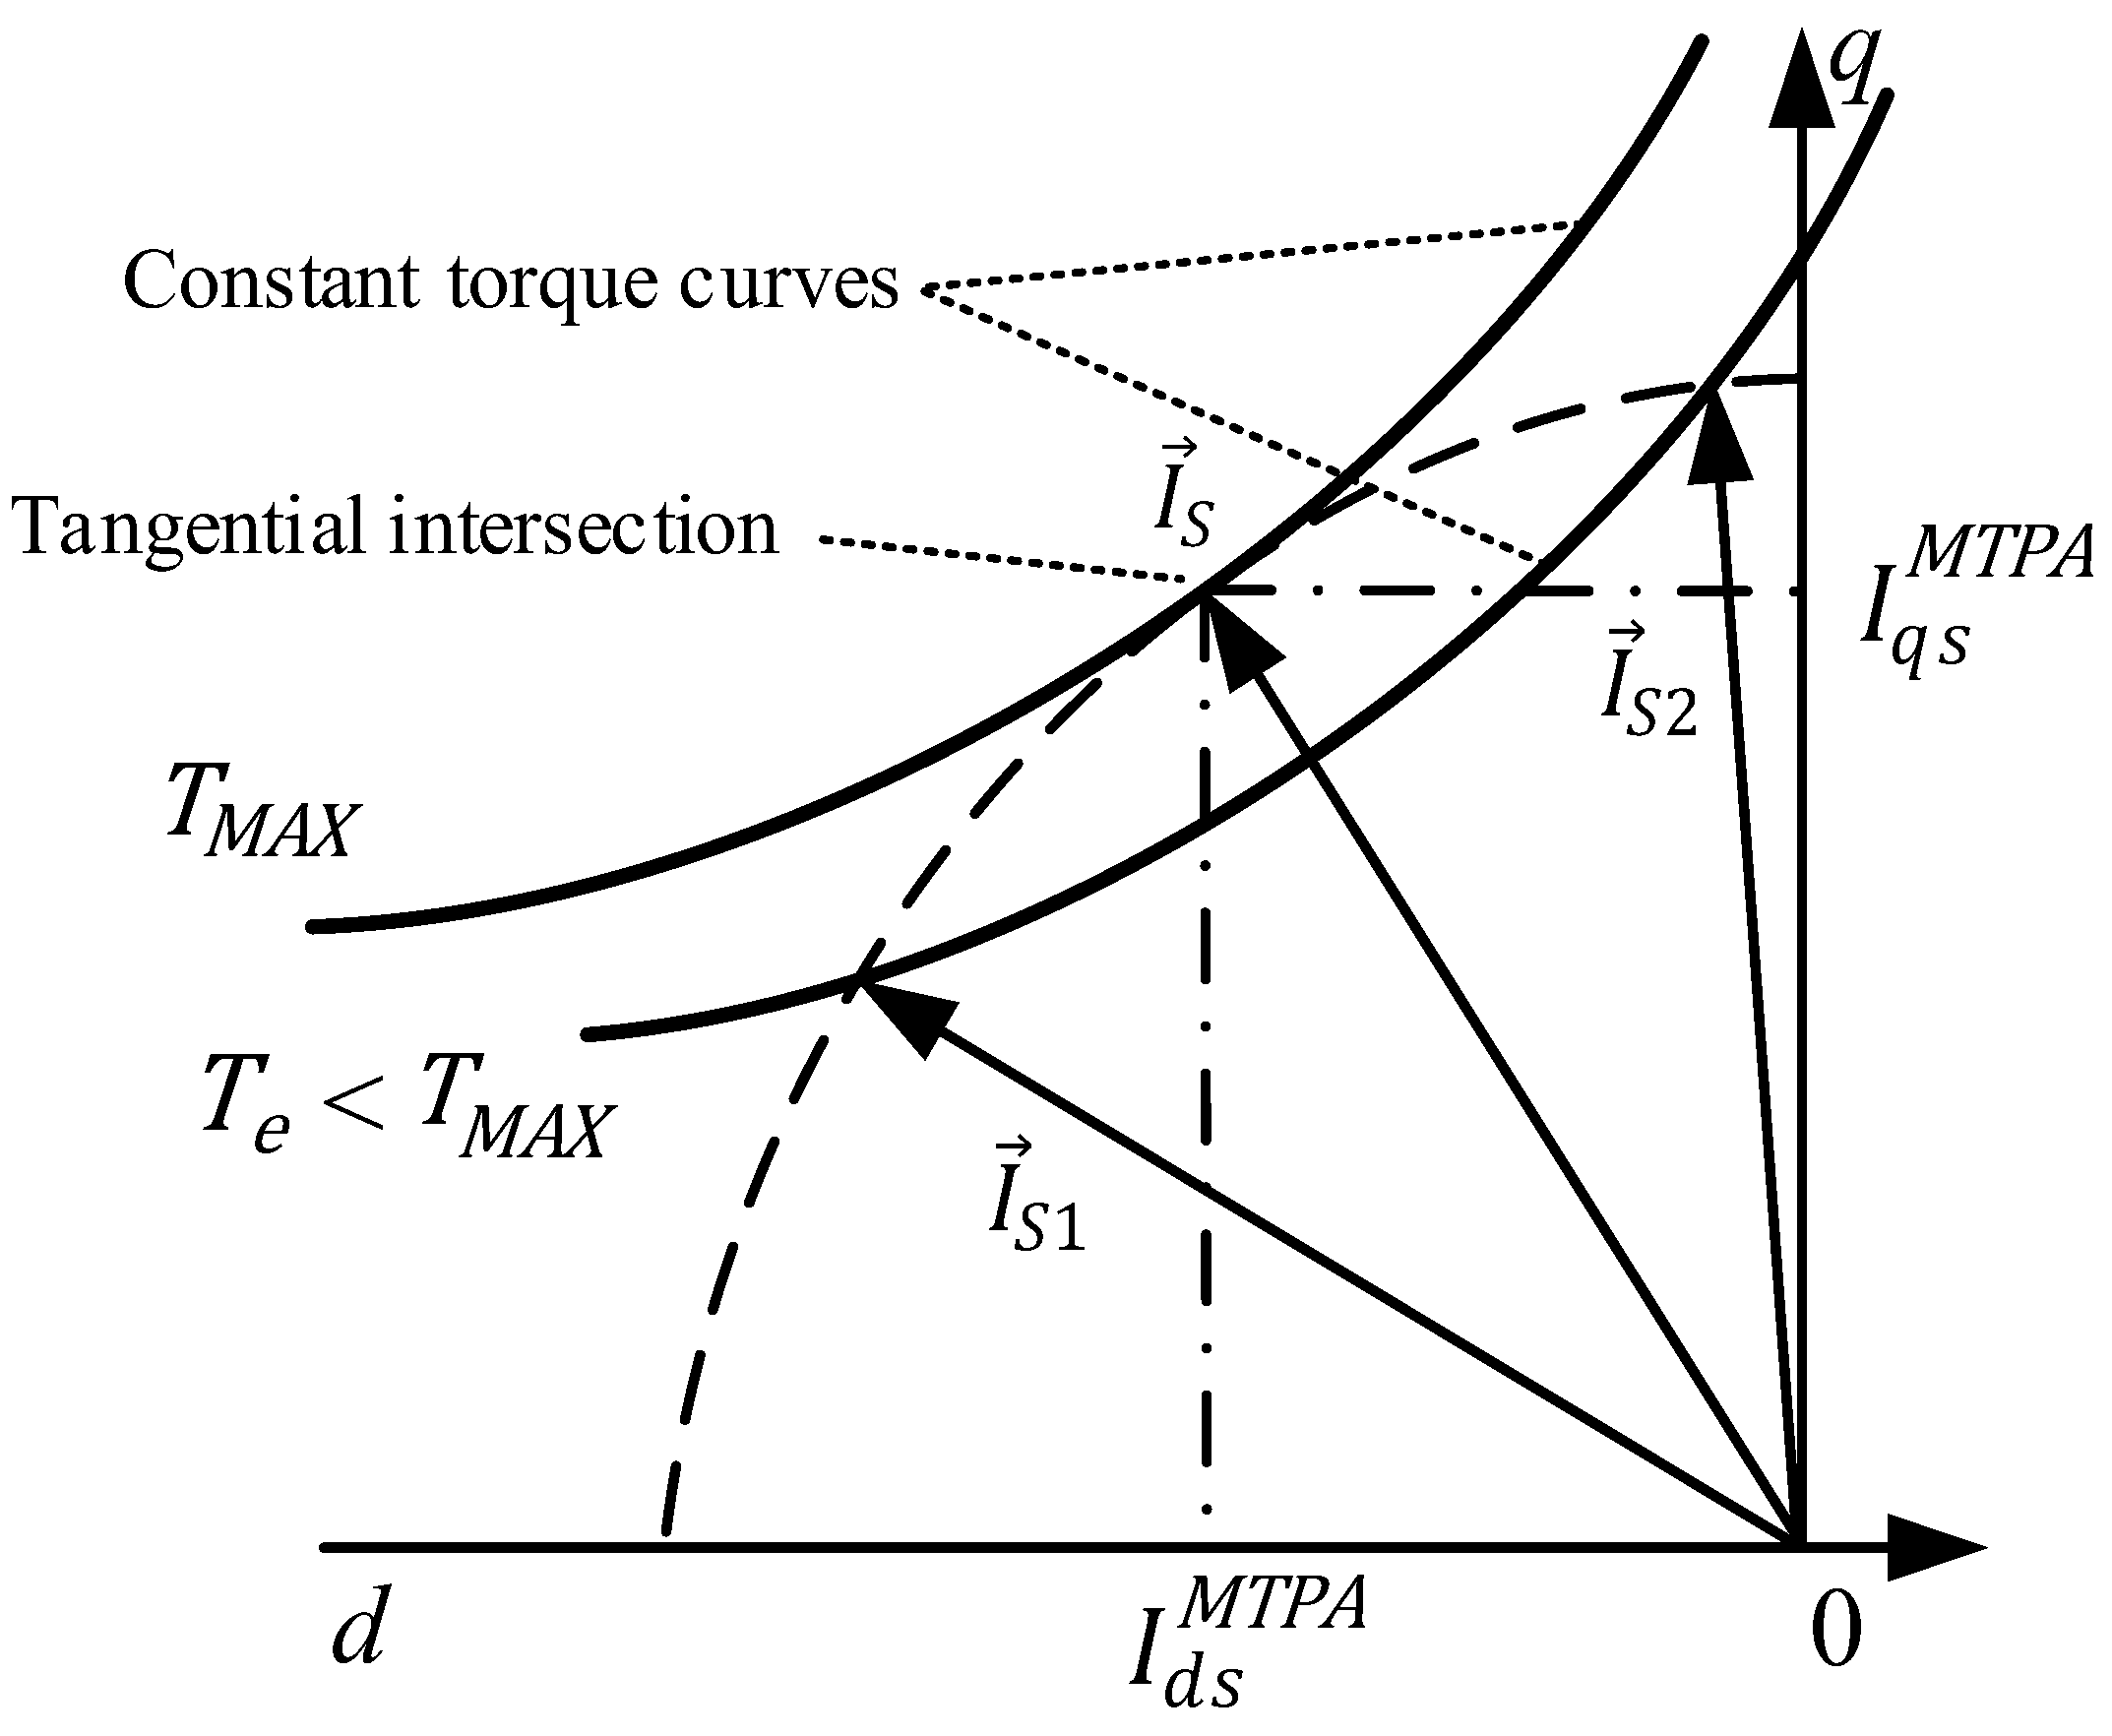
In this paper, the MTPA strategy is used to increase IPMSM’s energy efficiency by minimizing the stator copper loss component, providing a full torque generating capability with respect to the inverter current ratings. The magnitude of the stator current vector I s is the input to the optimal control block, confining the feasible solution to the set of points on the circle in the dq current plane. In order to generate peak torque, the controller performs the orientation of the stator current vector on the tangential intersection point with the T M A X constant torque curve at ( I d s M T P A , I q s M T P A ), as shown in Figure 12. Deviating from the optimal ( I d s M T P A , I q s M T P A ) point, the cases with the vector orientation I s 1 and I s 2 will result in a decrease in the torque T e < T M A X , and thus, in suboptimal IPMSM drive operation.
In order to verify the nonlinear magnetic model of the machine, the MTPA strategy based on the linear model will be introduced first.

5.1. MTPA Linear Strategy Based on IPMSM’s Constant Parameters

The linear machine model neglects the magnetic saturation of IPMSM and represents the most common approximation approach when dealing with the optimization problem [30]. In that case, the algebraic flux linkage model univocally defines the inductances and rotor flux–linkage excitation due to the existence of permanent magnets.
Applied to the original research in this paper, the nonlinear magnetic model (7) and (8) derives to the form:
i d s = ψ d s k d / a d 0 i f / a d 0 , i q s = ψ q s k q / a q 0
The mathematical formulation of the MTPA control algorithm considers defining the multivariable criterion function, the IPMSM electromagnetic torque T e , of (3):
T e = 3 2 p k d i f i q s + k d / a d 0 k q / a q 0 i d s i q s
The system constraint involves a set of feasible points on the stator current circle of magnitude I s , analytically expressed in the form:
G i d s ,   i q s = i d s 2 + i q s 2 I s   i d s 0
A nonlinear programming problem can be mathematically formulated as:
m a x 3 2 p k d i f i q s + k d / a d 0 k q / a q 0 i d s i q s i d s 2 + i q s 2 I s = 0 i d s 0
The Lagrangian function of the nonlinear programming problem can be defined as follows:
L i d s ,   i q s ,   λ 1 = T e i d s ,   i q s + λ 1 G i d s ,   i q s
By finding the gradient vector of L i d s ,   i q s ,   λ 1 and equating it to zero:
L = 0 L i d s , i q s , λ 1 i d s L i d s , i q s , λ 1 i q s L i d s , i q s , λ 1 λ 1 = 0
leading to:
L i d s = 3 2 p k d / a d 0 k q / a q 0 i q s + λ 1 i d s i d s 2 + i q s 2 = 0 L i q s = 3 2 p k d i f + k d / a d 0 k q / a q 0 i d s + λ 1 i q s i d s 2 + i q s 2 = 0 L λ 1 = i d s 2 + i q s 2 I s = 0
Solving (20) with the respect to i d s and i q s yields the optimal ( I d s M T P A , I q s M T P A ) distribution:
I d s M T P A = I M T 1 1 + 1 2 I s I M T 2   I q s M T P A = I M T I s I M T 2 1 1 + 1 2 I s I M T 2 2
where I M T is defined as:
I M T = k d i f 4 k q / a q 0 k d / a d 0

5.2. MTPA Nonlinear Strategy Based on the Proposed Magnetic Model

If nonlinear magnetic model (7) and (8) is assumed, then an alternative method of resolving the MAPT optimization problem is required. To solve this constrained nonlinear problem, the interior-point algorithm, using the barrier method, is implemented in MATLAB R2023a software. In conjunction with an initial condition computed using (21) for the MAPT linear strategy, the algorithm converges in a limited number of steps, resulting in a low computational burden. Interior-point techniques apply Newton’s method to a series of constrained problems to solve the original optimization problem. Original optimization problem (17) is transformed as follows (23):
m a x i m i z e       T e i d s , i q s   s u b j e c t   t o     G i d s , i q s = 0 ,     i d s 0
where T e i d s , i q s   is the objective function, in general form, of (3) and G i d s , i q s , and i d s 0 are the equality and inequality constraints.
Newton’s method requires that (23) should be reduced to a discrete number ( i ) of approximate maximization problems (24), with the addition of an logarithmic term, known as a barrier function:
m a x i m i z e   f μ i d s , i q s , s = m a x   T e i d s , i q s , s μ i l n s i   s u b j e c t   t o     s 0 ,             G i d s , i q s = 0 ,             i d s + s = 0
where   μ > 0 is the barrier parameter, and s is a vector of the slack variables.
The trust region (conjugate gradient) is used in each iteration to solve Equation (24). The approximate problem (24) converges to the original problem (23) as the sequence of barrier parameters μ converges to zero with each iteration. The termination test for the barrier problem depends on the chosen error tolerances.
The nonlinear relations between the current vector and the flux linkages defined by the inverse flux maps, given in Section 4, will lead to obtaining the optimal trajectories in the dq plane of the MTPA nonlinear algorithm. In the following section, the outcomes of nonlinear optimization will be verified through comparison with both the experimental and linear model optimization results.

6. Validation of the Proposed Nonlinear Magnetic Model Utilized in the Improved MTPA Control Strategy

In this section, the experimental setup is described, and the results of the proposed nonlinear magnetic model utilized in the improved MTPA control strategy are presented and discussed.

6.1. Experimental Test Workbench

The test workbench used for the verification of the improved MTPA, based on the proposed nonlinear magnetic model of IPMSM, is presented in Figure 13.
It consists of low voltage induction motor (label 2) acting as a brake for testing the low voltage IPMSM traction drive (label 1) (parameters presented in Table 1). Elastic coupling is employed to suppress the negative effects caused by the mechanical vibrations, with the torque sensor (label 6) installed between the shafts. Loading of the IPMSM motor is performed by using bus sharing concept, where energy circulates between the motor and brake through the common DC link. This ensures that only the power equal to the losses of both machines is drawn from the sources. The DC link is fed from the four 12 V batteries, connected in series, to form a stable voltage source of 48 V (label 4). A second DC supply, with variable voltage switching, is connected in parallel to power the batteries from the grid while the drive is in the idle state (label 5).
Power electronics consist of two two-level pulse width modulation (PWM) voltage source inverters (VSI), with the metal–oxide–semiconductor field-effect transistor (MOSFET) switches commutating at the carrier frequency of f P W M 16   kHz (label 3). Digital control and the algorithm implementation is performed using the microcontroller STM32F303, which possesses an advanced central processing unit (CPU) core and an arithmetic logic unit (ALU), based on an ARM Cortex M4 architecture at 72 MHz clock, to decrease the execution time. Data acquisition from the microcontroller to the PC terminal and vice versa is achieved via a CAN serial interface. Graphical user interface (GUI) (label 7), programming, and software verification are included to ensure proper control and data recording.

6.2. Experimental Results and Disccusion

To validate the developed nonlinear magnetic model employed in the enhanced MTPA control approach, three different methods for implementing the MTPA control strategy were compared. The trajectories of the MTPA algorithm based on the classical linear model, the proposed nonlinear magnetic model, and experiments were compared.
In order to determine the optimal pairs of currents in the dq plane using Equation (21) for the well-known linear model, the MTPA curve’s trajectory at various input current magnitude references is calculated. In the case of a non-linear magnetic model, a numerical implementation of the procedure was used to identify the optimal MTPA trajectory, based on (24).
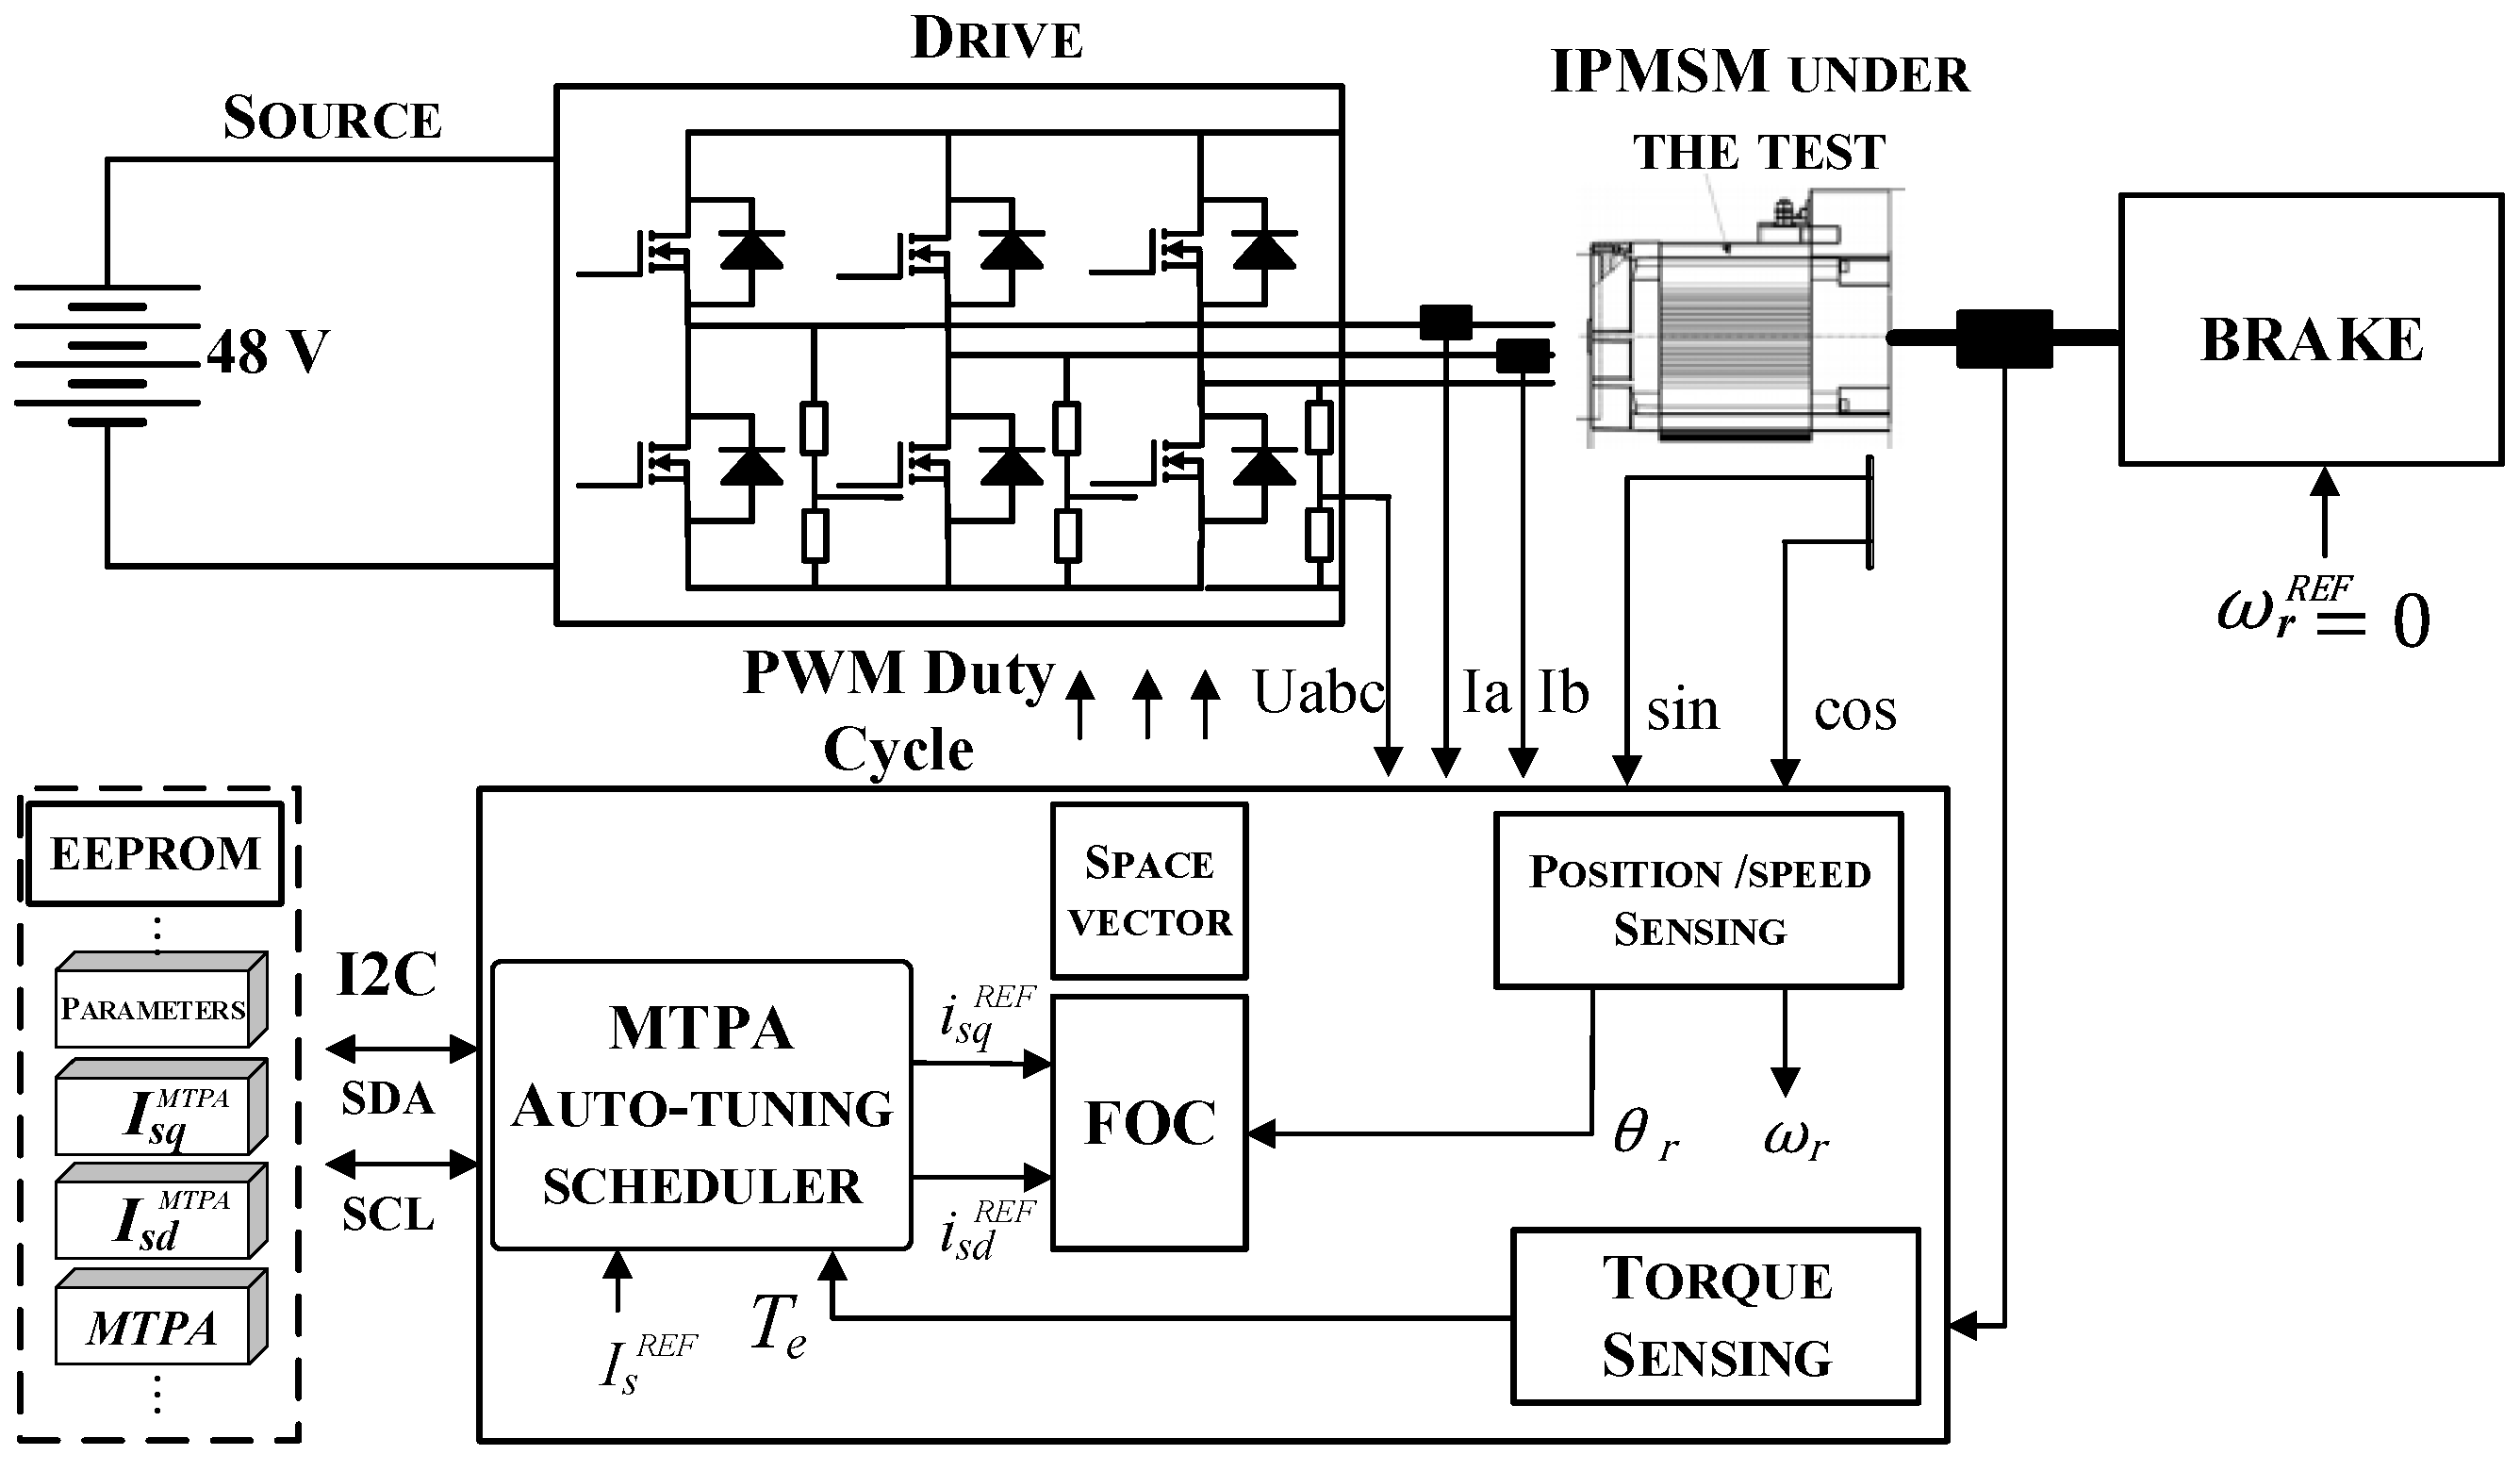
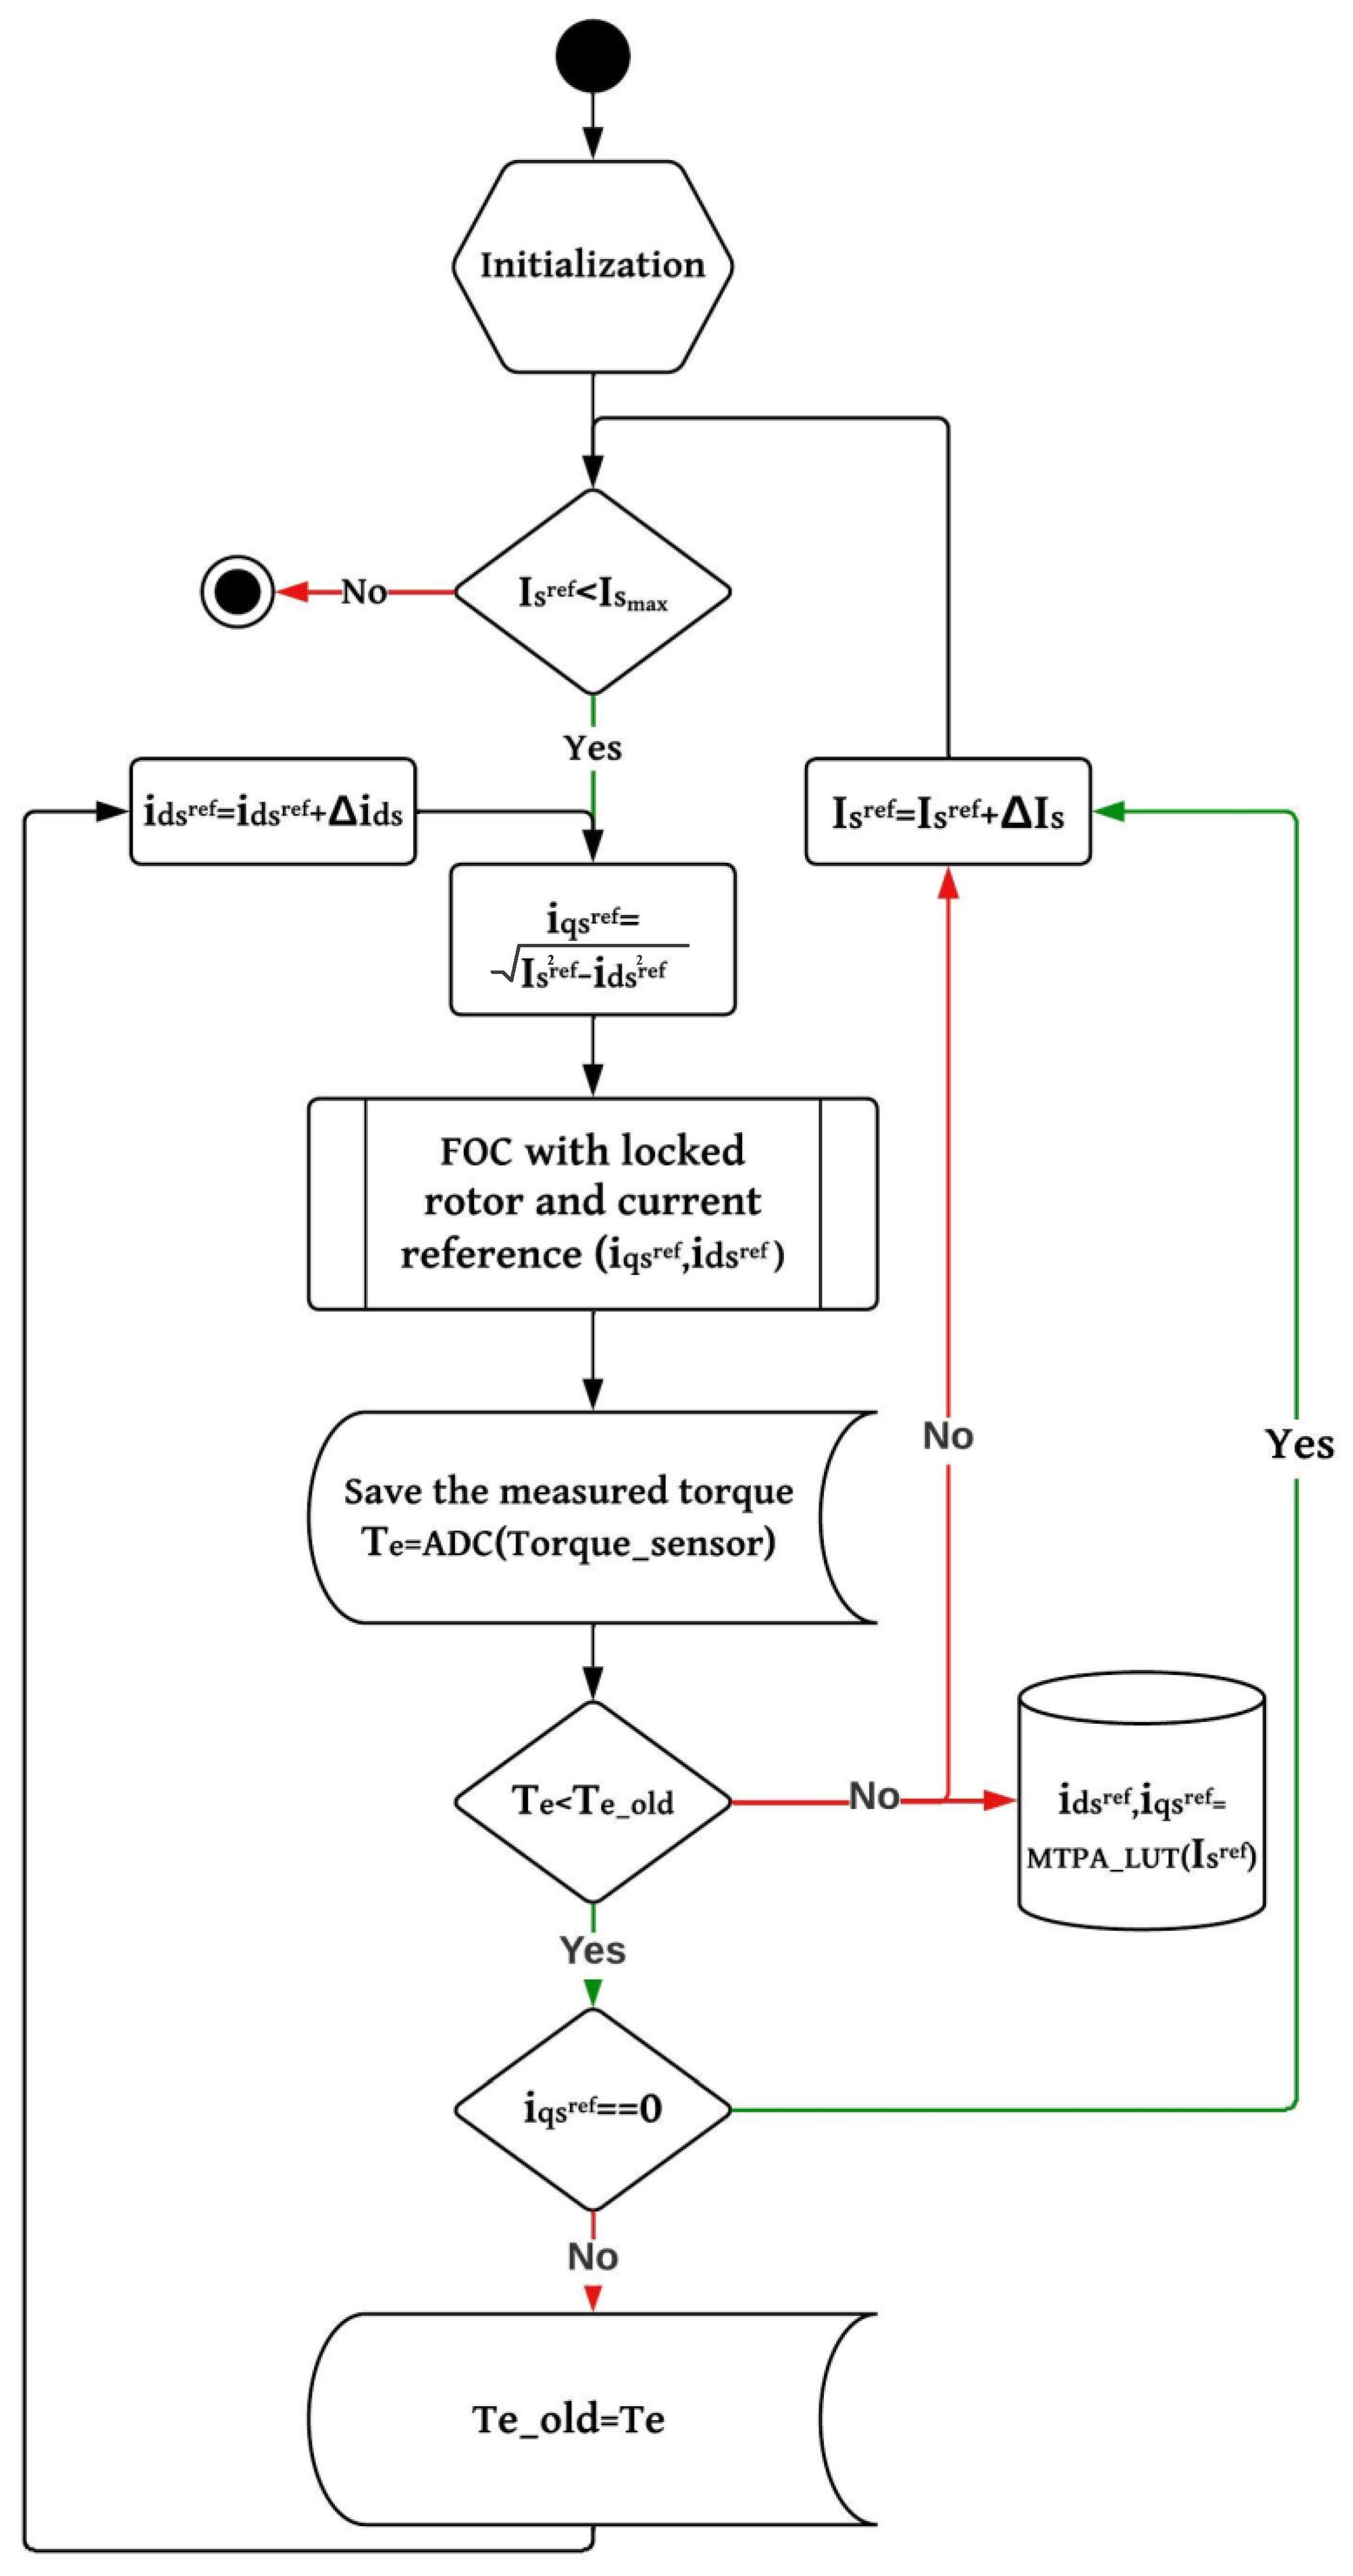
During the offline mode, an auto-tuning based calibration test (Figure 14) was conducted to ensure that, for a given value of the reference current magnitude, the maximum torque on the motor shaft was achieved [31]. The experimental setup is set so that the brake operates in the speed mode, with a zero reference speed. The speed bandwidth of the braking machine is set to an extremely high value; therefore, it act as a virtually infinite mechanical load to support the rotor at standstill, regardless of the IPMSM torque. The mechanical torque detected on the shaft by the torque sensor fully corresponds to the electromagnetic torque, since iron and mechanical loss components are not present.
The process of the calibration of the optimal MTPA trajectory is performed by the MTPA scheduler, involving varying the i d s , i q s currents for a fixed magnitude I s , while simultaneously measuring T e using the torque sensor. By using a proper search algorithm, the pair of optimal self-commissioned i d s , i q s , resulting in the maximum torque on the shaft, is determined and stored in the form of LUT within the EEPROM of microcontroller.
An algorithm, in flow chart form (Figure 15), was created in order to clarify the fundamental principles behind the proposed auto-tuning based calibration test.
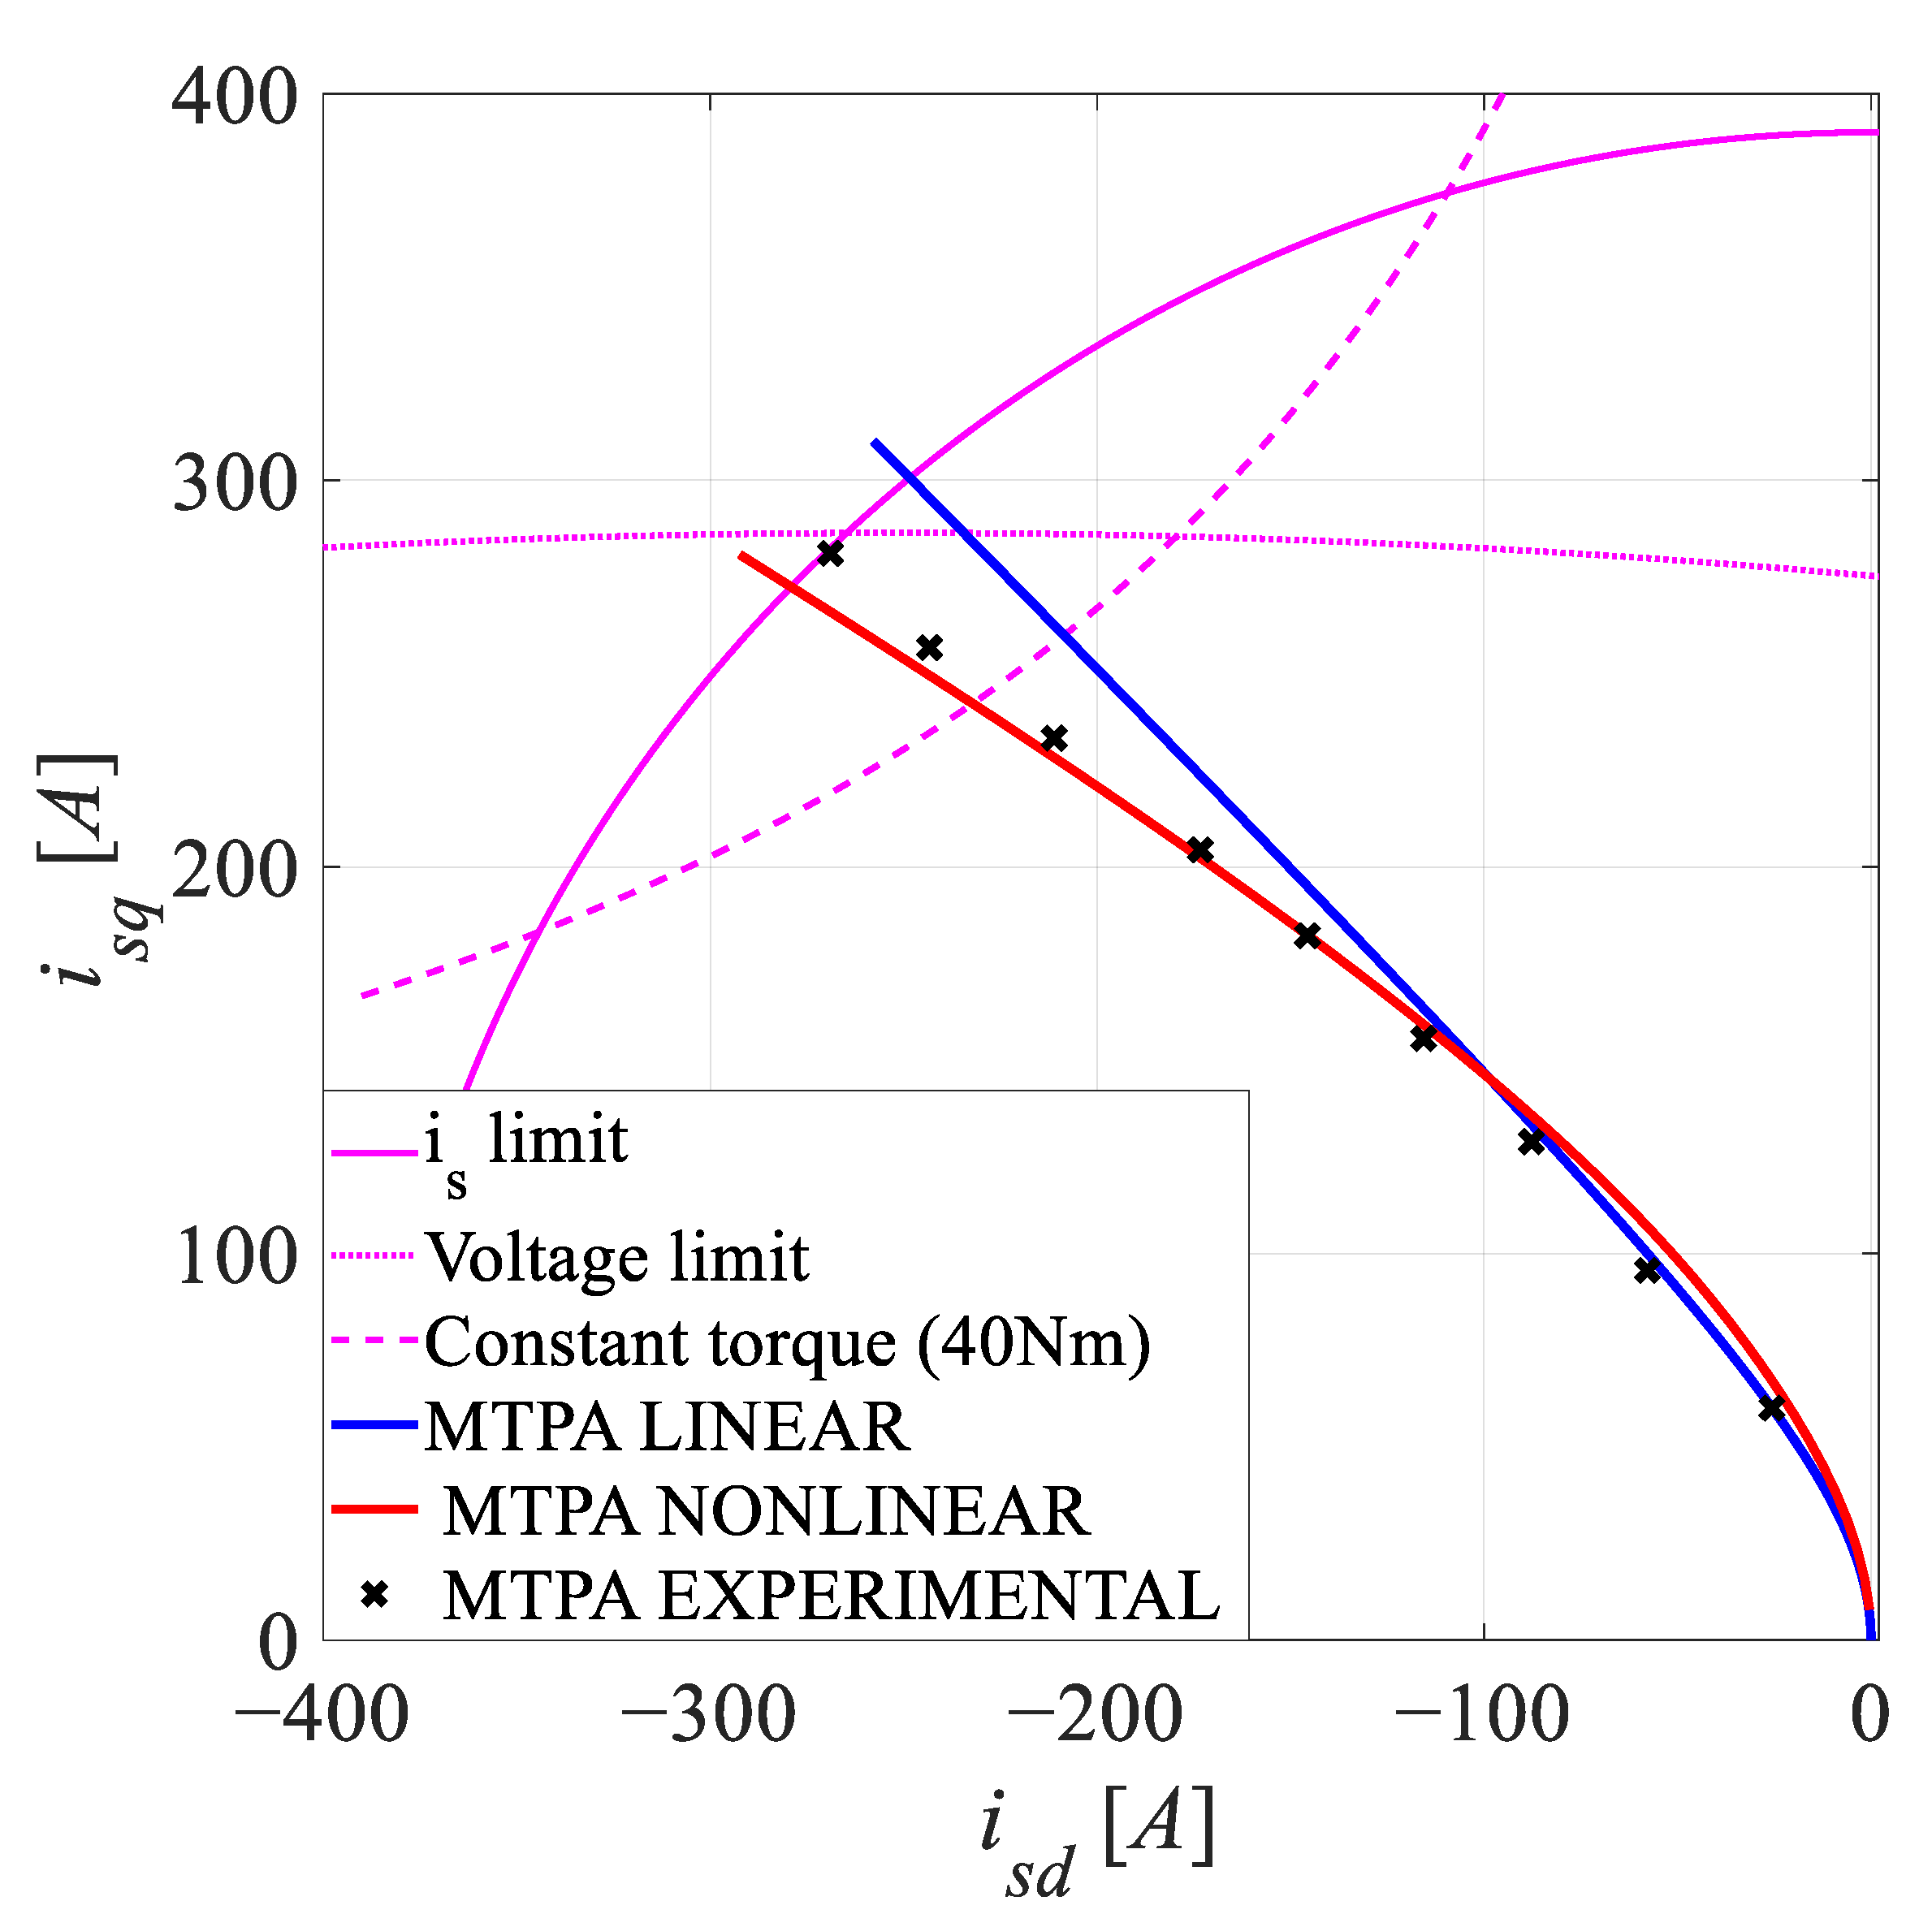
Optimal MTPA trajectories obtained from the three different aforementioned methods are displayed in Figure 16. Furthermore, Figure 16 also shows the constant torque curve, as well as the current and voltage constraints.
As anticipated, Figure 16 demonstrates a good alignment of the three different methods in the region of small currents (torques). In the area of higher current values, the effects of magnetic saturation are more prominent, making the differences between the optimal trajectories derived on the basis of the classic linear and nonlinear magnetic models more noticeable. On the other hand, the trajectories based on the nonlinear model still exhibit a high degree of agreement with the experimentally obtained trajectories, thus confirming the accuracy of the proposed FEA-based magnetic model.
While the experimental verification results are in very good accordance with those of the proposed model, it is important to note some inconsistencies and limitations in the proposed methodology. Although an exact, highly numerically technique is offered by the FEA method used to develop the proposed model, it is largely dependent on the precision and availability of the input parameters. The magnetic properties of the steel sheets used for the modeling of the magnetic circuit might not be reflect the exact properties of the particular material that was used in the machine production process. Differences most often occur due to the fabrication process of the sheets, a different series used in the installation, the specific manufacturer, etc. Similar deviations can be expected in the case of permanent magnets. When compared to findings acquired using FEMM 4.2, which makes use of the particular properties of the material included in their database, all these differences may cause a certain amount of scatter in the results.
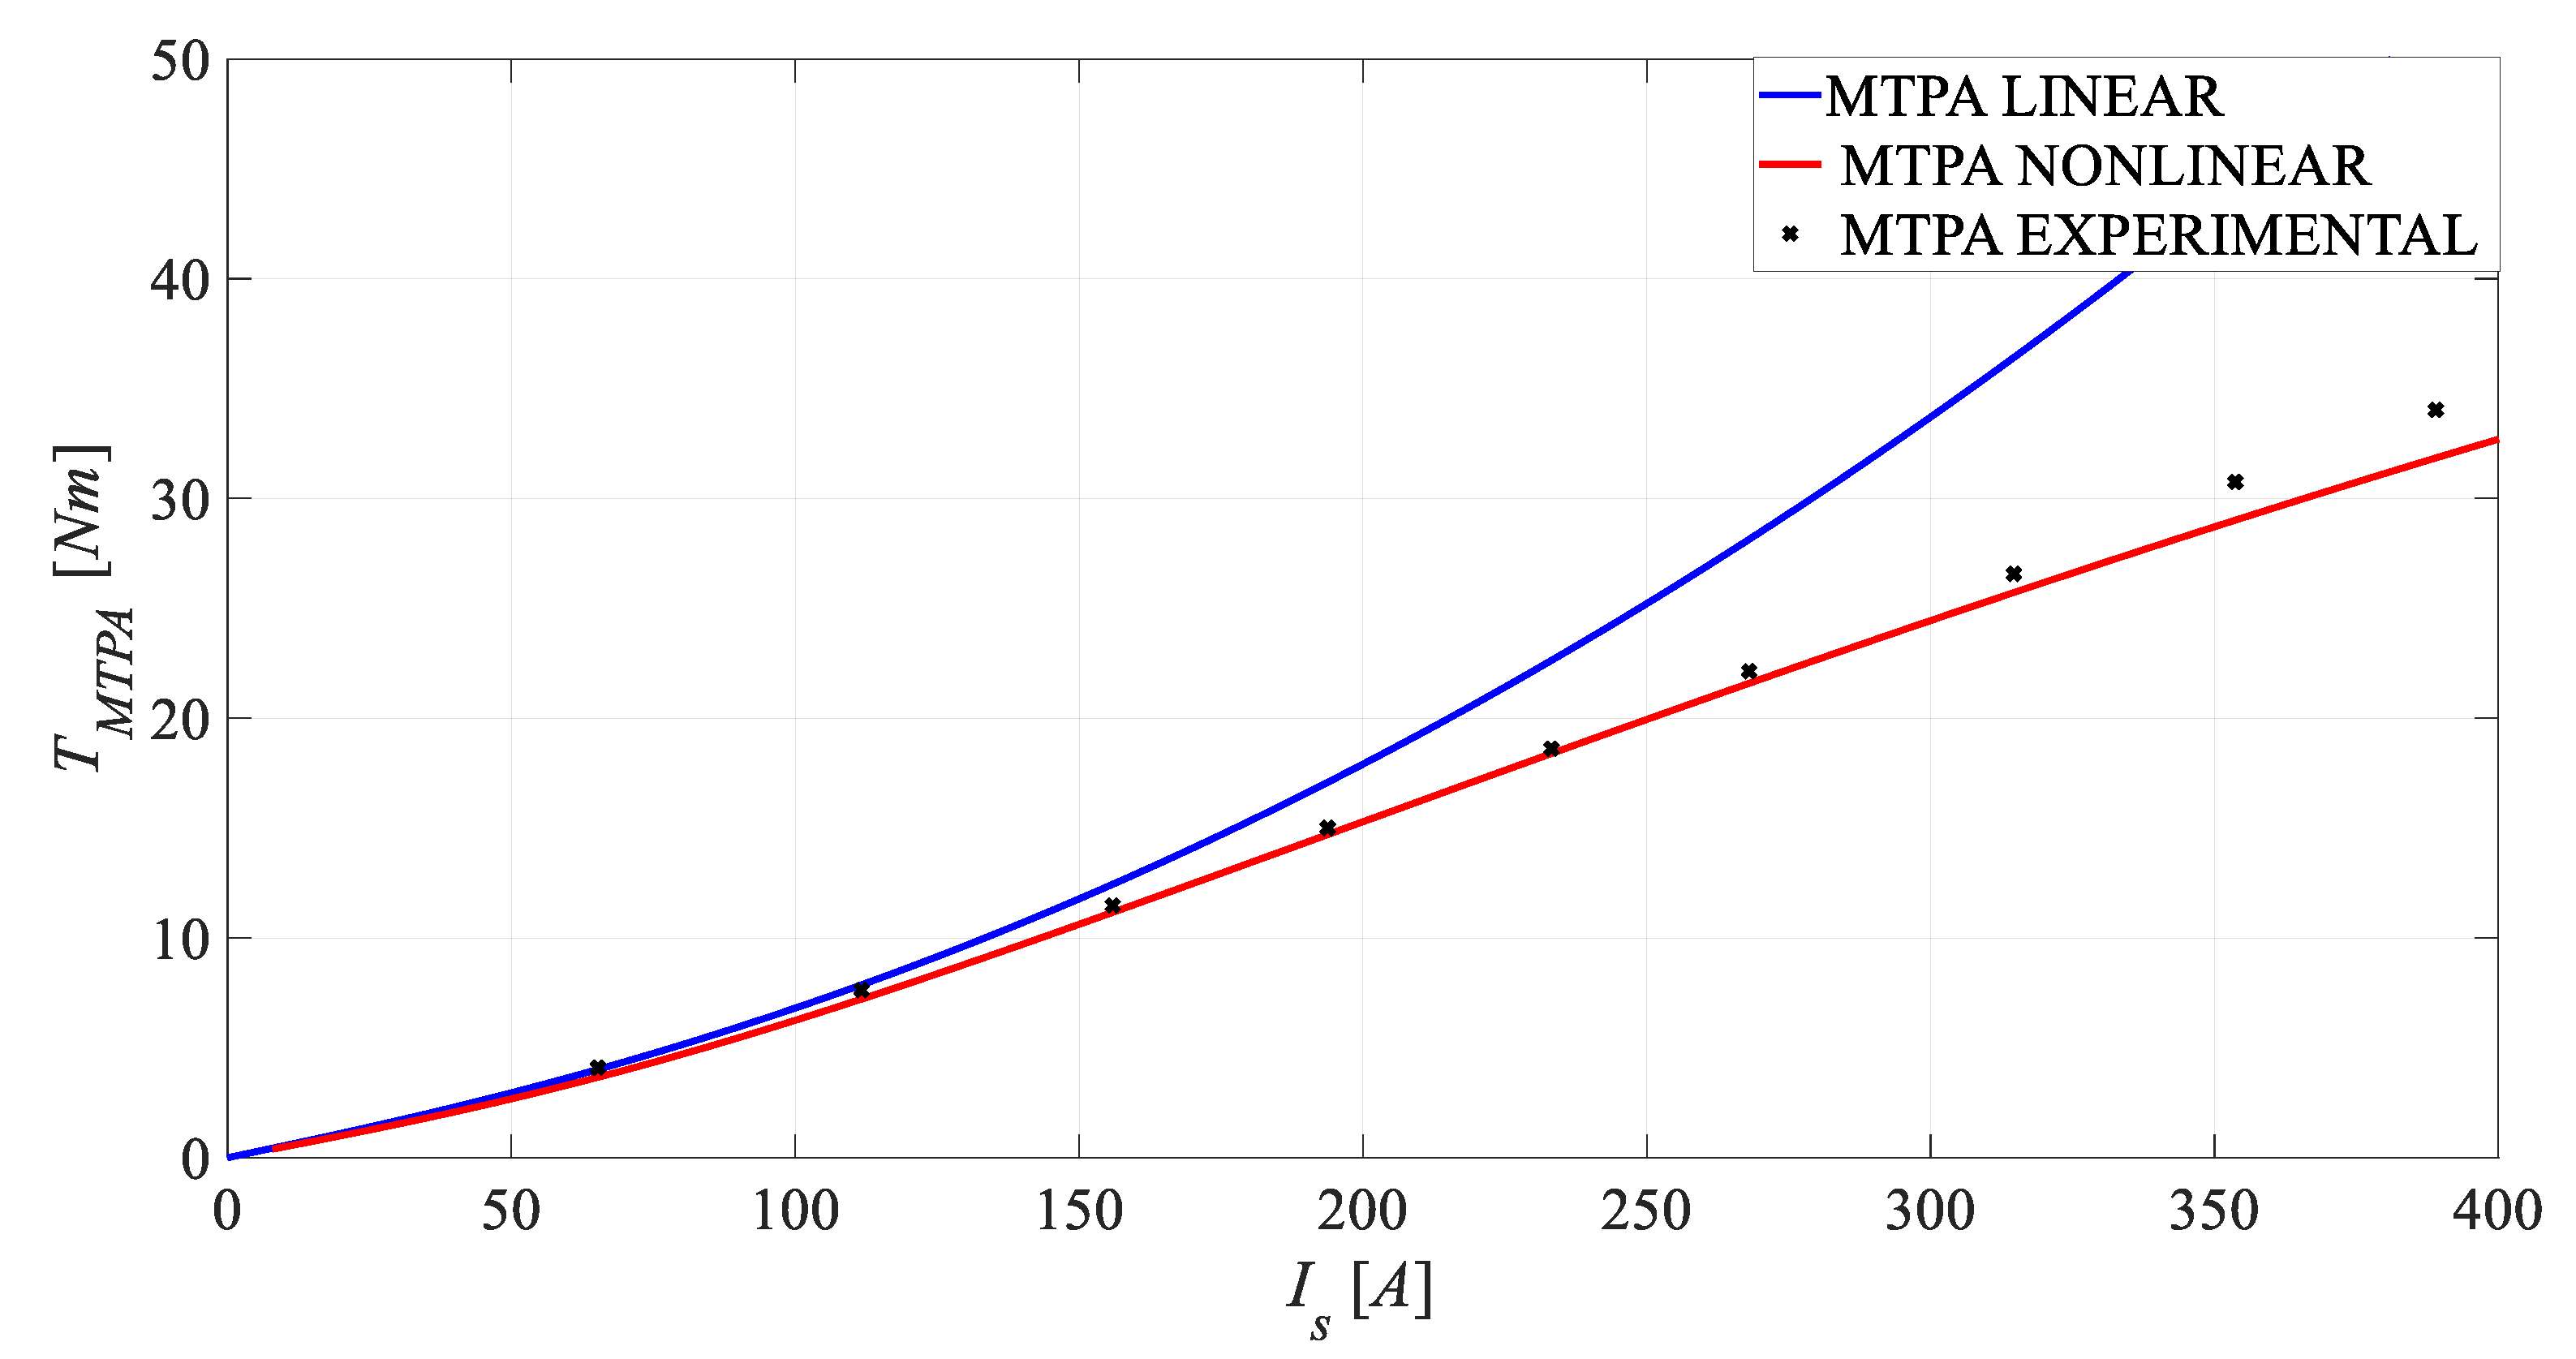
Figure 17 depicts the dependence of the available electromagnetic moment as a function of the current amplitude. An important characteristic that can be observed from the graph is the significant overestimation of the available torque of the machine if the classic magnetic model with constant parameters is used. In the case of using the nonlinear model, the predicted available moment is again in better agreement with the experimentally obtained results.
The individual components of the currents i d s , i q s derived using the nonlinear magnetic model correspond even more accurately to the experimental verification results, as can be seen in Figure 18. The results demonstrate the improved accuracy of the nonlinear model based on FEA frozen permeability, particularly when significant currents and high saturation are present.

7. Conclusions

This paper presents the low voltage IPMSM enhanced nonlinear magnetic model, which was created using the FEMM 4.2’s FP technique. The FP FEA technique is described, and the complete implementation algorithm is presented in Section 3. The results obtained based on FEA simulations are incorporated into the nonlinear magnetic model of the machine in the form of inverse flux maps. Inverse flux maps represent the stator current functions of the d and q axis stator fluxes, and the issue caused by the interpretation of these dependences is also discussed in the paper. An enhanced and physically inspired analytical function for fitting inverse flux maps of the IPMSM using the results of the FEA FP technique is proposed. The selection of fitting coefficients, based on conventional and FP FEA techniques, is thoroughly examined. Afterwards, the proposed nonlinear magnetic model is applied to compute the optimal current components in the dq current plane for the MTPA control strategy. Through a range of computer simulations based on FEA and MATLAB software, as well as on an actual IPMSM traction drive experimental setup, the suggested nonlinear magnetic model and the improved MTPA control strategy are validated. The significant influence of magnetic saturation on the path of the optimal trajectory of the MTPA control was confirmed, showing that the proposed nonlinear magnetic model exhibits better agreement with the results of the experiments than do the classical linear models. The primary objective of optimal control strategies is the comprehensive improvement of plant performance; therefore, further enhancement of the suggested methodology could have an impact on power efficiency. Further use of the nonlinear magnetic model could be extended to other advanced control techniques, especially those in which electric vehicle drives experience the most pronounced electromagnetic and mechanical stresses. Moreover, taking into account the influence of the variation of the input parameters of the machine construction material can contribute to even more accurate modeling using the FP FEA technique. Finally, it is worth considering the limitation of the presented model in the low torque and high-speed region, where iron loss phenomena are dominant. In that case, the magnetic model will not be algebraic, but must include the dynamics of iron loss phenomena, which increase the model order and add additional complexity to the control. The consideration of the complete loss mechanism toward a loss model controller would be a good starting point for future research.

Author Contributions

Conceptualization, M.V., V.P. and D.J.; methodology, D.M. and V.V.; software, M.B. and M.J.; validation, M.V., V.P. and D.J.; formal analysis, D.M.; investigation, M.V., V.P. and D.J.; resources, D.M. and V.V.; data curation, M.V. and V.P.; writing—original draft preparation, M.V., V.P. and D.J.; writing—review and editing, D.M.; visualization, M.B. and M.J.; supervision, V.P. and D.M.; project administration, V.P. and D.J.; funding acquisition, M.V. and V.V. All authors have read and agreed to the published version of the manuscript.

Funding

The APC was funded by Infineon Austria’s IPCEI In-Kind Booster program.

Data Availability Statement

All data are available as part of the article, and no additional source data are required.

Conflicts of Interest

The authors declare no conflicts of interest.

References

  1. Gundogdu, T.; Zhu, Z.-Q.; Chan, C.C. Comparative Study of Permanent Magnet, Conventional, and Advanced Induction Machines for Traction Applications. World Electr. Veh. J. 2022, 13, 137. [Google Scholar] [CrossRef]
  2. Liu, X.; Chen, H.; Zhao, J.; Belahcen, A. Research on the Performances and Parameters of Interior PMSM Used for Electric Vehicles. IEEE Trans. Ind. Electron. 2016, 63, 3533–3545. [Google Scholar] [CrossRef]
  3. Yang, Y.; Castano, S.M.; Yang, R.; Kasprzak, M.; Bilgin, B.; Sathyan, A.; Dadkhah, H.; Emadi, A. Design and Comparison of Interior Permanent Magnet Motor Topologies for Traction Applications. IEEE Trans. Transp. Electrif. 2017, 3, 86–97. [Google Scholar] [CrossRef]
  4. Stumberger, B.; Stumberger, G.; Dolinar, D.; Hamler, A.; Trlep, M. Evaluation of Saturation and Cross-Magnetization Effects in Interior Permanent-Magnet Synchronous Motor. IEEE Trans. Ind. Appl. 2003, 39, 1264–1271. [Google Scholar] [CrossRef]
  5. Meessen, K.J.; Thelin, P.; Soulard, J.; Lomonova, E.A. Inductance Calculations of Permanent-Magnet Synchronous Machines Including Flux Change and Self- and Cross-Saturations. IEEE Trans. Magn. 2008, 44, 2324–2331. [Google Scholar] [CrossRef]
  6. Li, C.; Zhang, W.; Gao, J.; Huang, S. Permanent Magnet Flux Linkage Analysis and Maximum Torque per Ampere (MTPA) Control of High Saturation IPMSM. Energies 2023, 16, 4717. [Google Scholar] [CrossRef]
  7. Lai, C.; Feng, G.; Mukherjee, K.; Kar, N.C. Investigations of the Influence of PMSM Parameter Variations in Optimal Stator Current Design for Torque Ripple Minimization. IEEE Trans. Energy Convers. 2017, 32, 1052–1062. [Google Scholar] [CrossRef]
  8. Bianchini, C.; Bisceglie, G.; Torreggiani, A.; Davoli, M.; Macrelli, E.; Bellini, A.; Frigieri, M. Effects of the Magnetic Model of Interior Permanent Magnet Machine on MTPA, Flux Weakening and MTPV Evaluation. Machines 2023, 11, 77. [Google Scholar] [CrossRef]
  9. Miao, Q.; Li, Q.; Xu, Y.; Lin, Z.; Chen, W.; Li, X. Virtual Constant Signal Injection-Based MTPA Control for IPMSM Considering Partial Derivative Term of Motor Inductance Parameters. World Electr. Veh. J. 2022, 13, 240. [Google Scholar] [CrossRef]
  10. Su, S.-W.; Hackl, C.M.; Kennel, R. Analytical Prototype Functions for Flux Linkage Approximation in Synchronous Machines. IEEE Open J. Ind. Electron. Soc. 2022, 3, 265–282. [Google Scholar] [CrossRef]
  11. Wendel, S.; Karamanakos, P.; Dietz, A.; Kennel, R. Flux Linkage-Based Model Predictive Current Control for Nonlinear PMSM Drives. In Proceedings of the IECON 2020 The 46th Annual Conference of the IEEE Industrial Electronics Society, Singapore, 18–21 October 2020; pp. 3051–3056. [Google Scholar]
  12. Liu, K.; Feng, J.; Guo, S.; Xiao, L.; Zhu, Z.-Q. Identification of Flux Linkage Map of Permanent Magnet Synchronous Machines Under Uncertain Circuit Resistance and Inverter Nonlinearity. IEEE Trans. Ind. Inform. 2018, 14, 556–568. [Google Scholar] [CrossRef]
  13. Bedetti, N.; Calligaro, S.; Petrella, R. Stand-Still Self-Identification of Flux Characteristics for Synchronous Reluctance Machines Using Novel Saturation Approximating Function and Multiple Linear Regression. IEEE Trans. Ind. Appl. 2016, 52, 3083–3092. [Google Scholar] [CrossRef]
  14. Ortombina, L.; Tinazzi, F.; Zigliotto, M. Magnetic Modeling of Synchronous Reluctance and Internal Permanent Magnet Motors Using Radial Basis Function Networks. IEEE Trans. Ind. Electron. 2018, 65, 1140–1148. [Google Scholar] [CrossRef]
  15. Chen, B.; Wu, J.; Sun, Q.; Wu, H.; Zhang, L. FEA-Based Mathematical Modeling and Simulation for IPMSM Drive with Consideration of Saturation and Cross-Coupling Influence. In Proceedings of the 2019 22nd International Conference on Electrical Machines and Systems (ICEMS), Harbin, China, 11–14 August 2019; pp. 1–5. [Google Scholar]
  16. Ge, M.; Li, J.; Qu, R.; Lu, Y.; Chen, J. A Synthetic Frozen Permeability Method for Torque Separation in Hybrid PM Variable-Flux Machines. IEEE Trans. Appl. Supercond. 2018, 28, 1–5. [Google Scholar] [CrossRef]
  17. Elsherbiny, H.; Szamel, L.; Ahmed, M.K.; Elwany, M.A. High Accuracy Modeling of Permanent Magnet Synchronous Motors Using Finite Element Analysis. Mathematics 2022, 10, 3880. [Google Scholar] [CrossRef]
  18. Woo, T.-G.; Lee, S.-H.; Lee, H.-J.; Yoon, Y.-D. Flux Weakening Control Technique without Look-Up Tables for SynRMs Based on Flux Saturation Models. Electronics 2020, 9, 218. [Google Scholar] [CrossRef]
  19. Awan, H.A.A.; Song, Z.; Saarakkala, S.E.; Hinkkanen, M. Optimal Torque Control of Saturated Synchronous Motors: Plug-and-Play Method. IEEE Trans. Ind. Appl. 2018, 54, 6110–6120. [Google Scholar] [CrossRef]
  20. Jun, S.-B.; Kim, C.-H.; Cha, J.; Lee, J.H.; Kim, Y.-J.; Jung, S.-Y. A Novel Method for Establishing an Efficiency Map of IPMSMs for EV Propulsion Based on the Finite-Element Method and a Neural Network. Electronics 2021, 10, 1049. [Google Scholar] [CrossRef]
  21. Wendel, S.; Karamanakos, P.; Gebhardt, P.; Dietz, A.; Kennel, R. Flux Linkage-Based Direct Model Predictive Current Control for Synchronous Machines. IEEE Trans. Power Electron. 2021, 36, 14237–14256. [Google Scholar] [CrossRef]
  22. Hall, S.; Marquez-Fernandez, F.J.; Alakula, M. Dynamic Magnetic Model Identification of Permanent Magnet Synchronous Machines. IEEE Trans. Energy Convers. 2017, 32, 1367–1375. [Google Scholar] [CrossRef]
  23. Li, H.; Gao, J.; Huang, S.; Fan, P. A Novel Optimal Current Trajectory Control Strategy of IPMSM Considering the Cross Saturation Effects. Energies 2017, 10, 1460. [Google Scholar] [CrossRef]
  24. Lee, H.; Woldesemayat, M.L.; Nam, K. Zero Torque Control for EV Coasting Considering Cross-Coupling Inductance. IEEE Trans. Ind. Electron. 2017, 64, 6096–6104. [Google Scholar] [CrossRef]
  25. Hinkkanen, M.; Pescetto, P.; Molsa, E.; Saarakkala, S.E.; Pellegrino, G.; Bojoi, R. Sensorless Self-Commissioning of Synchronous Reluctance Motors at Standstill Without Rotor Locking. IEEE Trans. Ind. Appl. 2017, 53, 2120–2129. [Google Scholar] [CrossRef]
  26. Vagati, A.; Pastorelli, M.; Scapino, F.; Franceschini, G. Impact of Cross Saturation in Synchronous Reluctance Motors of the Transverse-Laminated Type. IEEE Trans. Ind. Appl. 2000, 36, 1039–1046. [Google Scholar] [CrossRef]
  27. Carbonier, M.; Soong, W.L.; Mahmoudi, A.; Bianchi, N. Fast Flux Mapping of PM and Synchronous Reluctance Machines: Method Description and Comparison with Full FEA Approach. In Proceedings of the 2021 IEEE Energy Conversion Congress and Exposition (ECCE), Vancouver, BC, Canada, 10–14 October 2021; pp. 3724–3730. [Google Scholar]
  28. Wu, Q.; Li, W.; Feng, G.; Zhang, B. Optimization Control of Canned Electric Valve Permanent Magnet Synchronous Motor. Electronics 2023, 12, 2433. [Google Scholar] [CrossRef]
  29. Morimoto, S.; Tong, Y.; Takeda, Y.; Hirasa, T. Loss Minimization Control of Permanent Magnet Synchronous Motor Drives. IEEE Trans. Ind. Electron. 1994, 41, 511–517. [Google Scholar] [CrossRef]
  30. Popovic, V.; Vujkov, B.; Vuckovic, M.; Vasic, V.; Marcetic, D.; Oros, D. MAPT Strategy for IPMSM with Parameter Sensitivity Analysis. In Proceedings of the 2020 International Symposium on Industrial Electronics and Applications (INDEL), Banja Luka, Bosnia and Herzegovina, 4–6 November 2020; pp. 1–4. [Google Scholar]
  31. Odhano, S.A.; Pescetto, P.; Awan, H.A.A.; Hinkkanen, M.; Pellegrino, G.; Bojoi, R. Parameter Identification and Self-Commissioning in AC Motor Drives: A Technology Status Review. IEEE Trans. Power Electron. 2019, 34, 3603–3614. [Google Scholar] [CrossRef]
Figure 1. Model of IPMSM in the dq reference frame with stator flux linkages as state variables.
Electronics 13 00673 g001
Figure 2. Basic geometric and magnetic characteristics: (a) cross-section of the 36-slot, eight-magnet pole, three-phase low voltage IPMSM for EV traction drive; (b) magnetic characteristics of the ferromagnetic material (M250-35A).
Electronics 13 00673 g002
Figure 3. Flow chart algorithm showing the frozen permeability technique for highly precise magnetic model derivation.
Electronics 13 00673 g003
Figure 4. Flux density at nonlinear FEA simulation with complete excitation (PM + dq currents).
Electronics 13 00673 g004
Figure 5. Flux density distribution separated according to the proposed frozen permeability algorithm.
Electronics 13 00673 g005
Figure 6. Standard d axis flux linkage map.
Electronics 13 00673 g006
Figure 7. Separated d axis flux linkage components based on the frozen permeability algorithm: (a) only the current excitation flux linkage component in the d axis; (b) the PM flux linkage component in the d axis.
Electronics 13 00673 g007
Figure 8. Standard q axis flux linkage map.
Electronics 13 00673 g008
Figure 9. Separated q axis flux linkage components based on the frozen permeability algorithm: (a) only current excitation flux linkage component in the q axis; (b) PM flux linkage component in the q axis.
Electronics 13 00673 g009
Figure 10. Inverse d axis flux linkage map (obtained with FP-FEA).
Electronics 13 00673 g010
Figure 11. Inverse q axis flux linkage map (obtained with FP-FEA).
Electronics 13 00673 g011
Figure 12. Illustration of the MTPA stator current vector orientation of IPMSM.
Electronics 13 00673 g012
Figure 13. Experimental test workbench.
Electronics 13 00673 g013
Figure 14. Simplified block diagram of the MTPA auto-tuning based calibration test.
Electronics 13 00673 g014
Figure 15. Flow chart algorithm of the MTPA auto-tuning based calibration test.
Electronics 13 00673 g015
Figure 16. Optimal MTPA trajectories and constrains in the dq current plane.
Electronics 13 00673 g016
Figure 17. MTPA torque versus the stator current amplitude characteristics.
Electronics 13 00673 g017
Figure 18. Optimal MTPA trajectories of separate components in the dq current plane.
Electronics 13 00673 g018
Table 1. The basic parameters and dimensions of the IPMSM.
Parameter ValueParameterValue
Base power4.4 kWStator slots36
Rated voltage48 VStack length80 mm
Peak current390 ARotor pole number8
DutyS2-60 minFrequency66.66 Hz
Stator outer diameter175 mmAir-gap length0.5 mm
Stator inner diameter110 mmMagnet dimensions2 × (4 × 10) mm
Rotor outer diameter109 mmMagnet materialN35UH
Rotor inner diameter33 mmMagnetic steel materialM250-35A
Table 2. Parameters of the proposed fitting functions.
ParameterValueParameterFEAFP-FEA
A0 k d   Wb / A 35 × 10−637 × 10−6
B0 k q   Wb / A 110 × 10−6111 × 10−6
C = E2 i f   A 246.59251.57
D4 a d q   A 2 5.928 × 10−66.175 × 10−6
F0 a q 0   p . u . 0.98000.9896
a d 0   p . u . 1 a q q   A 4 1.004 × 10−141.279 × 10⁻¹⁴
a d d   p . u . 0 a q d   A 2 1.886 × 10−62.058 × 10−6
Table 3. Goodness of fit.
d Axis Flux Linkage Map Fitq Axis Flux Linkage Map Fit
ParameterFEAFP-FEA ParameterFEAFP-FEA
SSE2.866 × 1059.441 × 104SSE3.525 × 1051.547 × 105
R-square0.98780.9960R-square0.98500.9934
RMSE13.067.494RMSE14.489.597
Disclaimer/Publisher’s Note: The statements, opinions and data contained in all publications are solely those of the individual author(s) and contributor(s) and not of MDPI and/or the editor(s). MDPI and/or the editor(s) disclaim responsibility for any injury to people or property resulting from any ideas, methods, instructions or products referred to in the content.