


A Cyber-Physical Testbed for IoT Microgrid Design and Validation

Department of Computer Science and Information Engineering, National Taiwan Normal University, Taipei City 116, Taiwan
*
Author to whom correspondence should be addressed.
Electronics 2024, 13(7), 1181; https://doi.org/10.3390/electronics13071181
Submission received: 31 January 2024
/
Revised: 16 March 2024
/
Accepted: 20 March 2024
/
Published: 23 March 2024
(This article belongs to the Topic Innovation, Communication and Engineering)
Abstract
:Microgrids are small power systems, often equipped with renewable energy sources, that are alternatives or supplementary to utility grids. Many studies have been conducted on the design and implementation of microgrids and their interconnects to utility grids, and investigations have been extended to the use of Internet of Things technology (IoT) to monitor and operate such power grids. However, the broad applications of the IoT technology itself also call for a green energy solution. This paper investigates how to power local IoT applications via an integration of a microgrid and the utility grid. Together, we call such a system an IoT microgrid. The goal of an IoT microgrid is to maintain the availability of IoT applications while saving energy costs, and this is achieved by sustaining IoT applications via local renewable energy from a microgrid and by mitigating the intermittent power supply using the utility grid. This paper characterizes the IoT microgrid and proposes a configurable cyber-physical testbed for its design and validation. The testbed incorporates the hardware-in-the-loop (HIL) approach, where real-time simulation is integrated with physical elements for quick prototyping of those components in an IoT microgrid. The paper concludes with an example implementation of the proposed testbed, which demonstrates its use for validating both an IoT microgrid and the IoT application it sustains.
1. Introduction
Cyber-physical systems (CPS) are networked sensing, processing, and control systems that are tightly integrated with physical processes [1,2,3]. The advent of Internet-of-Things (IoT) technologies has equipped CPS systems with more pervasive data collection and system orchestration capabilities. Such systems are generally called CPS-IoT systems, while in the industry they are alternatively named Industrial Internet or Industrial Internet of Things (IIoT) [4]. CPS-IoT systems found their broad applications in industrial settings, medical domains, smart buildings, and smart cities [5,6,7,8].
Due to their nature of tight integration with the physical environment and objects, CPS-IoT systems are often costly to build and validate. As a pure simulation may fall short of fidelity to the real system, the hardware-in-the-loop (HIL) approach offers a needed trade-off between cost and fidelity [9,10]. In the HIL approach, the system under study is a hybrid of physical hardware components and real-time software simulation. For the simulation part, a field-programmable gate array (FPGA)-based real-time platform can produce and process real-time signals of the hardware it simulates [11]. The real-time platform may be configured for different physical parameter specifications, and, therefore, it may reduce development costs and quicken system prototyping. HIL examples are seen in vehicular technology [12,13], civil engineering [14], and power systems [15,16].
One of the critical CPS-IoT applications is smart grids, which aim to improve the management and control of conventional power grids (e.g., via smart metering [17,18] and energy management [19,20]). Smart grids in general are the integration of utility grids (also called the transmission grids) and microgrids (also known as the nanogrids [21]). Microgrids are small local grids of both electrical loads and generation [22,23], and they may be configured to either operate independently or connect to the utility grids. Microgrids are powered by renewable and/or rechargeable energy sources, and these sources are often subject to variability and intermittency. In some examples, the photovoltaic (PV) energy supply is subject to changing weather conditions, and the piezoelectric energy harvester [24] is subject to applied mechanical stress (e.g., from airflow [25] or human trampling [26]). Much research attention has been placed on exploring the interplay of the microgrid and the utility grid to which it connects. For example, for system protectability, temporal power surges in either of the grids could be isolated from each other; for system sustainability, a power shortage in the microgrid may be supplied by generation from the utility grid, and vice versa.
While studies on CPS-IoT applications for power grids are still much needed, it is also important to study power grids for CPS-IoT applications, in particular when there are increasingly many CPS-IoT applications that have been deployed or scheduled to be deployed. While each IoT device consumes relatively less energy than other assets do, the total number of IoT devices could be many and, as a whole, would still involve non-trivial energy costs. While conventional power grids may supply CPS-IoT applications, could there be some specific configurations that may be better fits for such applications and use green energy? Moreover, could HIL technology help in quick prototyping and validating such a solution?
In response, this paper explores a potential solution framework for powering CPS-IoT applications. In the solution framework, each IoT application is powered by a local microgrid using renewable energy sources, and each local microgrid may switch to draw power from the utility grid when needed. Because the energy demand from each local IoT application is relatively low, it could be sustained by local renewable energy sources for most of the time, and, also because of its low power profile, the occasional demand from such an IoT application to the utility grid would not cause much disturbance in the utility grid. This paper reports some initial findings in this research direction. The contributions are summarized as follows:
- A model for a microgrid for CPS-IoT applications (named IoT microgrid for short), including its specific assumptions that help formulate a suitable solution (Section 2.1).
- A cyber-physical testbed prototype for an IoT microgrid study, featuring configuration flexibility and quick prototyping via HIL technology (Section 2.2 and Section 2.3).
- An implementation of the proposed testbed and an example use of the testbed for sustaining IoT applications via integration of renewable energy and the utility grid (Section 3.1 and Section 3.2).
The rest of this section reviews some background and related work.
Background and Related Work
Many research discoveries in power electronics and energy systems have made it possible to interconnect microgrids and the utility grid. In particular, studies on power electronic converters [23] have helped harness the intermittent renewable energy sources used in microgrids and enabled a stable energy supply. The input–output relation of a power converter could be configured to be DC-DC (e.g., from a PV array to an IoT device), AC-AC (e.g., from a wind turbine to a variable speed motor drive system), AC-DC (e.g., from a piezoelectric energy harvester to a capacitor), or DC-AC (e.g., from a battery to the grid). To power a single IoT device, one may resort to a commercial-off-the-shelf (COTS) power adapter plug for AC-DC conversion from an ordinary AC power socket.
Discoveries of the use of renewable energy sources, among distributed energy resources (DER), motivate microgrids and their integration into the utility grid. The book by Masters gives a comprehensive introduction to renewable energy systems [27]. When the system is powered by renewable energy, its unstable power supply could cause damage to the system as well as the utility grid it connects to. In this regard, distributed power systems have multiple levels of control duties managed by energy management systems (EMSs). An EMS observes, regulates, and optimizes energy production and transfer [19], enabling users to locally deploy DERs for IoT applications. An EMS can manage various energy sources, such as PV arrays, piezoelectric energy harvesters, wind turbines, and energy storage systems, both to meet the electricity demand and make efficient energy utilization. Kanchev et al. [28] proposed energy management tools for future PV systems, coupled with storage systems. These systems together may provide greater flexibility of operation and enhance the capabilities of PV systems.
To test the characteristics and feasibility of different renewable energy sources, software simulation may be employed as an approach. Nevertheless, software simulations may suffer from inaccuracies and fail to demonstrate certain characteristics of renewable energy sources or electrical components. With this consideration, the HIL technique is used to enhance the accuracy of simulations while preventing the risk of damaging the real systems [29,30]. The HIL technology can be implemented in different fields, especially when the testing plant or system is hard to build or too expensive. The most common cases include aerospace simulation, structural engineering, or vehicle simulation. With the controllers, sensors, and actuators, the physical part and the simulated part can interact with each other. HIL is also used in real-time hybrid simulation. Ferry et al. [14] show that in structural simulation under shaking conditions, one may study the physical behavior of a multi-story structure by building only partial physical parts and simulating the rest.
In general, the HIL approach enables rapid system prototyping with various parameter settings before such changes are made to the actual system. By simulating scenarios with renewable energy, HIL can assess the feasibility and effectiveness of different control strategies in maintaining grid stability and reliability. For example, when conducting HIL experiments for microgrid research, one may substitute some software simulations with hardware components, including solar panels, energy storage systems, and power converters.
Molitor et al. [15] studied EMS using the HIL approach and proposed a multiphysics testbed built with thermal, hydraulic, and electrical interfaces according to the requirements of a house. These interfaces enable the testing of various components of home energy management systems (HEMS). The design also permits interconnection to a more complex home energy system, such as a PV system and heat pump. In general, the HIL interface should be capable of generating the required voltage to the device under test with the required bandwidth fidelity [31].
An important application in the utility grid is demand response, which allows an electric utility to balance the power demand and supply. Thornton et al. [16] took the HIL approach and studied how a power system with IoT application may meet the demand response and frequency response requirements, and a case study was presented to show how the service responds to a sudden loss of PV power generation.
Finally, Uninterruptible Power Supply (UPS) is a class of power systems that converts and stores electricity in batteries while offering connected devices a consistent AC power supply. The UPS switches to battery power in the face of a power outage and protects the connected devices from energy disruption. UPS is essential in situations such as workplaces, data centers, healthcare facilities, and industrial buildings. In this paper, the IoT devices take DC power, and, therefore, UPS is not applicable in this situation.
Ibarra et al. [10] surveyed real-time simulators for smart grid research. Speedgoat GmbH (Liebefeld, Switzerland) has developed test systems for HIL simulation (https://www.speedgoat.com/products-services/real-time-target-machines (accessed on 19 March 2024)). The MathWorks, Inc. (Natick, MA, USA) provides software tools and online courses for microgrid development (https://www.mathworks.com/videos/series/microgrid-system-development-and-analysis.html (accessed on 19 March 2024)). ThingSpeak (https://thingspeak.com/ (accessed on 19 March 2024)) is one of the IoT analytics platform services.
2. Materials and Methods
This section first describes a system model for the IoT microgrid, followed by a proposal of a testbed for the IoT microgrid study. Two types of renewable energy sources are given as examples to demonstrate the configuration flexibility of the testbed.
2.1. System Model for IoT Microgrid
The system model is based on the following assumptions:
- Each IoT device operates on DC power and demands relatively less energy.
- Power from the utility grid is available.
- An IoT application may be powered by a variety of renewable energy sources (e.g., a PV array and a piezoelectric energy harvester).
- Each IoT device works on low duty cycle but needs to function continuously.
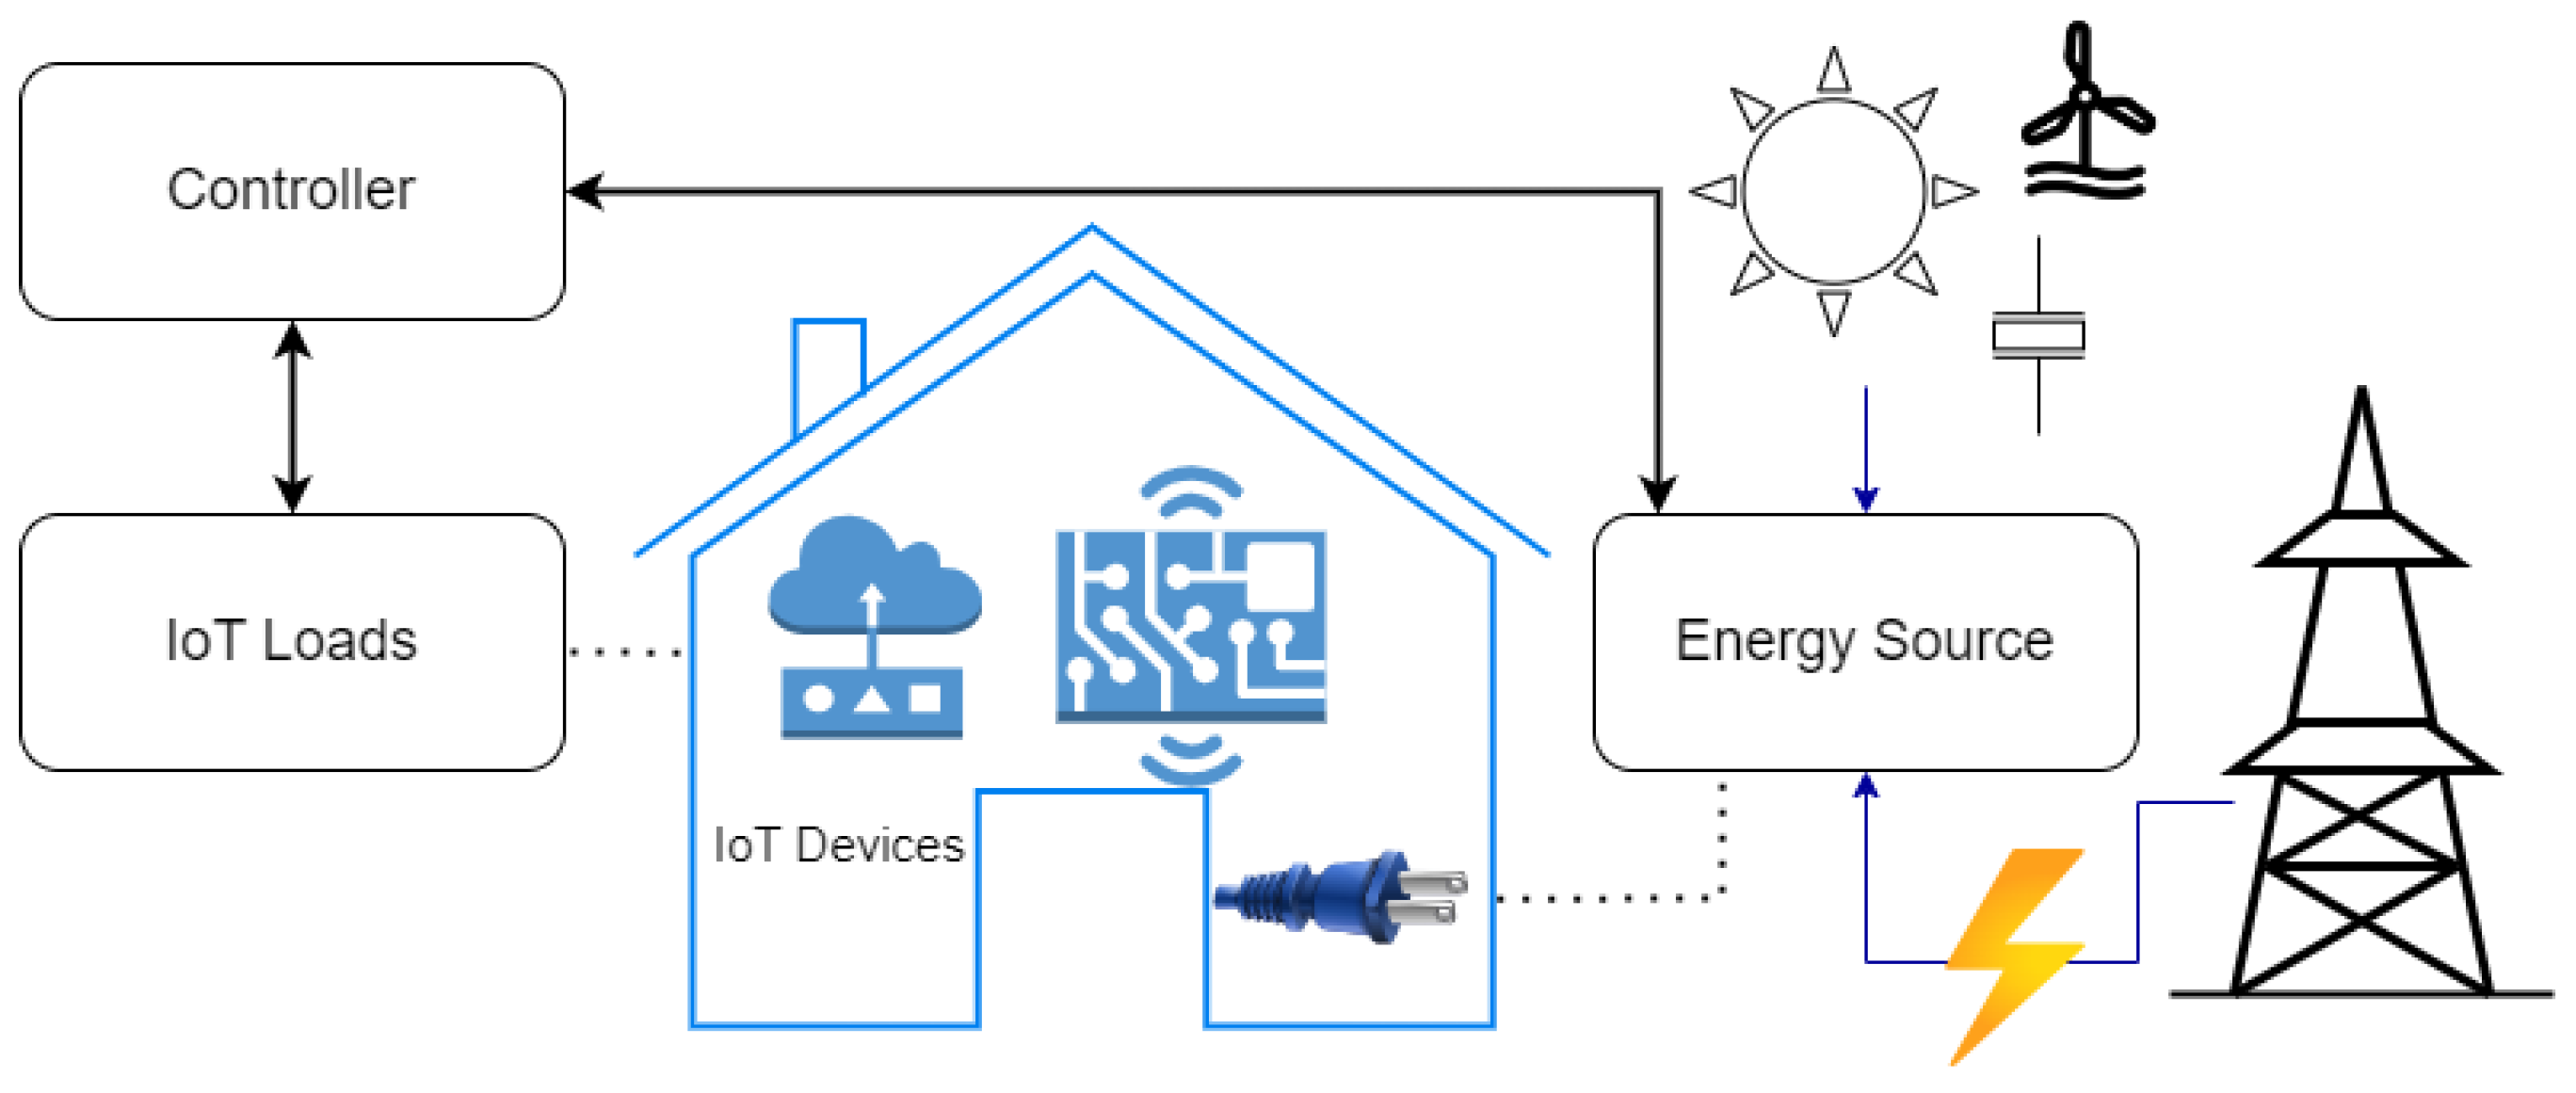
The model of the IoT microgrid includes three components: an energy source and storage, IoT loads, and a controller (Figure 1). The controller tracks both the power demand and supply and switches energy sources for each IoT load. To mitigate the intermittency of renewable energy sources, the IoT microgrid interconnects to some non-renewable energy sources or utility grids. The controller switches the energy sources whenever needed. Overall, renewable energy sources and their storage serve as the main energy sources, and non-renewable energy sources and the utility grid serve as the backup energy sources. Embedded IoT devices are supplied by DC power, and therefore both an AC-DC converter and a DC-DC converter (buck and/or boost) are required in the IoT microgrid. Finally, due to the number and the heterogeneity of the devices in the IoT microgrid, it is desirable for the controller to operate via some local wireless network (e.g., Wi-Fi). Each microgrid component should be able to communicate with the controller via the network.
2.2. Testbed Architecture Proposal for IoT Microgrid
This subsection describes a proposal for a testbed for IoT microgrid design and validation. The architecture proposal is shown in Figure 2 and includes four types of components: primary energy sources, secondary energy sources, a controller, and loads. Each primary energy source component is expected to use renewable energy generation such as a PV array, a wind turbine, or a piezoelectric energy harvester. The energy converter is used for converting AC or DC generation into DC output, and the power manager is used for MPPT (maximum power point tracking) and regulation [32]. A capacitor is attached in parallel for energy storage. An elementary circuit is implemented for the controller to monitor the supplied power.
In the secondary energy source component, a power adapter plug is used for delivering DC power appropriate to IoT devices. A smart plug (denoted by SP in the figure) is attached in series between the power adapter plug and the outlet of the utility grid. The smart plug receives wireless commands from the controller and switches on/off the power.
In the controller component, the control component monitors the voltage output of the primary energy source and switches the smart plug accordingly; the networking component therein helps deliver control commands to the smart plug. If the power supply is insufficient for an IoT device, the controller will switch the power supply to the secondary energy source. Finally, the load component includes an IoT device and a circuit that can switch between the primary and secondary energy sources.
It is expected that the HIL approach can be applied to such a testbed. Specifically, each component, including the primary energy source, load, secondary energy source, and controller, can be replaced by a corresponding real-time simulation using a target machine. The target machine runs a real-time simulation of the physical component, and the machine can interface with the real physical component. This way, on the testbed, one may perform quick component prototyping; for example, by changing the parameters of the model that simulates a PV array, one may study the effect of different PV arrays without purchasing the real ones. Furthermore, one may use the testbed and the HIL approach to study how the system will respond to some changing environmental conditions. For example, the target machine and some auxiliary circuits together may be used for simulating an intermittent power supply from a renewable energy source.
In summary, using the HIL approach, the proposed testbed may offer two benefits: (1) Quick component prototyping by substituting a real component with a simulated one; (2) Quick system validation by simulating application scenarios. The following two subsections illustrate each benefit by example.
2.2.1. Example 1: Prototyping Renewable Energy Sources
The following first presents an example that shows the level of fidelity in simulating a renewable energy source, followed by another example that shows the degree of flexibility in simulating different renewable energy sources.
The first example compares the capacitor charging curves of a parallel RC circuit. The physical charging circuit includes a small PV array YML-118X70MM and a 1 KΩ resistor connected in parallel, and it charges a 4700 μF capacitor. The simulation charging circuit includes the same PV system parameters, and the environment parameter setting includes 24 degrees Celsius with an irradiation of 10 W/m2, simulating the indoor environment. The result is shown in Figure 3. The left sub-figure shows the measurement made from the physical circuit, and the right sub-figure shows the simulation result. The results show that the charging behavior in the simulation aligns with that in the real circuit, with an average charging rate of 0.027 V/s for the voltage to ramp up from 0 V to around 1.5 V steady state.
In the second example, we substituted the real PV system with a Simulink model for a piezoelectric energy harvester, a common device in low-power applications (https://www.mathworks.com/help/sps/ug/piezo-bender-energy-harvester.html (accessed on 19 March 2024)). The model consists of a piezo bender, a full-wave rectifier, and a DC-DC buck converter. In the modeled system, AC power is generated from the piezo bender (by bending) and then converted to DC power through the rectifier. The buck converter then regulates the output of the rectifier to transfer the maximum power to the load. In the simulation, a 100 Hz, 0.5 m/s amplitude sine wave generator was attached to one end of the piezo bender, and a 1-gram mass was attached to the other end. The simulation result shows an average charging rate of 0.01 V/s for the voltage to ramp up from 0 V to around 0.5 V steady state.
2.2.2. Example 2: Simulating Intermittent Power Supply
The following describes a method to simulate intermittent power supply (Typically, the output port of a target machine has a current limitation, and, therefore, one cannot directly use the target machine as a power source. In addition to the method presented in this paper, one may use power amplifiers to achieve the same purpose). The example scenario here is a PV system under changing lighting conditions. Our lab experiments showed that the PV system we used would produce 5 V in cover-free conditions and around 1 V in partially covered conditions. These are the parameters used in the following simulation.
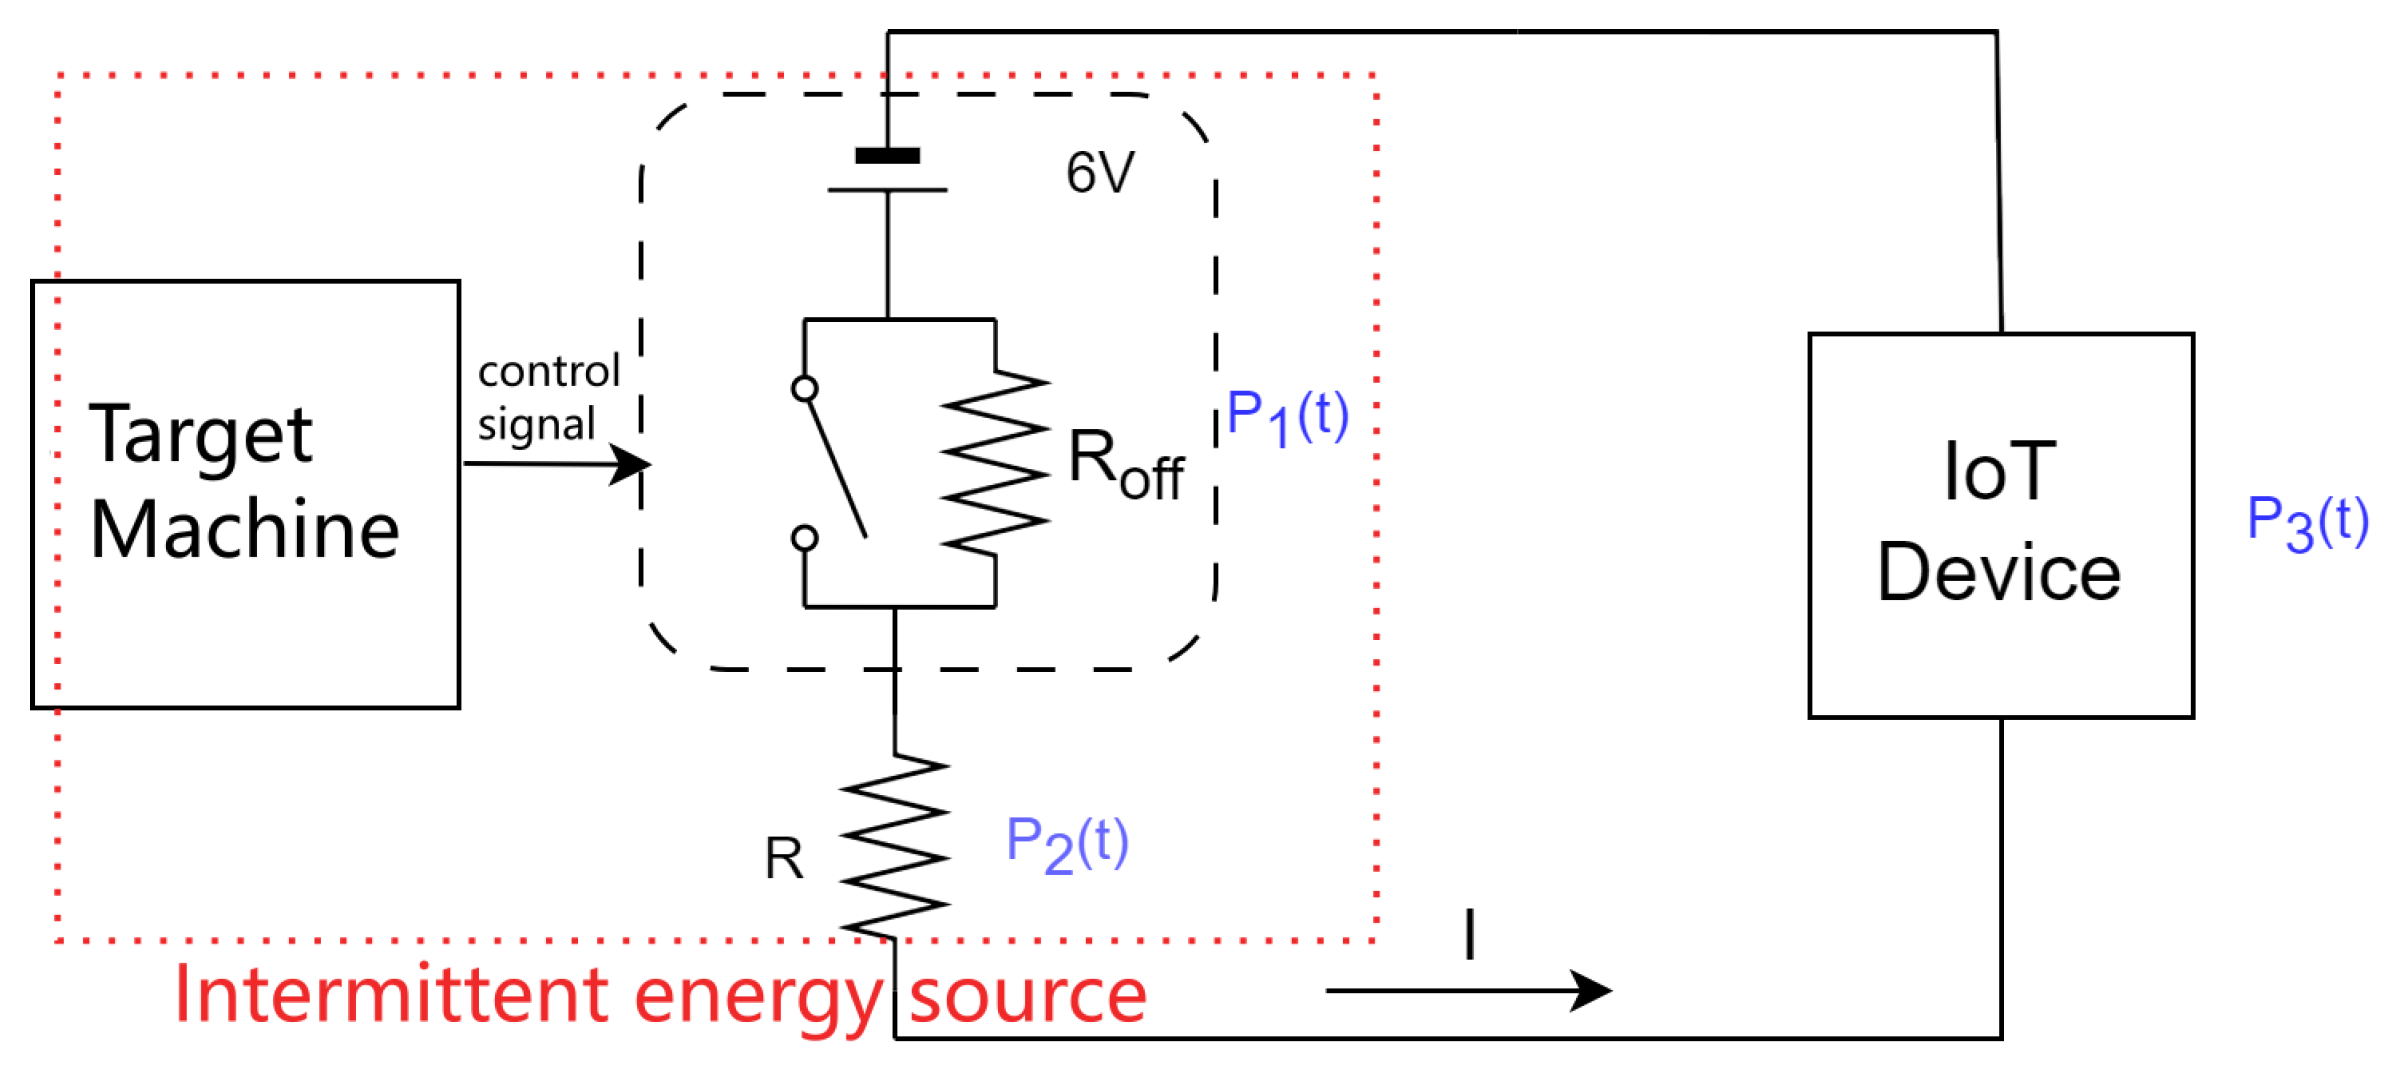
The idea is to apply the Poisson process to model the changing lighting conditions. The design objective is to make the output alternate between 5 V and 1 V with a rate , the Poisson parameter. Figure 4 shows an example configuration for such a purpose. The circuit consists of a switch, two resistors, a 6 V battery, and an IoT device as a load. and . The switch is turned on and off according to the Poisson distribution output from the target machine, where the ON state simulates the cover-free condition of the PV array and the OFF state simulates the partially covered condition. The IoT device consists of a micro-controller and a sensor. The sensor data are uploaded to the IoT cloud platform ThingSpeak. The elements in the circuit and their functions are listed in Table 1.
As labeled in Figure 4, according to the law of energy conservation, the power obtained by the IoT device can be determined by the following formula:
where I is the total current. When the switch is in the ON state, the equivalent resistance , excluding the IoT load, can be calculated using the following formula:
where is the drain-to-source on-state resistance.
The measurement results for the IoT device operation are demonstrated in Table 2. According to the measurements and calculations, the average power of the IoT device, in this case throughout a 300 s cycle, is 295.49 mW, and its equivalent resistance is 91.16 .
2.3. Challenges Regarding Switching between Energy Sources
In the proposed IoT microgrid, the system may switch between primary energy sources and secondary energy sources. It is important both to: (1) avoid power failure during a switch and (2) avoid frequent switches between the two sources, a problem known as the ping-pong effect. A solution to the first challenge is to add a capacitor in parallel with the load. The capacitor serves as a voltage buffer, and if there is a voltage drop during the switch, the capacitor will discharge, and its stored energy will be delivered to the load.
A solution to the second challenge is to set a distinct voltage threshold for each switching direction (Figure 5). The higher of the two thresholds marks the level of voltage above which the IoT device would enjoy sufficient power. If the device voltage rises above this threshold, the controller will use the renewable energy source to power the load. For example, if the load is an IoT micro-controller operating at 5 V, one may set the higher voltage threshold to 5.1 V. In this case, the controller will switch off the smart plug (Figure 2).
In contrast, the lower of the two thresholds marks the level of voltage below which the IoT device may suffer from insufficient power. If the device voltage falls below this threshold, the controller will use the secondary energy source to ensure a continuous power supply to the device. For a 5 V IoT device, for example, one may set the lower voltage threshold to 4.7 V. In this case, the controller will switch on the smart plug, requesting that the utility grid provide the necessary power to the IoT devices.
The specific values for these thresholds were determined based on the characteristics of the renewable energy sources, the operating voltage of the IoT device, and the desired level of reliability in the system. The controller makes informed decisions to optimize the use of renewable energy while ensuring a dependable and uninterrupted power supply to the IoT devices.
3. Results
This section first presents an implementation of the proposed testbed, followed by an IoT microgrid case study using the testbed implemented. The case study investigates the feasibility of powering an IoT monitoring application by alternating between an intermittent renewable energy supply and the utility grid.
3.1. Testbed Implementation
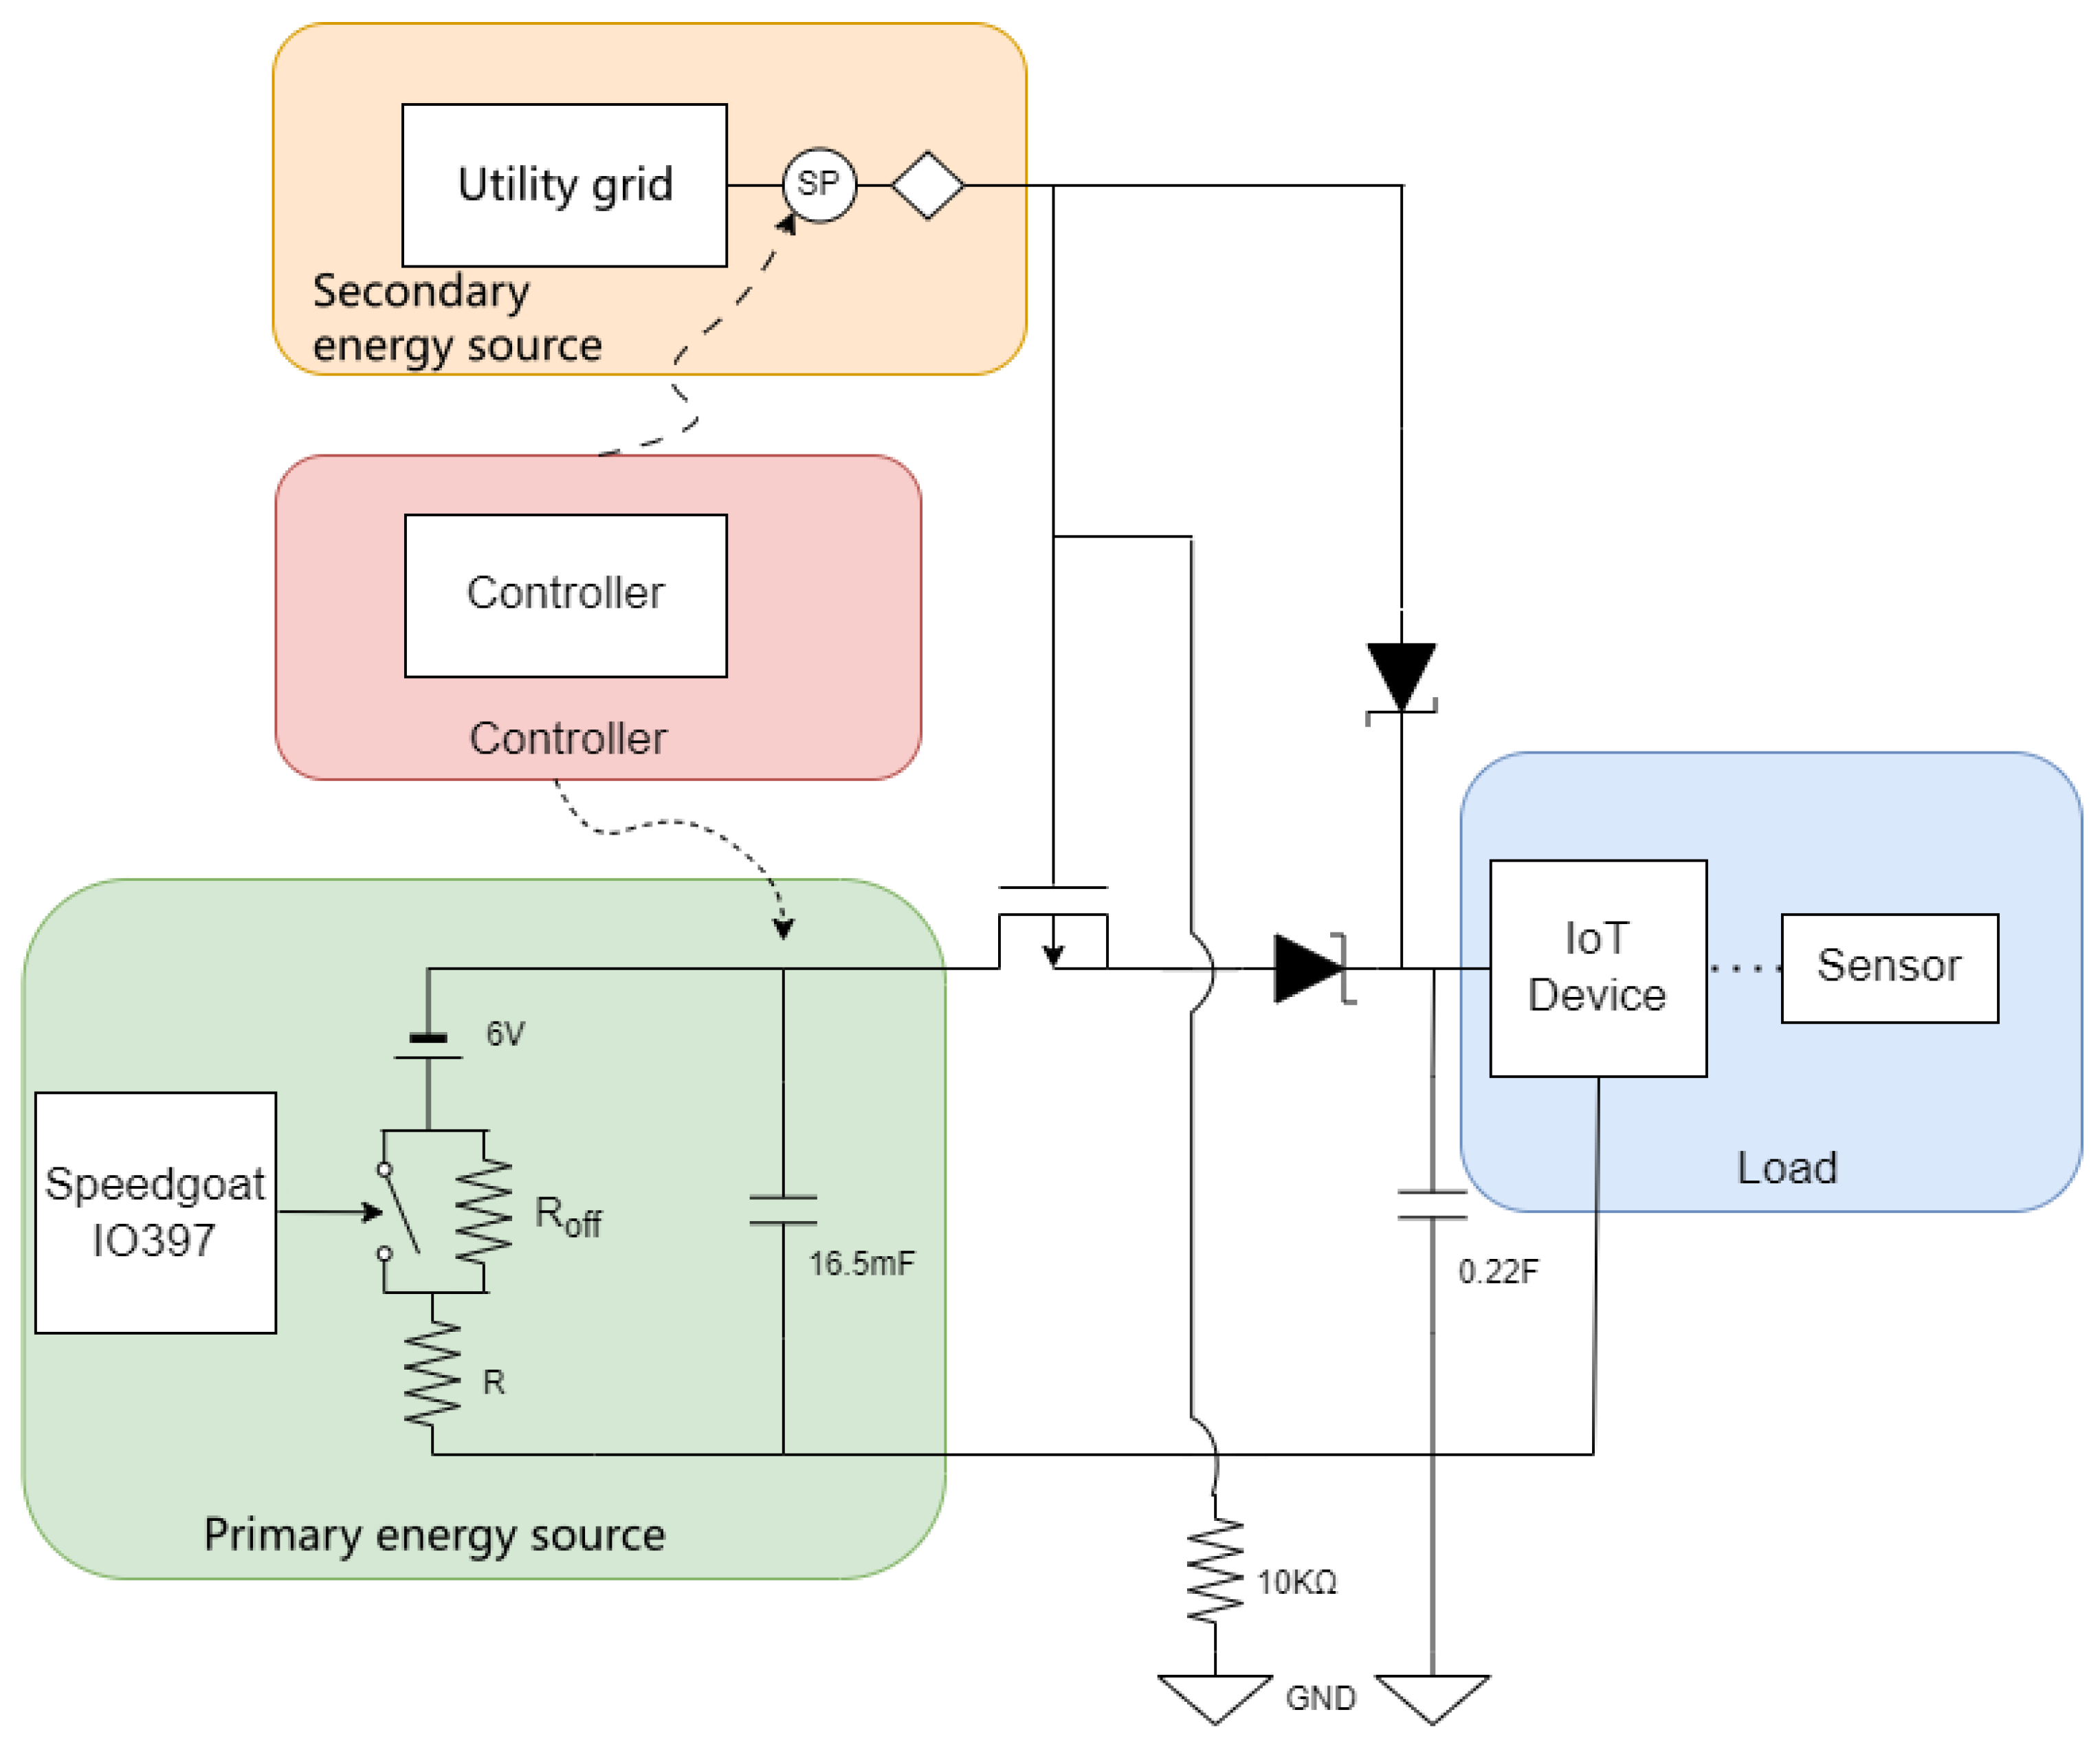
The testbed includes a Speedgoat baseline real-time target machine and its module IO397 for HIL simulation. Figure 6 illustrates our implementation of the four physical components and their circuit interconnect. The primary energy source here follows the implementation presented in Section 2.2.2. The energy storage device is a 16.5 mF capacitor. The minimum needed capacitance is determined based on the mathematical model described by Moser et al. [33]. In the secondary energy source, the smart plug is a Sonoff Mini R2 smart switch (https://sonoff.tech/product/diy-smart-switches/minir2/ (accessed on 19 March 2024)). The smart plug connects to a local Wi-Fi network and establishes an HTTP server. Client applications query data and send control commands to the server via a RESTful API. The elements in the testbed are listed in Table 3.
The load of this IoT microgrid is a DHT11 sensor and a NodeMCU-32S board. Its function is to periodically upload environmental data to the cloud server ThingSpeak. To mitigate temporary power instability during switching, a 0.22 F capacitor is connected in parallel with the load.
The controller is another NodeMCU-32S board, and it sends the control command to the smart plug server in the same Wi-Fi network. The controller measures the voltage of the 16.5 mF capacitor and compares it to the voltage thresholds associated with the IoT device. Once the voltage reaches the higher threshold, the IoT device will be powered by the primary energy source; the device will keep using the primary energy source until the voltage falls below the lower threshold. The controller controls the smart plug accordingly, so that, each time, there will be only one energy source supplying the load.
As the controller delivers the command via a Wi-Fi network, there could be a delay in switching on/off the secondary energy source. The interconnect circuit as shown in Figure 6 helps prevent power failure at the load (via the 0.22 F capacitor). The interconnect also helps prevent conflicts between the two energy sources, by using an IRF4905 p-channel power MOSFET as a switch and two SB560 Schottky diodes to limit reverse current flow. The SB560 diodes are known for their low forward voltage drop and fast switching speed. By incorporating these elements into the circuit, the switching process between the two energy sources can be controlled effectively, and the safety of the circuit can be maintained.
3.2. Case Study on IoT Microgrid Application
The case study is an IoT sensing application using the microgrid, and the testbed is used for studying its resilience to intermittent renewable power supply. The application requirement is to have a continuous sensing data upload to the ThingSpeak cloud platform, and the service requirement is to have the application powered by renewable energy when possible. NodeMCU-32S is used for collecting temperature and humidity data from the sensor and uploading it to the ThingSpeak cloud platform. After each data upload, the device would wait for 20 s before the next uploading activity. Taking into account the response time of the sensing activity and the uploading activity, about every 22 s, the IoT device would deliver one sensor data item to the server.
In addition to temperature and humidity data, each upload also includes the timestamp of the IoT device at that particular moment. The timestamp information indicates whether the IoT device operates without experiencing power outages: should a power outage occur, the timestamp after the system reboot would restart from zero. As shown in Figure 7, in the case of an uninterrupted power supply, the ThingSpeak platform will receive an increasing timestamp value. The controller keeps sampling the voltage value of the capacitor parallel to the load. The sampling period is about 1.126 milliseconds. The higher voltage threshold is 5.1 V, and the lower voltage threshold is 4.7 V (Section 2.3).
In each application cycle, the IoT device performs data sensing and wireless transmission activities, and each activity consumes a different level of power. Figure 8 shows the power consumption of the IoT device at an interval of 300 s. It is observed that wireless transmission is the most power-consuming activity.
In this case study, two intermittent power conditions are simulated for a qualitative comparison. Following the setting described in Section 2.2.2, the Poisson parameter denotes the rate of the PV system under partially covered conditions. The larger the value, the higher the rate. The case study includes two sub-cases: in the first sub-case, is set to 14; in the second sub-case, is set to 37.
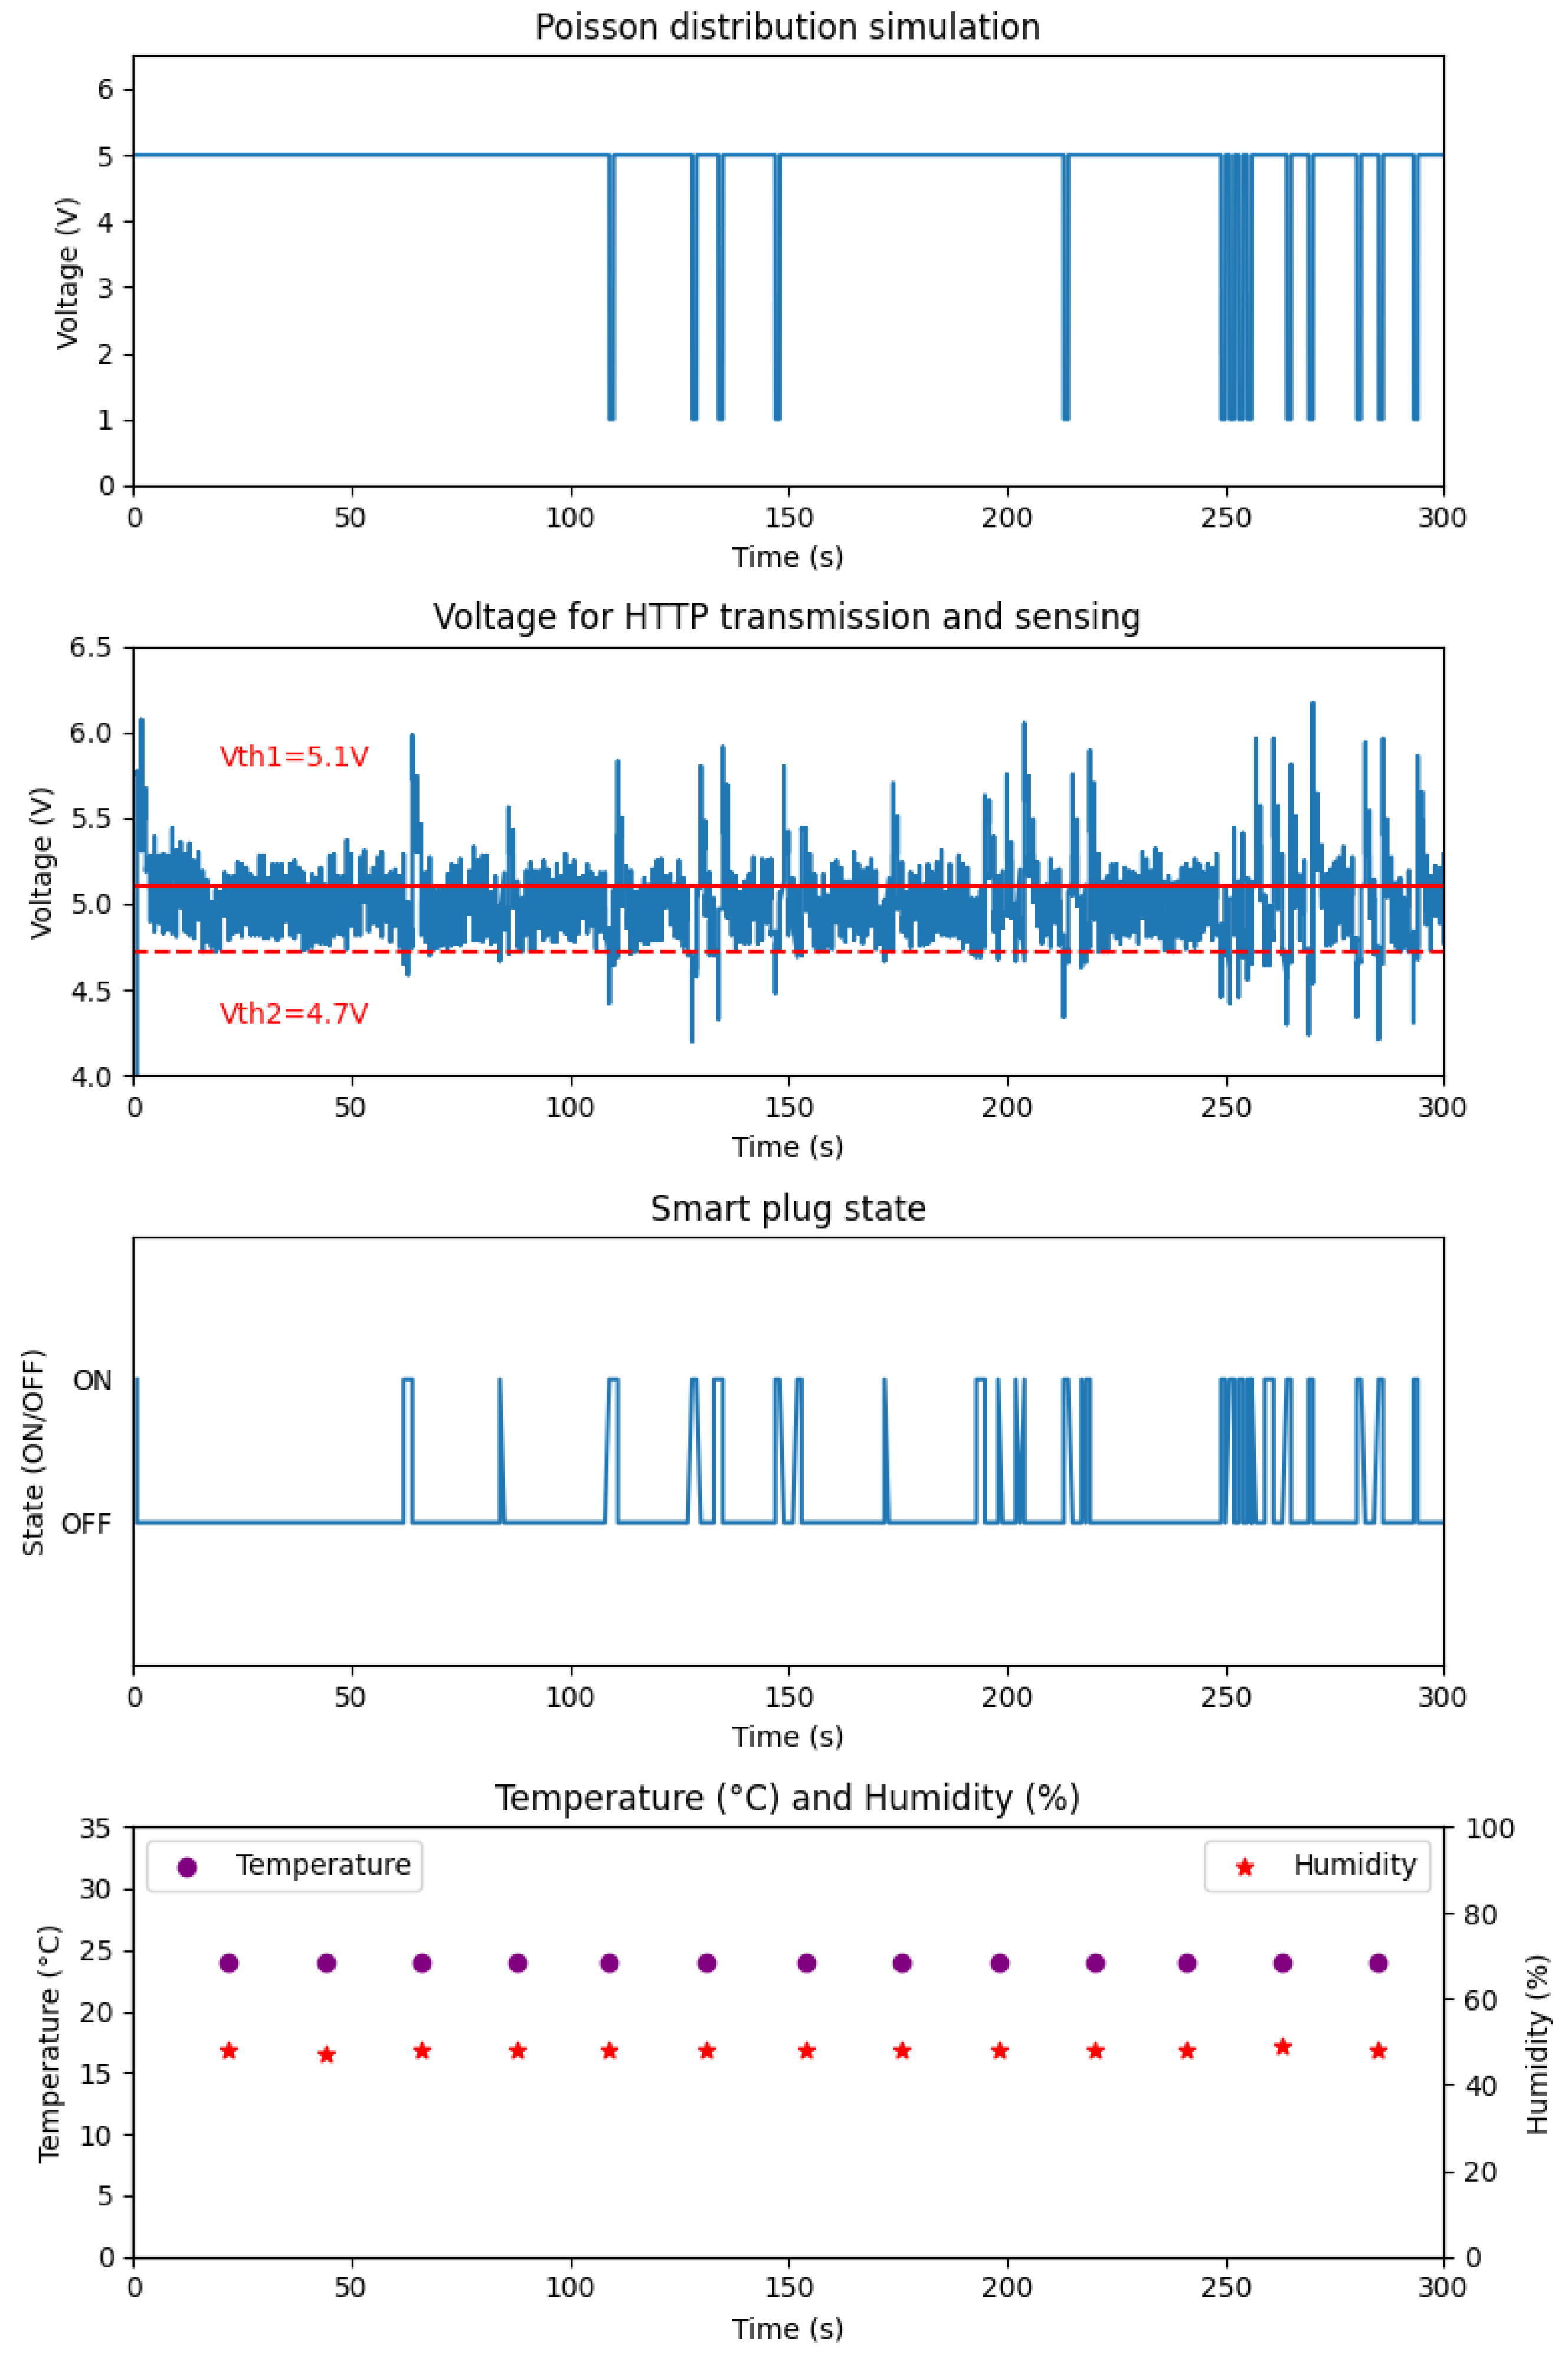
Figure 9 shows the experiment results for the first sub-case. From the top, the first sub-figure shows the time series of the changing lighting conditions, with . The second sub-figure shows the time series of the voltage level of the IoT device. The third sub-figure shows the status of the smart plug over time. The last sub-figure shows the data received at the ThingSpeak cloud platform.
The results show that despite the occasional power failure of the primary energy source, the microgrid was still able to meet the application’s requirement of continuous data sensing and upload. The first and the third sub-figures show that each failure of the primary energy source was followed by a switching on of the secondary energy source. Furthermore, the short duration of each ON state of the smart plug indicates that the microgrid was engaged in switching back to the primary energy source when possible. This demonstrates that this microgrid can meet the design objective and that the device it supports shall use a renewable energy source when possible while remaining functioning.
Figure 9 also indicates that sometimes the smart plug switched on when there was no decrease in the primary power supply. For example, between the 50th and the 100th seconds, there were two occasions when the smart plug was switched on. This was because, at those moments, the IoT device was performing activities that demanded more power (likely, wireless transmissions).
The results show the effectiveness of applying two voltage thresholds (Vth1 and Vth2 in Figure 9 and Figure 10). As can be seen in the second and the third sub-figures, between the 5th and the 50th seconds, the device voltage level kept fluctuating, but it never triggered any status change in the smart plug. The design succeeded in maintaining microgrid stability, and the microgrid stayed using its primary energy source.
Finally, Figure 10 shows the experiment result for the second sub-case, where . By comparing the result with the sub-case, it can be seen that there were many more power failures of the primary energy source. Nevertheless, the microgrid was still able to sustain a continuous IoT data sensing and upload.
In both sub-cases, the experiment results show the dynamic switching behaviors between the primary energy source and the secondary energy source. It is validated that this microgrid can provide an efficient and uninterrupted power supply to the IoT device, optimizing the use of renewable energy while ensuring reliable operation.
4. Discussion
In the proposed IoT microgrid, the use of a COTS smart plug and power adapter plug offers a simple and scalable solution to integrate the utility grid into the microgrid. The two plugs connected in series become an integration point representing the secondary energy source. In this way, while the work presented in this paper considers only one IoT device, it is expected that the design can be extended to power a multiple-device system. In the system, each IoT device may be paired to an integration point of the secondary energy source, and each integration point can be controlled via a wireless network.
In addition to the implementation described in Section 2.2.2, the primary energy source components of the testbed can use real DERs. It is foreseeable that the voltage data of the primary energy source could be delivered to the controller via a wireless network as well. This could relieve the wiring overhead for the controller, and, at the same time, this could pave the way to a microgrid of multiple renewable energy sources, each one associating with a subset of IoT devices and being deployed in closer proximity to the devices. However, then the wireless transmission latency and jitters could be an issue, in particular when the controller needs to make real-time decisions in energy source pairing and switching.
In addition to its application to the primary energy source, the HIL approach may be applied to simulate the secondary energy source, the controller, or the IoT load. To simulate the IoT load, the idea is to first measure the power consumption profile of the IoT device performing each activity. Then, a real-time target machine could simulate different interleaving of activities.
The testbed experiment results show that the frequency of switching between energy sources depends not only on the rate of power failures but also on the changing power consumption of the IoT device. In the future, the capacity of energy storage elements should be taken into consideration, too. For example, a small capacitor might not be able to accumulate enough energy to keep the voltage level well above the lower threshold, and the next IoT device activity could trigger an energy source switch even if the activity is not that power-demanding.
5. Conclusions
This paper presents some initial findings in building a testbed for IoT microgrid research. The study focuses on DC-powered IoT devices and lists the characteristics of such an IoT microgrid. The HIL-enabled testbed prototype illustrates a simple yet effective way to interconnect the primary energy source, secondary energy source, and load. The switch control is performed via a local wireless network and is scalable. The use of double voltage thresholds in switch decision making helps the system continue using the renewable energy source whenever possible. Experiments on the intermittent power supply demonstrated the feasibility of the proposed design and implementation. The work presented here used a real-time target machine to simulate intermittent power supply, but the full potential of how this may help IoT microgrid prototyping has yet to be explored.
Author Contributions
Conceptualization, Y.-S.L. and C.W.; Data curation, Y.-S.L.; Formal analysis, Y.-S.L. and C.W.; Funding acquisition, C.W.; Investigation, Y.-S.L. and C.W.; Methodology, C.W.; Project administration, C.W.; Resources, C.W.; Software, Y.-S.L.; Supervision, C.W.; Validation, Y.-S.L. and C.W.; Visualization, Y.-S.L.; Writing—original draft, Y.-S.L.; Writing—review and editing, C.W. All authors have read and agreed to the published version of the manuscript.
Funding
This research work was funded by the MOST grant 109-222-E-003-001-MY3.
Data Availability Statement
The data presented in this study are available on request from the corresponding author. Restrictions apply to the availability of the real-time target machine hardware configuration files, as they are parts of the product with the purchase of the real-time target machine from Speedgoat GmbH (https://www.speedgoat.com/ (accessed on 19 March 2024)).
Conflicts of Interest
The authors declare no conflicts of interest. The funders had no role in the design of this study; in the collection, analyses, or interpretation of data; in the writing of the manuscript; or in the decision to publish the results.
Abbreviations
The following abbreviations are used in this manuscript:
| CPS | Cyber-Physical Systems; |
| IoT | Internet of Things; |
| HIL | Hardware-in-the-Loop; |
| DER | Distributed Energy Resources; |
| PV | Photovoltaic; |
| MPPT | Maximum Power Point Tracking; |
| SP | Smart Plug; |
| COTS | Commercial-Off-The-Shelf. |
References
- Shi, J.; Wan, J.; Yan, H.; Suo, H. A survey of Cyber-Physical Systems. In Proceedings of the 2011 International Conference on Wireless Communications and Signal Processing (WCSP), Nanjing, China, 9–11 November 2011; pp. 1–6. [Google Scholar] [CrossRef]
- Lee, E.A. Cyber Physical Systems: Design Challenges. In Proceedings of the 2008 11th IEEE International Symposium on Object and Component-Oriented Real-Time Distributed Computing (ISORC), Orlando, FL, USA, 5–7 May 2008; pp. 363–369. [Google Scholar] [CrossRef]
- Xu, H.; Yu, W.; Griffith, D.; Golmie, N. A Survey on Industrial Internet of Things: A Cyber-Physical Systems Perspective. IEEE Access 2018, 6, 78238–78259. [Google Scholar] [CrossRef]
- Industry IoT Consortium. Industrial Internet Reference Architecture (v1.10); Industry IoT Consortium: Boston, MA, USA, 2022. [Google Scholar]
- Chen, H. Applications of Cyber-Physical System: A Literature Review. J. Ind. Integr. Manag. 2017, 2, 1750012. [Google Scholar] [CrossRef]
- Jadidi, N.; Varmazyar, M. A Survey of Cyber-physical Systems Applications (2017–2022). In Handbook of Smart Energy Systems; Fathi, M., Zio, E., Pardalos, P.M., Eds.; Springer International Publishing: Cham, Switzerland, 2023; pp. 2089–2117. [Google Scholar] [CrossRef]
- Shih, C.S.; Chou, J.J.; Reijers, N.; Kuo, T.W. Designing CPS/IoT applications for smart buildings and cities. IET Cyber-Phys. Syst. Theory Appl. 2016, 1, 3–12. [Google Scholar] [CrossRef]
- Hammi, B.; Khatoun, R.; Zeadally, S.; Fayad, A.; Khoukhi, L. IoT technologiesfor smart cities. IET Netw. 2018, 7, 1–13. [Google Scholar] [CrossRef]
- Sarhadi, P.; Yousefpour, S. State of the art: Hardware in the loop modeling and simulation with its applications in design, development and implementation of system and control software. Int. J. Dyn. Control 2015, 3, 470–479. [Google Scholar] [CrossRef]
- Ibarra, L.; Rosales, A.; Ponce, P.; Molina, A.; Ayyanar, R. Overview of Real-Time Simulation as a Supporting Effort to Smart-Grid Attainment. Energies 2017, 10, 817. [Google Scholar] [CrossRef]
- Herrera, L.; Li, C.; Yao, X.; Wang, J. FPGA-Based Detailed Real-Time Simulation of Power Converters and Electric Machines for EV HIL Applications. IEEE Trans. Ind. Appl. 2015, 51, 1702–1712. [Google Scholar] [CrossRef]
- Fathy, H.K.; Filipi, Z.S.; Hagena, J.; Stein, J.L. Review of hardware-in-the-loop simulation and its prospects in the automotive area. In Modeling and Simulation for Military Applications; Schum, K., Sisti, A.F., Eds.; International Society for Optics and Photonics, SPIE: Bellingham, WA, USA, 2006; Volume 6228, p. 62280E. [Google Scholar] [CrossRef]
- Liang, T.; Liu, Q.; Dinavahi, V.R. Real-Time Hardware-in-the-Loop Emulation of High-Speed Rail Power System with SiC-Based Energy Conversion. IEEE Access 2020, 8, 122348–122359. [Google Scholar] [CrossRef]
- Ferry, D.; Bunting, G.; Maghareh, A.; Prakash, A.; Dyke, S.; Agrawal, K.; Gill, C.; Lu, C. Real-time system support for hybrid structural simulation. In Proceedings of the 14th International Conference on Embedded Software, New Delhi, India, 12–17 October 2014; pp. 1–40. [Google Scholar]
- Molitor, C.; Benigni, A.; Helmedag, A.; Chen, K.; Cali, D.; Jahangiri, P.; Muller, D.; Monti, A. Multiphysics test bed for renewable energy systems in smart homes. IEEE Trans. Ind. Electron. 2012, 60, 1235–1248. [Google Scholar] [CrossRef]
- Thornton, M.; Motalleb, M.; Smidt, H.; Branigan, J.; Siano, P.; Ghorbani, R. Internet-of-things hardware-in-the-loop simulation architecture for providing frequency regulation with demand response. IEEE Trans. Ind. Inform. 2017, 14, 5020–5028. [Google Scholar] [CrossRef]
- Chen, Z.; Amani, A.M.; Yu, X.; Jalili, M. Control and Optimisation of Power Grids Using Smart Meter Data: A Review. Sensors 2023, 23, 2118. [Google Scholar] [CrossRef]
- Depuru, S.S.S.R.; Wang, L.; Devabhaktuni, V.; Gudi, N. Smart meters for power grid—Challenges, issues, advantages and status. In Proceedings of the 2011 IEEE/PES Power Systems Conference and Exposition, Phoenix, AZ, USA, 20–23 March 2011; pp. 1–7. [Google Scholar] [CrossRef]
- Rathor, S.K.; Saxena, D. Energy management system for smart grid: An overview and key issues. Int. J. Energy Res. 2020, 44, 4067–4109. [Google Scholar] [CrossRef]
- Ku, T.Y.; Park, W.K.; Choi, H. IoT energy management platform for microgrid. In Proceedings of the 2017 IEEE 7th International Conference on Power and Energy Systems (ICPES), Toronto, ON, Canada, 1–3 November 2017; pp. 106–110. [Google Scholar]
- Burmester, D.; Rayudu, R.; Seah, W.; Akinyele, D. A review of nanogrid topologies and technologies. Renew. Sustain. Energy Rev. 2017, 67, 760–775. [Google Scholar] [CrossRef]
- Lasseter, R.; Paigi, P. Microgrid: A conceptual solution. In Proceedings of the 2004 IEEE 35th Annual Power Electronics Specialists Conference (IEEE Cat. No.04CH37551), Aachen, Germany, 20–25 June 2004; Volume 6, pp. 4285–4290. [Google Scholar] [CrossRef]
- Ghosh, A.; Zare, F. Control of Power Electronic Converters with Microgrid Applications; John Wiley & Sons: Hoboken, NJ, USA, 2023. [Google Scholar]
- Sezer, N.; Koç, M. A comprehensive review on the state-of-the-art of piezoelectric energy harvesting. Nano Energy 2021, 80, 105567. [Google Scholar] [CrossRef]
- Li, F.; Yang, Y.; Chi, Z.; Zhao, L.; Yang, Y.; Luo, J. Trinity: Enabling Self-Sustaining WSNs Indoors with Energy-Free Sensing and Networking. ACM Trans. Embed. Comput. Syst. 2018, 17, 57. [Google Scholar] [CrossRef]
- Visconti, P.; Bagordo, L.; Velázquez, R.; Cafagna, D.; De Fazio, R. Available Technologies and Commercial Devices to Harvest Energy by Human Trampling in Smart Flooring Systems: A Review. Energies 2022, 15, 432. [Google Scholar] [CrossRef]
- Masters, G.M. Renewable and Efficient Electric Power Systems; John Wiley & Sons: Hoboken, NJ, USA, 2013. [Google Scholar]
- Kanchev, H.; Lu, D.; Colas, F.; Lazarov, V.; Francois, B. Energy management and operational planning of a microgrid with a PV-based active generator for smart grid applications. IEEE Trans. Ind. Electron. 2011, 58, 4583–4592. [Google Scholar] [CrossRef]
- Brayanov, N.; Stoynova, A. Review of hardware-in-the-loop-a hundred years progress in the pseudo-real testing. Electrotech. Electron. (E+E) 2019, 54, 70–84. [Google Scholar]
- Wältermann, P. Hardware-in-the-loop: The technology for testing electronic controls in automotive engineering. In Proceedings of the 6th Paderborn Workshop Designing Mechatronic Systems, Paderborn, Germany, 2–3 April 2009; pp. 1–20. [Google Scholar]
- Guillaud, X.; Faruque, M.O.; Teninge, A.; Hariri, A.H.; Vanfretti, L.; Paolone, M.; Dinavahi, V.; Mitra, P.; Lauss, G.; Dufour, C.; et al. Applications of real-time simulation technologies in power and energy systems. IEEE Power Energy Technol. Syst. J. 2015, 2, 103–115. [Google Scholar] [CrossRef]
- Newell, D.; Duffy, M. Review of Power Conversion and Energy Management for Low-Power, Low-Voltage Energy Harvesting Powered Wireless Sensors. IEEE Trans. Power Electron. 2019, 34, 9794–9805. [Google Scholar] [CrossRef]
- Riba, J.R.; Moreno-Eguilaz, M.; Bogarra, S. Energy Harvesting Methods for Transmission Lines: A Comprehensive Review. Appl. Sci. 2022, 12, 10699. [Google Scholar] [CrossRef]
Figure 1.
System model of the IoT microgrid.

Figure 2.
Architecture proposal for the IoT microgrid testbed.

Figure 3.
The charging curve of PV system in simulation and measurement.

Figure 4.
The configuration for intermittent power supply simulation.

Figure 5.
The thresholds for controller decisions.

Figure 6.
Implementation of the IoT microgrid testbed.

Figure 7.
The timestamps received at ThingSpeak; the device restarted after sending 30 samples.

Figure 8.
Time series of IoT device power consumption.

Figure 9.
Experiment results for .

Figure 10.
Experiment results for .


Table 1.
Elements in the simulation circuit.
| Component | Specification |
|---|---|
| MCU | ESP32-WROOM-32D |
| Temperature and Humidity Sensor | DHT11 |
| Switch | 2N7000 Power MOSFET |
Table 2.
The measurement for the IoT device.
| Case | Average Value | Unit |
|---|---|---|
| Power | 295.49 | mW |
| Voltage | 4.98781 | V |
| Current | 59.24802 | mA |
Table 3.
Specifications for uur testbed implementation.
| Element | Specification | Description |
|---|---|---|
| MCU | ESP32-WROOM-32D | Processing and communication |
| Sensor | DHT11 | Measure temperature and humidity data |
| Switch | IRF4905 MOSFET | Power MOSFET |
| Smart plug | Sonoff Mini R2 | Receiving control signals |
| Energy storage | Capacitors | 16.5 mF, 0.22 F |
| Diode | SB560 | Prevent reverse current |
Disclaimer/Publisher’s Note: The statements, opinions and data contained in all publications are solely those of the individual author(s) and contributor(s) and not of MDPI and/or the editor(s). MDPI and/or the editor(s) disclaim responsibility for any injury to people or property resulting from any ideas, methods, instructions or products referred to in the content. |
© 2024 by the authors. Licensee MDPI, Basel, Switzerland. This article is an open access article distributed under the terms and conditions of the Creative Commons Attribution (CC BY) license (https://creativecommons.org/licenses/by/4.0/).
Share and Cite
MDPI and ACS Style
Lee, Y.-S.; Wang, C. A Cyber-Physical Testbed for IoT Microgrid Design and Validation. Electronics 2024, 13, 1181. https://doi.org/10.3390/electronics13071181
AMA Style
Lee Y-S, Wang C. A Cyber-Physical Testbed for IoT Microgrid Design and Validation. Electronics. 2024; 13(7):1181. https://doi.org/10.3390/electronics13071181
Chicago/Turabian StyleLee, Yih-Shiuan, and Chao Wang. 2024. "A Cyber-Physical Testbed for IoT Microgrid Design and Validation" Electronics 13, no. 7: 1181. https://doi.org/10.3390/electronics13071181
Note that from the first issue of 2016, this journal uses article numbers instead of page numbers. See further details here.