

Evaluations of Virtual and Augmented Reality Technology-Enhanced Learning for Higher Education
by
 , , and
Jia Yi Wong
1,†,
Abu Bakr Azam
1,†,
Qi Cao
2,
Lihui Huang
1,
Yuan Xie
1,
Ingrid Winkler
1,3 and
and
Yiyu Cai
1,* 1
School of Mechanical and Aerospace Engineering, Nanyang Technological University, Singapore 639798, Singapore
2
School of Computing Science, University of Glasgow, Glasgow G12 8QQ, UK
3
Computing Modeling Department, SENAI CIMATEC University Centre, Salvador 41650-010, Brazil
*
Author to whom correspondence should be addressed.
†
These authors contributed equally to this work.
Electronics 2024, 13(8), 1549; https://doi.org/10.3390/electronics13081549
Submission received: 15 March 2024
/
Revised: 6 April 2024
/
Accepted: 16 April 2024
/
Published: 18 April 2024
(This article belongs to the Special Issue Emerging Immersive Learning Technologies: Augmented and Virtual Reality)
Abstract
:Virtual reality (VR) has good potential to promote technology-enhanced learning. Students can benefit from immersive visualization and intuitive interaction in their learning of abstract concepts, complex structures, and dynamic processes. This paper is interested in evaluating the effects of VR learning games in a Virtual and Augmented Reality Technology-Enhanced Learning (VARTeL) environment within an engineering education setting. A VARTeL flipped classroom is established in the HIVE learning hub at Nanyang Technological University (NTU) Singapore for the immersive and interactive learning. Experiments are designed for the university students conducting the learning, with three interactive and immersive VR games related to science, technology, engineering and mathematics (STEM), i.e., virtual cells, a virtual F1 racing car, and vector geometry. These VR games are a part of the VARTeL apps designed in-house at NTU for STEM education. Quantitative and qualitative analyses are performed. A total of 156 students from Mechanical Engineering participated in the experiment. There are 15 participants selected for an interview after the experiment. Pre-tests and post-tests are performed using two different models, the developed VARTeL and the modified Technology-Rich Outcome-Focused Learning Environment Inventory (TROFLEI), in order to measure the efficiency of the VARTeL environment in Higher Education. Significant improvements of about 24.8% are observed for the post-tests over the pre-tests, which illustrate the effectiveness of the VARTeL for Engineering education. Details of the VR simulation games, methods of data collection, data analyses, as well as the experiment results are discussed. It is observed from the results that all the underlying scales of the modified TROFLEI are above the threshold for the ‘Good’ category, indicating that a very reliable questionnaire is designed in this research. The mean ‘Ideal’ values are about 0.7–2.6% higher than the mean ‘Actual’ values. The limitations of the experiment and future works with recommendations are also presented in this paper.
1. Introduction
Education used to be dominated by traditional teaching tools such as textbooks, notes, blackboards, and two-dimensional images, etc. In recent decades, technology has often been used to improve the learning efficacy of students. Some examples are PowerPoint slides, online lectures, and more recently, virtual and augmented reality (VAR). Research has shown that by introducing digital technology into a learning environment, students’ learning efficacy can be increased, resulting in better academic achievements [1,2]. Various educational technologies or equipment have been adopted in school learning, such as touchscreen displays, interactive whiteboards, tablets, video games, smart phone apps, etc. This translates to an increase in learning performance among the students due to the usage of technology.
Although VAR technology has existed for years, it is only in recent decades that it was commercialized for the public. Not many schools have implemented VAR learning environments as a part of their learning curriculum, but VAR in education is seen as a rising trend [3]. By using a VAR learning environment in a classroom setting, teachers would be able to bring immersive and interactive experiences to students, which revolutionizes the ways to acquire and apply knowledge [4]. For example, it would be extremely difficult to bring an entire class of students to a manufacturing plant to develop technical skills. However, a VARTeL environment would be able to provide a reach-in experience for the learning of cell and molecular biology, Formular One (F1) car design, machining, and vector geometry created in a virtual world.
The use of interactive and immersive VR games in the education process changes the ways of learning compared to traditional methods, where students can learn and practice in bidirectional ways [5]. VR games could offer learning opportunities to students from both the first- and third-person points of view, with better engagement and learning efficacy [6]. It encourages students in self-learning and hands-on practices in the virtual world. The curiosity and reflective thinking of students are positively affected in a VAR learning environment [7]. A VR learning game was designed for primary school students in the study of the science subject on electricity and electric circuits, with the discussions of the learning efficiency through virtual practices [8]. One such study found that by implementing an augmented reality (AR) learning environment into physics learning in high school, the self-efficacy of the students was significantly increased [9]. In the same study, it stated that students were more focused on the activities and had a greater understanding of the contents due to the immersive experience provided by the AR learning environment. Immersion plays a key role in improving the students’ understanding of class contents [10], which is one of the main elements that a VAR learning environment brings to the table. Even though there were studies that showed the impacts of a VAR learning environment, there have been no specific attempts to study how much a VAR learning environment for a university Engineering class in science, technology, engineering and mathematics (STEM) fields would improve the education efficiency of the students.
The purpose of this study is to evaluate if it is beneficial for Engineering students to have a class conducted in a VARTeL environment. Furthermore, academic achievements and learning conceptions are also analyzed to determine whether there is a positive interdependence to the immersion of the VAR learning environment. The effectiveness of the VAR learning environment is then evaluated based on the obtained outcomes. The main objective of this study is to determine whether a VARTeL environment would positively affect students’ learning efficiency in an Engineering class.
The organization of the remaining parts of this paper is as follows. The related work in the literature is introduced in Section 2. The materials and our methodology are presented in Section 3. The experiment results are analyzed and discussed in Section 4. The conclusions and future works are described in Section 5.
2. Related Work
2.1. Virtual and Augmented Reality
VAR, as one of the breakthrough technologies [11], is becoming more prominent in our life. Virtual reality (VR) is frequently described as a technology that allows users to have an immersive and interactive experience in a simulated world. AR, on the other hand, is often expressed as a technology that allows users to interact with virtual objects in the real world and in real time [12]. In recent years, more companies are looking to expand their business into the digital world, with Meta and NVIDIA spearheading the world’s transition into a VAR future [13].
VR has been improved tremendously and is currently used in various sectors, such as entertainment and simulations. In the entertainment industry, VR head-mounted display (HMD) headsets are becoming increasingly popular, with various types of headsets available, such as the Oculus Quest 2, Sony PlayStation VR, etc. These headsets are often labelled as the ‘next generation’ of gaming and allow users to be fully immersed in a virtual world created solely for the game [14]. VR is also widely used in simulation fields, with various industries using the technology for training workers before deployment in the actual field. VR simulation for medical training has been implemented with relative success [15], while various militaries and organizations have successfully implemented VR as a training and simulation tool over the years [16,17]. Due to the success of how VR has been able to allow users to communicate, interact and learn various topics or skills in the virtual world, people have questioned whether the same level of training and simulation can be brought into education to improve the learning efficacy of students in a school or industrial setting [18].
AR has seen a bigger adoption rate in industries compared to VR. AR is increasingly showing up in the retail industry, with retail giants such as IKEA allowing users of the AR mobile app to test placing furniture at their homes before buying the furniture [19]. These 3D models produced by their mobile app are drawn to scale, allowing users to plan appropriately before deciding. The tourism industry has also picked up on using AR technology as a common tool to provide better tourism experiences to visitors [20].
2.2. Education Technology, and Technology-Enhanced Learning
Many technologies have proven to be effective in education over the years. The evolution of education technology makes students more interested in their studies. Studies have shown that by incorporating technology into the classroom, students have more opportunities for interactions and thus to experience collaborative and cooperative learning [21]. In the same study, it stated that technology helped students to become active learners. This is a result of the study materials being readily available for access due to computerization. With the help of online learning technology, students can study at their own pace rather than following a fixed regime.
Due to the rapid growth in the current era of technological advancement, humans in general are adapting more quickly to emerging technologies. It has also become easier to implement new technologies into classes to help students learn better. One example is the application ‘Kahoot’, which gamifies a classroom setting into something likened to a real-time quiz, allowing students to become more engaged and intrigued in their studies. As a result, ‘Kahoot’ has proven to be beneficial to students in terms of learning efficacy, attitudes, anxieties, and classroom atmosphere [22].
Although there are advantages that technologies bring to the table, when it comes to education, there are also a few disadvantages to take note of. One distinct disadvantage is that not every student or institute has sufficient financial capability to bring in the required resources to implement the technology needed to improve education quality. Specific to Engineering education, technology has played a huge role in a variety of ways. Many types of software have changed the way Engineering works, and this has leaked into the education system. The most popular technology is arguably computer-aided design (CAD). One study has shown that CAD is much more effective and efficient when compared to sketching for Engineering designs [23].
2.3. VARTeL Environment
Recently, there has been an increasing number of attempts to introduce the VARTeL environment as an educational tool, likely due to the technological boom and the increasing affordability and accessibility of VR gear or smartphones. Pioneered by Thomas Furness, a flight simulator utilizing VR technology was created in 1966 for training military pilots [24]. Since then, the VR/AR technology and VAR learning environment have been constantly improved. VAR technologies are now growing increasingly suitable to be introduced for mass adoption in the education industry. As one of the main advantages of a VARTeL environment, it is able to provide students with immersion through simulation that is difficult to experience in the traditional classroom setting. The immersion and exploration by a VR lesson provide students with a more active learning experience [7]. The motivation and engagement of students are increased when classes are conducted in a VR environment [25]. Making use of the technology to immerse students in a VARTeL environment enables lessons to be more interactive, situated, and experimental. For Engineering programs, it would prove beneficial in teaching various hands-on experiments and industrial skills that cannot be taught in a conventional classroom setting.
Academically, the VARTeL environment has also shown effectiveness in increasing students’ learning capabilities. Higher conceptual understanding was noted for concepts that were hard to imagine [9] or hard to teach, like anatomy [26]. VARTeL environments allow students to better understand and visualize abstract concepts, complex structures, and dynamic processes [27].
A flipped classroom designed specifically as a learning space [28], the VARTeL environment would be beneficial in imparting knowledge to the students. One study has shown that by implementing a technological learning environment into an undergraduate science class, students are more inclined to actively participate and self-learn the various concepts [29]. This shows that a specific learning environment is more effective in motivating students to learn the concepts taught in class.
3. Materials and Method
This research was conducted at NTU among Year-2 students in the School of Mechanical and Aerospace Engineering (MAE), who were majoring in Mechanical Engineering. The experiment was conducted through a class to allow students learning about STEM concepts through a VARTeL environment. Students from the class of AY21/22 Laboratory Experiments (Course code: MA2071) were the focus group for this experiment, with two types of data, qualitative and quantitative, being collected throughout the experiment. A total of 156 students responded to the questionnaire with regards to the experiment as the qualitative data, while 15 students from the same focus group were singled out for an interview that provided the qualitative data for the experiment.
3.1. VARTeL Classroom at NTU Hive
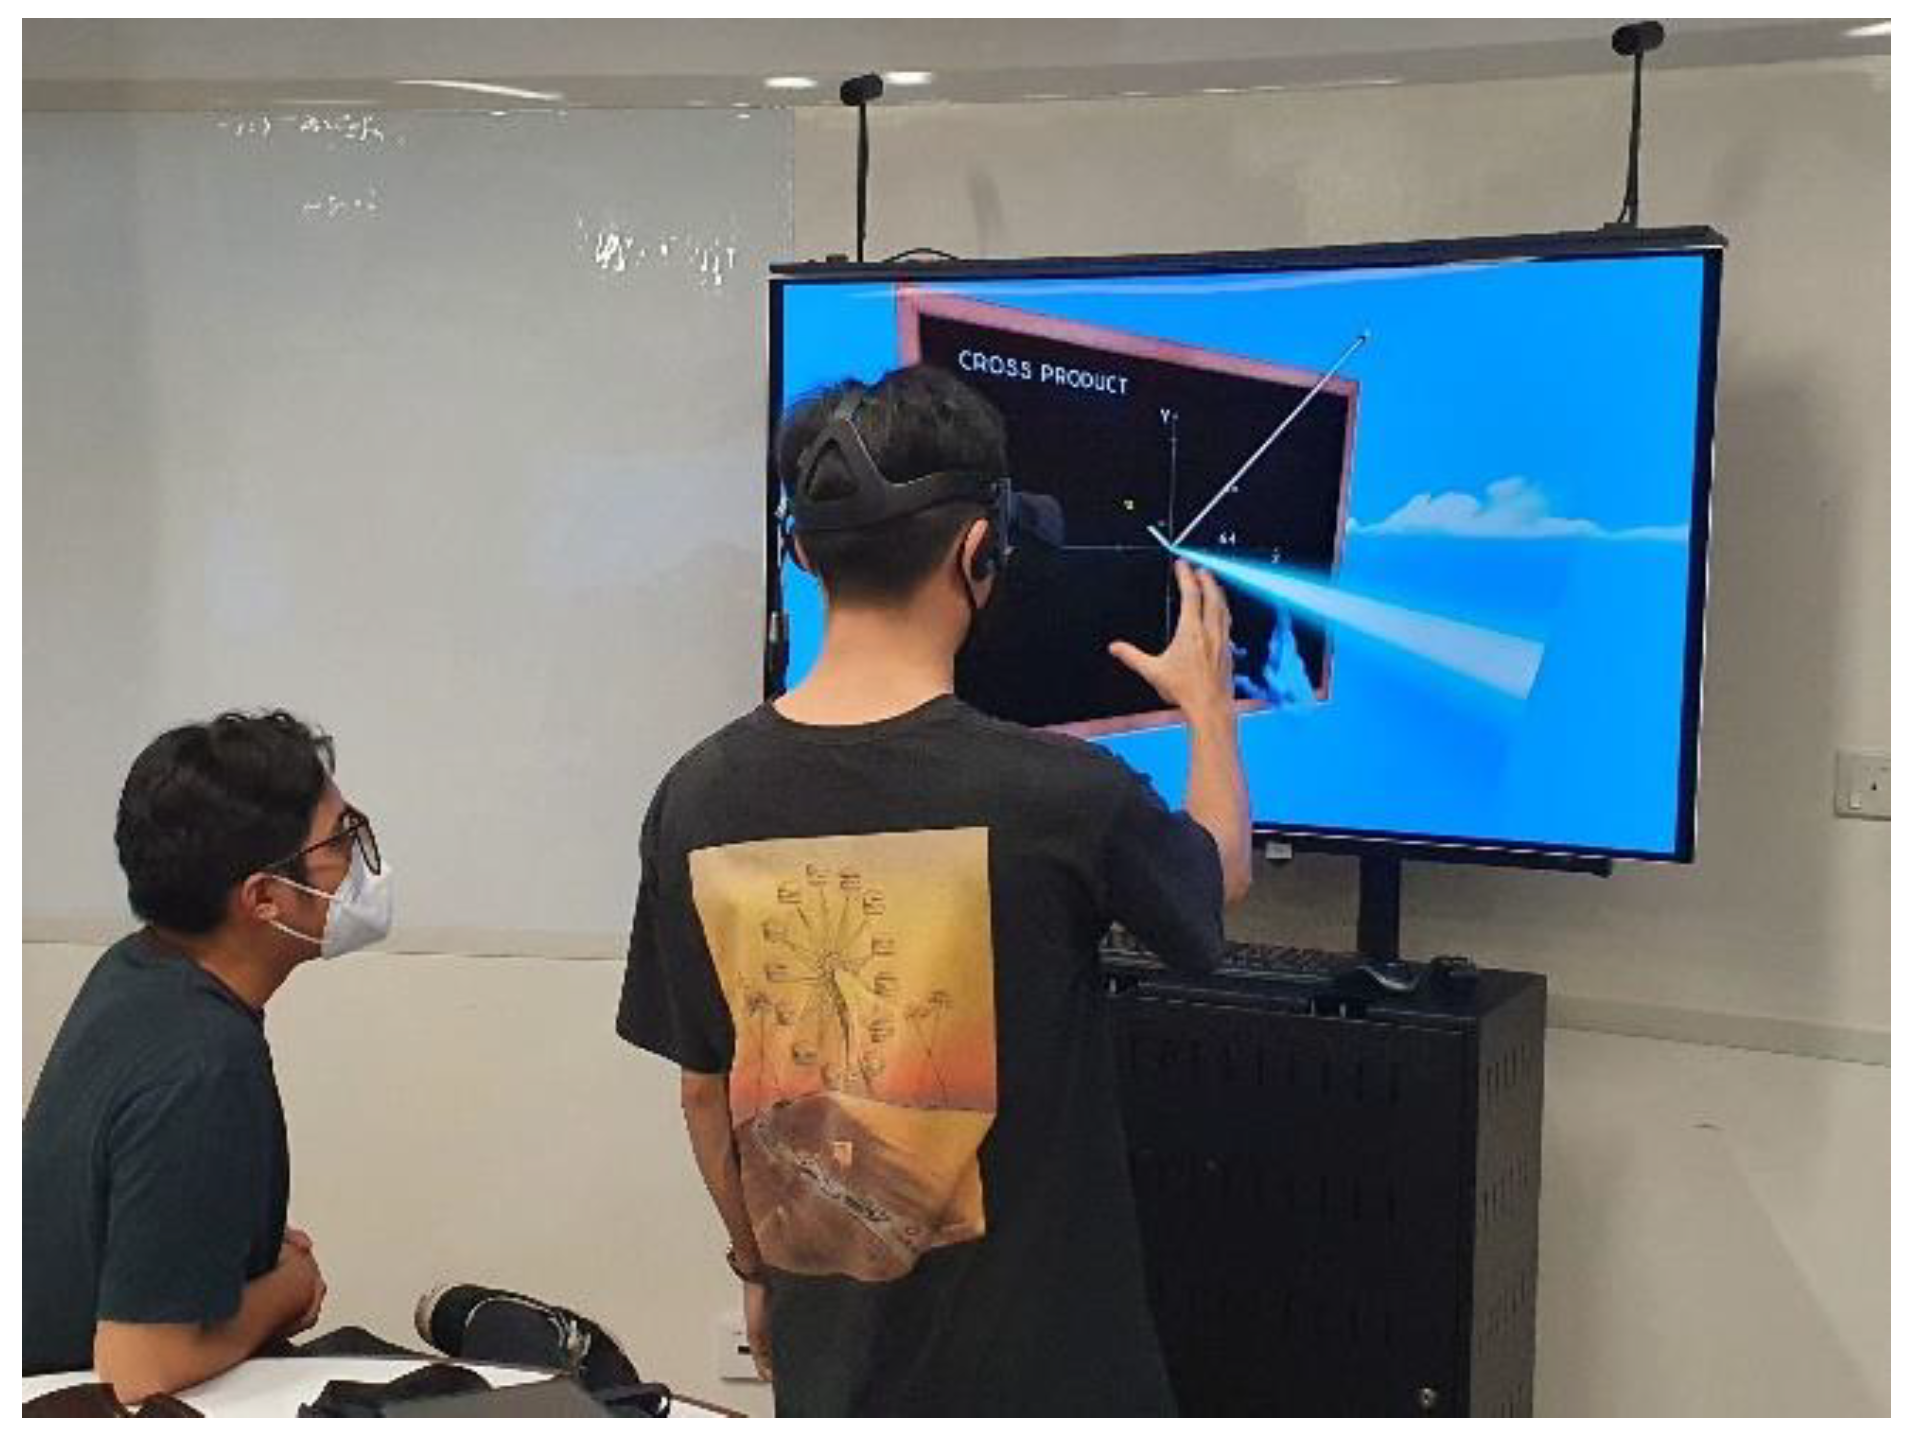
In this work, the experiment was conducted in a VAR classroom located at the HIVE Learning Hub on the NTU campus, as shown in Figure 1. Students were asked to complete pre and post surveys that consisted of a list of questionnaires. In between, the students were also required to participate in three different VAR activities.
The VAR classroom in the Hive Learning Hub is equipped with six VR HMD headsets, each mounted on an individual 3D monitor display. Each VR headset is powered by a high-end computer to ensure that the VR game programs are able to run smoothly. Furthermore, 3D glasses are provided to allow students to make use of the 3D mode on each monitor. Some players may encounter motion sickness when they use the HMD in VR immersive environments [30,31,32,33], where some prior works in the literature discussed the mitigations of HMD motion sickness. In this research, the same game scenes are projected to both HMD and 3D TVs. For those students with motion sickness in the experiments with HMD, we suggest the students sit on their chairs while doing the VAR learning. Also, we have designed all the VAR games for each learner to play for no more than 5 min typically. For a very small percentage of students (about 1% or less) with severe motion sickness, they are allowed to use a large screen instead of the HMD in their learning session.
The VR headsets used in this experiment are the Oculus Rift. Leap motion sensors are attached to the VR headsets to detect users’ hand motions. The questionnaires used for this experiment are established online using Google Forms. Due to the large number of students in each class, as well as the benefit of simplicity, students are asked to use their own mobile devices to scan a QR code to access the questionnaire.
3.2. VARTeL Experiment Settings
Students are required to participate in three different VR simulation games for a duration of 3 h in the VAR classroom, namely ‘Virtual Cell’, ‘Virtual F1’, and ‘Virtual Vector’. These three VR games are part of the VARTeL apps developed in-house. These VR games are designed using popular development tools, including Unity3D (version 2022.3.0), Blender (version 4.0), and so on. The general schedule for the lesson is shown in Table 1.
The discussions happened after each VR game and focused on the specific topic with regards to the VR activity that the students experienced beforehand. Each activity was then further broken down as follows.
Firstly, students were required to experience a virtual lesson of the ‘Virtual Cell’ learning game and interact with 3D models of cell parts using the VR headset, as shown in Figure 2a. The purpose of this activity was to introduce the concept of learning in the VARTeL environment. As the lesson for this activity was fully conducted as self-study, students would have to learn about the concepts completely in the virtual world with no help from instructors. Due to the nature of cells, this VR game program provided an experience through 3D models that is otherwise not possible in a classroom setting.
The actions taken by the students during the ‘Virtual Cell’ gameplay are described next. After donning the VR headsets, students interact with the learning game using their hands through the sensors. Next, it brings students into a virtual ‘journey’ inside the 3D models of various cell parts, with a voiceover explaining the concepts behind each cell part.
After the virtual journey ends, students would then be able to bring up an interaction menu for the learning game using their left hand. With the menu, various cell parts can be selected for interactions. Once a cell part is selected, the interaction available to students would be to move the part by swiping/making contact, zooming in and out through closing and opening two pinching hands, respectively. Each cell part also displays text information about the important concepts. Students would then end the VR activity when they deem that they have learnt all the concepts in the ‘Virtual Cell’ game.
In the second VR learning game, ‘Virtual F1’, students are required to assemble an F1 racing car within the simulation game with the virtual parts modeled, as shown in Figure 2b. The purpose of this activity is to introduce the concept of engineering simulation in a VR environment. Similar to the ‘Virtual Cell’ game, experiencing the assembly of a F1 car is only possible when a right part is selected and assembled in a specific place (i.e., paddock, manufacturing plant, etc.). Therefore, this VR game allows students to experience car assembly, which is difficult to do in the real world. In the ‘Virtual F1’ game, students start the activity after putting on the HMD headset by selecting the start button in the VR environment with their hands. Instructions about assembling the F1 car are displayed to them. Various parts and the main body of the car would appear in front of them. Students are then required to assemble the F1 car by pinching the right parts and placing them onto the main car body following the correct sequence. If the main car body where the placement of the part is hard to reach, students would then swipe the main car body to rotate it. Once the F1 car is fully assembled, students are then instructed by the game to interact with the car and observe the cross-section of the car along three axes. Once students finish observing the cross-sections of the F1 car, a small video would be played to show the car-driving behaviors in a VR environment.
For the third learning game, ‘Virtual Vector’, students are required to make use of the game to calculate various vectors, as shown in Figure 2c. Unlike the previous two games, this VR game is more focused on theory, with several abstract concepts being involved. The purpose of this activity is to allow students to learn through interaction in the VR environment. Vectors are displayed as 3D models in three possible dimensions, X, Y, and Z. These vectors are interactable, where each vector responds to changes with respect to the other vectors. Students can also input values into a section of the interaction menu to change the magnitude of the vectors. Unlike the previous two games, there are no specific guidelines for this simulation game. Students would start the VR program, interact to learn the relevant concepts, and end the game when they are done with the self-learning.
3.3. Data Collection
Two types of data are collected for this experiment, quantitative and qualitative. Quantitative data are collected from two questionnaires, named ‘pre-test’ and ‘post-test’. Students are required to do both tests at the start and end of the experiment, respectively. Qualitative data are mainly collected through interviews conducted at the end of each experiment session. Observation is also performed during the experiment. Any student feedback is noted and classified as qualitative data.
3.3.1. Pre- and Post-Tests
After the introduction to each class, students are required to use their mobile devices and scan a QR code that would link them to the survey. The pre-test consists of only the VARTeL questions, while the post-test consists of both VARTeL and Technology-Rich Outcome-Focused Learning Environment Inventory (TROFLEI) questions, as shown in Table 2. These questions provide insights into how much the students know about VAR technology beforehand and afterwards.
After the gameplay and the discussions are concluded, students are given another QR code to scan and access the post survey questionnaire. The VARTeL academic questions mainly focus on the concepts that are taught during the gameplay. Six questions, two on each game, are provided for the students to answer, as shown in Table 3. Each question is limited to only one right answer. Based on the responses of the students, academic efficacy is calculated as a gauge on how effective the VARTeL is in teaching the various concepts.
The other section of the post questionnaire consists of the questions using the TROFLEI model. It focuses on determining how effective the VARTeL learning environment is for teaching concepts in a classroom setting. The TROFLEI provides a learning environment instrumentation with a focus on the assessment of the outcome dimensions of integrating Information and Communications Technology (ICT) technology into learning [34,35]. It consists of 10 underlying scales: Student Cohesiveness, Teacher Support, Involvement, Investigation, Task Orientation, Cooperation, Equity, Differentiation, Computer Usage, and Young Adult Ethos. There are 8 items per scale, which results in a total of 80 items in the TROFLEI. The TROFLEI method is helpful in determining the effects of learning environments on students and their performance [34]. The original TROFLEI model focused on the effects of computer usage on the learning environment [35]. For this research, the modified TROFLEI model is developed in order to match the immersive VR environment with the HMD headsets of the experiment by changing the computer usage to the usage of VARTeL. Instead of the original TROFLEI model, which consists of 10 underlying scales and 8 items per scale, the modified TROFLEI model consists of 48 items assigned to 8 underlying scales and 6 items per scale. The tailored eight underlying scales are: Student Cohesiveness, Student Involvement, Student Investigation, Student Cooperation, Equity, Differentiation, Creativity, and VARTeL, where six out of eight are the same as the original TROFLEI, except for Creativity and VARTeL. Table 4 describes each underlying scale with the corresponding sections and simplified symbol.
Each underlying scale has two components, separated by an ‘Actual’ and an ‘Ideal’ section. The ‘Actual’ section represents what students are doing in class, while the ‘Ideal’ section represents what students would prefer to experience in the learning environment [36]. Each scale has 12 questions classified into 6 items. Each item would then ask the students for the actual experience in the VARTeL environment and follow up with the rating of what the student determines the ideal experience of the VARTeL environment would be.
For both sections in all the underlying scales, students are given five options with the five-point Likert scale to be picked as answers: (5) Almost Always, (4) Often, (3) Sometimes, (2) Seldom, and (1) Almost Never. The responses of the students for each section would then be used as a basis for the analysis of how effective the VARTeL environment is.
3.3.2. Interview
After the experiment, an interview session is conducted with selected students. The questionnaire mainly focuses on the aspect and effectiveness of the VARTeL environment, as shown in Table 5, while also asking about any future improvements that students would like to see. These questions mainly probe into the experiences of the students during the VR gameplay. The questions are also expanded during the interview to see what difficulties are faced by students for each learning game. Students’ comments on the effectiveness of and improvements for each game are also zeroed in on, with final suggestions for future implementation also being taken note of.
3.4. Data Analysis
The analyses of the results are divided into two parts: the TROFLEI data and the VARTeL data, which will be presented next.
3.4.1. TROFLEI Data Analysis
For the ease of data analysis, the headers for each section are broken down into simpler terms, as shown in Table 4. These symbols are used to depict the data and results in this paper.
The TROFLEI data are also summarized into each section rather than just each item. For each section, the mean values of the responses from the items specific to the section are taken for the analysis, with Equation (1). For example, since each section has six items in the questionnaire, the six responses of a student are averaged out and the value obtained is the recorded value of the section in the dataset.
where the values of A1 to A6 are the simplified symbol given to each survey question.
Each student response is summarized into the averaged value of each underlying scale section. These values set the foundation for the various data analysis methods in the experiment.
The Cronbach’s alpha coefficient value α is commonly utilized to measure the reliability of survey responses [37,38]. For the TROFLEI data analysis, the Cronbach’s alpha value α will first be calculated for each underlying scale section to determine the reliability of the questionnaire. These calculated Cronbach’s alpha values will then be compared with the standard Cronbach’s alpha internal consistency values, which is shown in Table 6.
The mean values of each underlying scale section are calculated as a gauge of how effective the students feel the VARTeL environment is. The mean values of the ‘Actual’ and ‘Ideal’ section of each underlying scale are compared to determine whether the students feel that the VARTeL environment experienced is near to the ideal VARTeL environment.
3.4.2. Evaluations of VARTeL Environment and VARTeL Academic
The questionnaire answers for the VARTeL environment and VARTeL academic are classified into two categories, ‘True’ and ‘False’. As there is only one correct answer for each question, the ‘True’ value, detonated as ‘1’, is given to the correct answer, while the ‘False’ value, detonated as ‘0’, is given to all the other answers. The maximal value of the VARTeL environment section of the questionnaire is 4.0, as it has a total of four survey questions. The maximal value of the VARTeL academic section of the questionnaire is 6.0, as it has a total of six survey questions.
The values of the survey results are then tabulated separately, where the sum of the values is calculated for the VARTeL environment-specific section and the VARTeL academic section. These values are then used for the subsequent data analysis in this experiment. Based on the response of each student in the pre-test and post-test, an improvement score is given based on the value obtained by deducting the sum of the VARTeL academic in the pre-test to the VARTeL academic in the post-test. A correlation graph is plotted between the sum of the VARTeL environment-specific section against the ‘Improvement Score’ to determine if students who are more experienced with the VARTeL environment would learn better. The interview is recorded with the consent of the participants before the start of the interview. The answers of the participants are all captured and summarized into various points. No statistical analysis is conducted, and only recurring points are noted in this paper.
4. Results Evaluation and Discussion
4.1. Summary of the TROFLEI Results Evaluation
The overall summary of the TROFLEI results data obtained from the experiments across all the underlying scales in each section is shown in Table 7. Note that a total of 227 responses from participants are recorded for this dataset. The focused summary of this dataset on the Cronbach’s alpha value α for the reliability and mean values is shown in Table 8.
As shown in Table 8, the Cronbach’s alpha values as the results derived from the experiments are displayed for all the underlying scales in both the ‘Actual’ and ‘Ideal’ sections. For ‘(A) Student Cohesiveness’, the Cronbach’s alpha values for the ‘Actual’ and ‘Ideal’ are 0.88 and 0.87, respectively. Both values fall under the ‘Good’ category, according to the rating classifications in Table 6. For the remaining seven underlying scales, all the sections have a Cronbach’s alpha value above 0.9, therefore categorizing them under the ‘Excellent’ category, according to the rating classifications in Table 6. As all the eight underlying scales are well above the threshold for the ‘Good’ category, the questionnaire is deemed very reliable.
The mean values for each of the underlying scales, split into the ‘Actual’ and ‘Ideal’ sections, are also shown in Table 8. As expected, for all the underlying scales, the mean values in the ‘Ideal’ section are higher than the mean values in the ‘Actual’ section. This is mainly due to the ‘Ideal’ section being referenced to the perfect VARTeL environment for each underlying scale, adding up to a perfect VARTeL environment that is able to effectively allow students to learn focused concepts flawlessly. It is aligned with the same trends as those of the observations in [34,35], with small differences of the Cronbach’s alpha values for the underlying scales.
As observed in the ‘Ideal’ section, the mean values range from 3.88 to 4.30, showing that students believe that various environment scales are effectively applied in an ideal VARTeL environment. For example, the highest mean value in the ‘Ideal’ section is 4.30, attached to ‘(F) Equity’. This shows the description of ‘The extent to which students are treated equally by the teacher in the VARTeL environment’ is extremely important in an ideal VARTeL environment.
The other underlying scales with mean values above 4.00 in the ‘Ideal’ section are ‘(D) Student Cooperation’, ‘(E) Differentiation’, ‘(G) Creativity’, and ‘(H) VARTeL’. Two of the more significant factors would be ‘(D) Student Cooperation’ and ‘(H) VARTeL’, as both can be further looked at as collaborative learning, which is beneficial to students’ learning efficacy. Through this, more activities focusing on collaborative learning should be introduced and implemented in the future VARTeL environment.
‘(E) Differentiation’ and ‘(G) Creativity’ can be linked to individual ability and imagination, respectively, where both can be explored in future VARTeL environment activities to expand on innovation. These activities can be tied with skills to train up future entrepreneurs, which are not only important in the engineering climate but also the entire society.
The other three underlying scales with values below 4.00 are ‘(A) Student Cohesiveness’, ‘(B) Student Involvement’ and ‘(C) Student Investigation’, with the lowest being ‘(B) Student Involvement’. But the lowest value, 3.88, is still relatively high on the scale, which is considered effective in the learning environment. ‘(B) Student Involvement’ and ‘(C) Student Investigation’ are tied to participation and problem solving, respectively, which are both important in the workplace and as an individual. They might be lower as the VR activities are currently more of a simulated environment rather than solving problems.
‘(A) Student Cohesiveness’ is mainly tied to students being knowledgeable and supportive of their classmates in the learning environment, which can be tied to team cohesiveness in a workplace after graduation. This can be lower as currently the VR activities are all individual activities, which results in no interaction among the students using the VR headsets. However, with the three underlying scales being lower than 4.00 and showing effectiveness over the others, this could either translate to a lesser importance or a need for improvement.
The mean values from the ‘Actual’ section ranging from 3.78 to 4.27 are used to compare the mean values in the ‘Ideal’ section. Similarly, five of the underlying scales from the ‘Actual’ section have a value above 4.00, while the other three have a value below 4.00. As explained above, the noticeable factor is that the mean values in the ‘Actual’ section are lower than in the ‘Ideal’ section. The smallest difference between the two sections is 0.03 in the ‘(F) Equity’, while the biggest difference is 0.11 in ‘(H) VARTeL’ and ‘(B) Student Involvement’, with the minor differences showing that the current VARTeL environment is comparable to what students have in mind. However, as the mean values in the ‘Actual’ section are comparable to the mean values in the ‘Ideal’ section, this shows that the students feel that the current VARTeL environment is efficient in delivering concepts in the classroom. Even so, there are still negative differences when comparing the mean values to the ‘Ideal’ section, which means that the VARTeL environment is still below what students expect and there is room for improvement. An argument could also be made that the VARTeL environment should be enhanced to make students believe the ideal environment can do much better than what they are currently expecting.
As there are 10 questions on the VARTeL environment and VARTeL academic in the pre-test and post-test questionnaires, a maximum score of 10 can be achieved in the Total Sum. A maximum score of 4 and 6 can be scored for the VARTeL environment sum and VARTeL academic sum, respectively, for both the pre- and post-tests.
4.2. Summary of Interview Responses
In this research, all the interviews are recorded with the consent of the students and the data collected are broken down into important points rather than including the entire transcripts. Although the interview is structured with questions, the interview sessions would become more discussion-focused rather than a standard question-and-answer form. Therefore, the important points are broken down into a single list below rather than having each answer tied to a question. The list of notable points is shown in Table 9, based on students’ feedback during the interview.
Given the student feedback, although the students believe the VARTeL environment to be beneficial to engineering education, many would like to see further improvements to the VR learning games and the environment itself before being adopted into mainstream education.
4.3. Limitations and Future Works Recommendations
Although a pre-test and post-test were used to gauge the students’ academic knowledge for this experiment, the VARTeL questionnaire only consisted of a total of 10 questions and was not able to effectively gauge students’ academic improvement due to the VR games. Four out of ten questions were also specific to the VARTeL environment rather than the concepts of the VR games. The remaining six questions were split into three parts for each VR game, with only two questions pertaining to the concepts taught, which was insufficient when used to gauge the academic achievement of the students.
A focus group can be introduced outside of the class, where engineering students can be asked to take part in a paid or volunteer study. This focus group would go through the same concepts taught in the VARTeL environment but rather than going through the VR games, the students in the focus group would go through a lesson using a pen and paper. Other environments could also be tested to determine how effective a VARTeL environment is when compared to others. Examples such as ‘Actual Hands-On’, ‘Laboratory Pilot Plants/Simulations’ and ‘Computer Simulated Exercise’ are all environments that can be compared to determine the effectiveness of the VARTeL environment. Rather than just using the resultant TROFLEI dataset and VARTeL dataset, more specific questionnaires targeting academic achievement can be used in the future for comparison of how effective the VARTeL environment is. One example would be implementing the study of self-efficacy alongside the TROFLEI and determining any correlation between the two questionnaires. Another example would be having a grading factor outside of having questionnaires. This grading could be performed in the VARTeL environment through activities where students have to fulfil certain conditions, showing that the students have effectively picked up the concepts that are taught during the VR games. By having a grading factor for each individual student, a more effective correlation could be plotted to determine the effectiveness of the VARTeL environment.
The VR games can be changed to more engineering-focused concepts rather than STEM to determine the effectiveness of the VARTeL environment in imparting engineering concepts. Also, as the students in this study were all from an engineering background, the majority of the feedback received was that the students would like to see activities more focused on the engineering concepts, such as engines, manufacturing plants and CAD, rather than STEM concepts. By changing the VR activities to be mainly focused on engineering concepts, a clearer picture can be painted of the effectiveness of a VARTeL environment in an engineering classroom.
5. Conclusions
With the advancement of technology-enhanced learning, VAR technologies have started to be implemented in research and development. It is an interesting topic to discuss how VAR technology-enhanced learning can be deployed in STEM education, especially university engineering education. A VARTeL learning flipped classroom with various VR learning games has been built in house at NTU for this research. In this research, the effectiveness of the VARTeL environment in delivering concepts in a university engineering classroom is analyzed. Three VR learning games, ‘Virtual Cell’, ‘Virtual F1’, and ‘Virtual Vector’, have been utilized in the experiment. A total of 156 students from the Year-2 Mechanical Engineering program from the School of MAE, NTU, participated in the experiment.
The TROFLEI model is slightly modified and simplified in this research to be eight underlying scales with six items per scale. The data analysis for the TROFLEI questionnaire shows that all the underlying scales are effectively applied, with mean values achieved above 3.77, while the students also believe that the VARTeL environment can be effectively implemented into the engineering education system. Not only is ‘Equity’ the most effective underlying scale applied in the VARTeL environment, but it is also the scale that students believe to be most relevant in the ‘Ideal’ VARTeL environment. Out of the eight underlying scales, the most lacking scale is ‘(B) Student Involvement’ in both the ‘Actual’ and ‘Ideal’ environments, which therefore must be improved for engineering education. Every underlying scale in the ‘Actual’ environment is also lower than that in the ‘Ideal’ environment, showing that there is still room for improvement when it comes to the VARTeL environment.
The data analysis for the VARTeL questionnaire shows that students generally improved academically after participating in the VARTeL environment VR games. On average, students scored a 5.81 for the pre-test, while they scored an average of 7.25 for the post-test, showing the general improvement at the class level. On the individual level, the improvement score matric is presented and students improved by a mean of 1.43 academically. However, there are certain outliers, with students improving with a score of 6.00 and −6.00. With the improvement shown by the students, the VARTeL environment has shown that it can effectively impart knowledge to the students.
The work in this research reveals the benefits of VARTeL games in flipped classroom settings, where students take turns to participate in hands-on immersive practices with HMD. It provides virtual worlds to students to promote learning through gaming and learning from observations. It is aligned with the prior works in the literature on the technology-enhanced learning with VR games. The approaches in this paper can easily be scaled up to a large cohort of students. It encourages broader adoptions of the VARTeL into more courses in higher education.
However, there are still various matters to take into consideration before a wide-scale adoption of the VARTeL environment in engineering education. Firstly, in future research, a focus group should be established to determine the effectiveness of a VARTeL environment compared to other learning environments. Another improvement to be made is to have a proper matrix in determining the academic achievement to be used as a gauge for the effectiveness of a VARTeL environment. Lastly, activities focused more on engineering concepts could be used when determining the effectiveness for an engineering class rather than STEM concepts.
Author Contributions
Conceptualization, Y.C.; methodology, J.Y.W. and A.B.A.; software, A.B.A., Y.X. and L.H.; validation, A.B.A., L.H., I.W. and Q.C.; formal analysis, J.Y.W. and A.B.A.; investigation, Y.C. and A.B.A.; resources, Y.C. and I.W.; data curation, J.Y.W. and A.B.A.; writing—original draft preparation, J.Y.W.; writing—review and editing, A.B.A., Q.C. and I.W.; visualization, Y.X. and A.B.A.; supervision, Y.C.; project administration, Y.C. and L.H.; funding acquisition, Y.C. All authors have read and agreed to the published version of the manuscript.
Funding
This research is funded by Singapore’s Ministry of Education under the Tertiary Education Research Fund (MOE2018—TRF-006).
Institutional Review Board Statement
Ethical approval for this study was obtained from the Institutional Review Board of Nanyang Technological University (IRB-2020-01-032) on 30 June 2020.
Data Availability Statement
The experiment data generated are available from DR-NTU (Data).
Acknowledgments
The authors would like to express their appreciation to Jasmin Tay, Ryan Ba, Faatihah Binte Mohd Taib, Mengshan Xu, and Nay Zin Tun for their efforts in the development of VARTeL environment at NTU. Thanks also go to NTU for the support of this project.
Conflicts of Interest
The authors declare no conflicts of interest.
References
- Alarifi, B.N.; Song, S. Online vs. in-person learning in higher education: Effects on student achievement and recommendations for leadership. Humanit. Soc. Sci. Commun. 2024, 11, 86. [Google Scholar] [CrossRef]
- Akman, E.; Çakır, R. The effect of educational virtual reality game on primary school students’ achievement and engagement in mathematics. Interact. Learn. Environ. 2023, 31, 1467–1484. [Google Scholar] [CrossRef]
- Al-Ansi, A.M.; Jaboob, M.; Garad, A.; Al-Ansi, A. Analyzing augmented reality (AR) and virtual reality (VR) recent development in education. Soc. Sci. Humanit. Open 2023, 8, 100532. [Google Scholar] [CrossRef]
- AlGerafi, M.A.M.; Zhou, Y.; Oubibi, M.; Wijaya, T.T. Unlocking the Potential: A Comprehensive Evaluation of Augmented Reality and Virtual Reality in Education. Electronics 2023, 12, 3953. [Google Scholar] [CrossRef]
- Conrad, M.; Kablitz, D.; Schumann, S. Learning effectiveness of immersive virtual reality in education and training: A systematic review of findings. Comput. Educ. X Real. 2024, 4, 100053. [Google Scholar] [CrossRef]
- Monteiro, D.; Liang, H.-N.; Abel, A.; Bahaei, N.; Monteiro, R.d.C. Evaluating Engagement of Virtual Reality Games Based on First and Third Person Perspective Using EEG and Subjective Metrics. In Proceedings of the2018 IEEE International Conference on Artificial Intelligence and Virtual Reality (AIVR), Taichung, Taiwan, 10–12 December 2018; pp. 53–60. [Google Scholar]
- Guerra-Tamez, C.R. The Impact of Immersion through Virtual Reality in the Learning Experiences of Art and Design Students: The Mediating Effect of the Flow Experience. Educ. Sci. 2023, 13, 185. [Google Scholar] [CrossRef]
- Cao, Q.; Png, B.T.; Cai, Y.; Cen, Y.; Xu, D. Interactive Virtual Reality Game for Online Learning of Science Subject in Primary Schools. In Proceedings of the 2021 IEEE International Conference on Engineering, Technology & Education (TALE), Wuhan, China, 5–8 December 2021; pp. 383–389. [Google Scholar]
- Cai, S.; Liu, C.; Wang, T.; Liu, E.; Liang, J. Effects of learning physics using Augmented Reality on students’ self-efficacy and conceptions of learning. Br. J. Educ. Technol. 2020, 52, 235–251. [Google Scholar] [CrossRef]
- Petersen, G.B.; Petkakis, G.; Makransky, G. A study of how immersion and interactivity drive VR learning. Comput. Educ. 2022, 179, 104429. [Google Scholar] [CrossRef]
- Marks, B.; Thomas, J. Adoption of virtual reality technology in higher education: An evaluation of five teaching semesters in a purpose-designed laboratory. Educ. Inf. Technol. 2022, 27, 1287–1305. [Google Scholar] [CrossRef] [PubMed]
- Kyaw, N.; Gu, M.; Croft, E.; Cosgun, A. Comparing Usability of Augmented Reality and Virtual Reality for Creating Virtual Bounding Boxes of Real Objects. Appl. Sci. 2023, 13, 11693. [Google Scholar] [CrossRef]
- Al Khaldy, M.; Ishtaiwi, A.; Al-Qerem, A.; Aldweesh, A.; Alauthman, M.; Almomani, A.; Arya, V. Redefining E-Commerce experience: An exploration of augmented and virtual reality technologies. Int. J. Semantic Web Inf. Syst. 2023, 19, 1–24. [Google Scholar] [CrossRef]
- Guillen-Sanz, H.; Checa, D.; Miguel-Alonso, I.; Bustillo, A. A systematic review of wearable biosensor usage in immersive virtual reality experiences. Virtual Real. 2024, 28, 1–28. [Google Scholar] [CrossRef]
- Pedram, S.; Kennedy, G.; Sanzone, S. Toward the validation of VR-HMDs for medical education: A systematic literature review. Virtual Real. 2023, 27, 2255–2280. [Google Scholar] [CrossRef] [PubMed]
- Harris, D.J.; Arthur, T.; Kearse, J.; Olonilua, M.; Hassan, E.K.; De Burgh, T.C.; Wilson, M.R.; Vine, S.J. Exploring the role of virtual reality in military decision training. Front. Virtual Real. 2023, 4, 1165030. [Google Scholar] [CrossRef]
- Cai, Y.; Van Joolingen, W.; Walker, Z. VR, Simulations and Serious Games for Education; Springer: Singapore, 2019. [Google Scholar]
- Ferguson, C.; Davidson, P.M.; Scott, P.J.; Jackson, D.; Hickman, L.D. Augmented reality, virtual reality and gaming: An integral part of nursing. Contemp. Nurse 2015, 51, 1–4. [Google Scholar] [CrossRef] [PubMed]
- Ozturkcan, S. Service innovation: Using augmented reality in the IKEA Place app. J. Inf. Technol. Teach. Cases 2020, 11, 8–13. [Google Scholar] [CrossRef]
- Li, S.; Jiang, S. The Technology Acceptance on AR Memorable Tourism Experience—The Empirical Evidence from China. Sustainability 2023, 15, 13349. [Google Scholar] [CrossRef]
- Rodriguez-Salvador, M.; Castillo-Valdez, P.F. Promoting Collaborative Learning in Students Soon to Graduate through a Teaching–Learning Model. Educ. Sci. 2023, 13, 995. [Google Scholar] [CrossRef]
- Wang, A.I.; Tahir, R. The effect of using Kahoot! for learning—A literature review. Comput. Educ. 2020, 149, 103818. [Google Scholar] [CrossRef]
- Fakhry, M.; Kamel, I.; Abdelaal, A. CAD using preference compared to hand drafting in architectural working drawings coursework. Ain Shams Eng. J. 2021, 12, 3331–3338. [Google Scholar] [CrossRef]
- Elmqaddem, N. Augmented reality and virtual reality in education. myth or reality? Int. J. Emerg. Technol. Learn. 2019, 14, 234–242. [Google Scholar] [CrossRef]
- Di Natale, A.; Repetto, C.; Riva, G.; Villani, D. Immersive virtual reality in K-12 and higher education: A 10-year systematic review of empirical research. Br. J. Educ. Technol. 2020, 51, 2006–2033. [Google Scholar] [CrossRef]
- Chan, H.W. Promoting Autonomous, Collaborative English learning Practices and Fostering Greater Learner Autonomy among Secondary Students in Hong Kong. Asian J. Educ. e-Learn. 2019, 7, 22–28. [Google Scholar] [CrossRef]
- Lee, T.; Wen, Y.; Chan, M.Y.; Azam, A.B.; Looi, C.K.; Taib, S.; Ooi, C.H.; Huang, L.H.; Xie, Y.; Cai, Y. Investigation of virtual & augmented reality classroom learning environments in university STEM education. Interact. Learn. Environ. 2022, 1–16. [Google Scholar] [CrossRef]
- Ba, R.; Xie, Y.; Zhang, Y.; Taib, S.F.B.M.; Cai, Y.; Walker, Z.; Chen, Z.; Tan, S.; Chow, B.H.; Lim, S.M.; et al. Virtual reality enzymes: An interdisciplinary and international project towards an inquiry-based pedagogy. In VR, Simulations and Serious Games for Education; Gaming Media and Social Effects; Springer Nature: Singapore, 2018. [Google Scholar] [CrossRef]
- Garzón, J.; Acevedo, J. Meta-analysis of the impact of Augmented Reality on students’ learning gains. Educ. Res. Rev. 2019, 27, 244–260. [Google Scholar] [CrossRef]
- Kourtesis, P.; Papadopoulou, A.; Roussos, P. Cybersickness in Virtual Reality: The Role of Individual Differences, Its Effects on Cognitive Functions and Motor Skills, and Intensity Differences during and after Immersion. Virtual Worlds 2024, 3, 62–93. [Google Scholar] [CrossRef]
- Marinho, A.d.S.; Terton, U.; Jones, C.M. Cybersickness and postural stability of first time VR users playing VR videogames. Appl. Ergon. 2022, 101, 103698. [Google Scholar] [CrossRef]
- Palmisano, S.; Constable, R. Reductions in sickness with repeated exposure to HMD-based virtual reality appear to be game-specific. Virtual Real. 2022, 26, 1373–1389. [Google Scholar] [CrossRef]
- Sumayli, Y.; Ye, Y. Motion Sickness during Roll Motion: VR HMD View versus Monitor View. Vibration 2023, 6, 45–56. [Google Scholar] [CrossRef]
- Aldridge, J.M.; Dorman, J.P.; Fraser, B.J. Use of multitrait-multimethod modelling to validate actual and preferred forms of the technology-rich outcomes-focused learning environment inventory (TROFLEI). Aust. J. Educ. Dev. Psychol. 2004, 4, 110–125. [Google Scholar]
- Koul, R.B.; Fisher, D.; Shaw, T. An application of the TROFLEI in secondary-school science classes in New Zealand. Res. Sci. Technol. Educ. 2011, 29, 147–167. [Google Scholar] [CrossRef]
- Dorman, J.P.; Aldridge, J.M.; Fraser, B.J. Using structural equation modelling to investigate associations between envi-ronment and outcomes in technology-rich, outcomes-focused classrooms in Australian secondary schools. In Contemporary Approaches to Research on Learning Environments; World Scientific: Singapore, 2006; pp. 425–447. [Google Scholar]
- Frost, J. Cronbach’s Alpha: Definition, Calculations & Example. Available online: https://statisticsbyjim.com/basics/cronbachs-alpha/ (accessed on 30 January 2023).
- Taber, K.S. The Use of Cronbach’s Alpha When Developing and Reporting Research Instruments in Science Education. Res. Sci. Educ. 2018, 48, 1273–1296. [Google Scholar] [CrossRef]
Figure 1.
Student experiencing a VR activity in the VARTeL classroom at the Hive.

Figure 2.
Interactive and immersive learning of games: (a) Virtual Cells, (b) Virtual F1, and (c) Vector Geometry.
Figure 2.
Interactive and immersive learning of games: (a) Virtual Cells, (b) Virtual F1, and (c) Vector Geometry.


Table 1.
Timetable for one class session.
| Timeslot | Task |
|---|---|
| 13:30–14:00 | Introduction to VAR and VARTeL |
| 14:00–14:15 | Pre-Test |
| 14:15–14:45 | Virtual Cell and Discussions |
| 14:45–15:15 | Virtual F1 and Discussions |
| 15:15–15:45 | Virtual Vector and Discussions |
| 15:45–16:15 | Post-Test |
| 16:15–16:30 | Interview (Post Class—Only Selected Students) |
Table 2.
VARTeL environment survey questions.
| No | Questions |
|---|---|
| 1 | What are the two main characteristics of virtual reality? |
| 2 | What is the function of the Oculus Rift headset? |
| 3 | Which hardware cannot be used for motion detection? |
| 4 | What are the fundamentals of virtual and augmented reality (VAR) technology? |
Table 3.
VARTeL academic survey questions.
| VR Game | Questions |
|---|---|
| Virtual Cells | Which of the following is not a cell part? |
| Which of the following is not part of a cell? | |
| Virtual F1 | What are not available during the virtual F1 experiment? |
| Virtual F1 experiment has the following techniques used except? | |
| Virtual Vectors | Which two vectors have a dot product with a magnitude of 0? |
| What is the cross product of (−1, 2, 0) × (4, 2, 0)? |
Table 4.
Description of the eight underlying scales of the modified TROFLEI model.
| Underlying Scale | Scale Description | Section | Simplified Symbol |
|---|---|---|---|
| (A) Student Cohesiveness | The extent to which the students know, help and are supportive of one another in the VARTeL environment. | Actual | A |
| Ideal | AI | ||
| (B) Student Involvement | The extent to which the students have attentive interest, participate in discussion, do additional work and enjoy the class in VARTeL environment. | Actual | B |
| Ideal | BI | ||
| (C) Student Investigation | The extent to which students use skills and processes of enquiry to help with problem solving and investigation as emphasized in the VARTeL environment. | Actual | C |
| Ideal | CI | ||
| (D) Student Cooperation | The extent to which students cooperate with one another rather than competing on learning tasks in the VARTeL environment. | Actual | D |
| Ideal | DI | ||
| (E) Differentiation | The extent to which teachers cater for students differently on the basis of ability, rate of learning and interests in the VARTeL environment. | Actual | E |
| Ideal | EI | ||
| (F) Equity | The extent to which students are treated equally by the teacher in the VARTeL environment. | Actual | F |
| Ideal | FI | ||
| (G) Creativity | The extent to which students exhibit creativity thinking and designing during the VR activities in the VARTeL environment. | Actual | G |
| Ideal | GI | ||
| (H) VARTeL | The extent to which students find the VR, as a tool, to be useful in and outside of the VARTeL environment. | Actual | H |
| Ideal | HI |
Table 5.
Questions for the interview.
| No | Questions |
|---|---|
| 1 | How did you feel about the VR activities? |
| 2 | Do you feel that there was any collaborative learning during the activity/discussion? |
| 3 | Any specific improvements to the VR activities experienced? |
| 4 | Any implementations of industrial-related activities you would like to see in the future? |
Table 6.
Cronbach’s alpha internal consistency ratings.
| Cronbach’s Alpha | Internal Consistency |
|---|---|
| α ≥ 0.9 | Excellent |
| 0.9 > α ≥ 0.8 | Good |
| 0.8 > α ≥ 0.7 | Acceptable |
| 0.7 > α ≥ 0.6 | Questionable |
| 0.6 > α ≥ 0.5 | Poor |
| 0.5 > α | Unacceptable |
Table 7.
Summary of the TROFLEI results data.
| A | AI | B | BI | C | CI | D | DI | E | EI | F | FI | G | GI | H | HI | |
|---|---|---|---|---|---|---|---|---|---|---|---|---|---|---|---|---|
| count | 227 | 227 | 227 | 227 | 227 | 227 | 227 | 227 | 227 | 227 | 227 | 227 | 227 | 227 | 227 | 227 |
| mean | 3.91 | 3.99 | 3.78 | 3.88 | 3.88 | 3.97 | 4.13 | 4.21 | 4.02 | 4.09 | 4.27 | 4.30 | 4.15 | 4.22 | 4.12 | 4.22 |
| std | 0.77 | 0.71 | 0.81 | 0.75 | 0.82 | 0.80 | 0.81 | 0.76 | 0.76 | 0.74 | 0.74 | 0.71 | 0.71 | 0.70 | 0.80 | 0.76 |
| min | 1.00 | 2.00 | 1.00 | 1.67 | 1.00 | 1.33 | 1.00 | 2.00 | 1.00 | 1.83 | 1.00 | 2.00 | 1.00 | 2.00 | 1.00 | 1.50 |
| 25% | 3.50 | 3.50 | 3.17 | 3.33 | 3.33 | 3.50 | 3.83 | 4.00 | 3.67 | 3.67 | 4.00 | 4.00 | 3.83 | 4.00 | 3.67 | 3.83 |
| 50% | 4.00 | 4.00 | 3.83 | 4.00 | 4.00 | 4.00 | 4.00 | 4.00 | 4.00 | 4.00 | 4.33 | 4.33 | 4.00 | 4.17 | 4.00 | 4.33 |
| 75% | 4.42 | 4.58 | 4.33 | 4.33 | 4.50 | 4.67 | 5.00 | 5.00 | 4.67 | 4.67 | 5.00 | 5.00 | 4.83 | 5.00 | 5.00 | 5.00 |
| max | 5.00 | 5.00 | 5.00 | 5.00 | 5.00 | 5.00 | 5.00 | 5.00 | 5.00 | 5.00 | 5.00 | 5.00 | 5.00 | 5.00 | 5.00 | 5.00 |
Table 8.
Focused summary of the TROFLEI dataset.
| Scale | No. of Items | Alpha Reliability (Cronbach’s Alpha) | Mean Value | Difference of Mean Values (Actual–Ideal) | ||
|---|---|---|---|---|---|---|
| Actual | Ideal | Actual | Ideal | |||
| (A) Student Cohesiveness | 6 | 0.88 | 0.87 | 3.91 | 3.99 | −0.08 |
| (B) Student Involvement | 6 | 0.92 | 0.91 | 3.78 | 3.88 | −0.10 |
| (C) Student Investigation | 6 | 0.95 | 0.95 | 3.88 | 3.97 | −0.09 |
| (D) Student Cooperation | 6 | 0.96 | 0.96 | 4.13 | 4.21 | −0.08 |
| (E) Differentiation | 6 | 0.93 | 0.94 | 4.02 | 4.09 | −0.07 |
| (F) Equity | 6 | 0.96 | 0.96 | 4.27 | 4.30 | −0.03 |
| (G) Creativity | 6 | 0.92 | 0.94 | 4.15 | 4.22 | −0.07 |
| (H) VARTeL | 6 | 0.93 | 0.95 | 4.12 | 4.22 | −0.10 |
Table 9.
Important points from the interview sessions.
| No | Descriptions |
|---|---|
| 1 | General consensus about VR activities was positive and students believed that VR will be useful in future engineering education. |
| 2 | Students would like to see classes in the future being taught solely through a VARTeL environment, focusing on independent learning with no outside help. |
| 3 | Although feedback was good, students noted that the VR controls were still wonky and simulation in the VR environment are still not up to standard when compared to the real world. |
| 4 | Some students believed that the VARTeL environment will never be able to replicate the experiences in the real world. However, these students also noted that VR is a good alternative when there are no other solutions. |
| 5 | Virtual Vector was uninspiring (theory-based subjects in general) and more suited for a pen and paper. |
| 6 | Students would like to see the activities be more focused on hands-on engineering concepts rather than STEM or theoretical-based concepts. Some examples given were ‘Drone operations’ and ‘3D modeling similar to CAD’. |
| 7 | Students felt that interaction was severely lacking during the VR activities and hoped to experience communicating in the VR environment itself rather than just communicating during discussions. |
| 8 | Other than VR activities being more engineering-focused, students would like to see some added complexity, where students would need to solve a problem, rather than the program being linear. |
Disclaimer/Publisher’s Note: The statements, opinions and data contained in all publications are solely those of the individual author(s) and contributor(s) and not of MDPI and/or the editor(s). MDPI and/or the editor(s) disclaim responsibility for any injury to people or property resulting from any ideas, methods, instructions or products referred to in the content. |
© 2024 by the authors. Licensee MDPI, Basel, Switzerland. This article is an open access article distributed under the terms and conditions of the Creative Commons Attribution (CC BY) license (https://creativecommons.org/licenses/by/4.0/).
Share and Cite
MDPI and ACS Style
Wong, J.Y.; Azam, A.B.; Cao, Q.; Huang, L.; Xie, Y.; Winkler, I.; Cai, Y. Evaluations of Virtual and Augmented Reality Technology-Enhanced Learning for Higher Education. Electronics 2024, 13, 1549. https://doi.org/10.3390/electronics13081549
AMA Style
Wong JY, Azam AB, Cao Q, Huang L, Xie Y, Winkler I, Cai Y. Evaluations of Virtual and Augmented Reality Technology-Enhanced Learning for Higher Education. Electronics. 2024; 13(8):1549. https://doi.org/10.3390/electronics13081549
Chicago/Turabian StyleWong, Jia Yi, Abu Bakr Azam, Qi Cao, Lihui Huang, Yuan Xie, Ingrid Winkler, and Yiyu Cai. 2024. "Evaluations of Virtual and Augmented Reality Technology-Enhanced Learning for Higher Education" Electronics 13, no. 8: 1549. https://doi.org/10.3390/electronics13081549
Note that from the first issue of 2016, this journal uses article numbers instead of page numbers. See further details here.