
Short-Term Forecasting of Wind Power Based on Error Traceability and Numerical Weather Prediction Wind Speed Correction
1
Key Laboratory of Modern Power System Simulation and Control & Renewable Energy Technology, Ministry of Education (Northeast Electric Power University), Jilin 132012, China
2
State Key Laboratory of Operation and Control of Renewable Energy & Storage Systems, China Electric Power Research Institute, Beijing 100912, China
3
State Grid Gansu Electric Power Company Limited, Lanzhou 730030, China
*
Author to whom correspondence should be addressed.
Electronics 2024, 13(8), 1559; https://doi.org/10.3390/electronics13081559
Submission received: 1 March 2024
/
Revised: 1 April 2024
/
Accepted: 17 April 2024
/
Published: 19 April 2024
Abstract
:Numerical weather prediction (NWP) is crucial in the current short-term wind power forecasting (STWPF) based on data, but it is difficult for STWPF to achieve high accuracy due to the limited accuracy of NWP, which poses a serious challenge to the formulation of forward generation plans. In response to the above issues, this article conducts a traceability analysis of the error of STWPF and proposes a wind power prediction method based on NWP wind speed trend correction. Firstly, the causes of existing errors are analyzed to quantify the impact of NWP on prediction accuracy. Secondly, considering the process correlation between measured and predicted wind speeds, improved complete ensemble EMD with adaptive noise (ICEEMDAN) is used to decompose historical measured wind speeds and NWP wind speeds to construct the most relevant low-frequency trend components. Thirdly, a weighted dual constraint mechanism is proposed to select the most similar historical NWP trend segments to correct NWP wind speed. Finally, the corrected wind speed is used for power prediction and completing STWPF. Through the application of this method to a wind farm in Inner Mongolia Autonomous Region, China, which effectively improves the accuracy of NWP and reduces the average RMSE by 1.39% for power prediction, the effectiveness of this method is verified.
1. Introduction
In recent years, issues such as energy security, climate change, and environmental pollution have increasingly become constraints on the green and sustainable development of the economy and society. Countries around the world have taken the development of renewable energy represented by wind and photovoltaic power as a key way to achieve green and low-carbon development [1].
Wind energy is a very important source of clean energy today. The International Energy Agency (IEA) reported that wind power generation increased by a record 265 TWh (an increase of 14%) in 2022, exceeding 2100 TWh. To achieve the vision of zero emissions by 2050 in China, it is necessary to increase the annual new capacity from approximately 75 GW in 2022 to 350 GW by 2030 [2]. However, due to the randomness, volatility, and intermittency of wind energy, the current wind power generation has high uncertainty [3,4]. The disadvantage of wind energy poses serious challenges to attempts to integrate large-scale wind energy into modern power systems [5]. Accurate wind power prediction is one of the foundations for ensuring the stable operation of the power system and promoting wind energy consumption [6,7]. STWPF (1–3 days) [8] is an essential means for optimizing daily power generation plans, as well as adjusting maintenance plans. Due to the limited prediction accuracy of NWP, it is difficult to achieve high-precision power prediction.
Traditional wind power prediction focuses on improving prediction accuracy, which usually adopts prediction methods such as clustering scenario partitioning [9], model optimization [10], sequence decomposition [11], and feature construction [12] to achieve refined modeling and improve prediction accuracy. The above strategies can significantly improve the accuracy of wind power prediction, but there is relatively little research on the analysis of the sources of wind power prediction errors and the proportion of factors that cause wind power prediction errors. References [13,14] conducted statistical analysis on the distribution of wind power prediction errors, and reference [15] compared the prediction error characteristics of different models for selecting the optimal model. Reference [16] analyzed the spatiotemporal correlation of wind power prediction errors and found that there is a significant relationship between errors and key meteorological elements, that is, wind speed and wind direction. However, reference [17] suggests that power prediction errors are significantly correlated with wind speed and temperature, but weakly correlated with air pressure and humidity. Reference [18] analyzed the error relationship between a single station and a wind farm cluster and concluded that the prediction error of the cluster is significantly lower than that of a single station. The above error analysis usually focuses on the error statistics of prediction results and can only quantitatively analyze the size of errors and error related factors. It is difficult to fully explore the sources of errors and the proportion of error factors, which is of little significance for developing effective error correction and accuracy improvement strategies. Currently, in STWPF, NWP is used as the main input in a data-driven mode to map power for the next 1–3 days [19,20,21]. However, the accuracy of NWP wind speed to some extent restricts the improvement of power prediction accuracy. Therefore, a lot of research has been conducted on the correction technology of NWP, and the existing correction of NWP mainly focuses on the correction of wind speed. In terms of calibration time scale, it mainly focuses on the ultra-short term, usually considering the ultra-short-term prediction correction of wind speed or intelligent calibration based on scene partitioning [22,23]. For example, reference [22] proposed an NWP wind speed calibration method that can be used for STWPF, considering the temporal characteristics of measured wind speed and the mapping relationship with NWP wind speed, and establishing a wind speed sequence transfer calibration framework. On this basis, wind speed correction models were formed based on multiple algorithms such as linear regression, support vector machine, and random forest. Within a 4 h time scale, the root-mean-square error of the two wind farms could be reduced by 5.4% or 7%. In the above wind speed correction, most of the models are based on time series prediction methods and usually consider wind speed time series extrapolation. Short-term wind speed correction usually establishes a mapping relationship between NWP wind speed and measured wind speed, which is difficult to adapt to different weather processes and does not have generalization. Table 1 lists the commonly used NWP wind speed correction methods and their corresponding correction time scales. In the ultra-short term, most of them consider the error transmission of time series and the trend relationship of wind speed changes. In the short term, wind speed correction is almost always based on the calibration model of artificial intelligence for measured and predicted wind speeds, and there is little consideration for the process correlation effect of wind speed to establish an effective similarity matching mechanism.
In summary, the current wind power prediction usually considers scenario partitioning, model optimization, sequence decomposition, and feature construction, without fully exploring the sources of wind power prediction errors and the proportion of error causes, which is not conducive to establishing targeted correction methods to improve the accuracy of wind power prediction. NWP wind speed is a key meteorological factor that affects the accuracy of wind power prediction. The current correction strategy is mainly based on the temporal transmission characteristics of wind speed or prediction errors to establish a time series correction model. The time scale is usually concentrated in the ultra-short term, and for short-term wind speed correction, a simple mapping between measured wind speed and predicted wind speed is usually established, which is difficult to adapt to complex weather processes. This article first analyzed the sources and causes of wind power prediction errors, identified the proportion of errors caused by different prediction methods and NWP, and proposed an STWPF method based on NWP wind speed trend correction. Firstly, the factors that caused wind power prediction errors were analyzed and the proportion of error causes was determined. Secondly, a short-term correction mechanism for NWP based on wind speed process correlation was proposed, which extracts the trend series of NWP predicted wind speed and measured wind speed. Similar trend segments of NWP were found through historical matching, and the high-frequency components of measured wind speed corresponding to historical NWP segments were superimposed onto the low-frequency trend components to achieve the correction of NWP segments. Finally, the effectiveness of the proposed method was verified by applying it to a wind farm in Inner Mongolia Autonomous Region, China. The main innovation points of this article are as follows:
(1) Based on the prediction errors of measured wind speed and NWP wind speed, a quantitative analysis is conducted on the causes of the errors, in order to provide the degree of constraint of NWP accuracy on power prediction accuracy.
(2) Considering the correlation effect between NWP wind speed and measured wind speed process, ICEEMDAN is used to extract the most relevant trend components of the wind speed sequence and construct the trend sequence.
(3) An effective weighted dual constraint mechanism is proposed for selecting the most relevant historical NWP trend segments to correct NWP predicted wind speed, without the need for establishing complex mapping models. Compared with traditional correction methods, it can adapt to different weather scenarios and be applied to STWPF, effectively improving the prediction accuracy of STWPF.
2. Error Cause Analysis
NWP is a method of describing and predicting atmospheric motion using mathematical models. It involves solving a set of nonlinear partial differential equations involving fluid dynamics, thermodynamics, continuity, and water vapor equations [35]. NWP uses finite element difference method to divide the Earth’s atmosphere into three-dimensional grids and solves equations at each grid point to predict weather conditions. However, NWP is not a perfect method for describing atmospheric systems. The weather system itself is an unstable dynamic system with limited predictability. The model itself also has incompleteness, requiring the approximation and parameterization of physical processes within the grid. In addition, there are spatiotemporal truncation errors in the numerical solution process, which are prediction time errors caused by discrete grids and rapid atmospheric motion, as well as small-scale processes that cannot be captured. Therefore, when predicting wind power, the limited accuracy of NWP makes it difficult to provide effective trend mapping for the prediction model.
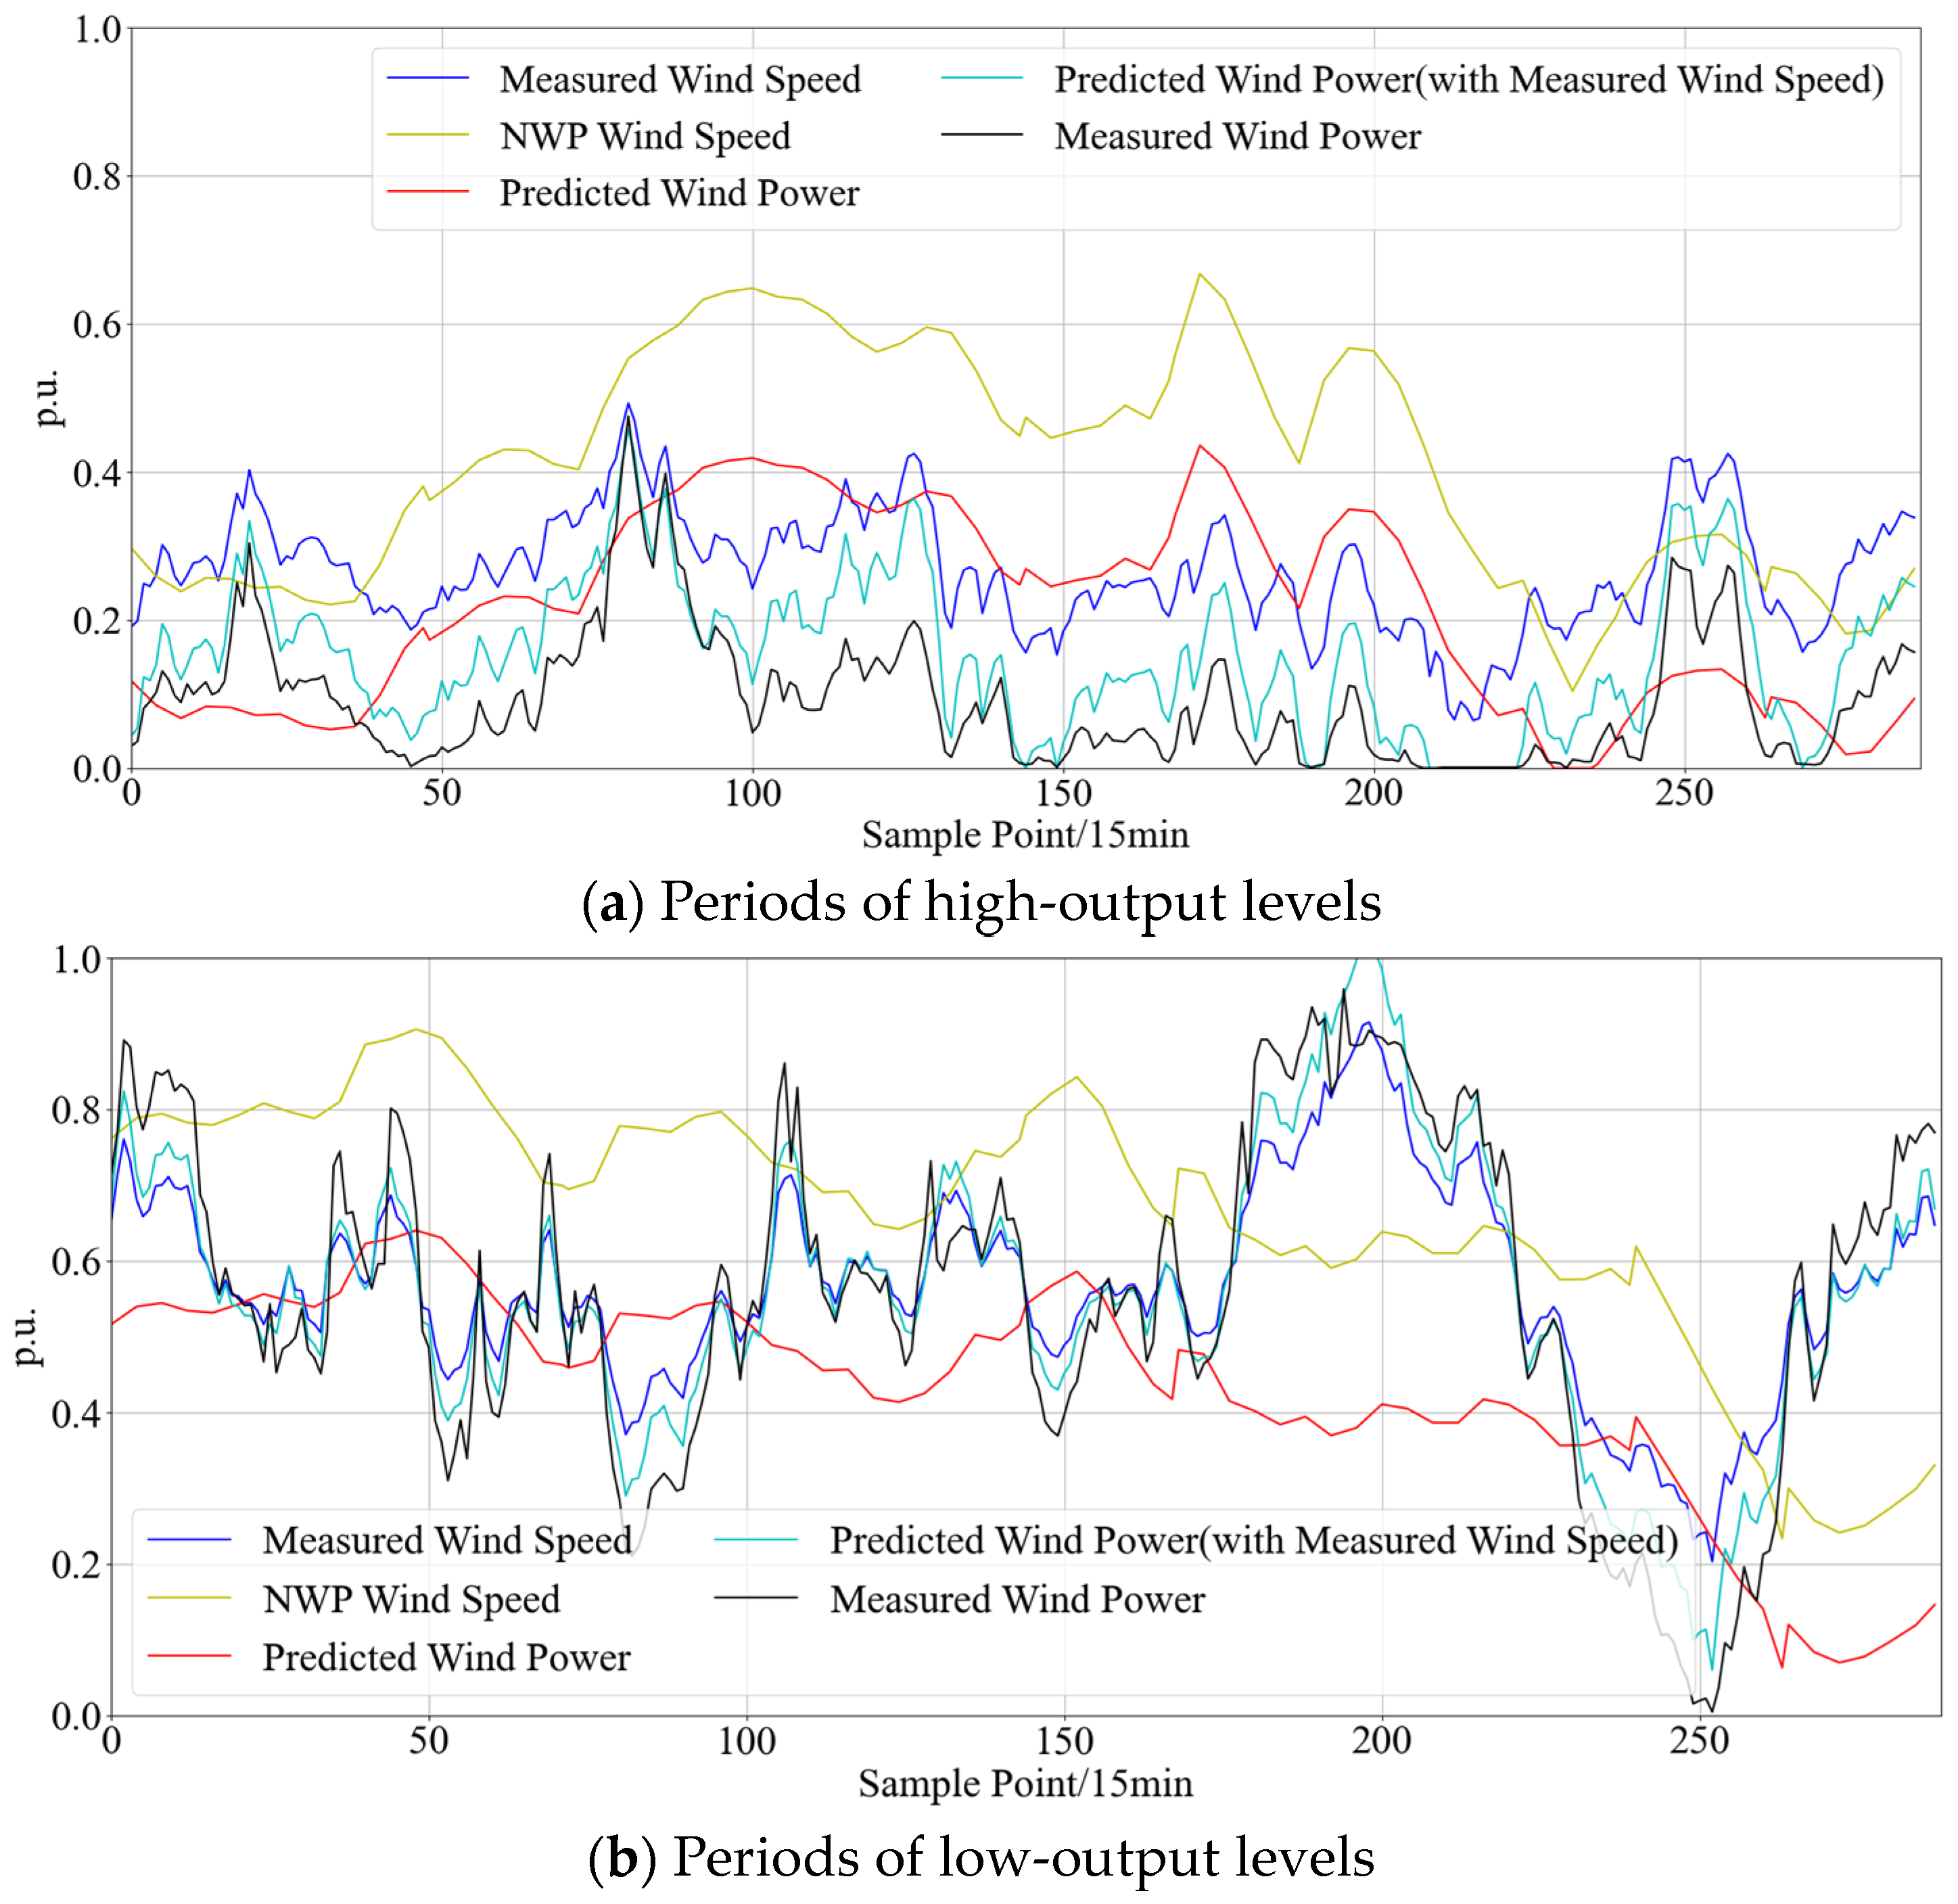
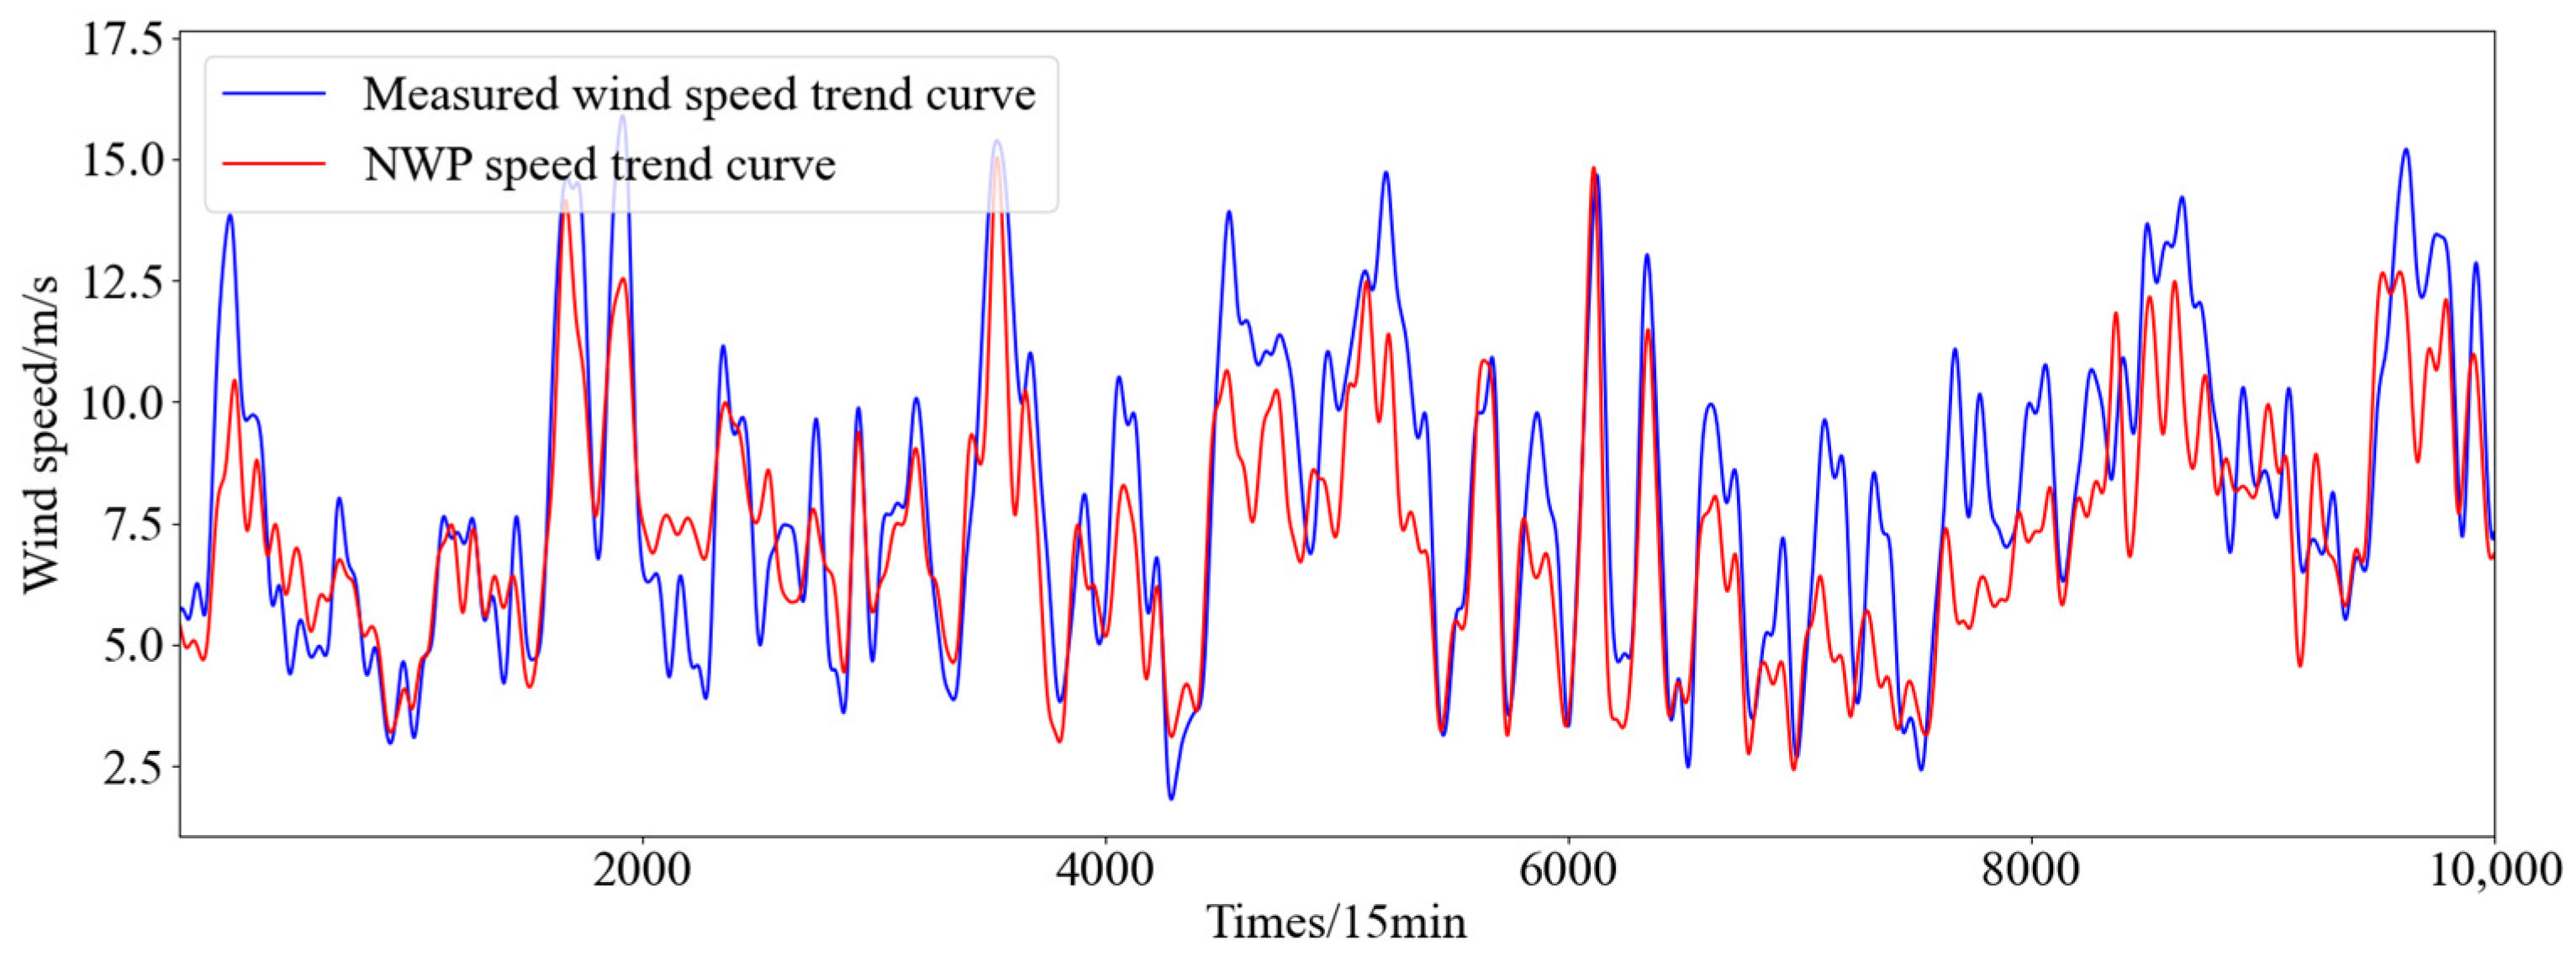
Figure 1 shows a schematic diagram of the measured wind speed and NWP wind speed of a wind farm in Inner Mongolia Autonomous Region, China. It shows that NWP has certain differences in numerical and phase terms compared to the measured wind speed, making it difficult to track the trend of actual wind speed during peak periods in numerical terms, and there is a certain delay in phase terms compared to the measured wind speed. The time-varying nature of NWP wind speed time lag results in changes in the effective information window of NWP wind speed when achieving wind power prediction tasks at different times. On the one hand, previous time selection methods can only explain the time lag of the system, so they cannot consider the time-varying nature. On the other hand, traditional WPF models with fixed parameters are only suitable for features within a fixed information window and cannot track effective NWP wind speed information. Figure 2 shows the prediction curve using NWP and actual wind speed. It is difficult for the prediction curve using NWP wind speed to reach the numerical value of actual wind speed, and its fluctuation trend is difficult to reach the fluctuation level of actual wind speed. In order to reduce the data magnitude difference between wind power and wind speed, this paper normalizes the original series, in which wind speed and wind power are normalized according to the maximum value and rated installed capacity, respectively. Therefore, its information loss is significant, which makes it difficult to obtain an effective mapping relationship. When we use NWP wind speed for prediction, the prediction curve is close to the trend of NWP wind speed change due to the mapping relationship of the established model, but it is difficult to track the actual power curve change trend, which will cause dual problems of ensuring power supply and consumption in the operation of the power system. The trend of the predicted power curve in both the high output level scenario represented by Figure 2a and the low output level scenario in Figure 2b is identical to the NWP trend, which loses the fluctuation information and makes it difficult to track the actual power trend, resulting in a low prediction accuracy.
In Table 2, this article lists the NWP predicted wind speed RMSE of 10 wind farms in Inner Mongolia Autonomous Region, China. The historical power data from 2020, measured wind speed, and NWP wind speed data were used to predict the RMSE of power using NWP or measured wind speed, as well as the proportion of RMSE caused by NWP wind speed in power prediction. The first 11 months were used as the training set, and the final month was used as the testing set. The RMSE formula for NWP wind speed prediction and power prediction is as follows:
where yi is the measured wind speed value, yi′ is the NWP wind speed value, max(y) is the maximum wind speed of the corresponding wind farm, and n is the number of samples in the corresponding prediction period.
where Pi is the measured value, Pi′ is the predicted value, caps is the installed capacity of the corresponding wind farm, and n is the number of samples in the corresponding prediction period.
The calculation method for the proportion is shown in (3), where is the RMSE that uses the NWP wind speed as input, and is the RMSE caused by using the measured wind speed. Table 2 shows that NWP is the main cause of accuracy reduction in the cause of errors, although there are also factors such as prediction models and historical data quality. The proportion of RMSE caused by using NWP in power prediction is higher than 40%. This also indicates that the prediction accuracy of NWP is the main factor causing low prediction accuracy in short-term wind power prediction with NWP as the main input in a data-driven model. Therefore, this article proposes a correction method for NWP wind speed to effectively improve the accuracy of NWP and thereby enhance the accuracy of power prediction, in response to the impact of inherent errors in NWP on power prediction.
3. Short-Term Wind Power Prediction Method Based on NWP Trend Correction
The main framework of this article is shown in Figure 3. Wind speed, as a key meteorological element in NWP, largely determines the upper limit of power prediction accuracy. Traditional short-term wind speed correction usually establishes a fuzzy mapping between NWP wind speed and measured wind speed, which is difficult to adapt to complex weather processes and has many incorrect corrections. This article proposes a method for selecting similar segments based on the correlation between measured and predicted wind speed trends. The wind speed trend requires extracting high-frequency and low-frequency components based on modal decomposition. The high-frequency components represent the fluctuation characteristics of the original sequence, while the low-frequency components represent the main development trend of the sequence. The short-term NWP prediction of wind speed has higher accuracy compared to the long-term period, and the main trend of predicted wind speed is relatively close to the actual wind speed trend. Historical matching based on similar fragments can select NWP wind speed processes that are similar to historical situations. The high-frequency components of the measured wind speed corresponding to the NWP segment are superimposed onto the NWP segment to achieve an effective correction of NWP wind speed. The correction process is as follows:
(1) ICEMDAN modal decomposition is performed on historical NWP and measured wind speed, the number of modes corresponding to the most relevant low-frequency components is calculated, and the optimal low-frequency modes are stacked to obtain the trend components of NWP wind speed and measured wind speed. Trend components are extracted on a daily basis to obtain fragments of NWP and measured wind speed trend components.
(2) During the prediction period, the most similar historical NWP trend segment is selected based on weighted constraints, and the mean value of the high-frequency component of the measured wind speed segment corresponding to the NWP trend segment in the corresponding period is overlaid with the NWP trend segment to obtain the NWP wind speed correction result.
(3) The NWP wind speed correction results are input into the prediction model to complete the short-term wind power prediction.
4. Wind Speed Trend Extraction Based on ICEEMDAN
There are relatively many modal decomposition methods, and VMD decomposition requires the effective adjustment of penalty factors and the optimal number of modes to achieve the optimal decomposition process. EMD, CEEMD, CEEMDAN, and other methods are prone to modal aliasing during the decomposition process, and effective information is not fully extracted. Therefore, this article adopts the ICEEMDAN [36] decomposition method for the effective decomposition of NWP wind speed and measured wind speed to extract trend components. ICEEMDAN improves its residual noise and pseudo mode problems on the basis of CEEMDAN, resulting in less sequence noise and pseudo mode after decomposition, which ensures that the total amount of information between the original sequence and the decomposed sequence is closer, and the extracted trend components are closer to the true values. The improved method is different from CEEMDAN, which directly adds Gaussian white noise during the decomposition process. Instead, the kth IMF component of white noise decomposed by EMD is selected. Based on the decomposition of ICEEMDAN, the trend components of the original wind speed series can be obtained by stacking the low-frequency components to achieve the matching and stacking process between the measured wind speed components and the predicted wind speed components.
4.1. Similar NWP Fragment Selection Mechanism Based on Double Constraints
Although there are some false positives and omissions in the short-term NWP wind speed series, the overall trend is relatively close. In Figure 4, the predicted wind speed and measured wind speed sequences of typical wind farms are, respectively, displayed. From a trend perspective, the NWP wind speed is relatively close to the measured wind speed, especially in high wind speed scenarios. This ensures the similarity between the NWP wind speed and the actual wind speed sequence, and this article proposes a similar NWP fragment selection mechanism based on dual constraints, which consider the trend correlation of the sequence and the level of sequence size. The selection principles are as follows:
(1) Firstly, the correlation coefficient between the NWP wind speed trend segments to be predicted and the historical NWP trend segments in the future period is calculated based on the maximum correlation principle, in order to select the historical NWP wind speed trend segments with a correlation coefficient greater than 0.8 as the initial sample set.
(2) Due to the fact that correlation could just measure trend consistency, it is difficult to measure the magnitude of wind speed trends. Only sequences with similar wind speeds can ensure the overall similarity between the matched historical NWP segments and the predicted segments. On this basis, the error level between the NWP wind speed trend segments of the predicted period and the segments in the selected sample set is calculated to determine which sequence in the initial sample is closer to the sequence to be matched.
To simplify the dual constraint process, this article integrates the above two constraints together to form a weighted constraint to quickly select similar NWP fragments. The formula for calculating the dual weighted constraint is as follows:
where represents the double weighted constraint, and represent the weight coefficients of the correlation coefficient constraint and the error constraint, respectively, and its sum is 1. represents the correction operator for the correlation coefficient, which can be represented as , where represents the Pearson correlation coefficient, and represents the error between NWP trend sequences. The smaller the error, the higher the sequence similarity. Therefore, a smaller indicates that the matched historical NWP segments are closer to the NWP trend segments of the predicted time period.
In order to measure the average level of error, this article selects the normalized average absolute error as the calculation method for E, and its expression is as follows:
where represents the number of sequence points, represents the ith point in the future NWP wind speed trend sequence, represents the ith point in the historical NWP wind speed trend sequence, and represents the rated maximum wind speed.
Based on the above dual weighted constraints, a certain number of historical similar NWP wind speed trend segments are selected as the sample set for the NWP segments to be corrected in the future period.
4.2. Trend Compensation-Based NWP Fragment Correction Method
Due to the NWP trend sequence being relatively close to the measured wind speed trend, when matching historical similar segments, the NWP prediction error in similar scenarios may be close. At this point, it is not possible to directly select the real sequence containing high-frequency components corresponding to similar NWP fragments as the correction result, as there may be significant errors. Therefore, this article selects two NWP correction strategies, as follows:
(1) The average of the measured wind speed segments corresponding to the matched similar sample set is used as the correction result for the future NWP segments to be corrected. The calibration process can be expressed as:
where represents the corrected NWP segment, represents the number of similar segments used for correction, and represents the measured wind speed segment corresponding to the ith similar NWP segment. can be represented as:
where is a matrix with n rows and m columns, where n represents the number of similar segments, m represents the length of similar segment sequences, and represents the measured wind speed at the mth point of the nth similar segment.
(2) The average of the high-frequency components of the measured wind speed segments corresponding to the matched similar sample set is used as the correction result for the future NWP segments to be corrected. The calibration process can be expressed as:
where represents the high-frequency component of the measured wind speed segment corresponding to the ith similar NWP segment.
The above two correction methods both use NWP segments as the matching criteria, and then use measured wind speed segments as the correction basis to establish a search and correction mechanism for NWP similar wind speed trend segments considering dual constraints.
5. Case Study
We selected the NWP forecasted wind speed for a wind farm in Inner Mongolia Autonomous Region, China, from 00:00 on 1 January 2020 to 23:45 on 31 December 2021, and analyzed the measured wind speed data and historical measured power data at the height of the wind turbine hub to verify the effectiveness of the wind speed correction method proposed in this article. The NWP wind speed, historical power, and measured wind speed data have a resolution of 15 min, and the rated installed capacity of the wind farm is 130.5 MW. The first eight months of data were used for modeling and the last four months of data were used for testing. The location of the wind farms is shown in Figure 5 below. To measure the effectiveness of NWP wind speed calibration and wind power prediction, on the basis of the RMSE mentioned above, this article selects the normalized mean absolute error (MAE) to evaluate the size of the error. The calculation formula is as follows:
where represents the number of sample points in the sequence, represents the ith actual value, represents the ith predicted value, represents the average of the actual values in the sequence, and Cap represents the rated installed capacity of the wind farm. The smaller the error indicator, the better the prediction result.
5.1. NWP Wind Speed Correction
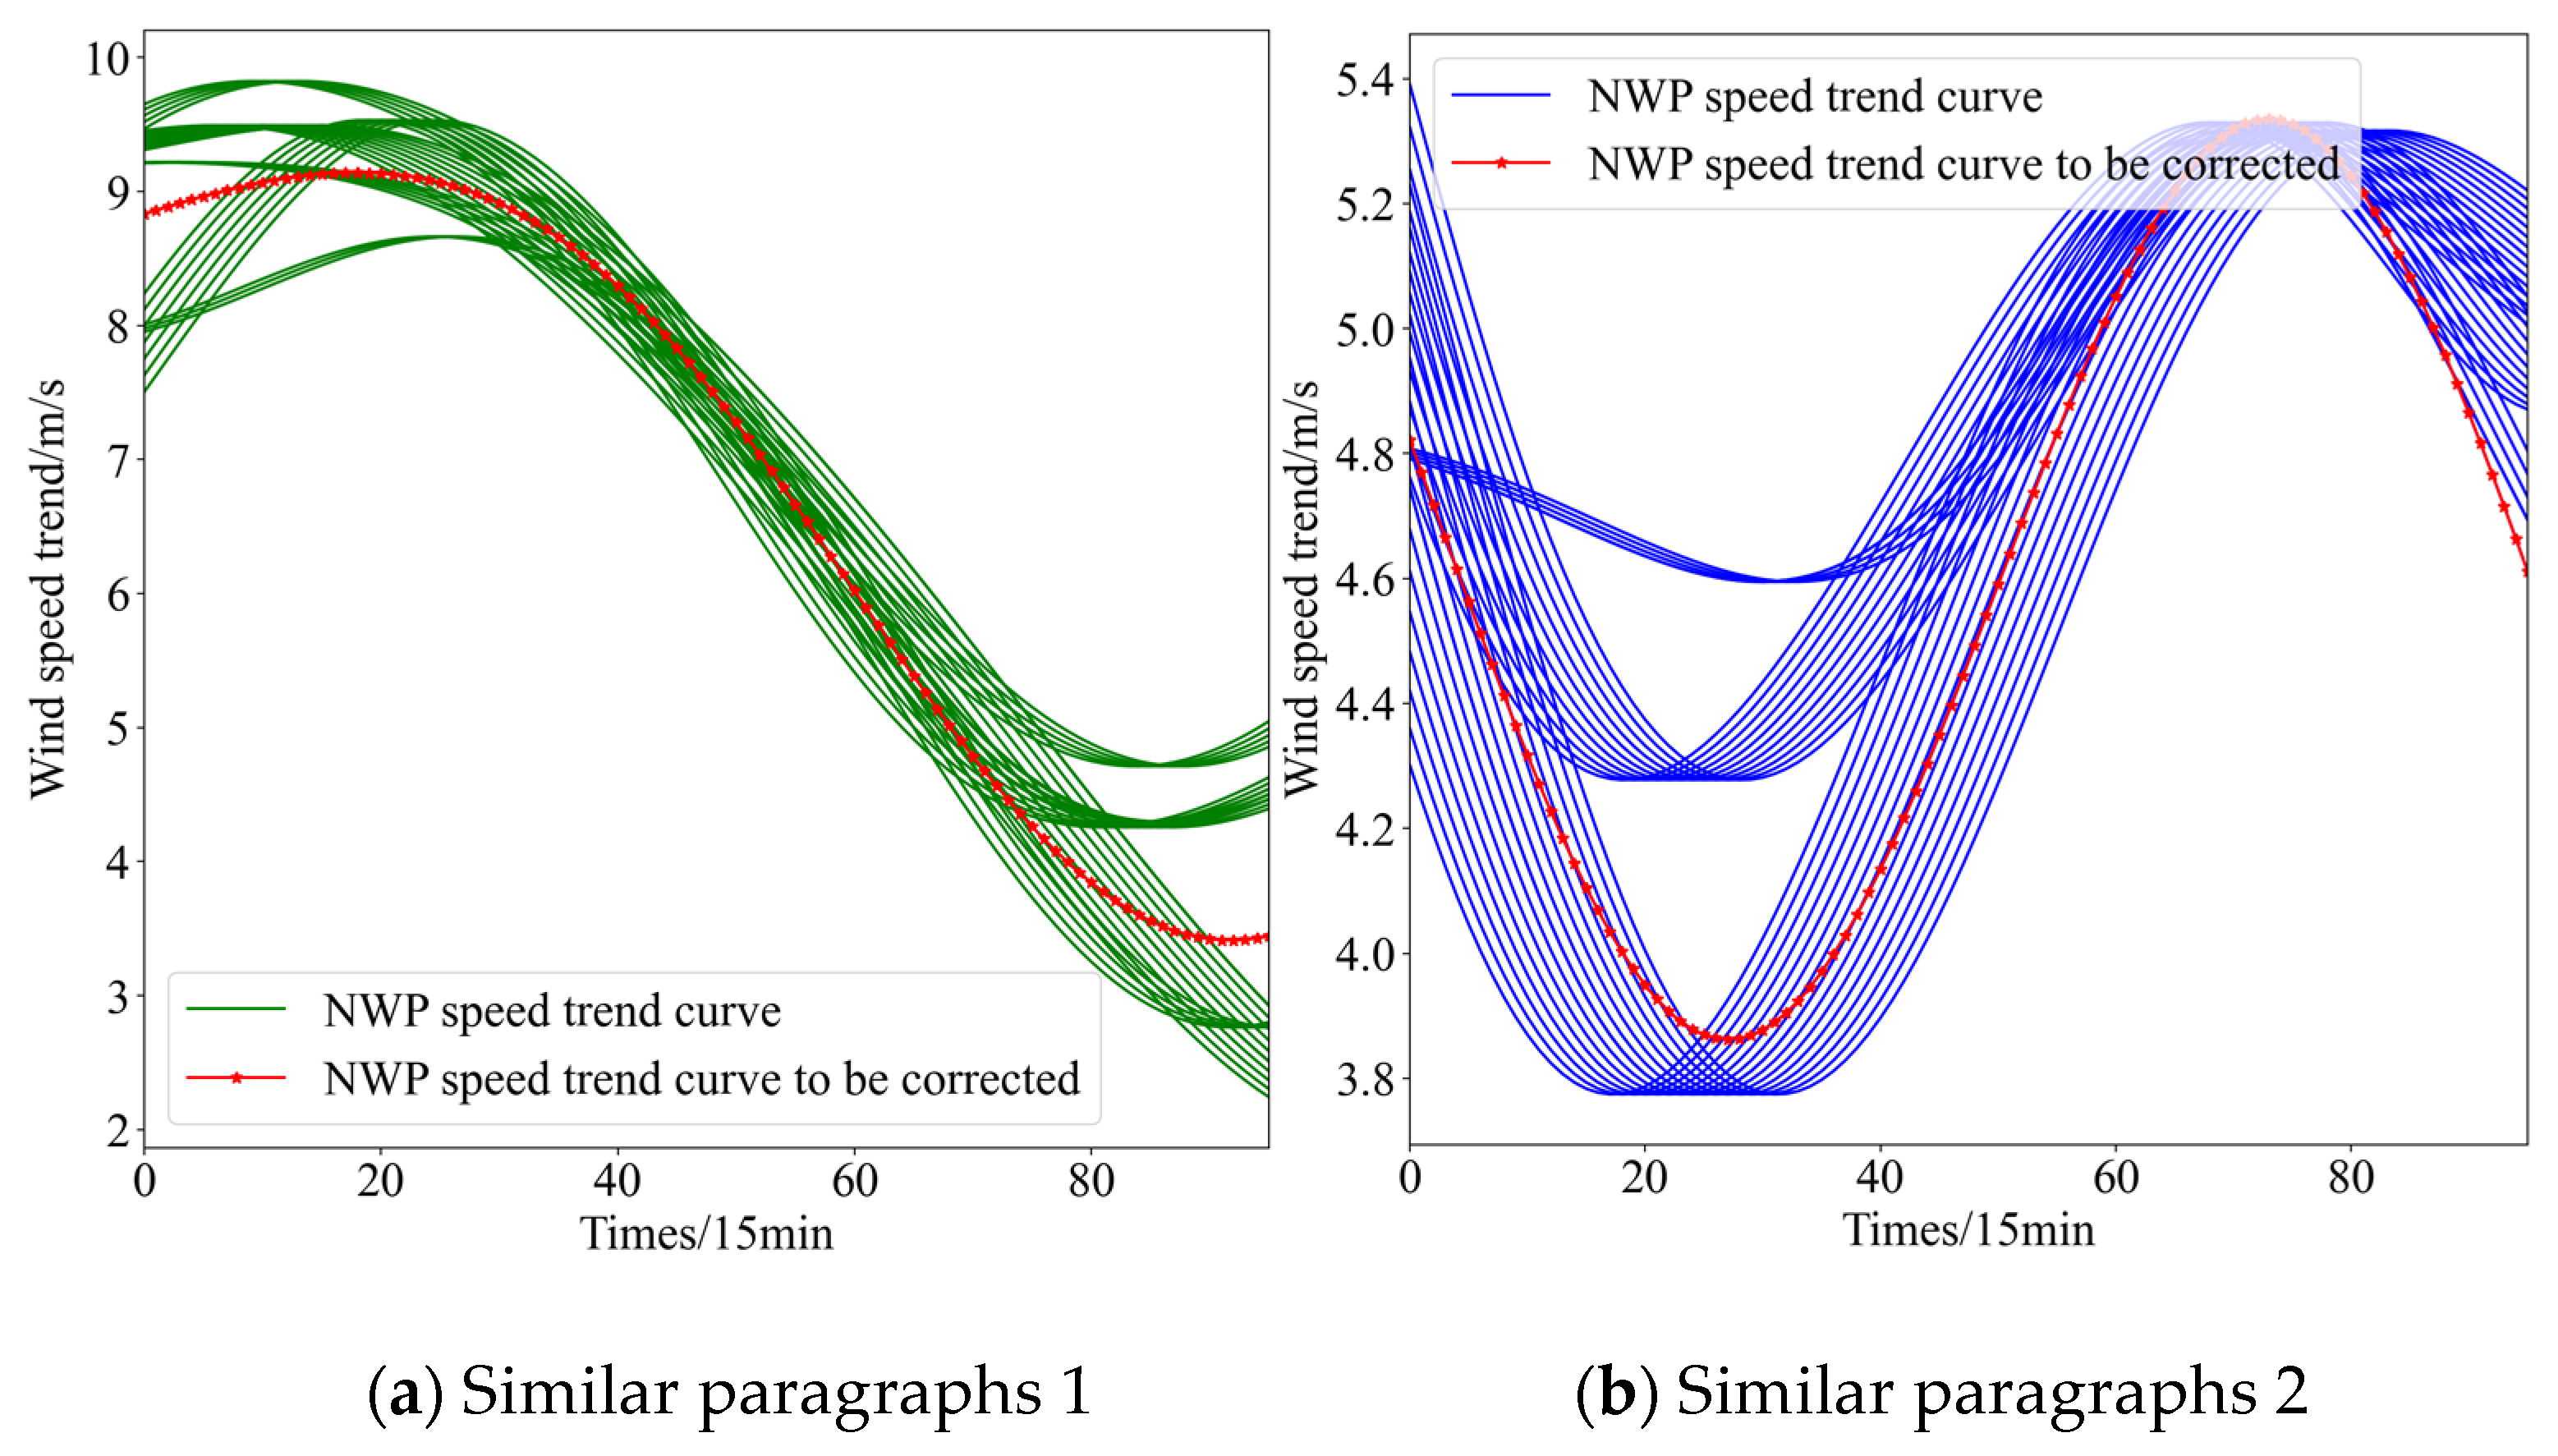
This article uses ICEEMDAN to decompose historical NWP wind speeds and measured wind speeds and extract corresponding effective trend components from them. In Figure 6, the decomposition results of the measured wind speed and NWP wind speed in the wind farm are displayed. Both wind speed sequences are decomposed into 14 components, those with higher fluctuations being referred to as high-frequency components and those with lower fluctuations being referred to as low-frequency components. Usually, the low-frequency components of a sequence represent their trend direction. This article uses indicators such as RMSE, MAE, and correlation coefficient to measure the similarity between the measured and forecasted wind speeds and selects the low-frequency components that best reflect wind speed trends and their correlation to construct trend sequences. In Figure 7, the trend of three indicators between the actual wind speed and NWP wind speed of the wind farm with the number of superimposed low-frequency components is shown. The results indicate that the minimum number of low-frequency components corresponds to the maximum correlation and minimum error. However, the number of low-frequency components is too small, which cannot contain enough effective trend information and cannot accurately find effective similar segments from historical data. Starting from the 8th low-frequency component, the increase in error decreases and the trend of correlation coefficient reduction decreases, indicating that the information tends to be saturated. Therefore, the first eight low-frequency components are selected to construct a trend sequence. In Figure 8, the trend sequence reconstruction results based on the selected number of low-frequency components are displayed, and it can be found that the changes in the measured wind speed trend sequence and NWP wind speed trend sequence are relatively close, with strong correlation.
The selection of decomposition methods is crucial for the reconstruction of trend sequences. In order to verify the effectiveness of the decomposition method used in this article, the CEEMDAN, VMD, and DWT decomposition methods are selected for comparison. The correlation and degree of error between NWP wind speed and measured wind speed trend sequences constructed using different decomposition methods are compared. The Pearson correlation coefficient is used to measure the degree of correlation between sequences, while RMSE and MAE measure errors. The results are shown in Table 3. ICEEMDAN extracts the NWP wind speed trend sequence with the highest degree of correlation and the lowest error compared to the measured wind speed trend sequence. Because the modal components obtained using ICEEMDAN have weaker modal aliasing, the constructed trend sequence contains sufficient information while reducing noise. Compared with the other three decomposition methods, the RMSE of the NWP trend series and the measured wind speed trend series in this article is reduced by 0.24, 0.28, and 1.52, respectively. MAE decreased by 0.18, 0.2, 1.19, and R increased by 6%, 7%, and 21%, respectively. The NWP obtained through ICEEMDAN decomposition is closer to the measured wind speed trend series.
5.2. NWP Similar Fragment Error Correction Based on Dual Constraints
On the basis of extracting wind speed trend sequences, NWP wind speed trend segments with similar historical periods are selected based on double weighted constraints in the future period, and the high-frequency components of measured wind speed corresponding to similar NWP trend segments are superimposed onto the NWP wind speed trend segments to be corrected for NWP wind speed correction. Before correcting NWP wind speed segments, it is necessary to match historical similar NWP segments to obtain prediction errors for similar wind speed scenarios. By calculating the dual constraint weighted indicators of the NWP segments to be corrected and the historical NWP segments, the L-value curves of certain segments to be corrected in the wind farm are obtained. As shown in Figure 9, the calculation results of the dual constraint weighted index corresponding to each representative NWP segment in the historical NWP samples are mainly concentrated between 0 and 5. When selecting similar NWP historical segments, matching samples with L-values below 0.5 are used as strong correlation sample sets for correction. To highlight the effectiveness of the proposed method, this article introduces a step-by-step matching (that is, first considering correlation and then further considering sequence size) and clustering method to select historically similar samples, and introduces indicators such as correlation, average absolute error, dual constraint weighting, and model matching time to measure the matching advantages of various methods. As shown in Table 4, from the perspective of correlation coefficients, almost all model-matched samples have a cumulative correlation coefficient of over 0.99 with the fragments to be corrected. Although the weighted evaluation method proposed in this article produces slightly lower sample correlation coefficients, the average absolute error is smaller, and the L-value and time consumption are also lower. Among them, the average MAE of the samples matched by the wind farm using the matching mechanism proposed in this article is 3.503 and 0.542 lower than that of the clustering and step-by-step matching methods, the average L value is 1.400 and 0.216 lower, and the average time consumption is 1.091 and 0.970 s lower. The dual constraint weighted matching mechanism proposed in this article has a lower similar sample error, higher matching degree, and shorter matching time compared to other matching methods, demonstrating good adaptability. Based on the matching method proposed in this article, representative modified NWP segments of each wind farm were selected. Based on the matching results of similar segments using the proposed method, as shown in Figure 10, the similar historical segments obtained from the representative modified samples are relatively similar in trend and size to the trend sequence of the samples to be corrected.
Based on the above NWP historical segment matching results, the high-frequency component corresponding to the measured wind speed segment is selected as the compensation amount for correcting the NWP segment. To avoid the impact of accidental results on the correction, this article selects the mean of the high-frequency components of multiple similar segments corresponding to the measured wind speed segments as the error compensation for correcting NWP. Figure 11 shows the relationship between the high-frequency components of the measured wind speed segments corresponding to multiple similar NWP wind speeds in a wind farm and the actual errors of the corresponding NWP segments to be corrected. There is a certain difference in a single high-frequency component used for compensation compared to the actual NWP prediction error. The compensation amount for certain individual segments is very close to the true error, but it is difficult to effectively find these segments. However, the mean of these high-frequency component segments is closer to the true NWP prediction error compared to a single segment. Therefore, using multiple segments for error correction is reasonable.
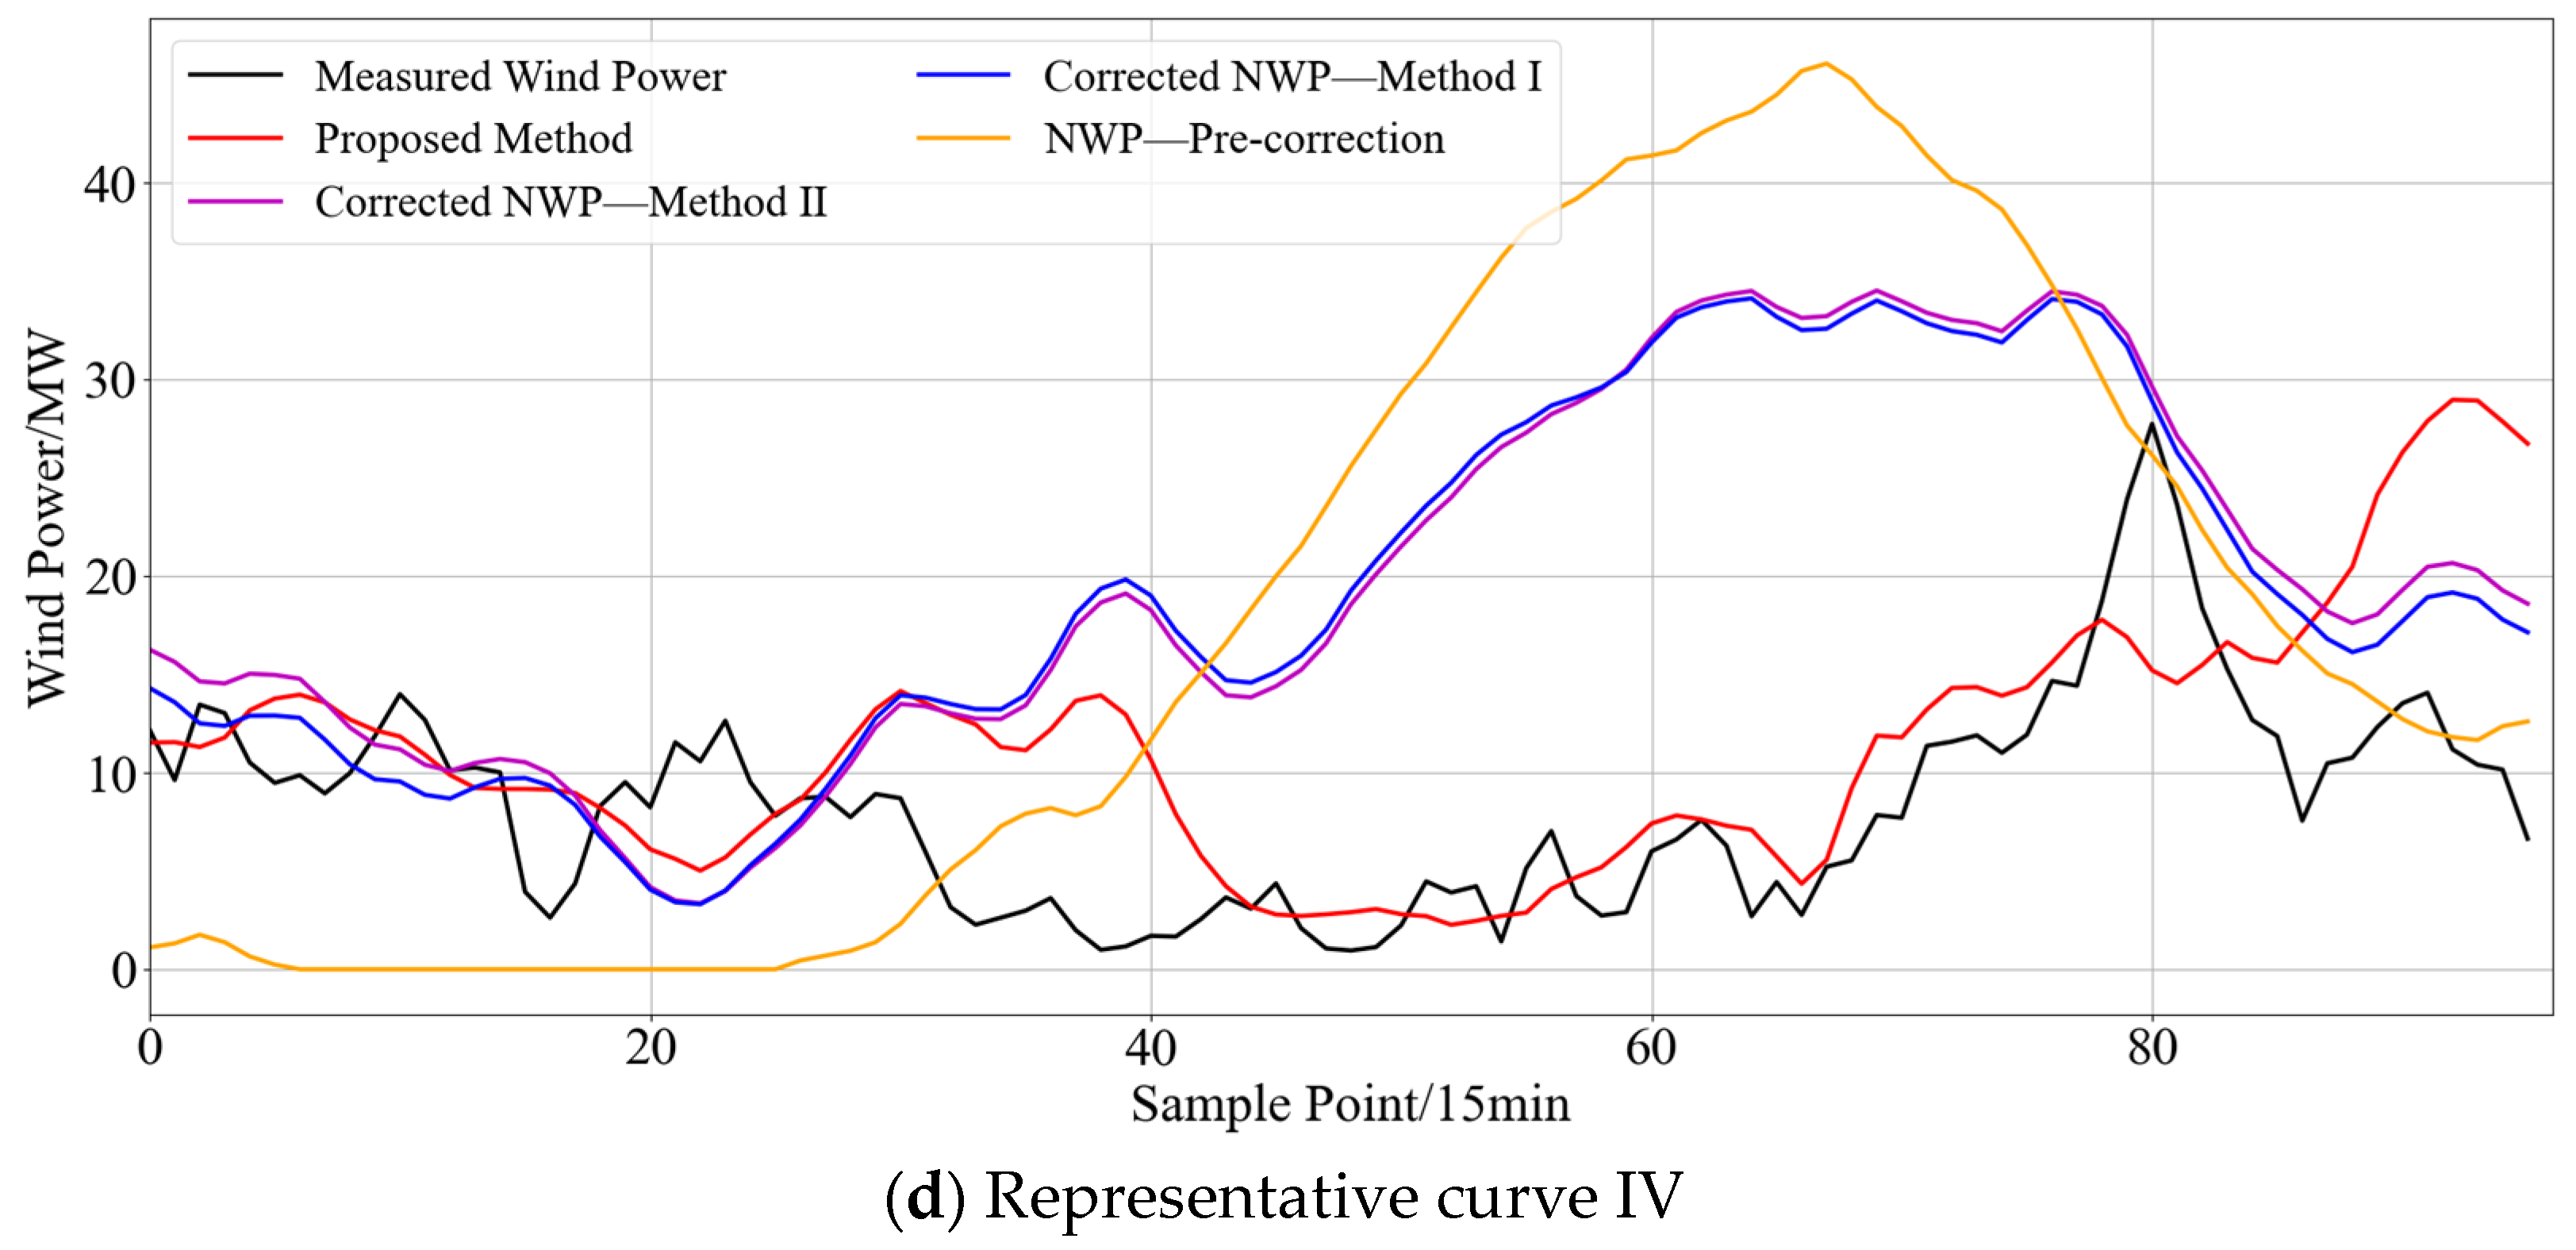
Based on this, Table 5 shows the error evaluation indicators of NWP wind speed before and after correction using the method proposed in this article. This article shows the correction errors of three correction methods. Method I traditionally considers establishing an intelligent mapping between measuring wind speed and predicting wind speed [24], while Method II directly uses the matched historical measured wind speed fragment as the correction result of the NWP segment. The method proposed in this article uses the high-frequency component of the historical measured wind speed of the matched sample as the error compensation amount to stack it onto the trend segment of the NWP to be corrected for error correction. Figure 12 shows the calibration results of typical NWP wind speed curves for a wind farm obtained using the wind speed correction method proposed in this article. From the correction curve, the error of the correction method using artificial intelligence mapping is relatively greater. Compared with the actual wind speed curve, there are many erroneous corrections. The correction curve obtained using Method II is relatively close to the actual wind speed curve in terms of change trend, but there are certain differences in amplitude. Using the proposed correction method, both in terms of trend and wind speed amplitude, it is closer to the actual wind speed. After correction, the wind speed prediction error is significantly reduced. Before correction, the wind speed prediction RMSE is 3.248, and the MAE is 2.449. Using an artificial intelligence mapping method, the error correction is not obvious, and there are even cases of deterioration. Using the proposed correction method, the RMSE of the wind speed after correction decreases by 1.88, and the MAE decreases by 1.375. The correction strategy proposed in this article can significantly improve the prediction accuracy of NWP wind speed.
5.3. Wind Power Prediction
Table 6 shows the error evaluation indicators for the power prediction and error correction results of a wind farm obtained using the above prediction models and error correction methods. From the overall results, the error generated by using the corrected NWP wind speed for power prediction is relatively large, and the error generated by using the artificial intelligence mapping correction method for wind speed for power prediction is greater. This indicates that directly establishing a mapping relationship between measured wind speed and predicted wind speed is relatively unreasonable. Method II and the modified wind speed proposed in this article significantly improve the accuracy of power prediction. When used for power prediction, the correction method proposed in this article is more reliable and has relatively fewer errors. Among the four prediction methods, RMS and NMAE decreased by an average of 4.45% and 3.57%, respectively, which verifies the effectiveness of the proposed method. At the same time, it has been verified that the method proposed in this article is suitable for the error correction of various predictors and has universality.
In Figure 13, the four days ahead power prediction curve using HKELM is shown. The power prediction curve obtained by using the corrected NWP wind speed as input significantly differs from the actual value, and the power predicted based on the artificial intelligence mapping corrected wind speed is similar. The power prediction results obtained using the correction method proposed in this article are closer to the actual power, especially the corrected curve. The corrected NWP wind speed can provide a better mapping relationship for the model, effectively improving the prediction accuracy and verifying the effectiveness of the method proposed in this article.
6. Discussion and Analysis
6.1. Analysis of Seasonal Characteristics
In order to further analyze the prediction performance of the wind power prediction method proposed in this paper among different seasons, some data of four seasons in 2021 are selected for power prediction analysis. Table 7 demonstrates the metrics for evaluating the power prediction errors of the different methods under four seasons, where the NRMSE of the four prediction methods is on average 1.55%, 1.98%, 2.70%, and 1.61% lower in the spring and summer months compared to the fall and winter months, respectively, and the NMAE is on average 0.78%, 2.35%, 2.19%, and 1.34% lower in the fall and winter months, respectively. The method proposed in this paper has the lowest average prediction error in the four seasons, especially in spring and summer, and in the error statistics results of the four seasons, for the method proposed in this paper, the NRMSE is lower by an average of 5.04% and the NMAE is lower by an average of 4.47%. Therefore, the method proposed in this paper is adapted to power prediction in all seasons and shows high effectiveness.
6.2. Analysis of the Applicability of Wind Power Prediction Methods
In order to highlight the adaptability of the method proposed in this paper, we introduce wind farm data from several regions to further validate the proposed method. These include wind farms in Yunnan, Jilin, and Gansu, whose geographical locations are shown in Figure 14. Based on the wind speed correction results, we further graph neural network and time convolutional neural network for wind power prediction. Considering the above results, the effectiveness of the power correction method in this paper has been sufficiently demonstrated. In this section, we only compare the power curves obtained before and after the wind speed correction as well as the prediction using graph neural network (GCN) and temporal convolutional neural network (TCN) and the corresponding metrics for the prediction error assessment. Figure 15 shows the wind power prediction results of the three provinces. From the wind farm power prediction curves of the three provinces, the direct GCN as well as TCN prediction methods have lower errors compared to the traditional models, but the prediction curves are not close to the trend of the real curves due to the large error of the NWP wind speed. On the contrary, the method based on NWP correction in this paper significantly improves the prediction error, and its prediction value has a lower error compared to the method directly using TCN and GCN prediction. The method based on power correction has the lowest error, which indicates that the NWP key meteorological elements are of great importance to the power prediction accuracy in short-term prediction. Forecast errors are significantly higher for wind farms in Jilin and Gansu than for wind farms in Yunnan Province, due to the much larger installed wind power capacity in these areas. From Table 8, the power-corrected NRMSE of the three wind farms decreased by an average of 1.18% and 1.62% for NMAE compared to TCN, and by an average of 1.17% and 1.47% for NMAE compared to GCN. The method in this paper reduces the NRMSE by an average of 1.18% and the NMAE by an average of 1.55% compared to the TCN and GCN prediction results. The method proposed in this paper shows high prediction performance in power prediction of wind farms in different regions.
7. Conclusions
This article proposes a short-term wind power prediction method that considers the trend correction of NWP wind speed. It introduces the trend correlation between measured wind speed and predicted wind speed to establish a short-term correction model for predicted wind speed. At the same time, it considers the historical correlation of prediction errors and establishes a wind power prediction error correction method that considers similar historical NWP segments. The following conclusions are drawn:
(1) The NWP trend sequence decomposed using the ICEEMDAN-based sequence decomposition method is closer to the measured wind speed trend sequence in terms of error, correlation, and fluctuation compared to CEEMDAN, VMD, and DWT. The decomposition method proposed in this article was used to reduce the average RMSE of NWP trend series and measured wind speed trend series by 0.6716, MAE by 0.5295, Pe by 0.1689, and R by 5.25% in the wind farm.
(2) The average MAE of samples matched using the proposed weighted dual constraint mechanism is 3.503 and 0.542 lower than that of clustering and step-by-step matching methods, the average L-value is 1.400 and 0.216 lower, and the average time consumption is 1.091 s and 0.970 s lower. The proposed dual constraint weighted matching mechanism has a lower similar sample error, higher matching degree, and shorter matching time compared to other matching methods, demonstrating good adaptability.
(3) The proposed NWP wind speed correction method significantly reduces NWP error, while the error correction using artificial intelligence mapping is not obvious, and there may even be deterioration. After correction using Method II, the average RMSE decreased by 0.664 and the average MAE decreased by 0.576. After correction using the method proposed in this article, the average RMSE decreased by 0.727 and the average MAE decreased by 0.655. Using the correction method in this article, the wind speed RMSE of Wind Farm I decreased by 1.88 and MAE decreased by 1.375.
Although the two-stage power prediction method proposed in this article can significantly improve the accuracy of wind power prediction, due to the randomness and uncertainty of NWP prediction errors, the matching results of NWP trend fragments are not accurate, and there may even be errors in correction. This will further increase the error of wind power prediction. In the future, we will further study the uncertainty modeling of NWP to improve the NWP correction effect in complex weather or extreme error scenarios to adapt to the entire weather process.
Author Contributions
Conceptualization, M.Y.; methodology, M.Y.; software, Y.J.; validation, Y.J. and J.C.; formal analysis, J.C.; investigation, Q.L.; resources, Z.H.; data curation, Q.L.; writing—original draft preparation, Y.J.; writing—review and editing, Y.J.; visualization, Y.J.; supervision, J.C.; project administration, Z.H.; funding acquisition, Z.H. All authors have read and agreed to the published version of the manuscript.
Funding
This research was funded by the State Grid Corporation of China Science and Technology project “Key technologies of power prediction and promotion of new energy based on man-machine cooperation” under Grant 5108202218280A2313XG.
Data Availability Statement
Data are unavailable due to privacy or ethical restrictions.
Conflicts of Interest
Author Zifen Han and Qingquan Lv were employed by the company State Grid Gansu Electric Power Company Limited. The remaining authors declare that the research was conducted in the absence of any commercial or financial relationships that could be construed as a potential conflict of interest.
Nomenclature
| NWP | Numerical weather prediction |
| STWPF | Short-term wind power forecasting |
| IEA | International Energy Agency |
| BiGRU | Bi-directional gated circulation unit |
| RBF | Radial-based neural network |
| GP | Gaussian process regression |
| PNN | Probabilistic neural network |
| SVR | Support vector regression |
| DBN | Deep belief network |
| ELM | Support vector machine |
| MLR | Multiple linear regression |
| LSSVM | Least squares support vector machine |
| HKELM | Hybrid kernel extreme learning machine |
| TCN | Temporal convolutional neural network |
| GCN | Graphical convolutional neural network |
| ARIMA | Autoregressive integrated moving average |
| Copula | Copula model |
| EMD | Average absolute error |
| CEEMD | Complementary ensemble empirical mode decomposition |
| CEEMDAN | Complete ensemble empirical mode decomposition with adaptive noise |
| ICEEMDAN | Improved complete ensemble EMD with adaptive noise |
| VMD | Variational modal decomposition |
| DWT | Discrete wavelet transform |
| RMSE | Root-mean-square error |
| MAE | Average absolute error |
| Pe | Permutation entropy |
| R | Correlation coefficient |
| AI | Artificial intelligence f |
References
- Redl, C.; Hein, F.; Buck, M.; Graichen, P.; Jones, D. The European Power Sector in 2020: Up-to-Date Analysis on the Electricity Transition; Agora Energiewende: Berlin, Germany, 2021. [Google Scholar]
- Tracking Clean Energy Progress 2023–Analysis-IEA [Online]; International Energy Agency: Paris, France, 2023.
- Yang, M.; Shi, C.; Liu, H. Day-ahead WPP based on the clustering of equivalent power curves. Energy 2021, 218, 119515. [Google Scholar] [CrossRef]
- Ma, S.; Geng, H.; Yang, G.; Pal, B.C. Clustering-based coordinated control of large-scale wind farm for power system frequency support. IEEE Trans. Sustain. Energy 2018, 9, 1555–1564. [Google Scholar] [CrossRef]
- Yang, M.; Zhang, L.; Cui, Y.; Zhou, Y.; Chen, Y.; Yan, G. Investigating the Wind Power Smoothing Effect Using Set Pair Analysis. IEEE Trans. Sustain. Energy 2020, 11, 1161–1172. [Google Scholar] [CrossRef]
- Tawn, R.; Browell, J. A review of very short-term wind and solar power prediction. Renew. Sustain. Energy Rev. 2020, 153, 111758. [Google Scholar] [CrossRef]
- Tascikaraoglu, A.; Uzunoglu, M. A review of combined approaches for prediction of short-term wind speed and power. Renew. Sustain. Energy Rev. 2014, 34, 243–254. [Google Scholar] [CrossRef]
- State Grid Corporation of China. Function Specification of Wind Power Forecasting System: NB/T 31046-2022. Available online: https://www.doc88.com/p-35729449244944.html (accessed on 4 May 2023).
- Hao, Y.; Dong, L.; Liao, X.; Liang, J.; Wang, L.; Wang, B. A novel clustering algorithm based on mathematical morphology for wind power generation prediction. Renew. Energy 2019, 136, 572–585. [Google Scholar] [CrossRef]
- Tan, L.; Han, J.; Zhang, H. Ultra-short-term wind power prediction by salp swarm algorithm-based optimizing extreme learning machine. IEEE Access 2020, 8, 44470–44484. [Google Scholar] [CrossRef]
- An, X.; Jiang, D.; Zhao, M.; Liu, C. Short-term prediction of wind power using EMD and chaotic theory. Commun. Nonlinear Sci. Numer. Simul. 2012, 17, 1036–1042. [Google Scholar] [CrossRef]
- Wang, S.; Li, B.; Li, G.; Yao, B.; Wu, J. Short-term wind power prediction based on multidimensional data cleaning and feature recon Figureuration. Appl. Energy 2021, 292, 116851. [Google Scholar] [CrossRef]
- Zhang, Z.S.; Sun, Y.Z.; Gao, D.W.; Lin, J.; Cheng, L. A versatile probability distribution model for wind power forecast errors and its application in economic dispatch. IEEE Trans. Power Syst. 2013, 28, 3114–3125. [Google Scholar] [CrossRef]
- Bludszuweit, H.; Domínguez-Navarro, J.A.; Llombart, A. Statistical analysis of wind power forecast error. IEEE Trans. Power Syst. 2008, 23, 983–991. [Google Scholar] [CrossRef]
- De Giorgi, M.G.; Ficarella, A.; Tarantino, M. Error analysis of short term wind power prediction models. Appl. Energy 2011, 88, 1298–1311. [Google Scholar] [CrossRef]
- Tastu, J.; Pinson, P.; Kotwa, E.; Madsen, H.; Nielsen, H.A. Spatio-temporal analysis and modeling of short-term wind power forecast errors. Wind Energy 2011, 14, 43–60. [Google Scholar] [CrossRef]
- Nazaré, G.; Castro, R.; Gabriel Filho, L.R.A. Wind power forecast using neural networks: Tuning with optimization techniques and error analysis. Wind Energy 2020, 23, 810–824. [Google Scholar] [CrossRef]
- Rajagopalan, S.; Santoso, S. Wind power forecasting and error analysis using the autoregressive moving average modeling. In Proceedings of the 2009 IEEE Power & Energy Society General Meeting, Calgary, AB, Canada, 26–30 July 2009; IEEE: Piscataway, NJ, USA, 2009; pp. 1–6. [Google Scholar]
- Sun, S.; Liu, Y.; Li, Q.; Wang, T.; Chu, F. Short-term multi-step wind power forecasting based on spatio-temporal correlations and transformer neural networks. Energy Convers. Manag. 2023, 283, 116916. [Google Scholar] [CrossRef]
- Wu, H.; Meng, K.; Fan, D.; Zhang, Z.; Liu, Q. Multistep short-term wind speed forecasting using transformer. Energy 2022, 261, 125231. [Google Scholar] [CrossRef]
- Ye, L.; Dai, B.; Pei, M.; Lu, P.; Zhao, J.; Chen, M.; Wang, B. Combined approach for short-term wind power forecasting based on wave division and Seq2Seq model using deep learning. IEEE Trans. Ind. Appl. 2022, 58, 2586–2596. [Google Scholar] [CrossRef]
- Wang, H.; Han, S.; Liu, Y.; Yan, J.; Li, L. Sequence transfer correction algorithm for numerical weather prediction wind speed and its application in a wind power forecasting system. Appl. Energy 2019, 237, 1–10. [Google Scholar] [CrossRef]
- Wang, H.; Yan, J.; Liu, Y.; Han, S.; Li, L.; Zhao, J. Multi-step-ahead method for wind speed prediction correction based on numerical weather prediction and historical measurement data, Journal of Physics: Conference Series. IOP Publ. 2017, 926, 012007. [Google Scholar]
- Ding, M.; Zhou, H.; Xie, H.; Wu, M.; Nakanishi, Y.; Yokoyama, R. A gated recurrent unit neural networks based wind speed error correction model for short-term wind power forecasting. Neurocomputing 2019, 365, 54–61. [Google Scholar] [CrossRef]
- Liu, Y.; Wang, Y.; Li, L.; Han, S.; Infield, D. Numerical weather prediction wind correction methods and its impact on computational fluid dynamics based wind power forecasting. J. Renew. Sustain. Energy 2016, 8, 033302. [Google Scholar] [CrossRef]
- Hu, S.; Xiang, Y.; Zhang, H.; Xie, S.; Li, J.; Gu, C.; Sun, W.; Liu, J. Hybrid forecasting method for wind power integrating spatial correlation and corrected numerical weather prediction. Appl. Energy 2021, 293, 116951. [Google Scholar] [CrossRef]
- Zjavka, L. Wind speed forecast correction models using polynomial neural networks. Renew. Energy 2015, 83, 998–1006. [Google Scholar] [CrossRef]
- Cai, H.; Jia, X.; Feng, J.; Li, W.; Hsu, Y.-M.; Lee, J. Gaussian process regression for numerical wind speed prediction enhancement. Renew. Energy 2020, 146, 2112–2123. [Google Scholar] [CrossRef]
- Hu, S.; Xiang, Y.; Huo, D.; Jawad, S.; Liu, J. An improved deep belief network based hybrid forecasting method for wind power. Energy 2021, 224, 120185. [Google Scholar] [CrossRef]
- Wang, L.; Li, X.; Bai, Y. Short-term wind speed prediction using an extreme learning machine model with error correction. Energy Convers. Manag. 2018, 162, 239–250. [Google Scholar] [CrossRef]
- Dong, L.; Ren, L.; Gao, S.; Gao, Y.; Liao, X. Studies on wind farms ultra-short term NWP wind speed correction methods. In Proceedings of the 2013 25th Chinese Control and Decision Conference (CCDC), Guiyang, China, 25–27 May 2013; IEEE: Piscataway, NJ, USA, 2013; pp. 1576–1579. [Google Scholar]
- Suo, L.; Peng, T.; Song, S.; Zhang, C.; Wang, Y.; Fu, Y.; Nazir, M.S. Wind speed prediction by a swarm intelligence based deep learning model via signal decomposition and parameter optimization using improved chimp optimization algorithm. Energy 2023, 127526. [Google Scholar] [CrossRef]
- Lu, Y.N.; Bai, Y.L.; Tang, L.H.; Wan, W.D.; Ma, Y.J. Secondary factor induced wind speed time-series prediction using self-adaptive interval type-2 fuzzy sets with error correction. Energy Rep. 2021, 7, 7030–7047. [Google Scholar] [CrossRef]
- Wang, C.; Yang, M.; Yu, Y.; Li, M.; Si, Z.; Liu, Y.; Yan, F. A Multi-dimensional Copula Wind Speed Correction Method for Ultra-Short-Term Wind Power Prediction. In Proceedings of the 2022 4th Asia Energy and Electrical Engineering Symposium (AEEES), Chengdu, China, 25–28 March 2022; IEEE: Piscataway, NJ, USA, 2022; pp. 219–225. [Google Scholar]
- Kalnay, E. Atmospheric Modeling, Data Assimilation and Predictability; Cambridge University Press: Cambridge, UK, 2003. [Google Scholar]
- Bommidi, B.S.; Teeparthi, K.; Kosana, V. Hybrid wind speed forecasting using ICEEMDAN and transformer model with novel loss function. Energy 2023, 265, 126383. [Google Scholar] [CrossRef]
Figure 1.
Measured wind speed and NWP wind speed curves.

Figure 2.
The power prediction curves of measured wind speed and NWP wind speed.

Figure 3.
Framework of proposed method.

Figure 4.
Wind speed series measured and forecasted wind speed in wind farms.

Figure 5.
Geographic location of the three wind farms.

Figure 6.
Decomposition results of NWP wind speed and measured wind speed of wind farm.

Figure 7.
Trends in assessment indicators with the number of superimposed components.

Figure 8.
Comparison of trend curves of wind farm NWP and measured wind speed decomposition and reconstruction.
Figure 8.
Comparison of trend curves of wind farm NWP and measured wind speed decomposition and reconstruction.

Figure 9.
Calculated L-curves of representative NWP fragments to be corrected.

Figure 10.
Matching results of similar historical NWP fragments representing NWP fragments to be corrected in each wind farm.
Figure 10.
Matching results of similar historical NWP fragments representing NWP fragments to be corrected in each wind farm.

Figure 11.
Diagram of the actual error of NWP and the error of the matching fragment.

Figure 12.
Correction results of representative curves of NWP wind speed.

Figure 13.
HKELM power prediction curves.


Figure 14.
Geographic location of wind farms in three provinces.

Figure 15.
Wind power prediction results of each province.


Table 1.
Common short-term NWP wind speed correction methods and correction time scales.
| Reference | Time-Scale | Method | Input | Model |
|---|---|---|---|---|
| Min Ding et al. [24] | STWPF | AI method | NWP wind speed, trend | BiGRU |
| Liu Y et al. [25] | STWPF | AI method | NWP wind speed, NWP wind direction | RBF |
| Hu S et al. [26] | STWPF | AI method | NWP wind speed | GP |
| Zjavka L [27] | STWPF | AI method | NWP wind speed | PNN |
| Cai H [28] | STWPF | AI method | NWP wind speed | SVR |
| Hu S [29] | STWPF | AI method | NWP wind speed | DBN |
| Jiang Y [30] | STWPF | time series | NWP wind speed | ELM, LSSVM |
| Dong L [31] | USTWPF | time series | NWP wind speed | MLR |
| Wang H [22] | USTWPF | time series | NWP wind speed | SVR |
| Suo L [32] | USTWPF | time series | Measured wind speed | BiGRU |
| Lu Y N [33] | USTWPF | time series | Wind speed prediction error | ARIMA |
| Wang C [34] | USTWPF | time series | Wind speed prediction error | Copula |
Table 2.
Calculation of error indicators for different wind farms.
| Wind Farm | RMSEws | RMSEp (with Measure) | RMSEp (with NWP) | Percentage (%) |
|---|---|---|---|---|
| 1 | 0.1165 | 0.0672 | 0.2003 | 0.6645 |
| 2 | 0.0970 | 0.0865 | 0.2156 | 0.5988 |
| 3 | 0.1114 | 0.1152 | 0.1982 | 0.4186 |
| 4 | 0.1051 | 0.1054 | 0.2035 | 0.4822 |
| 5 | 0.1203 | 0.0761 | 0.1515 | 0.4979 |
| 6 | 0.2334 | 0.1385 | 0.3118 | 0.5558 |
| 7 | 0.2759 | 0.2577 | 0.2741 | 0.4245 |
| 8 | 0.2034 | 0.2543 | 0.2608 | 0.4085 |
| 9 | 0.1110 | 0.0931 | 0.1886 | 0.5067 |
| 10 | 0.1488 | 0.1436 | 0.1987 | 0.4786 |
Table 3.
The NWP of each decomposition method and the evaluation index of the extraction results of the measured wind speed trend components.
Table 3.
The NWP of each decomposition method and the evaluation index of the extraction results of the measured wind speed trend components.
| Decomposition Methods | RMSEws | MAEws | R |
|---|---|---|---|
| ICEEMDAN | 1.71 | 1.32 | 0.69 |
| CEEMDAN | 1.95 | 1.50 | 0.63 |
| VMD | 1.99 | 1.52 | 0.62 |
| DWT | 3.23 | 2.51 | 0.48 |
Table 4.
The matching index obtained using each matching method.
| Method | R | MAEws | L | Time Consumption |
|---|---|---|---|---|
| Clustering | 0.999 | 3.500 | 1.400 | 7.587 |
| Step-by-step matching | 0.999 | 2.014 | 0.806 | 7.402 |
| Double constraint weighting method | 0.995 | 0.590 | 0.237 | 6.278 |
Table 5.
Error evaluation index before and after NWP wind speed correction.
| Method | RMSEws | MAEws |
|---|---|---|
| Pre-correction | 3.248 | 2.449 |
| Method I | 1.794 | 1.556 |
| Method II | 1.438 | 1.14 |
| Proposed method | 1.368 | 1.074 |
Table 6.
Power prediction error evaluation metrics.
| Model | Input of Model | RMSEp | MAEp |
|---|---|---|---|
| HKELM | Pre-correction NWP | 11.67% | 9.74% |
| Corrected NWP—Method I | 24.99% | 18.99% | |
| Corrected NWP—Method II | 9.57% | 7.59% | |
| Corrected NWP—Proposed method | 9.43% | 7.55% | |
| BP | Pre-correction NWP | 12.43% | 9.92% |
| Corrected NWP—Method I | 16.72% | 13.29% | |
| Corrected NWP—Method II | 9.70% | 7.80% | |
| Corrected NWP—Proposed method | 9.47% | 7.54% | |
| LSTM | Pre-correction NWP | 12.76% | 10.20% |
| Corrected NWP—Method I | 19.47% | 15.66% | |
| Corrected NWP—Method II | 9.70% | 7.69% | |
| Corrected NWP—Proposed method | 9.58% | 7.58% | |
| GRU | Pre-correction NWP | 11.95% | 9.95% |
| Corrected NWP—Method I | 18.95% | 15.29% | |
| Corrected NWP—Method II | 9.83% | 7.75% | |
| Corrected NWP—Proposed method | 9.60% | 7.64% |
Table 7.
Error assessment indicators corresponding to different prediction methods under different seasons.
Table 7.
Error assessment indicators corresponding to different prediction methods under different seasons.
| Season | Indicator | Pre-Correction NWP | Corrected NWP—Method Ⅰ | Corrected NWP—Method Ⅱ | Corrected NWP—Proposed Method |
|---|---|---|---|---|---|
| Spring | NRMSE | 11.65% | 19.24% | 10.55% | 9.27% |
| NMAE | 9.75% | 16.34% | 8.96% | 7.53% | |
| Summer | NRMSE | 11.22% | 20.15% | 11.05% | 9.07% |
| NMAE | 9.21% | 17.64% | 9.36% | 7.13% | |
| Autumn | NRMSE | 12.35% | 21.65% | 13.22% | 10.67% |
| NMAE | 10.19% | 19.16% | 11.27% | 8.55% | |
| Winter | NRMSE | 13.61% | 21.69% | 13.78% | 10.89% |
| NMAE | 10.33% | 19.51% | 11.43% | 8.79% |
Table 8.
Wind power prediction error assessment indicator of each province.
| Provinces | Indicator | TCN | GCN | Proposed Method—Before Correction | Proposed Method—After Correction |
|---|---|---|---|---|---|
| Jilin | NRMSE | 11.19% | 10.96% | 10.45% | 9.76% |
| NMAE | 9.55% | 9.12% | 8.64% | 7.51% | |
| Gansu | NRMSE | 11.02% | 10.61% | 10.22% | 9.46% |
| NMAE | 9.36% | 9.05% | 8.50% | 7.23% | |
| Yunnan | NRMSE | 8.02% | 8.61% | 8.22% | 7.46% |
| NMAE | 6.71% | 6.99% | 6.45% | 6.01% |
Disclaimer/Publisher’s Note: The statements, opinions and data contained in all publications are solely those of the individual author(s) and contributor(s) and not of MDPI and/or the editor(s). MDPI and/or the editor(s) disclaim responsibility for any injury to people or property resulting from any ideas, methods, instructions or products referred to in the content. |
© 2024 by the authors. Licensee MDPI, Basel, Switzerland. This article is an open access article distributed under the terms and conditions of the Creative Commons Attribution (CC BY) license (https://creativecommons.org/licenses/by/4.0/).
Share and Cite
MDPI and ACS Style
Yang, M.; Jiang, Y.; Che, J.; Han, Z.; Lv, Q. Short-Term Forecasting of Wind Power Based on Error Traceability and Numerical Weather Prediction Wind Speed Correction. Electronics 2024, 13, 1559. https://doi.org/10.3390/electronics13081559
AMA Style
Yang M, Jiang Y, Che J, Han Z, Lv Q. Short-Term Forecasting of Wind Power Based on Error Traceability and Numerical Weather Prediction Wind Speed Correction. Electronics. 2024; 13(8):1559. https://doi.org/10.3390/electronics13081559
Chicago/Turabian StyleYang, Mao, Yue Jiang, Jianfeng Che, Zifen Han, and Qingquan Lv. 2024. "Short-Term Forecasting of Wind Power Based on Error Traceability and Numerical Weather Prediction Wind Speed Correction" Electronics 13, no. 8: 1559. https://doi.org/10.3390/electronics13081559
Note that from the first issue of 2016, this journal uses article numbers instead of page numbers. See further details here.