
Research on Energy Efficiency Optimization of Visible Light Communication Based on Non-Orthogonal Multiple Access

1
Institute of Information Technology, Hebei University of Economics and Business, Shijiazhuang 050061, China
2
Institute of Information Technology Engineering, Tianjin University of Technology and Education, Tianjin 300222, China
*
Author to whom correspondence should be addressed.
Electronics 2024, 13(8), 1562; https://doi.org/10.3390/electronics13081562
Submission received: 1 April 2024
/
Revised: 10 April 2024
/
Accepted: 15 April 2024
/
Published: 19 April 2024
(This article belongs to the Section Microwave and Wireless Communications)
Abstract
:As a contender in the competitive landscape of next-generation wireless communication technologies, visible light communication (VLC) stands out due to its potential for enhancing transmission rates and spectrum resource utilization. VLC offers various advantages, including license-free operation, high confidentiality, and cost-effectiveness. However, practical implementation faces challenges stemming from the limited modulation bandwidth of light-emitting diodes (LEDs), constraining system capacity and VLC communication rates. To address this limitation, non-orthogonal multiple access (NOMA) emerges as a novel multiple access strategy, particularly suitable for enhancing the capacity and communication rates of downlink VLC systems through power multiplexing. This paper delves into the energy-efficient design of joint LED association and power allocation (LA–PA) for downlink NOMA-based VLC systems. Through an analysis of channel capacity, we transform the non-convex energy-efficient optimization model, accounting for signal non-negativity, per-LED optical power constraints, and user rate constraints, into a convex form. Subsequently, we propose an iterative power allocation algorithm to attain solutions for the optimization problem with pre-established LED associations. Furthermore, we derive a feasibility condition for an LED association, considering signal non-negativity, per-LED optical power constraints, power constraints for successive interference cancellation (SIC), and channel gain between transceiver signals. This condition identifies feasible LEDs capable of maximizing energy efficiency (EE) when combined with the aforementioned power allocation algorithm. Finally, we illustrate the superiority of the joint LA–PA scheme in terms of the EE, transmission reliability, and transmission capacity performance gain over NOMA in the context of VLC.
1. Introduction
With the exponential proliferation of smart terminals and mobile computing devices poised for integration into future 6G networks, radio frequency (RF) communication confronts mounting pressure from a dearth of spectrum resources [1]. In light of this challenge, visible light communication (VLC) emerges as a compelling alternative for data transmission, boasting advantages such as license-free operation, heightened confidentiality, and cost efficiency [2]. VLC finds increasing applicability across diverse scenarios, encompassing light fidelity (Li-Fi) [3], vehicle-to-vehicle (V2V) communication [4], underwater communication [5], subterranean operations [6], and smart home environments [7]. Notably, Li-Fi implementation of VLC circumvents various limitations inherent in wireless fidelity (Wi-Fi) technologies, including security vulnerabilities, obstructions to signal propagation [8], and radio frequency interference. Furthermore, in V2V applications, VLC facilitates functions such as lane-change warnings, preemptive alerts, and detection of traffic signal violations to avert potential collisions. In underwater communication settings, VLC effectively mitigates challenges associated with radio spectrum scarcity, pronounced latency, and elevated bit error rate (BER), thereby enabling high-speed, reliable data transmission. Additionally, VLC finds utility in electromagnetically sensitive domains like aircraft, medical facilities, and military installations, where it serves to preempt interference with sensitive equipment by curtailing radio signal emissions. However, the constrained modulation bandwidth inherent in light-emitting diodes (LEDs) poses limitations on the transmission rates and spectrum resource utilization of VLC systems. To address this bottleneck, several high spectral efficiency (SE) techniques have been deployed to enhance the data throughput of VLC systems. These techniques encompass adaptive modulation [9], equalization technologies [10], multiple-input multiple-output (MIMO) configurations [11], and multiple access schemes [12]. Notably, non-orthogonal multiple access (NOMA) emerges as a novel multiple access strategy, leveraging power-domain multiplexing to accommodate diverse users and employing successive interference cancellation (SIC) techniques to discern superimposed signals. NOMA not only facilitates massive connectivity, but also mitigates transmission latency and signaling overhead [13].
Several studies have delved into optimal and suboptimal power allocation strategies aimed at maximizing the SE of downlink NOMA-VLC systems [14,15,16,17,18,19,20,21,22]. The study presented in reference [14] endeavors to maximize the downlink sum-rate while adhering to quality of service (QoS) constraints, power consumption limits, and the operational range of LEDs. Reference [15] derives the coverage probability and sum-rate expressions for the VLC-NOMA system under QoS conditions. Moreover, research efforts have focused on user fairness alongside sum-rate optimization [16,17,18]. Reference [16] evaluates the secrecy sum-rate and user fairness under scenarios of perfect and imperfect SIC. In reference [17], the Lagrange duality method is employed to resolve the power distribution challenge in NOMA-VLC systems, thereby maximizing user fairness and data rates while ensuring fairness among users. Additionally, reference [18] proposes a fair power allocation scheme aimed at enhancing fairness among users based on their BER performance and achievable data rates in a NOMA-VLC system. Furthermore, studies have explored the integration of NOMA with other emerging technologies [19,20,21,22]. Reference [19] investigates an optical intelligent reflecting surface (OIRS)-based VLC system employing power-domain NOMA, wherein the achievable sum-rate is optimized via manipulation of the OIRS reflection matrix. In reference [20], consideration is given to a simultaneous lightwave information and power transfer (SLIPT)-enabled indoor VLC/RF hybrid communication system, with an optimization problem formulated to maximize the uplink weighted sum rate while considering both orthogonal multiple access (OMA) and NOMA scenarios. Additionally, reference [21] proposes a cooperative NOMA scheme within multicell VLC networks to mitigate inter-cell interference, aiming to maximize the sum-rate under QoS constraints. Lastly, in reference [22], a hybrid NOMA and OMA scheme for VLC is introduced to maximize the achievable sum-rate, with a permutation-based genetic algorithm proposed to optimize user pairings in this hybrid scheme.
In the pursuit of fostering green and low-carbon development, the forthcoming iteration of wireless communication must not only address the challenge of SE enhancement, but also prioritize the energy efficiency (EE) of eco-friendly wireless communication [23]. Nevertheless, scant attention has been directed towards the optimization of EE in NOMA-VLC systems [24,25]. Reference [24] delineates an optimal resource allocation strategy spanning both VLC and RF bands, aiming to maximize EE through the utilization of Dinkelbach’s algorithm and successive convex approximation techniques. Conversely, reference [25] delves into the resource allocation conundrum within multi-carrier NOMA VLC systems, endeavoring to minimize energy consumption while adhering to constraints imposed by minimum user data rate requirements. To circumvent the intricacies associated with SIC and power allocation, the prevailing literature largely presupposes the pre-association of users for NOMA power-domain multiplexing, subsequently proposing power allocation schemes premised on this pre-established NOMA association. In contrast, this paper investigates a novel joint LED association and power allocation (LA–PA) scheme, with the overarching goal of maximizing the EE of NOMA-based VLC systems. The main contributions are as follows:
- We formulate such a joint problem as a complex nonlinear EE optimization problem, which considers the non-negative constraint of an LED signal, per-LED optical power constraint, and minimum data rate constraint. The optimization problem can be solved in two steps, i.e., power allocation with known LED association and joint LA–PA;
- With the analysis of channel capacity, the EE optimization problem is converted into convex form, and then an iterative algorithm is designed to obtain the optimal power allocation with known LED association under the non-negative constraint, per-LED optical power constraint, and data rate requirement;
- Taking into account the non-negative constraint of a signal, per-LED optical power constraint, the power constraint required for SIC, and channel gain between the transceiver signals, the feasibility condition of the LED association is derived. The feasible LEDs that can achieve the maximum EE jointly with the former power allocation algorithm can be associated;
- Simulation results and performance comparisons illustrate the improved performance of the proposed scheme. Compared to the existing random clustering algorithm (RCA), traversal search clustering algorithm (TSCA), and pre-grouping clustering algorithm (PGCA) [26], the proposed LED association scheme achieves a significantly high EE gain. Compared to the existing fixed power allocation (FPA) [27] and fractional transmit power allocation (FTPA) [28], the simulation results show that the design of an efficient power allocation algorithm effectively improves the EE of NOMA-based VLC systems.
The rest of this paper is organized as follows. The system model is presented in Section 2. The EE optimization problem description and solution with known LED association is focused in Section 3. Section 4 presents the joint LED association and power allocation scheme for EE maximization. Numerical results are provided in Section 5. Challenges and future directions are presented in Section 6, and concluding remarks are given in Section 7.
2. System Model
2.1. Channel Model
Figure 1 shows a typical multi-light source multi-user VLC system scenario, where an LED represents a light source. Some photo detector (PD) lies within the overlapping area of the lighting footprints, hence receiving the signals from multiple LEDs. Path loss is a metric that describes the signal attenuation between LED and PD due to propagation environments. The magnitude of path loss is primarily determined by the signal propagation chain. Typically, non-line-of-sight (NLoS) links with higher order reflections exhibit higher path loss compared to NLoS links with lower order reflections. Simulation results from reference [29] indicate that the average path loss of a first-order reflection NLoS link is 15 dB higher than that of a LOS link, while the path loss of a second-order reflection NLoS link is 25 dB higher than that of a LOS link. These experimental findings illustrate that the higher the order of reflection in the NLoS link, the more severe the path loss. In accordance with the literature [30,31], due to the significant path loss present in NLoS links in VLC, the transmitted signal strength of NLoS links can be disregarded relative to the signal strength contribution to the PD from line-of-sight (LoS) links. Consequently, the channel model for VLC systems in this study primarily focuses on LoS links. Assuming N LEDs exists in the system, the channel gain between the i-th () LED and PD, denoted as , is given by
where is the Lambert index, and is the semi-angle. is the effective detection area of PD, and is the linear distance between the i-th LED and PD. is the irradiance angle of the i-th LED, is the incidence angle, and is the field-of-view (FOV) semi-angle of the receiver. is the optical filter gain. is the optical lens gain, which depends on and the refractive index n by .
2.2. Signal Model
The optimization of the VLC system incorporating multiple light sources is conducted employing NOMA technology. The NOMA-VLC signal processing scheme under consideration in this paper is delineated in Figure 2. At the transmitting terminal, the N data streams undergo serialization and subsequent modulation utilizing M-ary Quadrature Amplitude Modulation (QAM). Following modulation, the data symbols undergo Inverse Fast Fourier Transform (IFFT) prior to the insertion of the cyclic prefix (CP). CP is a segment of symbol added at the beginning of the symbol. The purpose of this is to mitigate inter-symbol interference and enhance the demodulation performance at the receiver. Then, the symbol needs to be converted into analog signals using a digital-to-analog converter (D/A) for transmission. A DC-bias level is incorporated to ensure the non-negativity of symbols. Each user’s signal is conveyed through a distinct Light-Emitting Diode (LED), with N LEDs concurrently transmitting signals within the same time-frequency resource through the NOMA mechanism. Upon reception of the optically transmitted signal, the PD employs SIC algorithms to reconstruct each individual signal from the superimposed signal.
At the receiver, the receiving signal y can be expressed as
where , is the electrical–optical conversion factor, is the optical–electrical conversion factor, and is the transmitting power of the i-th LED. is the information sent by the i-th LED, and the signal amplitude , is the amplitude constraint of the transmitted signal. is the direct current (DC) bias added to the i-th LED, and . z is the noise of the receiver, including the thermal noise and the shot noise, and the variance of the received noise is given by , where and are the variances of the thermal noise and shot noise, respectively. The shot noise is caused by the high rate of the physical photo-electronic conversion process, whose variance can be written as , where q represents the electronic charge, denotes the detector responsivity, is the received power, B is the corresponding bandwidth, is the background current, and denotes the noise bandwidth factor. On the other hand, the thermal noise results from the transimpedance receiver circuitry and its variance at PD are given by , where K is the Boltzmann’s constant, T is the absolute temperature, G is the open-loop voltage gain, is the PD’s fixed capacitance per unit area, is the field-effect transistor (FET) channel noise factor, g is the FET transconductance, and denotes the noise bandwidth factor.
At the receiver, PD is used to convert the optical signal into an electrical signal, and then SIC is used to decode the multiplexed signal. As shown in Equation (1), the first term is intended for the i-th signal, the second term is residual interference and cannot be decoded due to channel state information (CSI) uncertainty, and the third term is the interference introduced by the signals intended for the j-th signal. The PD adopts the SIC technique to decode received signals in an ascending order, i.e., from to . Set . Before decoding the i-th signal, PD, first decode the previous signal. Figure 2 illustrates the SIC detection process for N multiplexed signals. Initially, the signal with the highest channel gain is detected and subsequently subtracted from y. Subsequently, the signal with the second-highest channel gain is positioned in the first place, followed by the repetition of these steps until the detection of the last signal.
2.3. Channel Capacity Analysis
Considering the non-negative real number requirements and amplitude constraints of optical signals, this paper derives the channel capacity according to the mutual information between the transceiver signals [32]. Then, the achievable data rate of the i-th LED signal decoded is given by
where I is mutual information, H is information entropy, and is the distribution of , which satisfies
Based on the entropy power inequality (EPI) , the lower bound of the first item in Equation (3) is given by
Based on the upper bound of differential entropy of Gaussian random variables , the upper bound of the second item in Equation (3) is given by
Based on Equations (5) and (6), (3) can be formulated as
where . Using the Lagrangian method (see Appendix A for detail), we have the achievable rate of the i-th user as follows:
where , , and are the solutions of the following equations:
where .
3. EE Optimization Problem Description and Solution
The EE optimization problem of joint LA–PA for NOMA-based multi-LED VLC systems is solved in two steps, i.e., power allocation with known LED association and joint LA–PA. In this section, the EE optimization problem is described and the solution of the problem is obtained by the power allocation algorithm with a known LED association.
3.1. Problem Description
EE is defined as the ratio of achievable data rate and power consumption. The EE of the NOMA cluster is denoted by . The mathematical model aiming to maximize the EE of N multiplexing LEDs is established as
where . Constraint ensures the minimum data rate transmitted by the i-th LED, denoted as . limits the maximum transmit power of the i-th LED, denoted by . is the power constraint required for SIC, where is the minimum power difference between the decoded signal and the remaining undecoded signal. meets the power constraint of the DC bias condition.
3.2. Problem Transformation
Equation (10) is a non-convex optimization problem, and its global optimal solution cannot be obtained by a direct solving method. The lower bound of is equivalent to the sum of multiple fraction functions, which is given by
Then, we can obtain the equation of as
where
Let as the transmission power of each LED, assuming the multiplexing users have been arranged in descending order. Thus, finding the solution that maximizes can be transformed into
is obtained by putting Equation (8) into . is equivalent to the constraints , , and .
3.3. Problem Solution
Algorithm 1 gives the power control method to maximize the system EE. The gradient of and is denoted by and , respectively. and are convex functions with respect to because and . Therefore, we can use the difference of convex programming approach to realize the energy-efficient power allocation.
| Algorithm 1 Proposed EE maximization power allocation algorithm |
|
1: Initialize , the iteration number . 2: while do 3: Define convex approximation of as 4: . 5: Solve the convex problem 6: 7: 8: end while |
Convergence analysis: For each iteration, is the optimal solution obtained in the previous iteration; therefore, . is quasi-convex, then , and . It means that the value of increases after each iteration. In Algorithm 1, when , the algorithm iteration terminates. Therefore, the power solution sequence obtained by Algorithm 1 is a Cauchy sequence. In addition, the set of constraints is compact, and according to Cauchy’s theorem, always converges.
4. Joint LED Association and Power Allocation
The NOMA cluster is a communication method where the devices in the communication system are divided into different groups or clusters based on certain criteria. This grouping or clustering can be based on factors such as signal quality, communication needs, service types, etc. Compared to traditional time-division multiple access (TDMA) or frequency-division multiple access (FDMA) technologies, NOMA allows multiple devices to transmit data simultaneously within the same frequency band, thereby increasing spectrum utilization. Since NOMA technology allows multiple devices to transmit data simultaneously, the use of NOMA clusters helps increase the system’s capacity, better meeting the growing communication needs. Since more devices can share the same spectrum resources, this thereby reduces additional energy consumption. NOMA allows for the dynamic allocation of power and resources based on the signal characteristics and communication requirements of the devices. This flexibility enables the system to better adapt to differences between the devices and allocate resources according to actual conditions, further improving the system’s energy efficiency.
The above section presents the EE problem and optimal power allocation with a known LED association. In this section, we investigate the joint LA–PA strategy for EE maximization, in which the following factors are considered.
- (a)
- The order of SIC in NOMA is usually based on the descending order of the channel gain, , where M is the number of LEDs in the system.
- (b)
- The light-emitting device can be associated together if the transmitted power belong to the condition of , which satisfies the maximum transmission power constraints, the power constraint required for SIC, and the power constraint of the DC bias condition. From , we can obtain
Based on the above feasibility condition of the LED association, the joint LA–PA algorithm is proposed in Algorithm 2.
| Algorithm 2 Proposed joint LED association and power allocation algorithm |
| 1: Initialize , , , , M, , . 2: while do 3: . . . . . 4: 5: while do 6: for to J do 7: if then 8: , . . . 9: ; 10: else 11: . 12: end if 13: end for 14: end while 15: 16: Calculate the EE using Algorithm 1. 17: while do 18: . . . . Go to . 19: if EE increases then 20: Reserve the set of and . 21: end if 22: . 23: end while 24: end while |
In Algorithm 2, is the set of the candidate light-emitting device’ channel gain, and and are the set of the transmit power and the maximum allowed transmit power of the above candidate devices, respectively. .
The joint LA–PA process is as follows: In , if there exist LEDs that satisfy the condition of Equation (16), i.e., line 7, then these LEDs can be associated provisionally. For the sake of notational simplicity, let represent the Y-th element of X. and are defined as the channel gain and transmitted power of the i-th LED in the k NOMA association, respectively. In , initially, compute the EE of the previous association. Subsequently, commence with the last associated LED, disassociate it, and proceed to select the remaining LEDs for reconfiguration. Upon reorganization, calculate the EE once more, and maintain the current association if EE demonstrates improvement. In essence, associate the feasible LEDs that, in conjunction with the preceding power allocation algorithm, enable maximal EE for NOMA transmission. Ultimately, the LED associations can be determined when .
Computational complexity analysis: For , it takes operations. In , the computational complexity of the power allocation for calculating the EE as [33], L, is the number of iterations. Then, the total complexity for is . If K NOMA clusters are obtained, then the total complexity for the algorithm is .
5. Results
The EE performance of the NOMA-based VLC system is simulated and analyzed in this section. The main system parameters are listed in Table 1 [34,35]. We study the impact of different LEDs’ locations within an indoor space, where one PD is served by multiplexing LEDs in a room of the size . LEDs are located at the top of the room, and the PD is located 0.8 m above the ground.
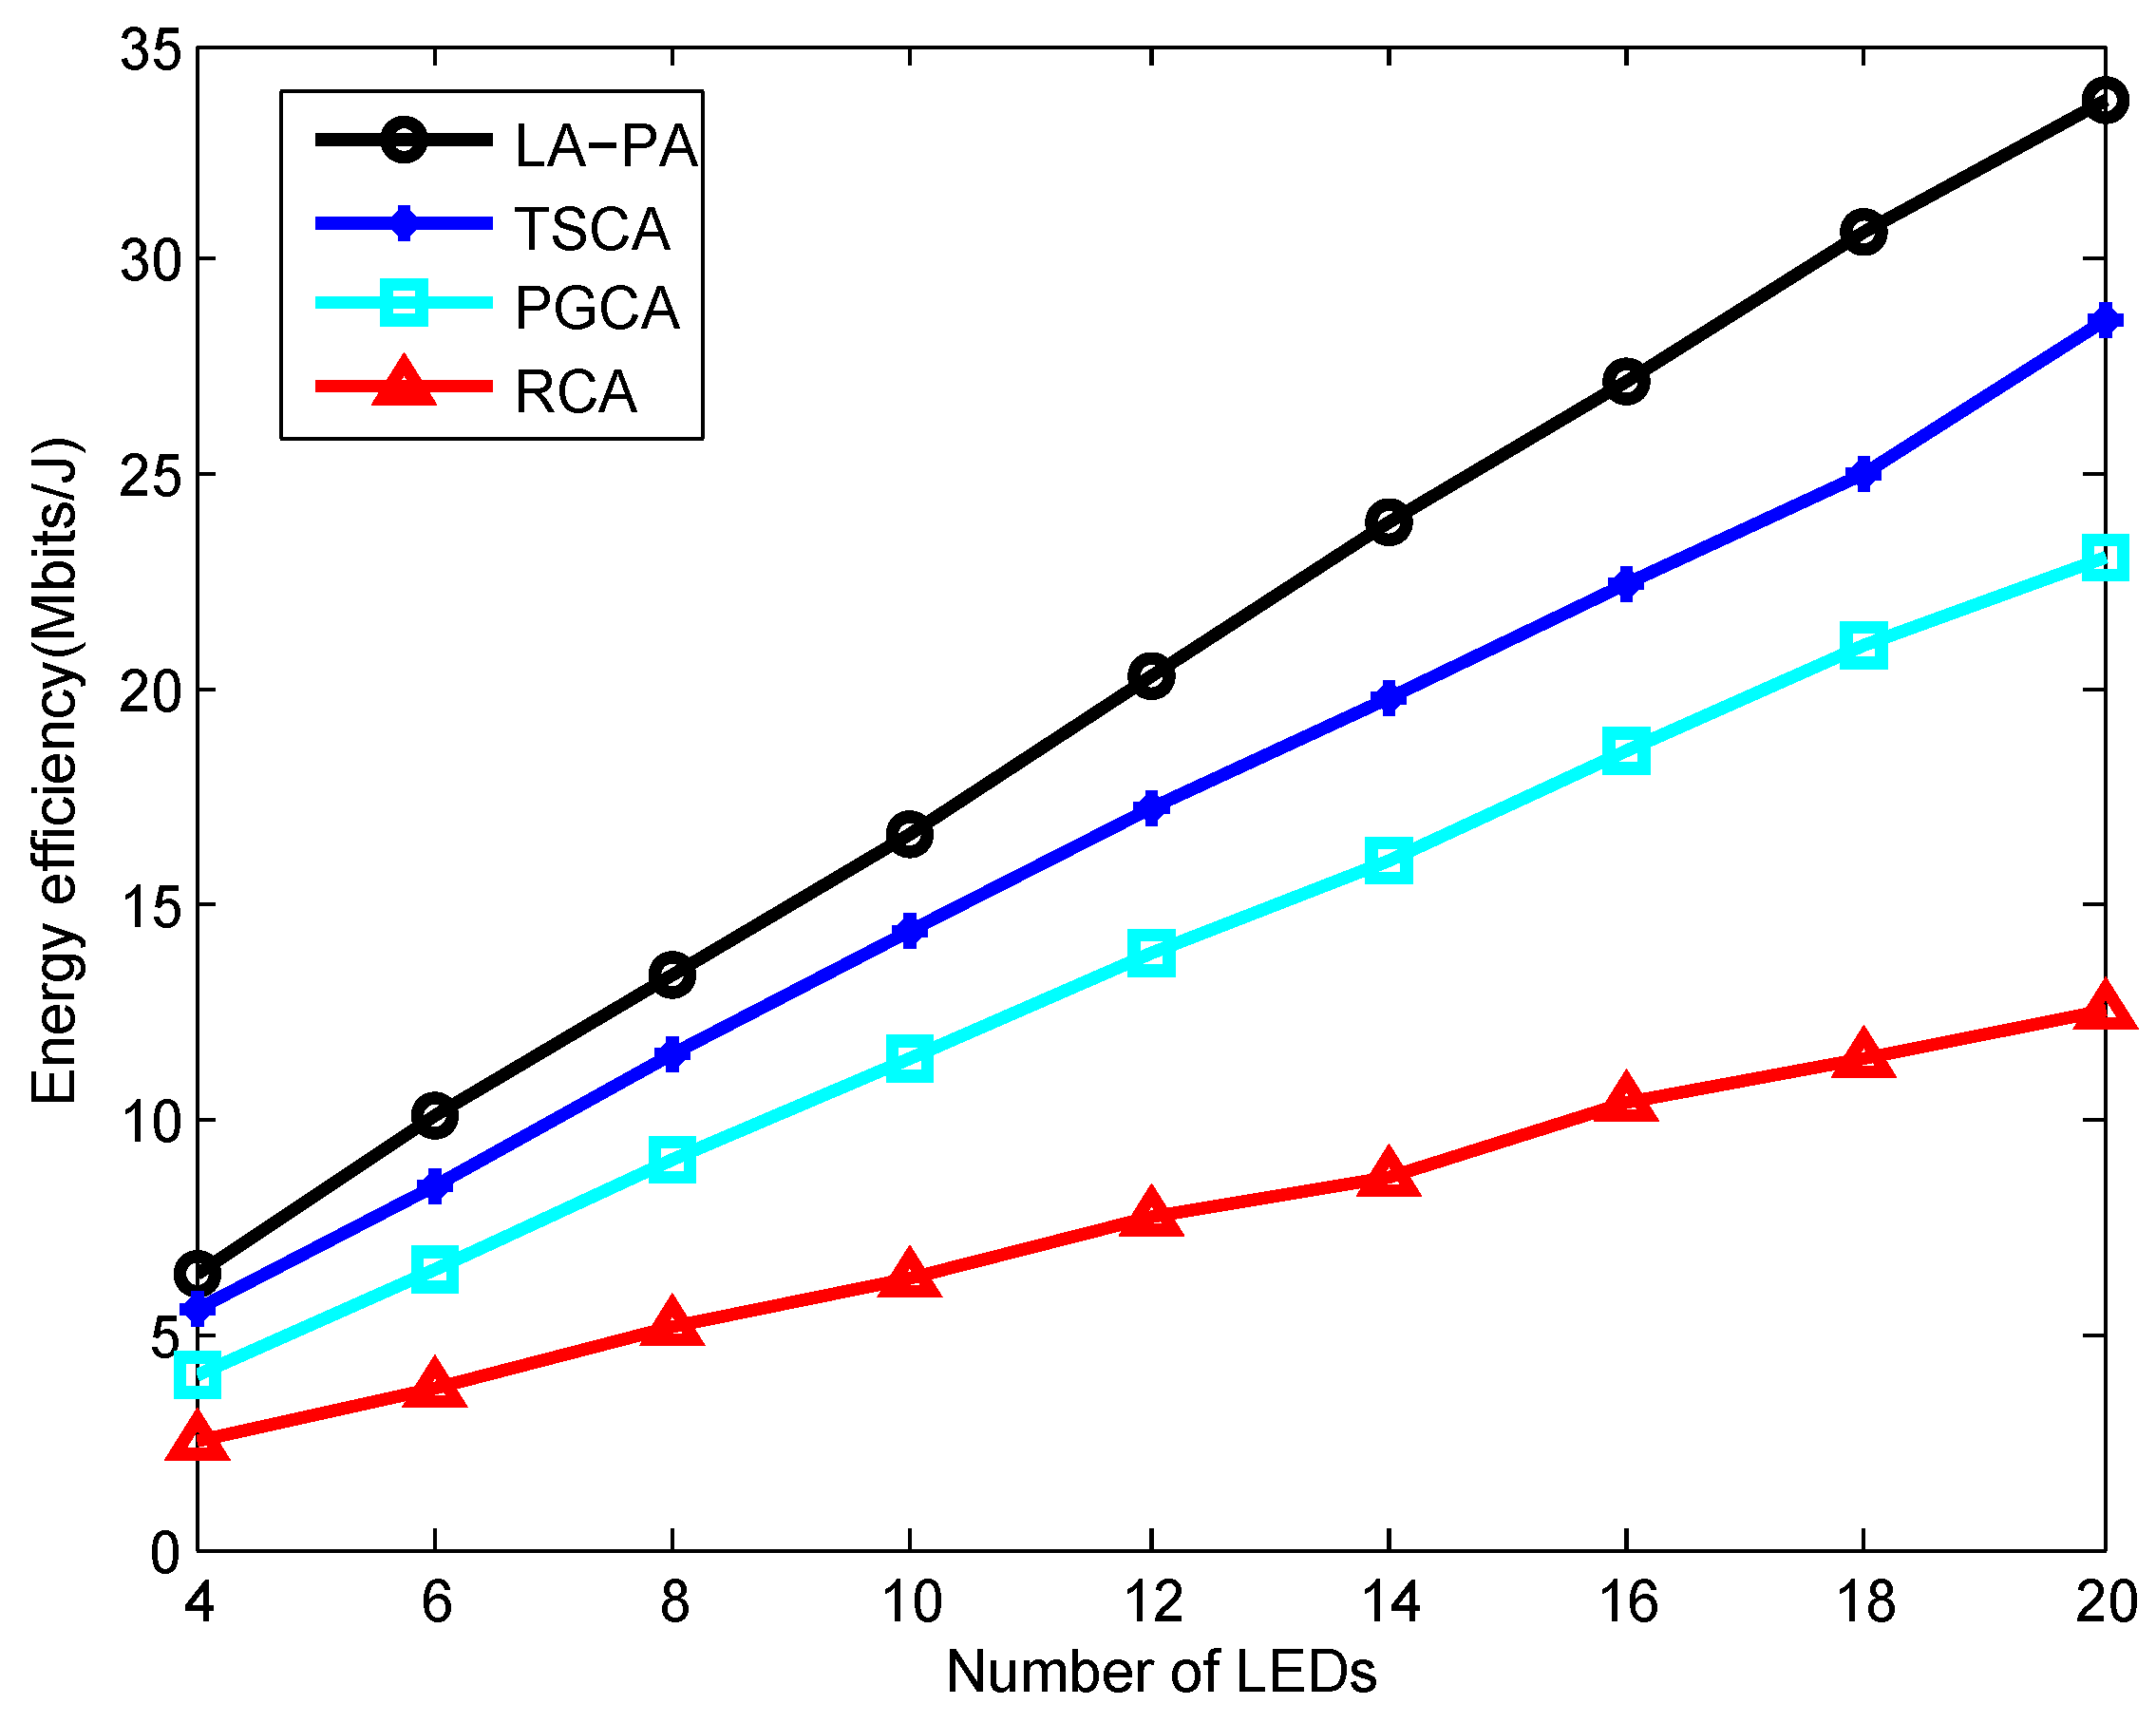
Table 2 shows the principles, advantages, and disadvantages of the existing grouping methods, including the RCA, TSCA, and PGCA. In the following simulation process, we adopt the proposed power allocation algorithm and compare the proposed LED association method with the above grouping algorithms. Figure 3 compares the energy efficiency of the VLC-NOMA system, with the number of LEDs under different grouping algorithms. It can be seen that the system EE for all algorithms increases with the number of LEDs. The RCA algorithm has a poor effect due to not considering the channel condition. The performance of the proposed joint LA–PA algorithm is obviously better than the performance of the PGCA algorithm. This is because the proposed algorithm takes into account not only the channel conditions, but also the maximum transmission power constraints, the power constraint required for SIC, and the power constraint of the DC bias condition. The performance of the proposed algorithm is close to the performance of the TSCA, while the complexity is reduced.
Table 3 shows the principles, advantages, and disadvantages of the existing power allocation algorithm, including FPA, FTPA, and FSPA. Figure 4 compares the energy efficiency of the VLC-NOMA system with the number of LEDs under the proposed LA–PA, the FPA, and FTPA algorithms. The FPA algorithm has a poor effect since the power distribution factor cannot dynamically adjust with the channel condition. The performance of the proposed algorithm is obviously better than the performance of the FTPA algorithm. This is because the proposed algorithm takes into account not only the channel conditions, but also the non-negative constraint of the LED signal, per-LED optical power constraint, and minimum data rate constraint.
Figure 5 compares the system EE for different power multiplexing factors of N. , 3, and 4. When the number of LEDs is unchanged, the system EE increases with the increase of N. Compared with the system EE for , the system EE for N = 3 increases more significantly than that for N = 4. This is because as the number of multiplexing LEDs increases, the signal interference between LEDs will also increase, resulting in the impact of SIC performance. It can also be seen that the EE of the VLC-NOMA system is higher than that of the VLC system based on OMA, and the performance advantage brought by NOMA is more obvious as the number of LEDs increases.
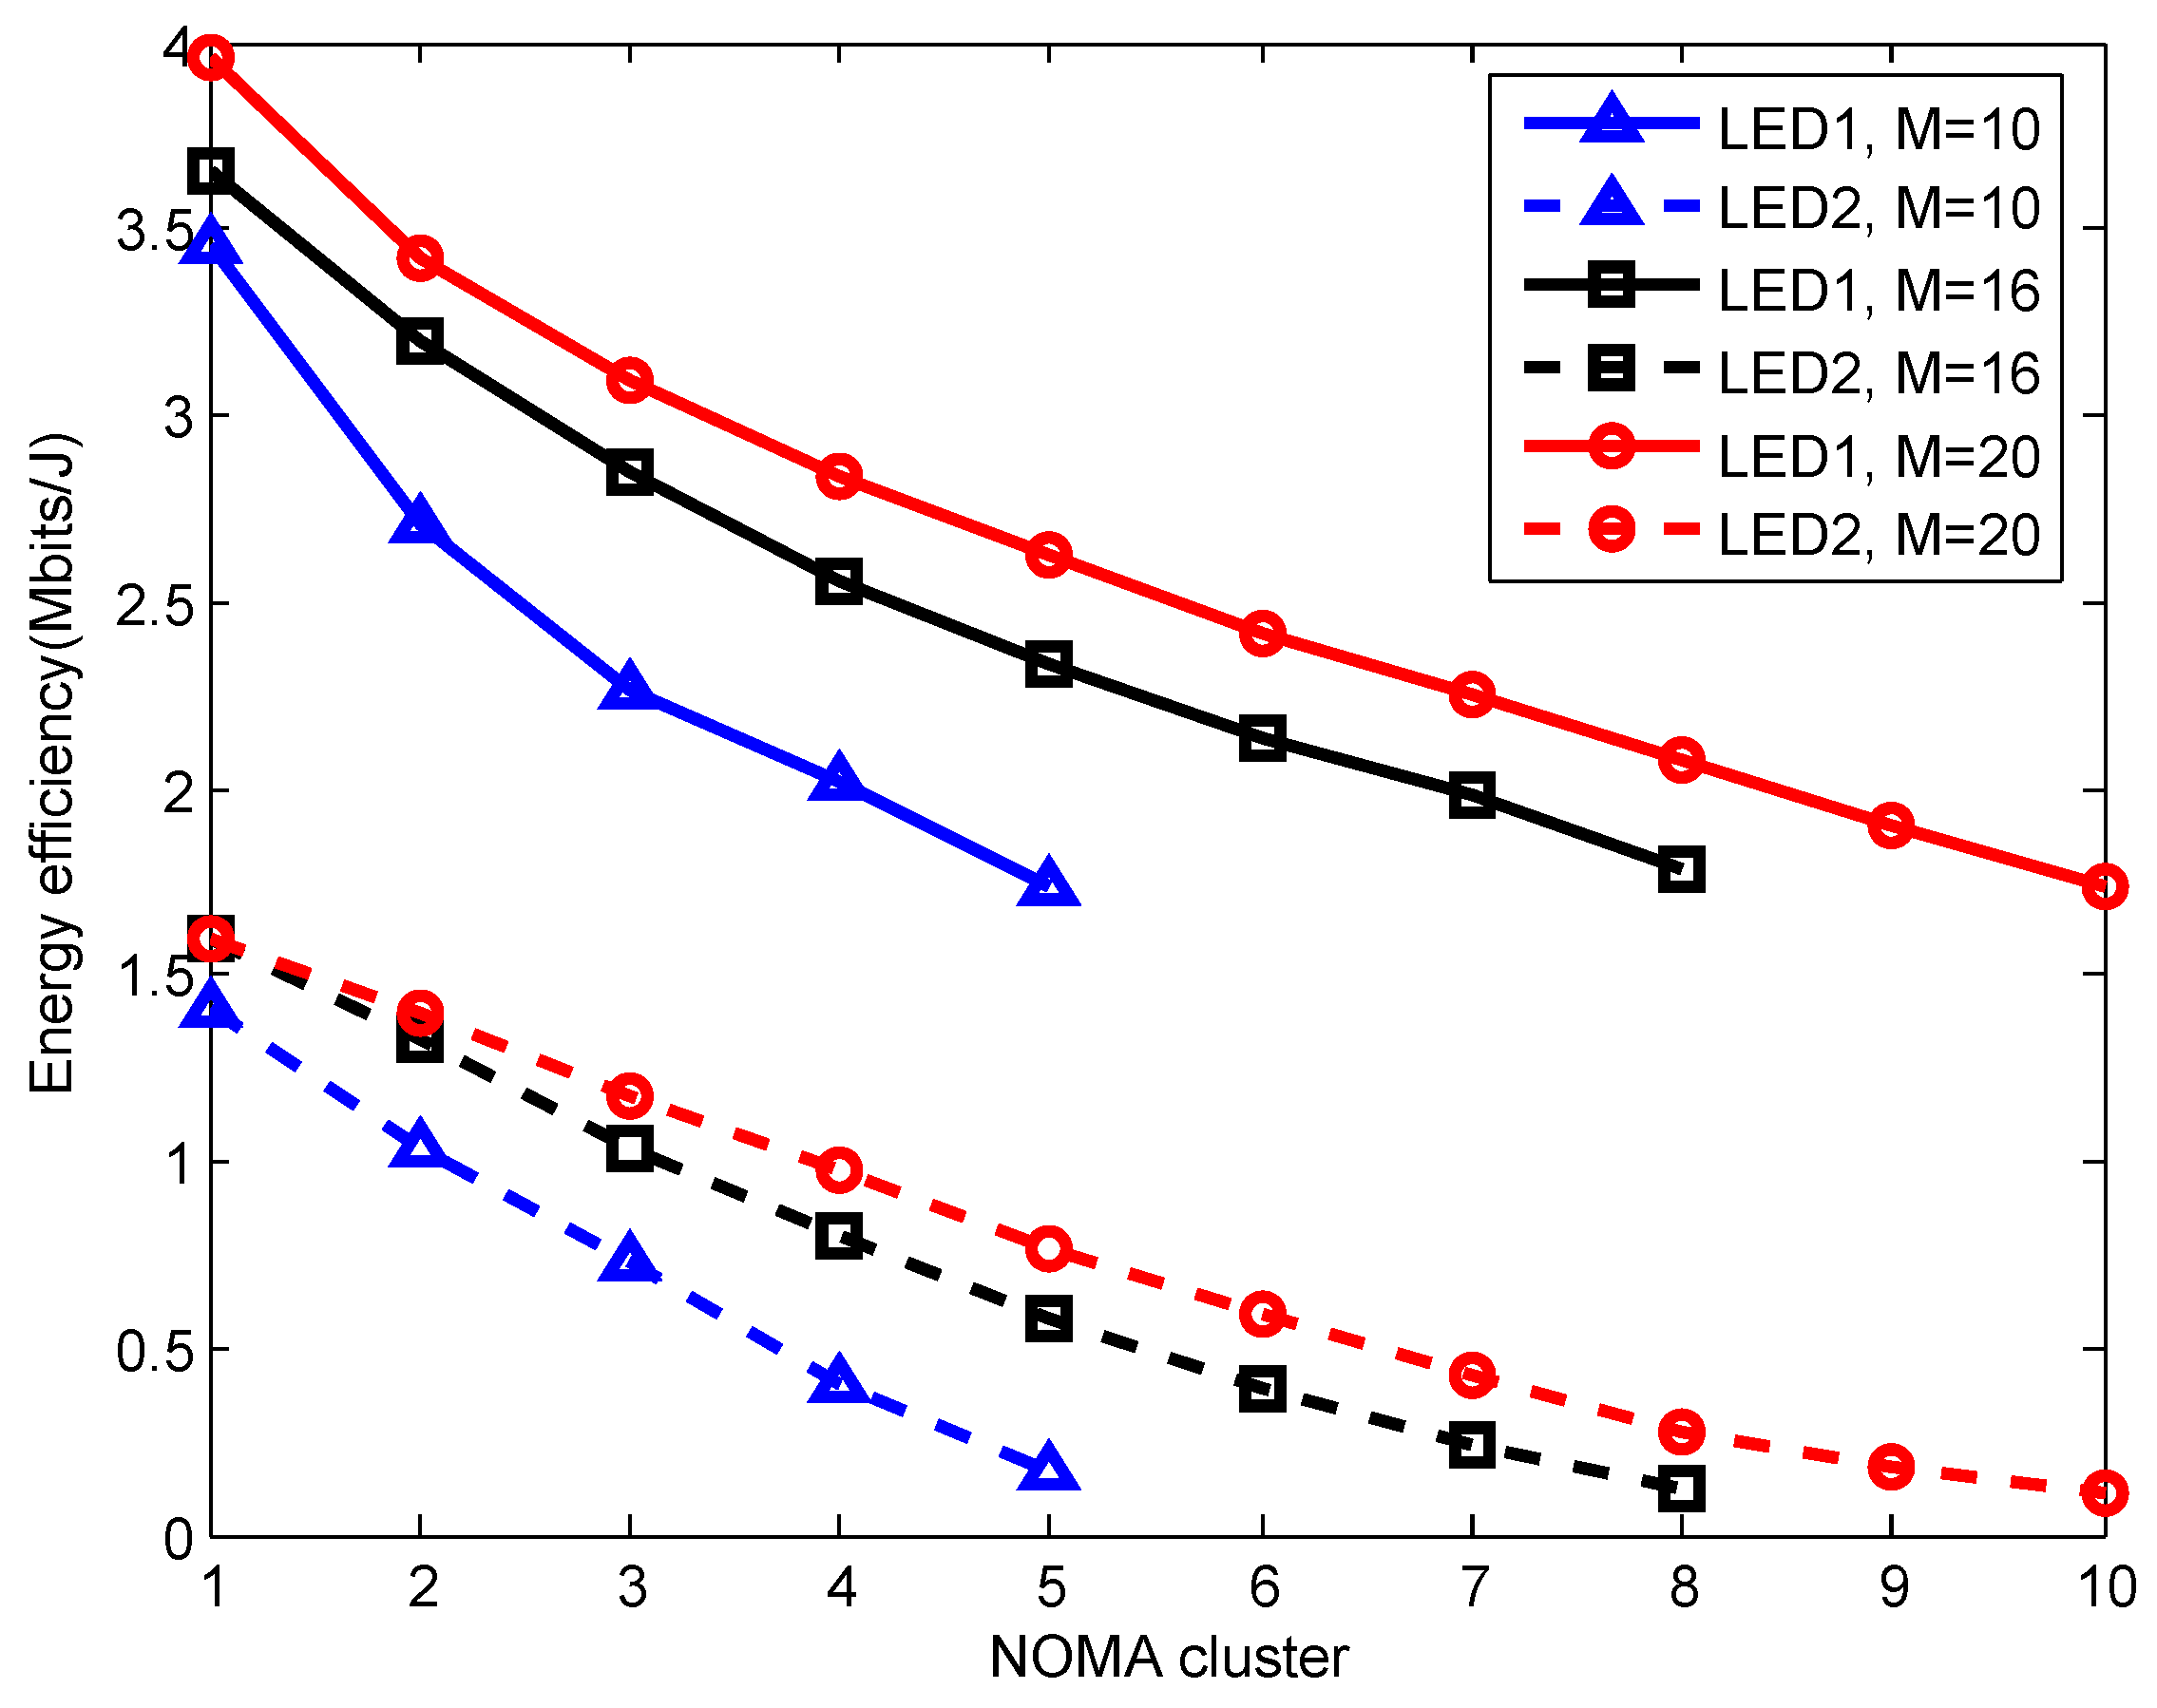
Figure 6 shows the system EE of each group for a different number of LEDs M. , 16, and 20. Since the LEDs are arranged in the descending order of channel gain, the EE of the first group is greater than that of the second group, the EE of the second group is greater than that of the third group, and so on. It can also be seen that the EE of each group is little different because the grouping strategy is adopted to maintain a relatively uniform channel gain difference between the LEDs of each group. In the same group, the EE of the LED detected first is higher than that of the LED detected later.
Figure 7 shows the system EE for different irradiance angle steps. The irradiance angle interval of the LEDs is [30,40], [40,60], and [40,70], respectively. The irradiance angle step is defined as the difference of the irradiance angle, then the irradiance angle step in the figure is 10, 30, and 30, respectively. As can be seen, when the number of LEDs is unchanged, the system EE increases as the irradiance angle step increases. If the irradiance angle of LEDs is very close, it will affect the system EE. When the irradiance angle step is 30, the EE with interval [40,70] is better than that with interval [30,60]. This is because the optical channel gain is related to the irradiance angle of the LEDs. If the irradiance angle increases, the channel gain increases.
Figure 8 shows the system EE for different irradiance angle interval. The irradiance angle interval is [30,60], [30,45,60], [15,30,45,60] and [15,30,45,60,75]. The irradiance angle step is 30, 15, 15 and 15, respectively. Different from Figure 3, the system EE for the irradiance angle step 30 is lower than that for the irradiance angle step 15. This is because the number of irradiance angles in [30,60] less than that in other intervals. With more irradiance angles, the channel conditions become more abundant, and the system performance improves. When the irradiance angle step is unchanged, the system EE increases with the expansion of the irradiance angle interval.
Figure 9 shows the variation of the system EE with distance for different irradiance angle intervals. . The linear distance between LEDs and PD is the same d. It can be seen that the system EE under different irradiance angle intervals decreases with the increase of d. When d is unchanged, the system EE under different irradiance angle intervals is not much different. That is, when the linear distance between the LEDs and PD is the same, expanding the irradiance angle interval mildly improves the system EE.
Figure 10 shows the variation of the system EE for different distance steps. The linear distance range of the LEDs and PD is [0.5:0.25:2], [0.5:0.5:2], and [0.5:1:2]. Define the distance step as the linear distance difference between the LED and PD, then the distance step is 0.25, 0.5, and 1, respectively. It can be seen that the system EE decreases with the increase of the distance step. This is because the channel gain is inversely proportional to the distance between the transceiver devices. As the distance step increases, the distance between the transceiver devices is further away, resulting in a smaller channel gain between the transceiver devices.
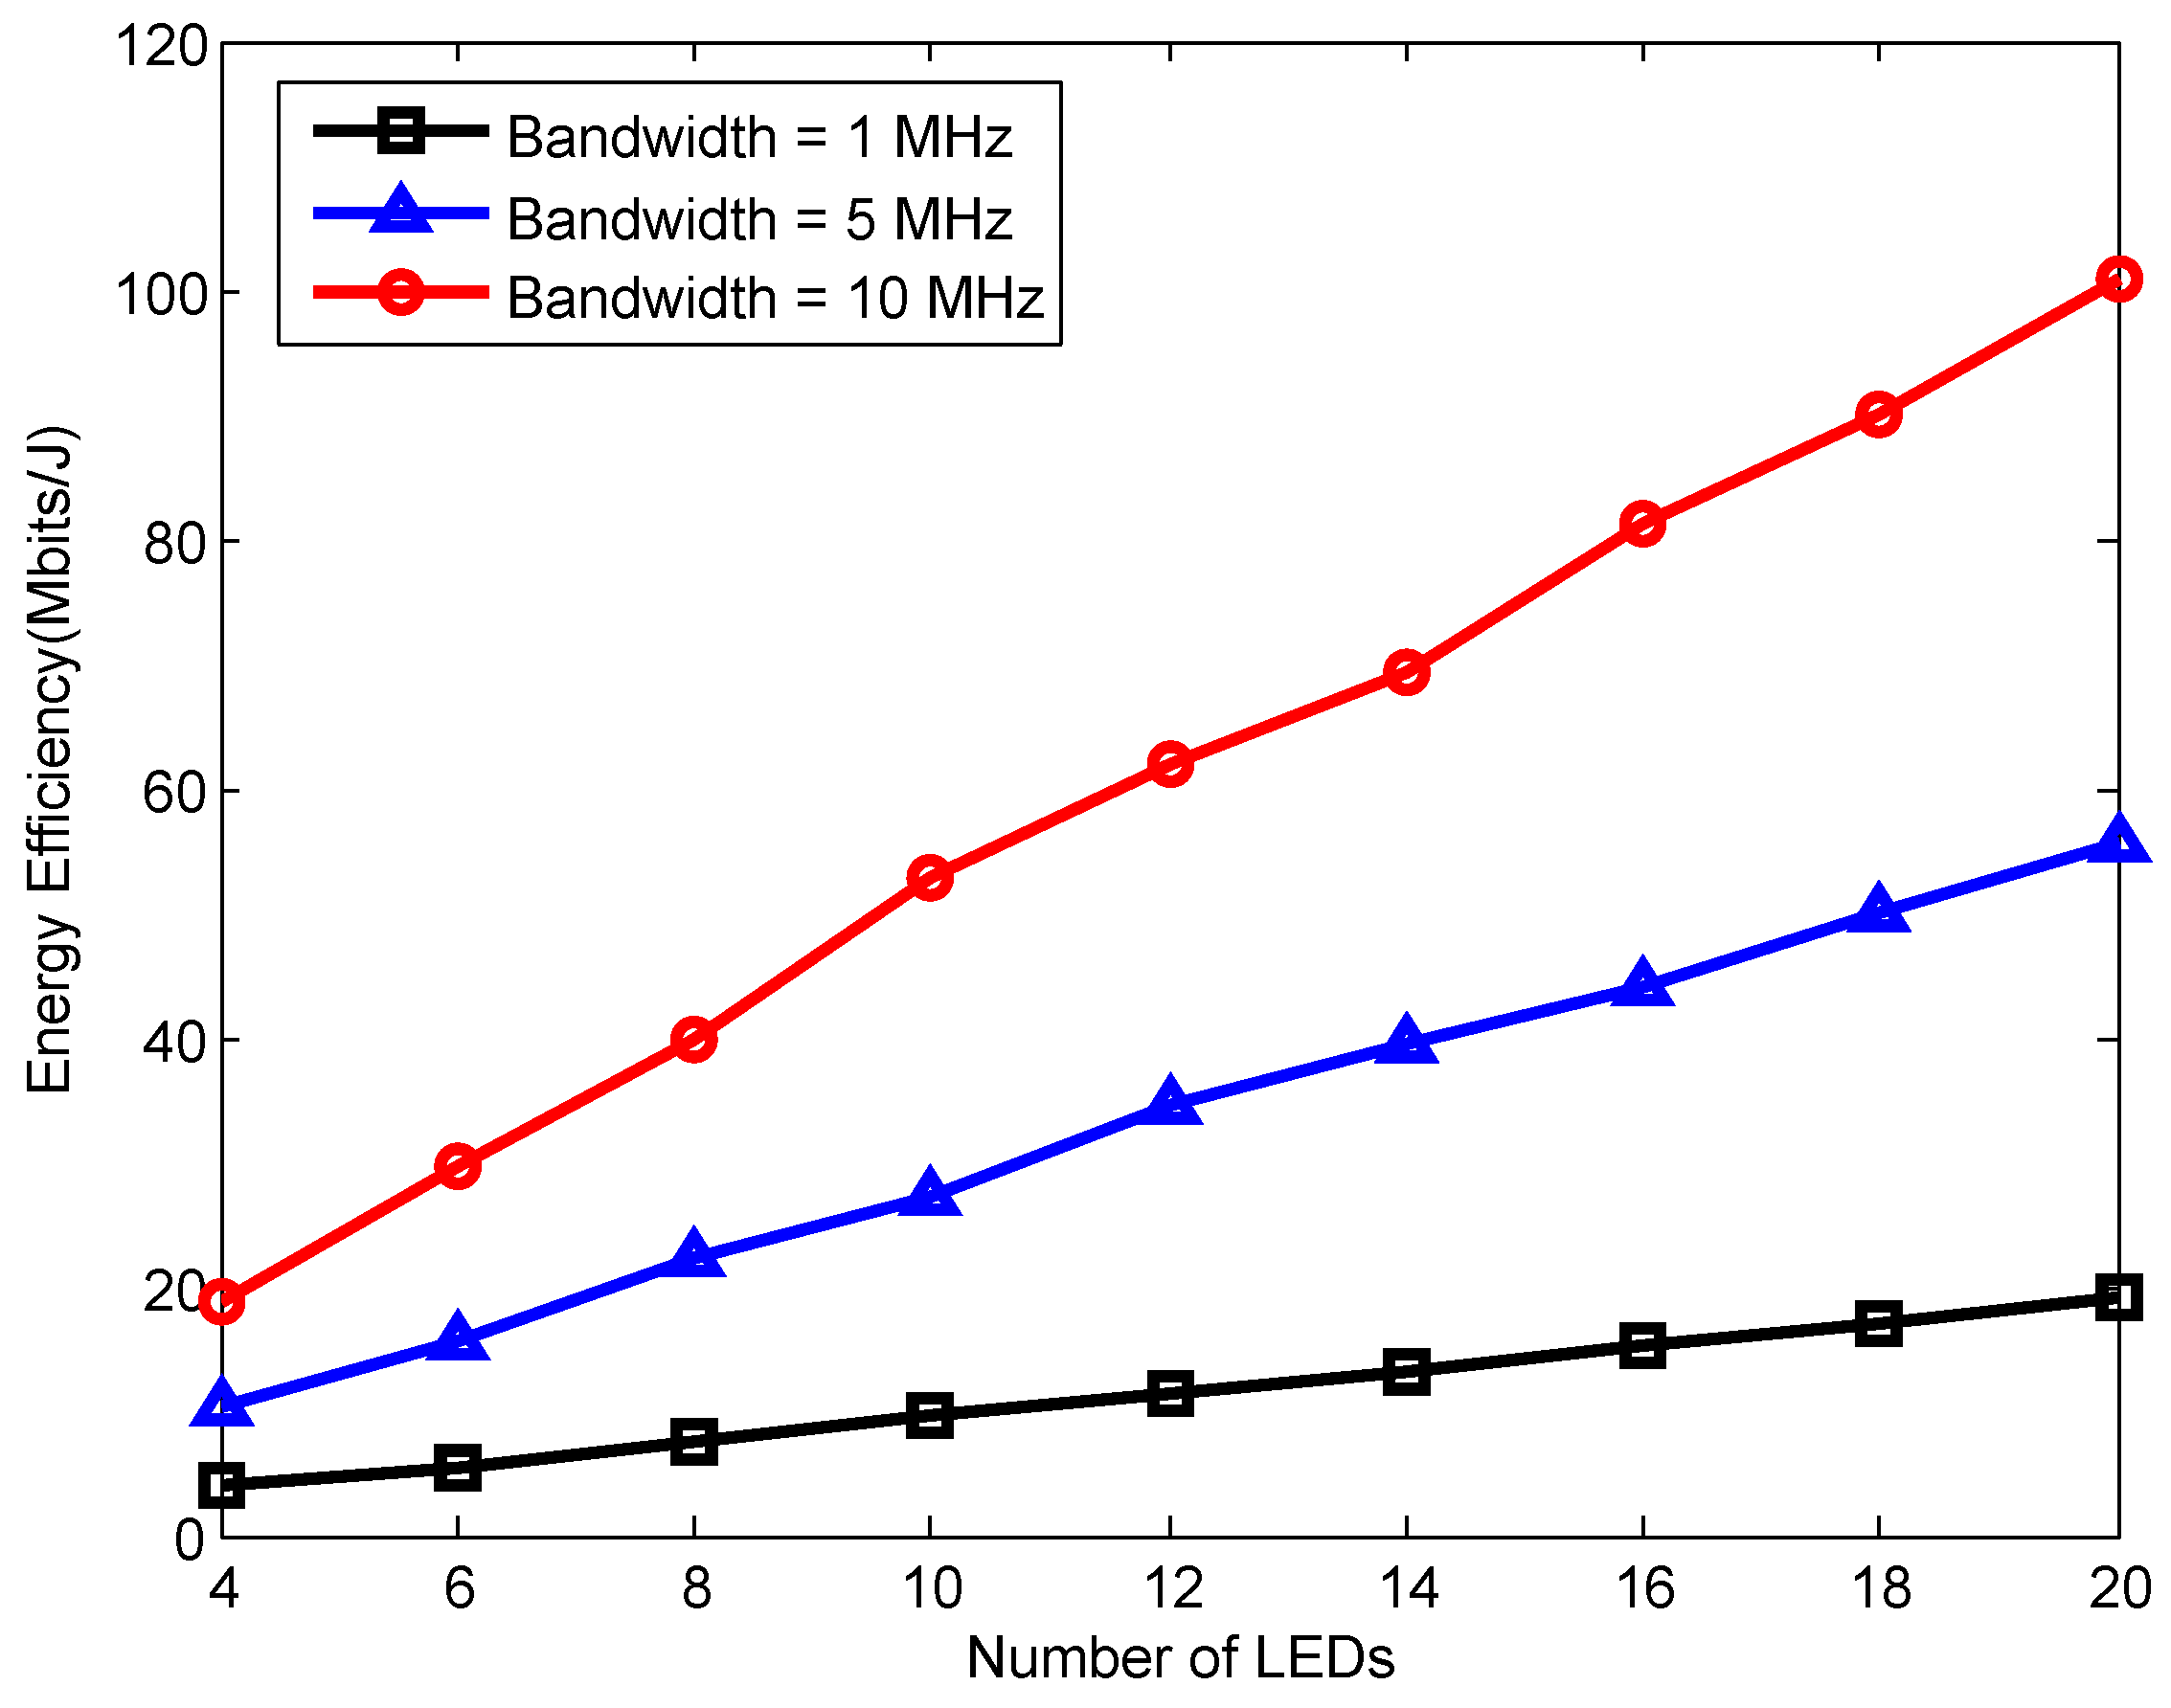
Figure 11 shows the performance comparison for different transmission bandwidths of the proposed resource allocation method. When the bandwidth is 1 MHz, as the number of LEDs increases, the efficiency shows a steady rise. As the bandwidth increases to 5 MHz, the efficiency shows a higher increase with the increase in the number of LEDs. This indicates that with the increase in bandwidth, the system can support more LEDs more effectively. With a further increase in bandwidth to 10 MHz, the efficiency exhibits a more pronounced upward trend as the number of LEDs increases. This indicates that a wider bandwidth can support more LEDs, and the efficiency of the system significantly improves with the increase in the number of LEDs.
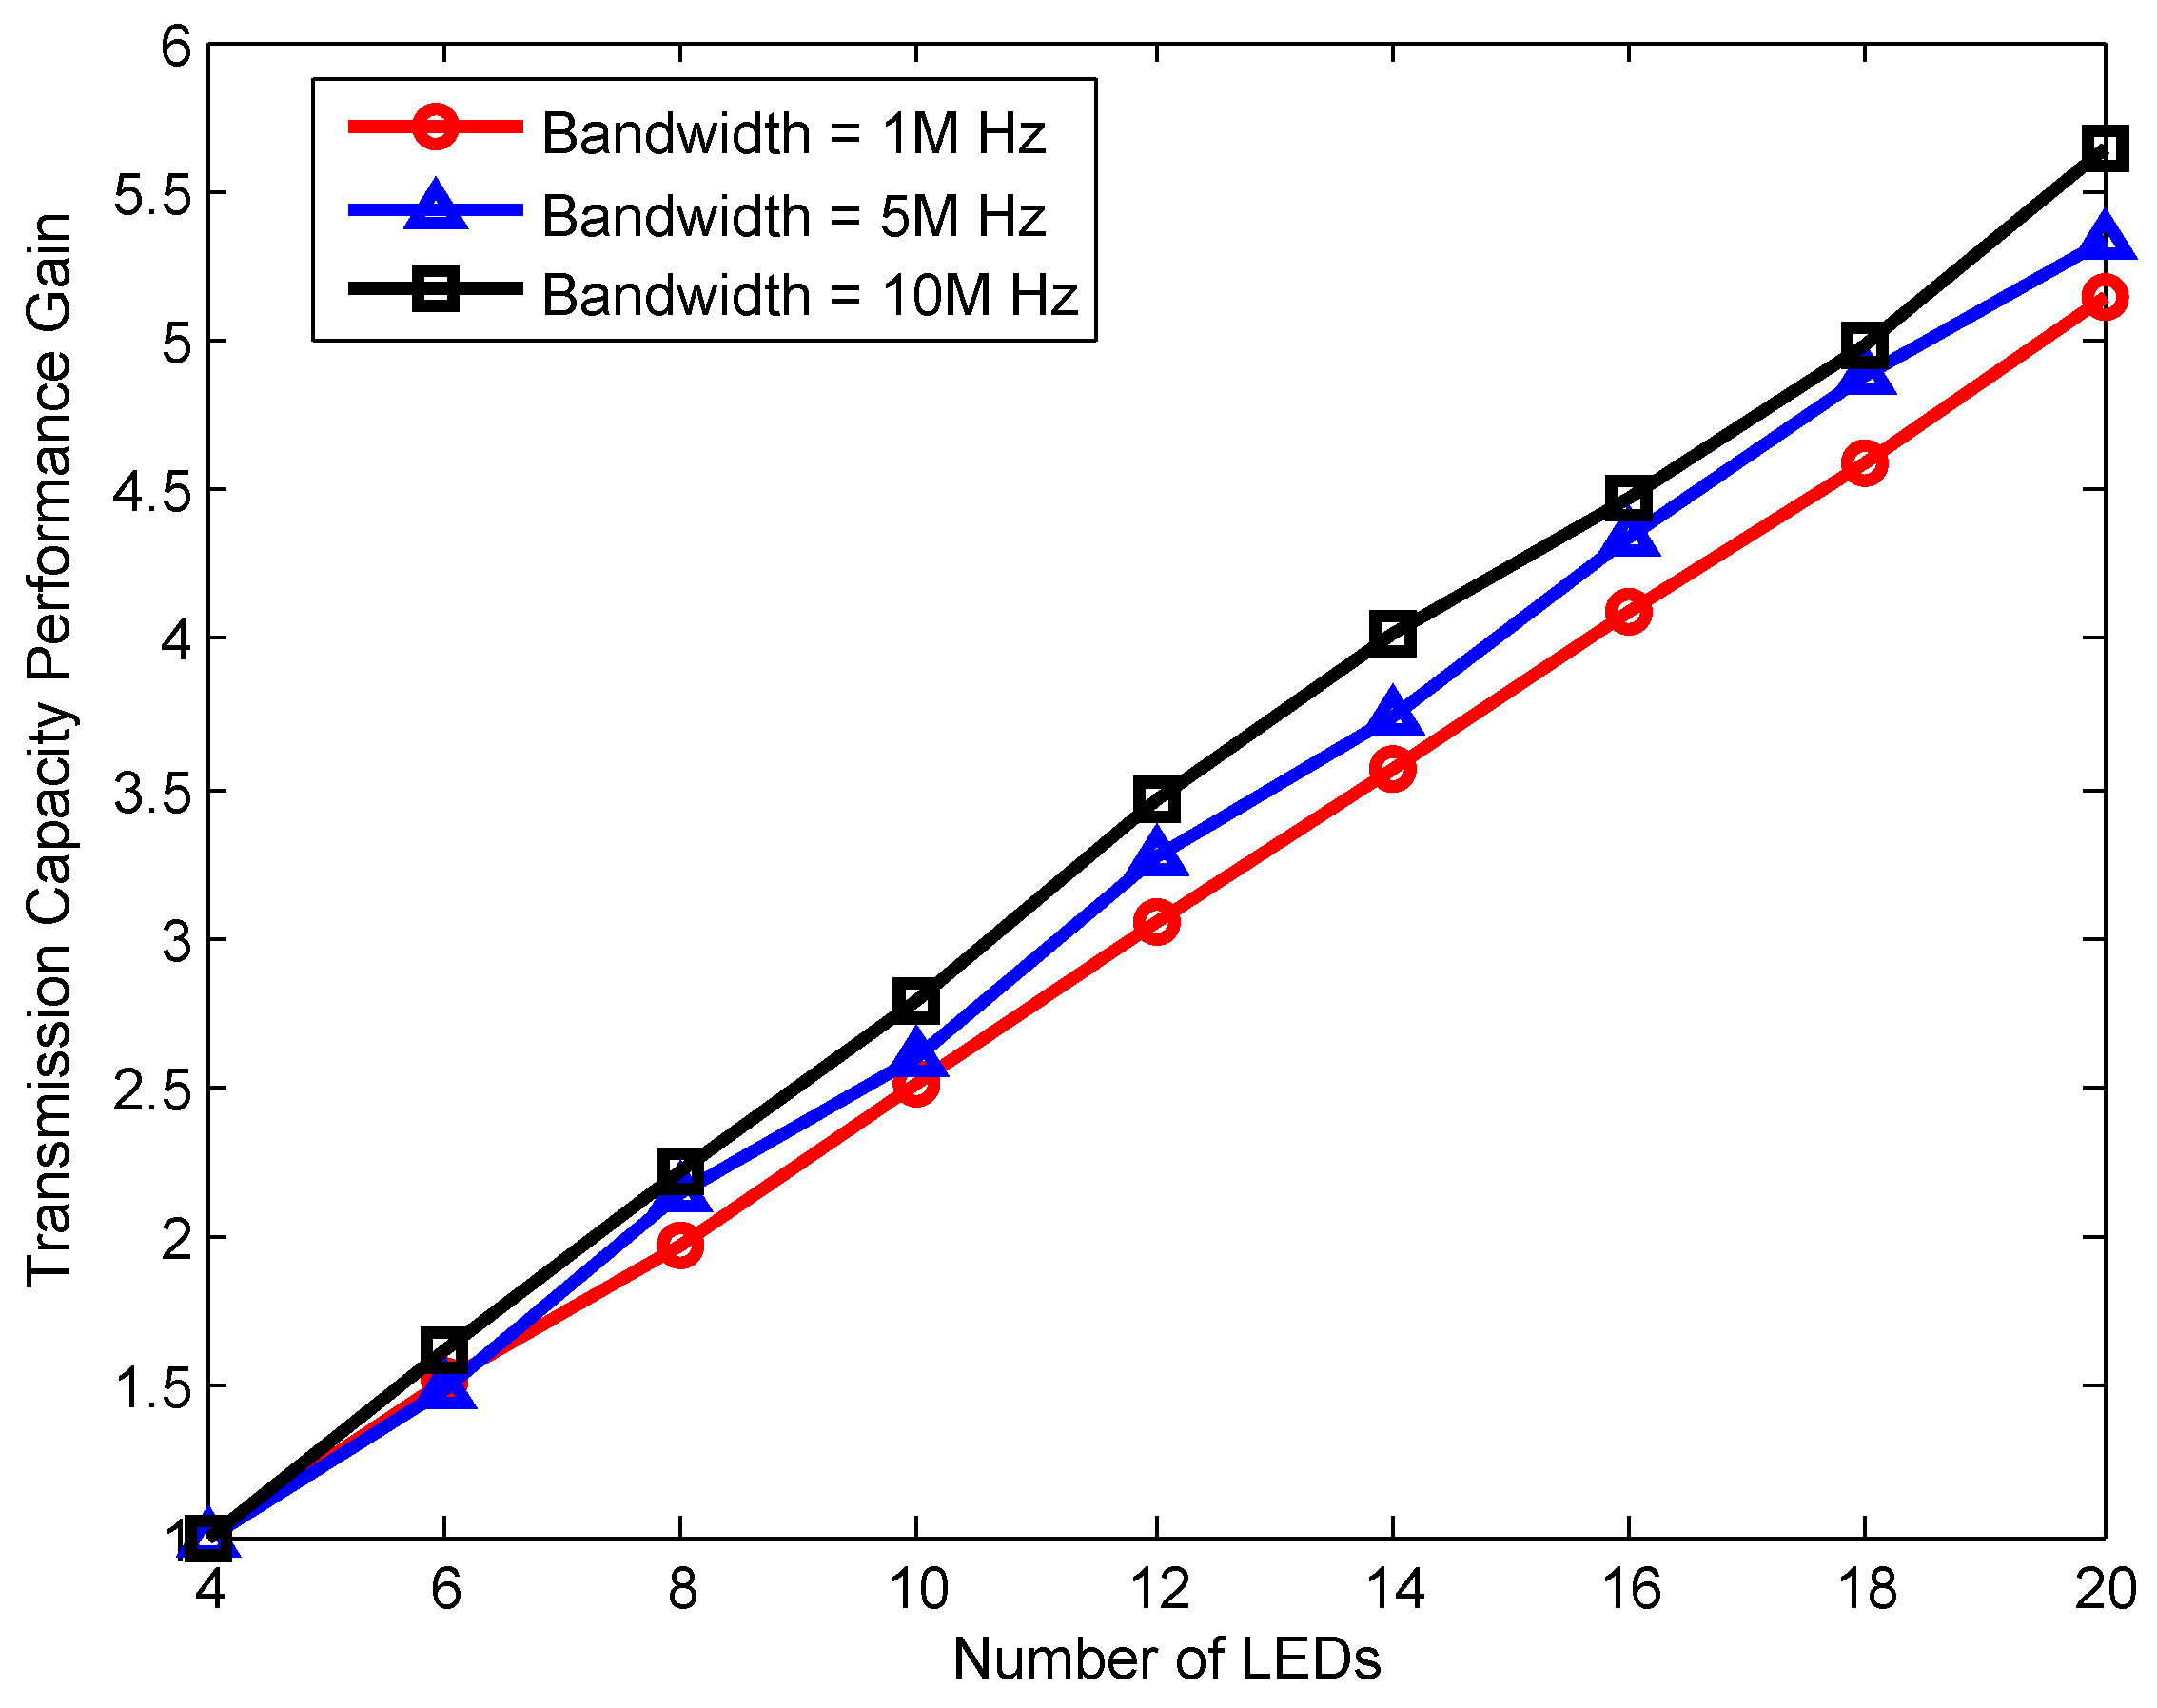
Figure 12 shows the transmission capacity performance gain for different transmission bandwidths, where the transmission capacity of the four LEDs is used as a benchmark. We can see that as the number of LEDs increases, the transmission capacity performance increases proportionally. As an example, if the number of LEDs is 16, the transmission capacity is 4∼4.5 times that of the number of LEDs, which is 4. If the number of LEDs is 10, the transmission capacity is 2.5∼3 times. When the number of LEDs is unchanged, the transmission capacity performance gain increases as the transmission bandwidth increases.
Figure 13 shows the outage probability performance comparison varying with the SNR of LED1 for different . For different , the outage probability of LED1 is always lower than that of LED2. This is because the LED1 detected first is usually in a more favorable channel condition, experiencing less interference. Consequently, the signal quality of the first detected LED is higher, resulting in a lower outage probability. It can be seen that with the increase of , the outage probability of LED1 is reduced, while the probability of LED2 is improved. This is because when the detection threshold at the SIC receiver increases, the less interference the first LED receives from the second LED. However, the transmit power of the second LED is lower, resulting in an increased probability of interruption for the second LED.
In Figure 14, three scenarios for different PD’ locationss are considered. The number of LEDs is 4, and the locations of the LEDs can be seen in the figure. In the first (blue circle), PD is located in the central space of the room, whereas in the second (green circle), PD is located in the middle space of two LEDs, while in the third (grown circle), PD is located around one LED.
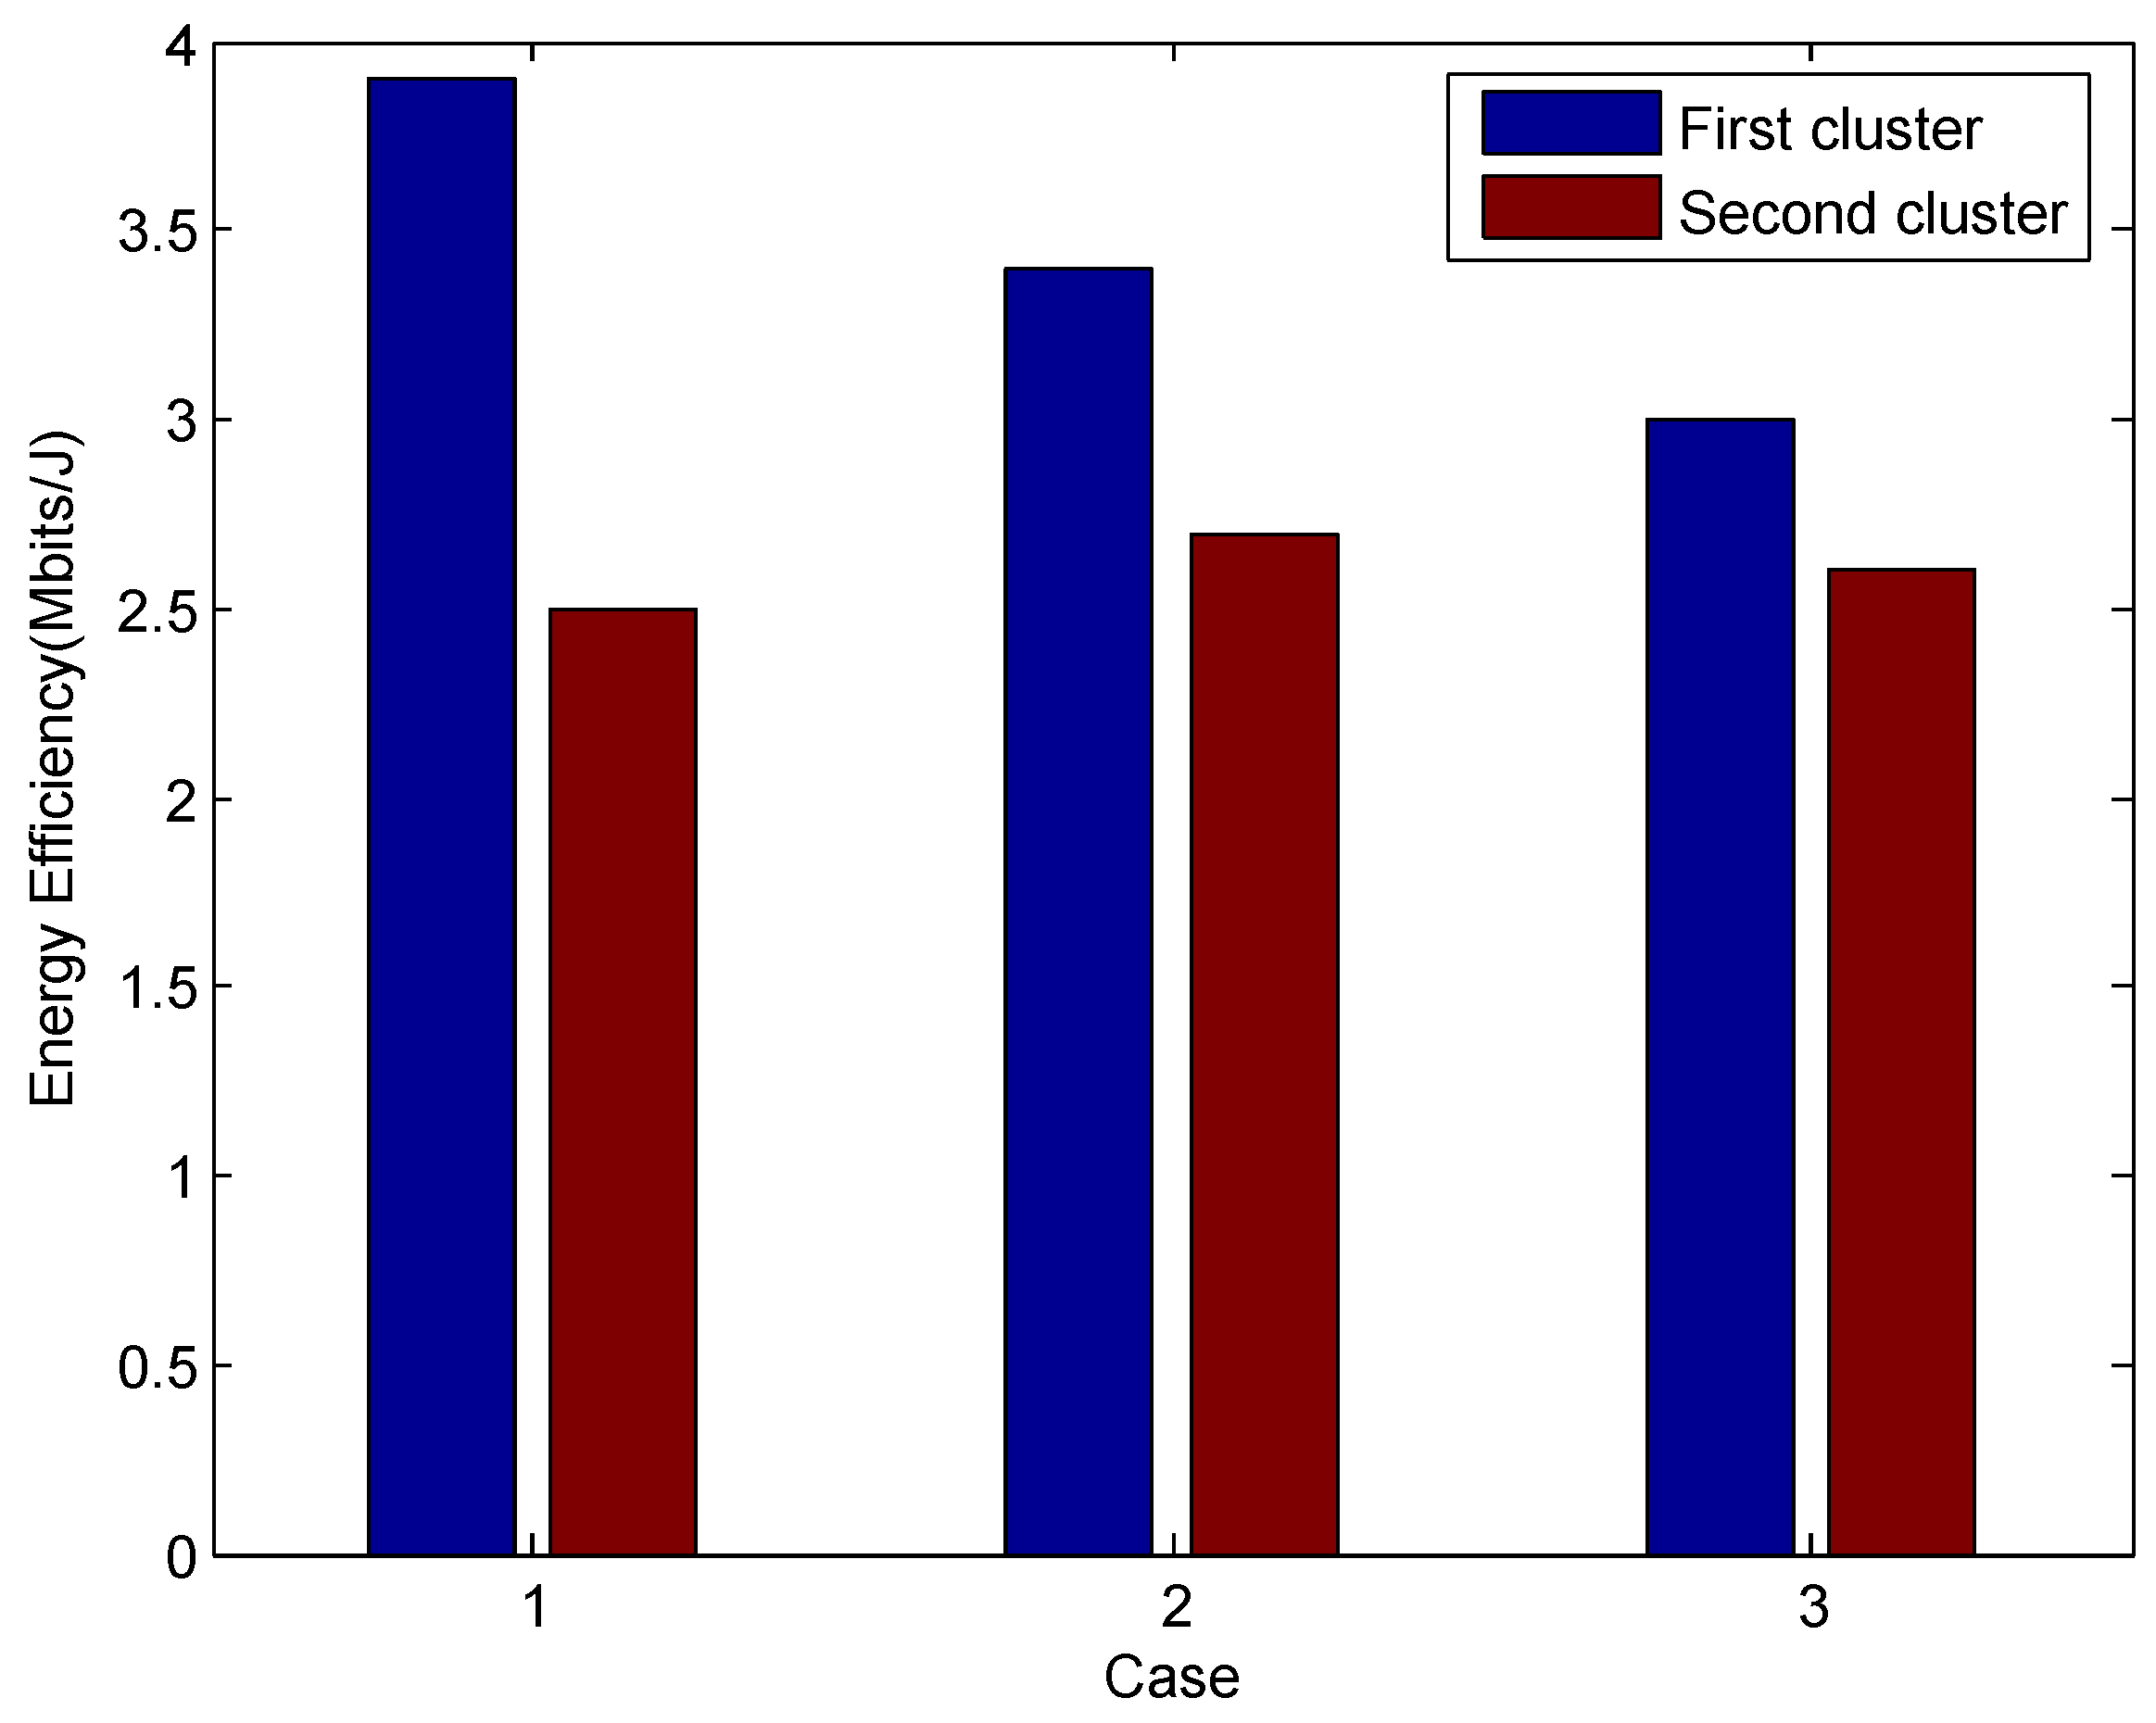
Figure 15 shows the EE performance comparison for different clusters. There are three cases of clusters, i.e., case I: (LED2, LED4) and (LED 1, LED 3), case II: (LED 2, LED 3) and (LED 1,LED 4), case 3: (LED 2,LED 1) and (LED 3,LED 4). The EE performance of each case for a different cluster is presented in the figure. We can see that the EE of the first cluster always exceeds that of the second cluster; this is because the difference of channel gain of the first cluster is higher than the second cluster, which contributes a lower power consumption. Additionally, the sum of EE of the two clusters in case I is the highest; thereby, we can select case I as the optimal NOMA cluster.
6. Challenges and Future Directions for NOMA-Based VLC Networks
Based on our learning from the existing work in the literature, in this section, we explore various research aspects that need to be considered and investigated in future works. (1) Multi-User Interference Management: NOMA technology requires the effective management of interference among multiple users. In VLC systems, interference may be more pronounced due to the propagation characteristics of optical signals. Therefore, there is a need to design and optimize interference management mechanisms to ensure efficient multi-user communication. (2) Resource Allocation and Scheduling: NOMA technology requires effective resource allocation in the frequency or code domain to meet the communication needs of different users. In VLC systems, resource allocation and scheduling may be more challenging due to limited spectrum resources and specific constraints of the visible light spectrum. Future research can explore how to better utilize spectrum resources in VLC systems and design adaptive resource allocation algorithms. (3) Channel Modeling and Optimization: Accurate channel modeling is crucial for NOMA-based VLC systems for performance analysis and optimization. Due to the complexity of propagation characteristics of visible light signals under different environmental conditions, further improvements in channel modeling methods are needed. Additionally, signal processing and optimization algorithms should be designed to enhance system performance. (4) User Fairness: While NOMA technology improves system throughput, it may lead to fairness issues among users. In VLC systems, some users may be favored over others due to differences in distance and receiver characteristics. Therefore, fair resource allocation strategies need to be designed to ensure that all users receive reasonable communication quality of service. (5) Hybrid Communication Systems: Future VLC systems may integrate with other wireless communication technologies, such as Wi-Fi, Bluetooth, etc., to provide comprehensive coverage and higher network capacity. In such cases, NOMA-based VLC systems need to work effectively with other communication technologies and address issues such as resource management and interference coordination across technology boundaries.
7. Conclusions
This study investigates the energy efficiency optimization design of NOMA-based VLC systems, presenting a joint user pairing and power allocation scheme aimed at identifying LED associations that maximize EE when coupled with appropriate power allocation strategies. Initially, an optimization model predicated on EE maximization is formulated. Through the transformation of the non-convex optimization problem into a convex function, an iterative algorithm is devised to ascertain the optimal power allocation, given established LED associations. Subsequently, a joint LED association and power allocation algorithm is proffered to maximize EE. Conclusively, simulation results shows that when the number of LEDs is 20, compared with the TSCA and PGCA schemes, the EE of LA–PA is improved by about 21% and 47%, respectively. Compared with the FTPA and FPA schemes, the EE of LA–PA is improved by about 12% and 40%, respectively. Additionally, an analysis of the impact of the system parameters, such as the power multiplexing factor, irradiance angle step, irradiance angle interval, and distance step, on energy efficiency is provided. The next step of work is intended to consider the seamless integration of VLC and RF communication in practical systems, as well as the energy-constrained issues of Internet of Things (IoT) devices in real-life scenarios. Research will focus on the problem of energy-aware communication based on hybrid VLC/RF relay networks. Furthermore, the NLoS VLC channel path loss model is intended to be considered for indoor VLC, as well as the impact of multipath transmission on energy efficiency, throughput, transmission reliability, and BER of NOMA-based VLC transmission.
Author Contributions
Y.W. designed the algorithm, performed the theoretical analysis, and wrote the manuscript. X.L. (Xiaoshuang Liu) and X.L. (Xiaoran Lin) implemented the simulation and contributed to the manuscript preparation. L.S. contributed to polishing the revised manuscript and provided suggestions on simulation evaluation. All authors have read and agreed to the published version of the manuscript.
Funding
This work has been supported by the National Natural Science Foundation of China (61902107), Science Research Project of Hebei Education Department (QN2021056), Science Research and Development Project of Hebei University of Economics and Business (2022YB05).
Data Availability Statement
The data presented in this study are available upon request from the corresponding authors.
Conflicts of Interest
The authors declare no conflicts of interest.
Appendix A
Since , the closed-form of the lower bound (7) can be obtained by finding the distribution that maximizes . According to the definition of differential entropy [32],
is concave; thus, finding the distribution that maximizes is formulated as
The Lagrangian function of problem (A2) is given by
where , , and are Lagrange multipliers associated with (4). Let the first derivation of the function L with respect to be equal to 0,
Thus, the optimal distribution is
Substitute (A5) into (4), and we can obtain (9a), (9b), and (9c), respectively. Substitute (A5) into (A1), and we can obtain as
Thus, we can obtain as follows
Substitute (A7) into (7), and (8) can be obtained.
References
- Zhou, Y.; Liu, L.; Wang, L.; Hui, N.; Cui, X.; Wu, J.; Peng, Y.; Qi, Y.; Xing, C. Service-aware 6G: An intelligent and open network based on the convergence of communication, computing, and caching. Digit. Commun. Netw. 2020, 6, 253–260. [Google Scholar] [CrossRef]
- Matheus, L.E.M.; Vieira, A.B.; Vieira, L.F.M.; Vieira, M.A.M.; Gnawali, O. Visible Light Communication: Concepts, Applications and Challenges. IEEE Commun. Surv. Tutor. 2019, 21, 3204–3237. [Google Scholar] [CrossRef]
- Hassan, R.; Flayyih, M.S.; Mahdi, A.; Inn, A.; Sadeq, A.S.; Murad, D.F. Visibile Light Communication Technology For Data Transmission Using Li-Fi. In Proceedings of the 2020 2nd International Conference on Computer and Information Sciences (ICCIS), Sakaka, Saudi Arabia, 13–15 October 2020. [Google Scholar]
- Meucci, M.; Seminara, M.; Nawaz, T.; Caputo, S.; Mucchi, L.; Catani, J. Bidirectional Vehicle-to-Vehicle Communication System Based on VLC: Outdoor Tests and Performance Analysis. IEEE Trans. Intell. Transp. Syst. 2021, 23, 11465–11475. [Google Scholar] [CrossRef]
- Ata, Y.; Abumarshoud, H.; Bariah, L.; Muhaidat, S.; Imran, M.A. Intelligent Reflecting Surfaces for Underwater Visible Light Communications. IEEE Photonics J. 2023, 15, 7300609. [Google Scholar] [CrossRef]
- Kolade, O.; Cheng, L. Memory Channel Models of a Hybrid PLC-VLC Link for a Smart Underground Mine. IEEE Internet Things J. 2022, 9, 11893–11903. [Google Scholar] [CrossRef]
- Xu, B.; Hussain, B.; Liu, X.; Min, T.; Cheng, H.C.; Yue, C.P. Smart-Home Control System Using VLC-Enabled High-Power LED Lightbulb. In Proceedings of the 2021 IEEE 10th Global Conference on Consumer Electronics (GCCE), Kyoto, Japan, 12–15 October 2021. [Google Scholar]
- Sivasakthi, T.; Palani, U.; Vasanthi, D.; Subhashree, S.; Roshini, S.; Saundariya, K. Underwater Communication Through Li-Fi for Data Transmission. In Proceedings of the 2021 International Conference on System, Computation, Automation and Networking (ICSCAN), Puducherry, India, 30–31 July 2021. [Google Scholar]
- Costanzo, A.; Loscri, V.; Biagi, M. Adaptive Modulation Control for Visible Light Communication Systems. J. Light. Technol. 2021, 39, 2780–2789. [Google Scholar] [CrossRef]
- Kisacik, R.; Yagan, M.Y.; Uysal, M.; Pusane, A.E.; Yalcinkaya, A.D. A New LED Response Model and its Application to Pre-Equalization in VLC Systems. IEEE Photonics Technol. Lett. 2021, 33, 955–958. [Google Scholar] [CrossRef]
- Wang, C.; Yang, Y.; Yang, Z.; Feng, C.; Cheng, J.; Guo, C. Joint SIC-Based Precoding and Sub-Connected Architecture Design for MIMO VLC Systems. IEEE Trans. Commun. 2023, 71, 1044–1058. [Google Scholar] [CrossRef]
- Mohsan, S.A.H.; Sadiq, M.; Li, Y.; Shvetsov, A.V.; Shvetsova, S.V.; Shafiq, M. NOMA-Based VLC Systems: A Comprehensive Review. Sensors 2023, 23, 2960. [Google Scholar] [CrossRef]
- Dai, L.; Wang, B.; Ding, Z.; Wang, Z.; Chen, S.; Hanzo, L. A Survey of Non-Orthogonal Multiple Access for 5G. IEEE Commun. Surv. Tutor. 2018, 20, 2294–2323. [Google Scholar] [CrossRef]
- Yang, F.; Ji, X.; Liu, X.; Peng, M. Power Allocation Optimization for NOMA based Visible Light Communications. In Proceedings of the 2021 IEEE Wireless Communications and Networking Conference (WCNC), Nanjing, China, 29 March–1 April 2021. [Google Scholar]
- Yin, L.; Popoola, W.O.; Wu, X.; Haas, H. Performance Evaluation of Non-orthogonal Multiple Access in Visible Light Communication. IEEE Trans. Commun. 2016, 64, 5162–5175. [Google Scholar] [CrossRef]
- Li, G.; Wang, P.; Yang, T.; Che, H. Secrecy Sum-Rate Enhancement for NOMA-VLC System With Pseudo User. IEEE Commun. Lett. 2023, 27, 243–247. [Google Scholar] [CrossRef]
- Chen, C.; Zhong, W.-D.; Yang, H.; Du, P. On the performance of MIMO-NOMA-based visible light communication systems. IEEE Photonics Technol. Lett. 2017, 30, 307–310. [Google Scholar] [CrossRef]
- Raj, R.; Jindal, K.; Dixit, A. Fairness Enhancement of Non-Orthogonal Multiple Access in VLC-Based IoT Networks for Intravehicular Applications. IEEE Trans. Veh. Technol. 2022, 71, 7414–7427. [Google Scholar] [CrossRef]
- Liu, Z.; Yang, F.; Sun, S.; Song, J.; Han, Z. Sum Rate Maximization for NOMA-Based VLC With Optical Intelligent Reflecting Surface. IEEE Wirel. Commun. Lett. 2023, 12, 848–852. [Google Scholar] [CrossRef]
- Palitharathna, K.W.S.; Suraweera, H.A.; Godaliyadda, R.I.; Herath, R.I.; Ding, Z. Neural-Network-Based Blockage Prediction and Optimization in Lightwave Power-Transfer-Enabled Hybrid VLC/RF Systems. IEEE Internet Things J. 2024, 11, 5237–5248. [Google Scholar] [CrossRef]
- Obeed, M.; Dahrouj, H.; Salhab, A.M.; Chaaban, A.; Zummo, S.A.; Alouini, M.-S. Power Allocation and Link Selection for Multicell Cooperative NOMA Hybrid VLC/RF Systems. IEEE Commun. Lett. 2021, 25, 560–564. [Google Scholar] [CrossRef]
- Liu, Z.; Yang, F.; Song, J.; Han, J. Multiple Access for Downlink Multi-User VLC System: NOMA or OMA User Pairing? IEEE Wirel. Commun. Lett. 2023, 12, 1916–1920. [Google Scholar] [CrossRef]
- Raj, R.; Dixit, A. An Energy-Efficient Power Allocation Scheme for NOMA-Based IoT Sensor Networks in 6G. IEEE Sens. J. 2022, 22, 7371–7384. [Google Scholar] [CrossRef]
- Rallis, K.G.; Papanikolaou, V.K.; Diamantoulakis, P.D.; Tegos, S.A.; Dowhuszko, A.A.; Khalighi, M.-A.; Karagiannidis, G.K. Energy Efficient Cooperative Communications in Aggregated VLC/RF Networks With NOMA. IEEE Trans. Commun. 2023, 71, 5408–5419. [Google Scholar] [CrossRef]
- Fang, F.; Zhang, L.; Wu, Z.; Jiang, J. Energy Consumption Minimization for Multi-carrier NOMA Visible Light Communication Downlinks. In Proceedings of the 2021 IEEE/CIC International Conference on Communications in China (ICCC), Xiamen, China, 28–30 July 2021. [Google Scholar]
- Mahady, I.A.; Bedeer, E.; Ikki, S.; Yanikomeroglu, H. Sum-Rate Maximization of NOMA Systems under Imperfect Successive Interference Cancellation. IEEE Commun. Lett. 2019, 23, 474–477. [Google Scholar] [CrossRef]
- Lin, B.; Ye, W.; Tang, X.; Ghassemlooy, Z. Experimental demonstration of bidirectional NOMA-OFDMA visible light communications. Opt. Exp. 2017, 25, 4348–4355. [Google Scholar] [CrossRef] [PubMed]
- Marshoud, H.; Kapinas, V.M.; Karagiannidis, G.K.; Muhaidat, S. Non-orthogonal multiple access for visible light communications. IEEE Photonics Technol. Lett. 2016, 28, 51–54. [Google Scholar] [CrossRef]
- Feng, L.; Yang, H.; Hu, R.Q.; Wang, J. MmWave and VLC-based indoor channel models in 5G wireless networks. IEEE Wirel. Commun. 2018, 25, 70–77. [Google Scholar] [CrossRef]
- Marshoud, H.; Sofotasios, P.C.; Muhaidat, S.; Karagiannidis, G.K.; Sharif, B.S. On the performance of visible light communication systems with non-orthogonal multiple access. IEEE Trans. Wirel. Commun. 2017, 16, 6350–6364. [Google Scholar] [CrossRef]
- Zeng, L.; OBrien, D.C.; Minh, H.L.; Faulkner, G.E.; Lee, K.; Jung, D.; Oh, Y.; Won, E.T. High data rate multiple input multiple output (MIMO) optical wireless communications using white LED lighting. IEEE J. Sel. Areas Commun. 2009, 27, 1654–1662. [Google Scholar] [CrossRef]
- Ma, S.; He, Y.; Li, H.; Lu, S.; Zhang, F.; Li, S. Optimal Power Allocation for Mobile Users in Non-Orthogonal Multiple Access Visible Light Communication Networks. IEEE Trans. Commun. 2019, 67, 2233–2244. [Google Scholar] [CrossRef]
- Kha, H.H.; Tuan, H.D.; Nguyen, H.H. Fast Global Optimal Power Allocation in Wireless Networks by Local D.C. Programming. IEEE Trans. Wirel. Commun. 2012, 11, 510–515. [Google Scholar] [CrossRef]
- Tao, S.; Yu, H.; Li, Q.; Tang, Y. Strategy-Based Gain Ratio Power Allocation in Non-Orthogonal Multiple Access for Indoor Visible Light Communication Networks. IEEE Access 2019, 7, 15250–15261. [Google Scholar] [CrossRef]
- Kha, H.H.; Tuan, H.D.; Nguyen, H.H. Demonstration of Performance Improvement in Multi-User NOMA VLC System Using Joint Transceiver Optimization. Photonics 2022, 9, 168. [Google Scholar] [CrossRef]
Figure 1.
Line-of-sight (LoS) link model of an LED and PD.

Figure 2.
Signal process of multiple light sources of a NOMA−based VLC system.
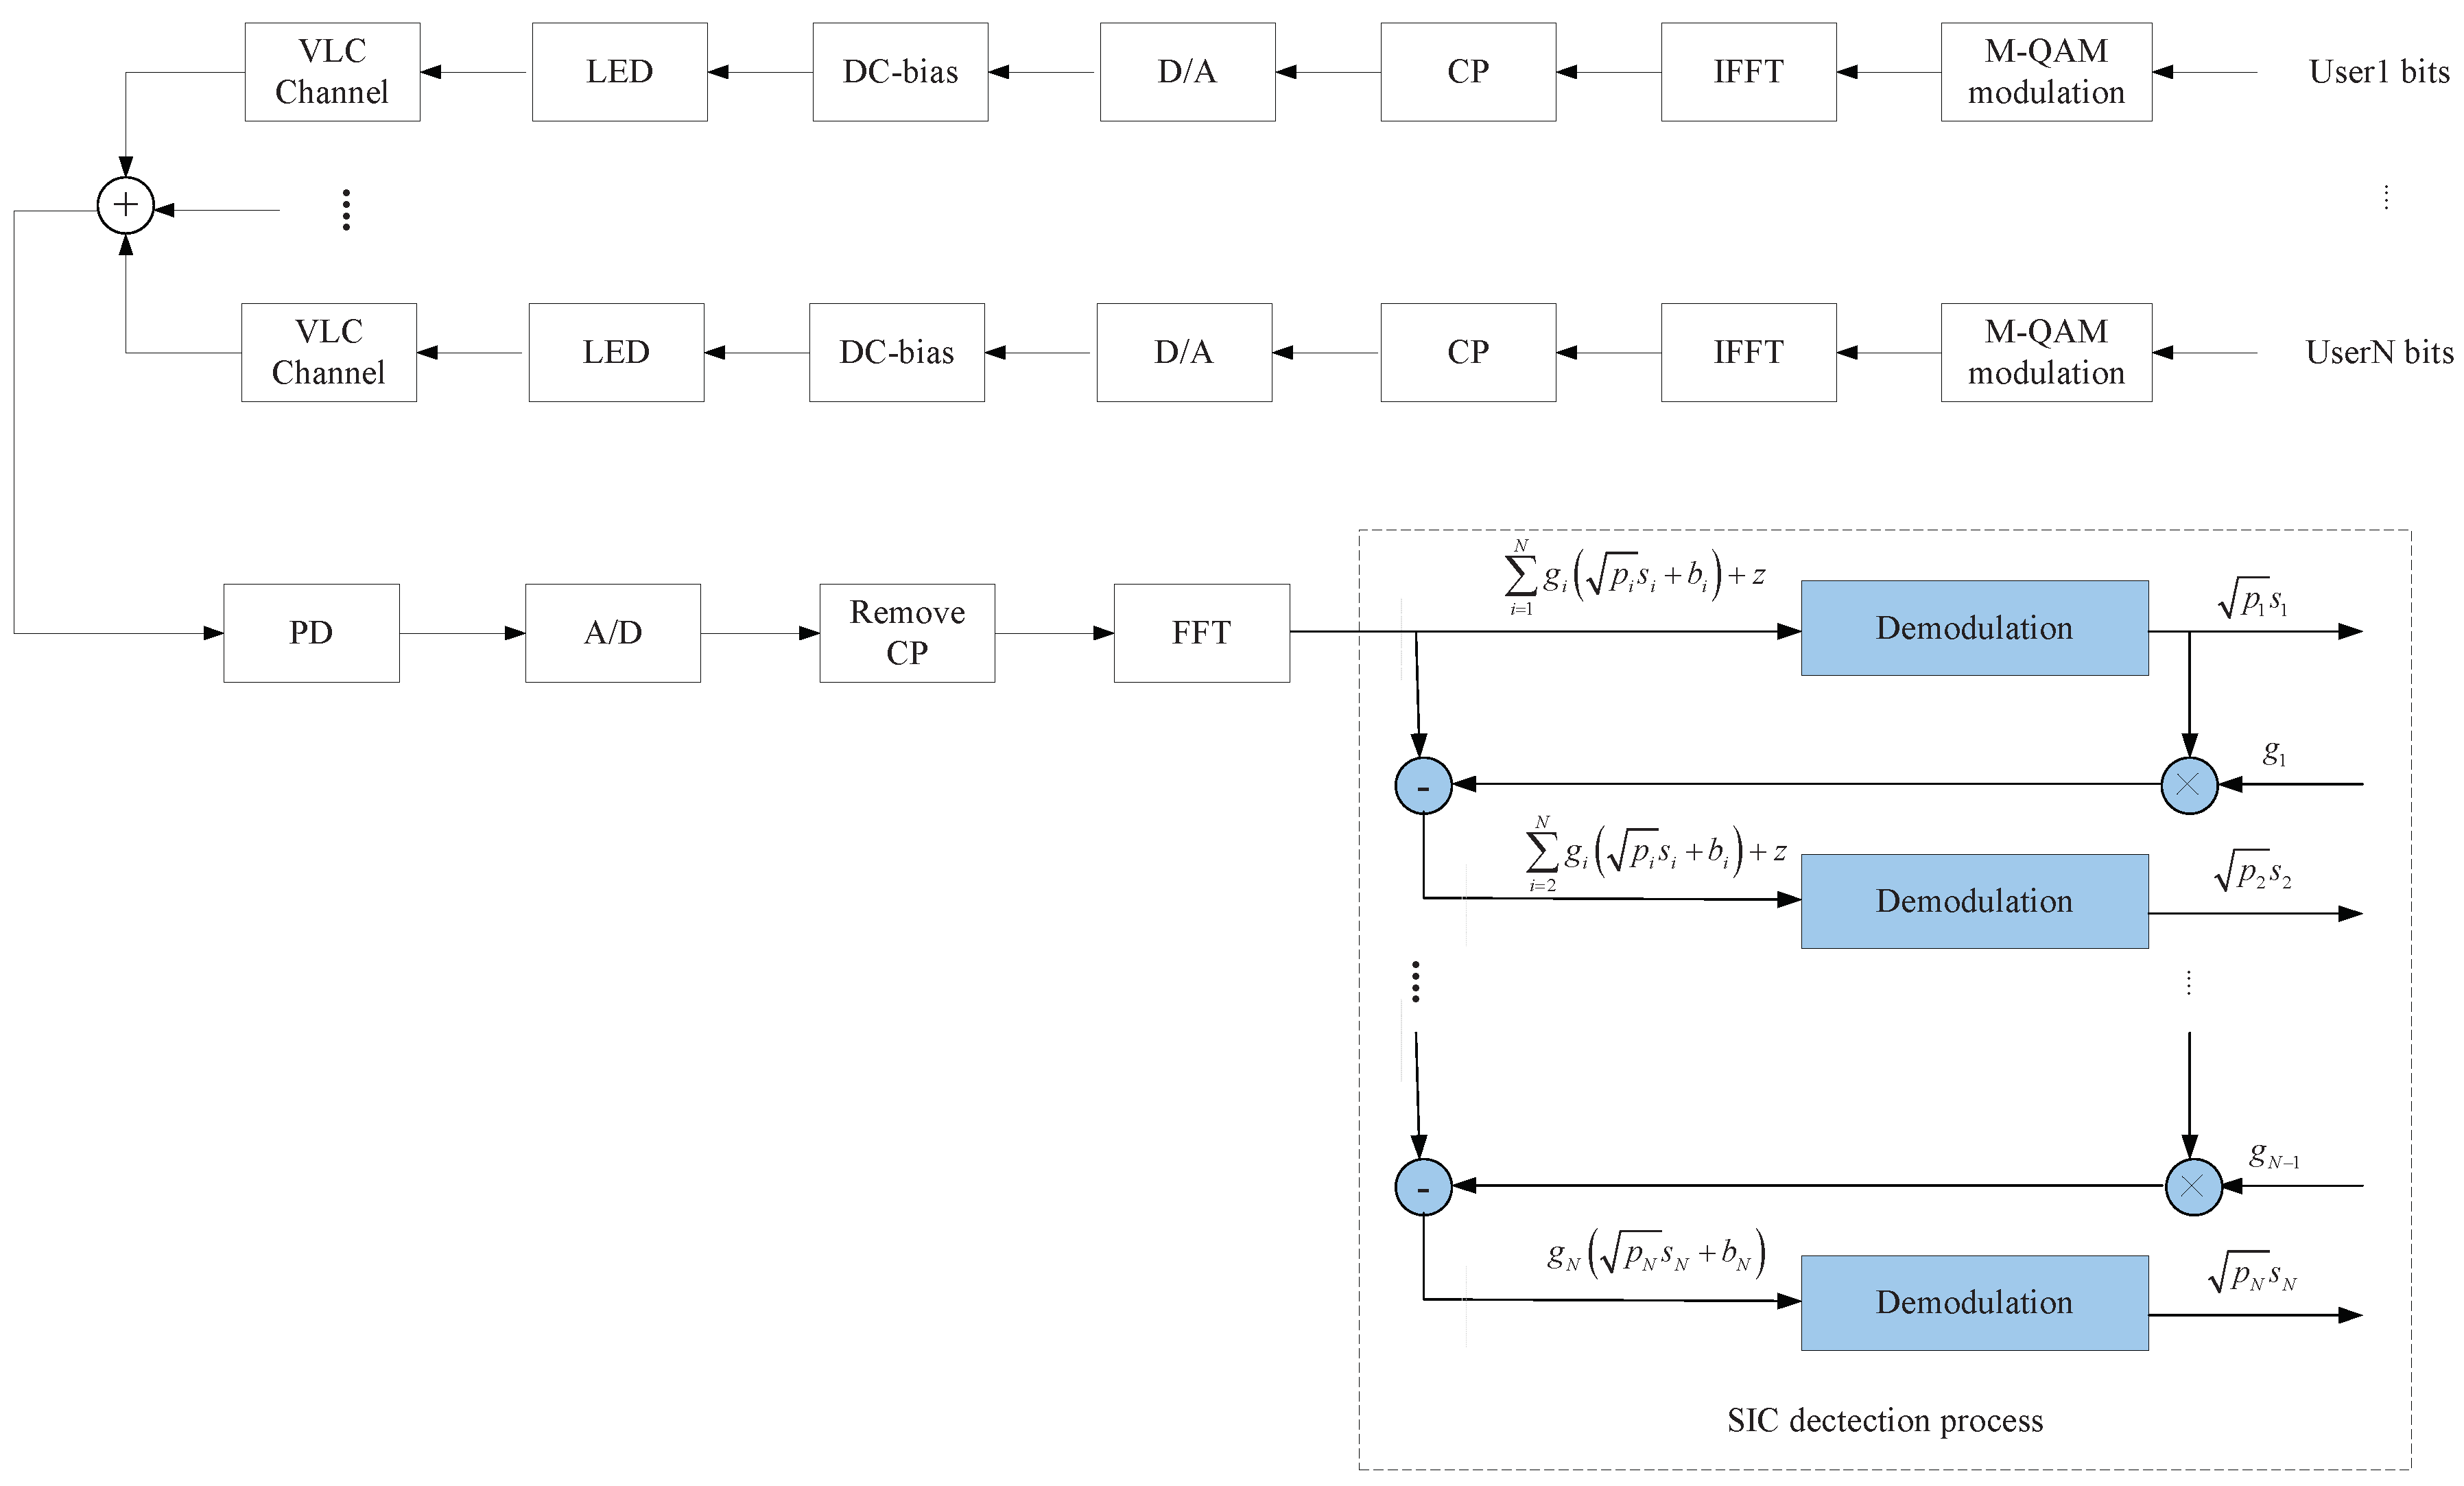
Figure 3.
Performance comparison for different group algorithms.
Figure 4.
Performance comparison for different power allocation algorithms.
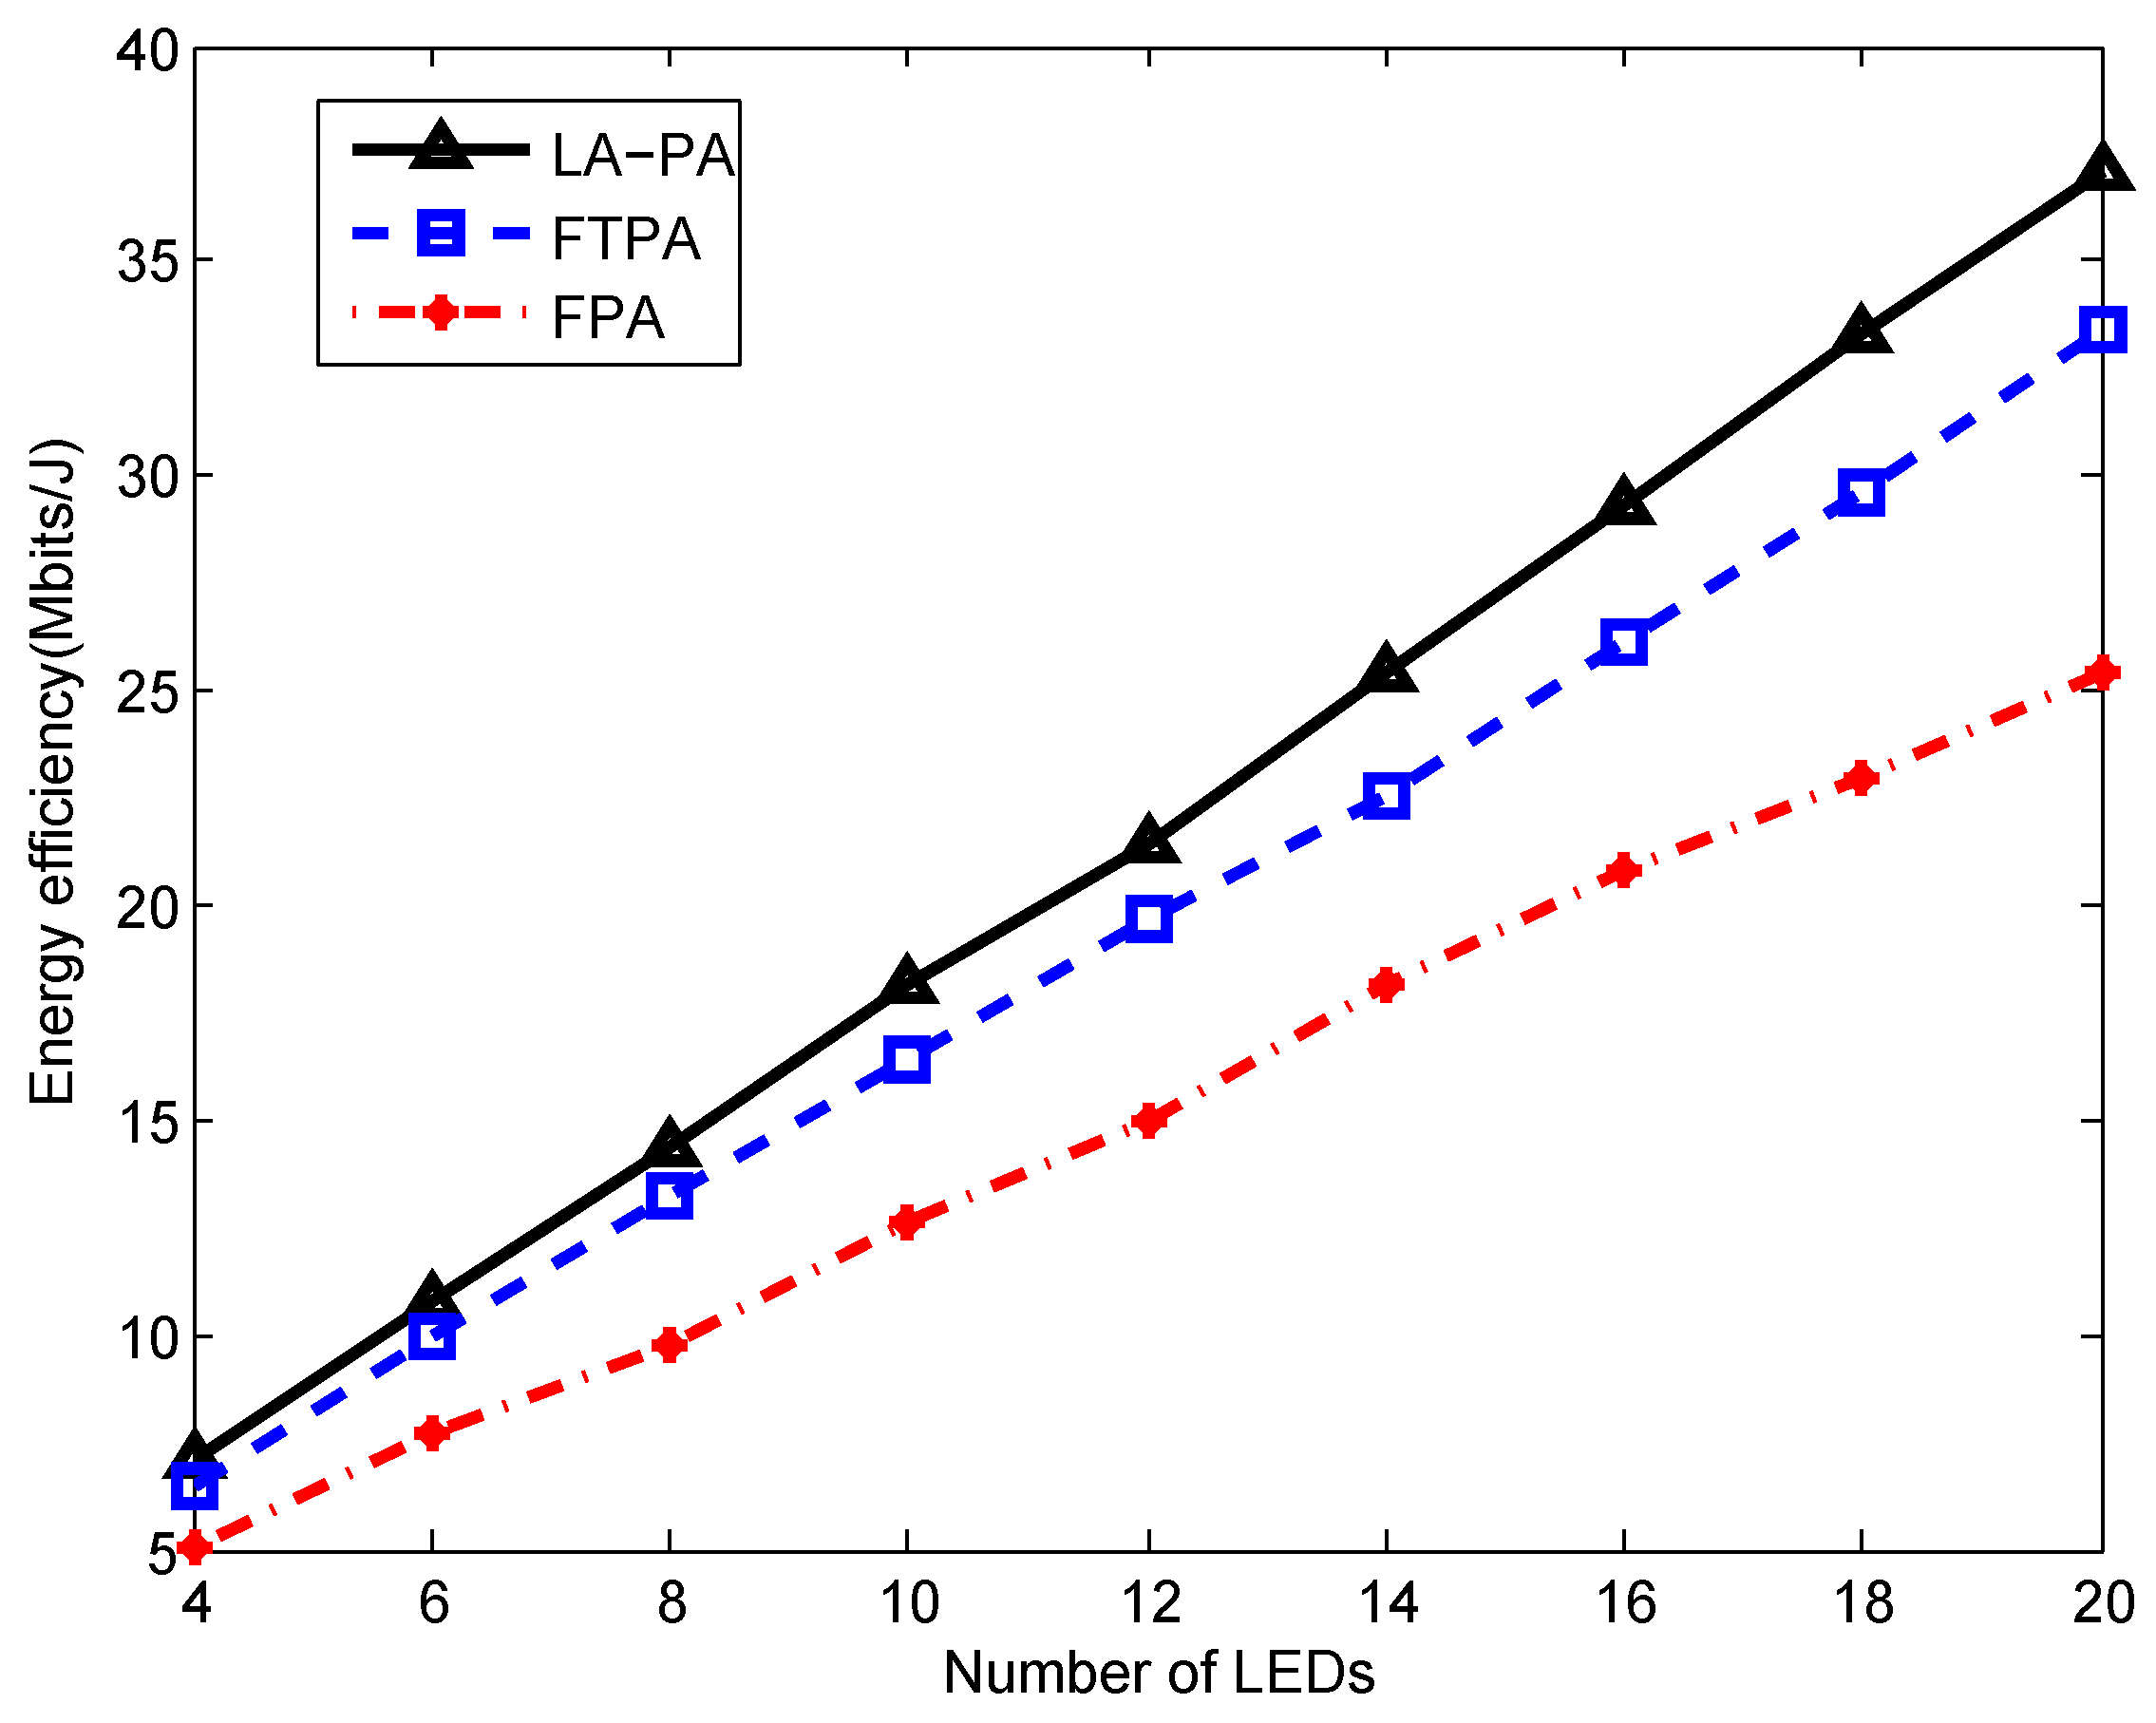
Figure 5.
Energy efficiency varying with the number of LEDs for different power multiplexing factors of N.
Figure 5.
Energy efficiency varying with the number of LEDs for different power multiplexing factors of N.
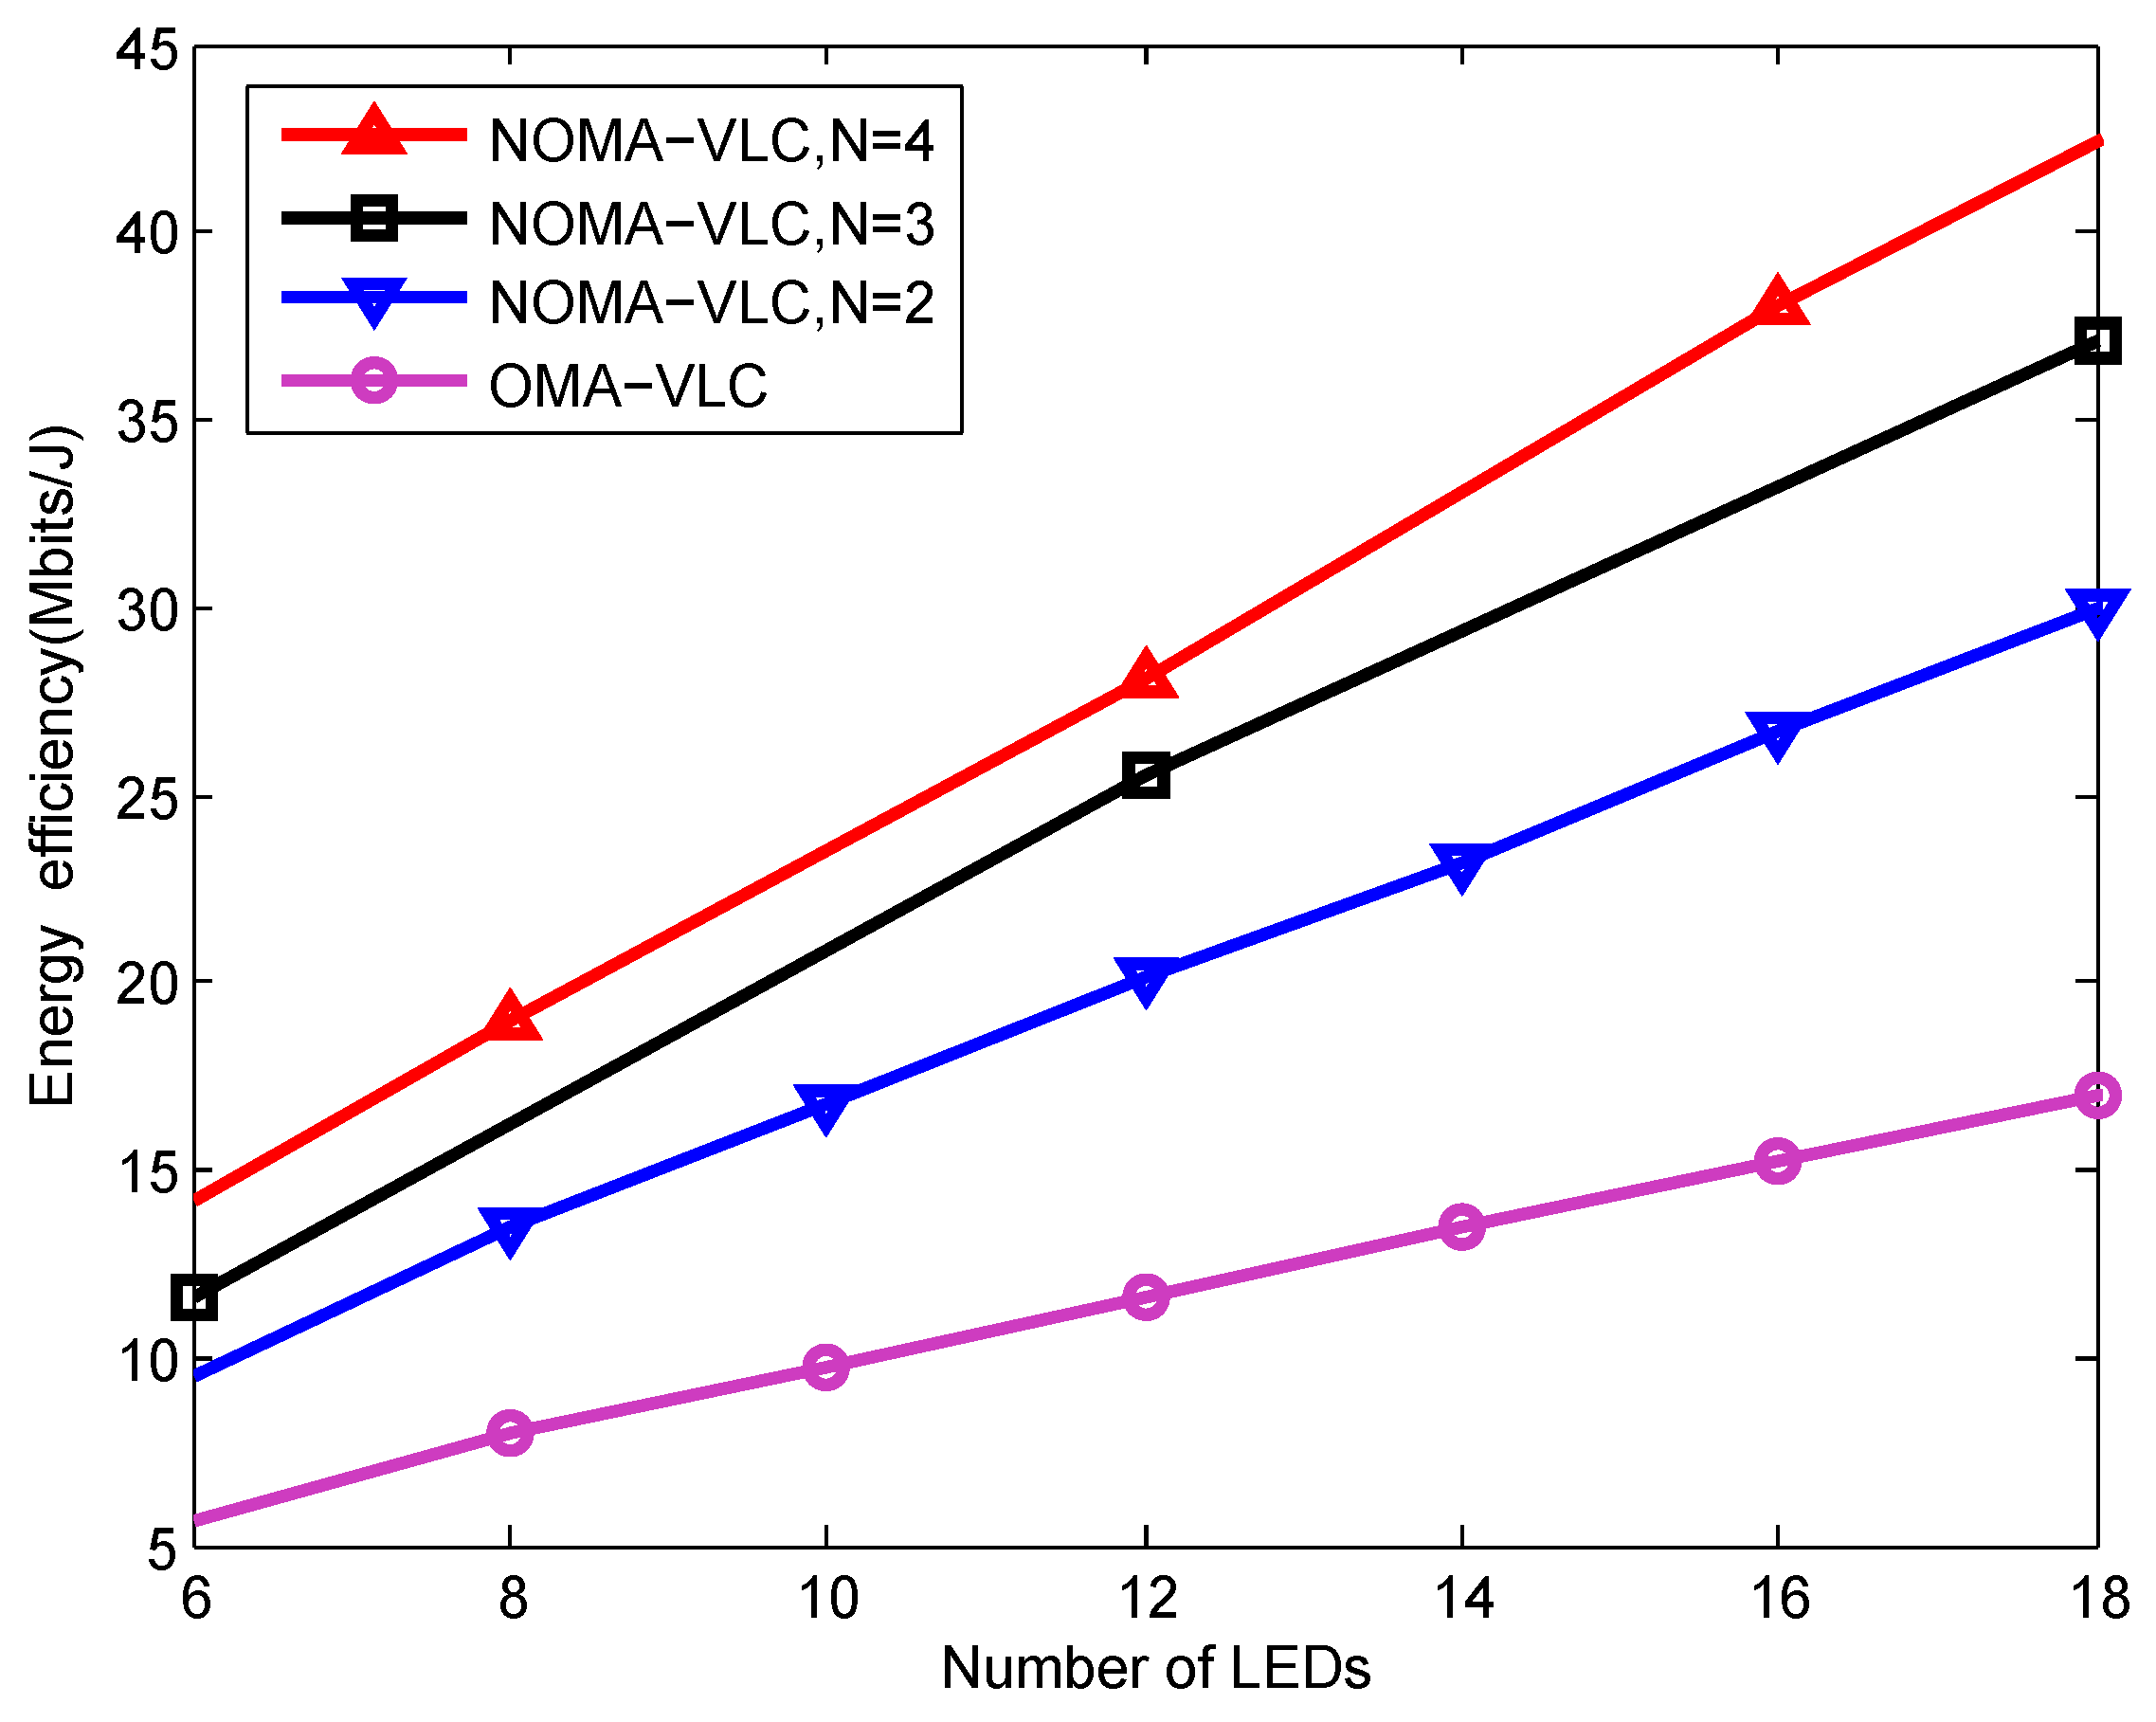
Figure 6.
Energy efficiency varying with group for a different number of LEDs.

Figure 7.
Energy efficiency varying with number of LEDs for different transmitted angle step.

Figure 8.
Energy efficiency varying with the number of LEDs for a different transmitted angle range.
Figure 8.
Energy efficiency varying with the number of LEDs for a different transmitted angle range.
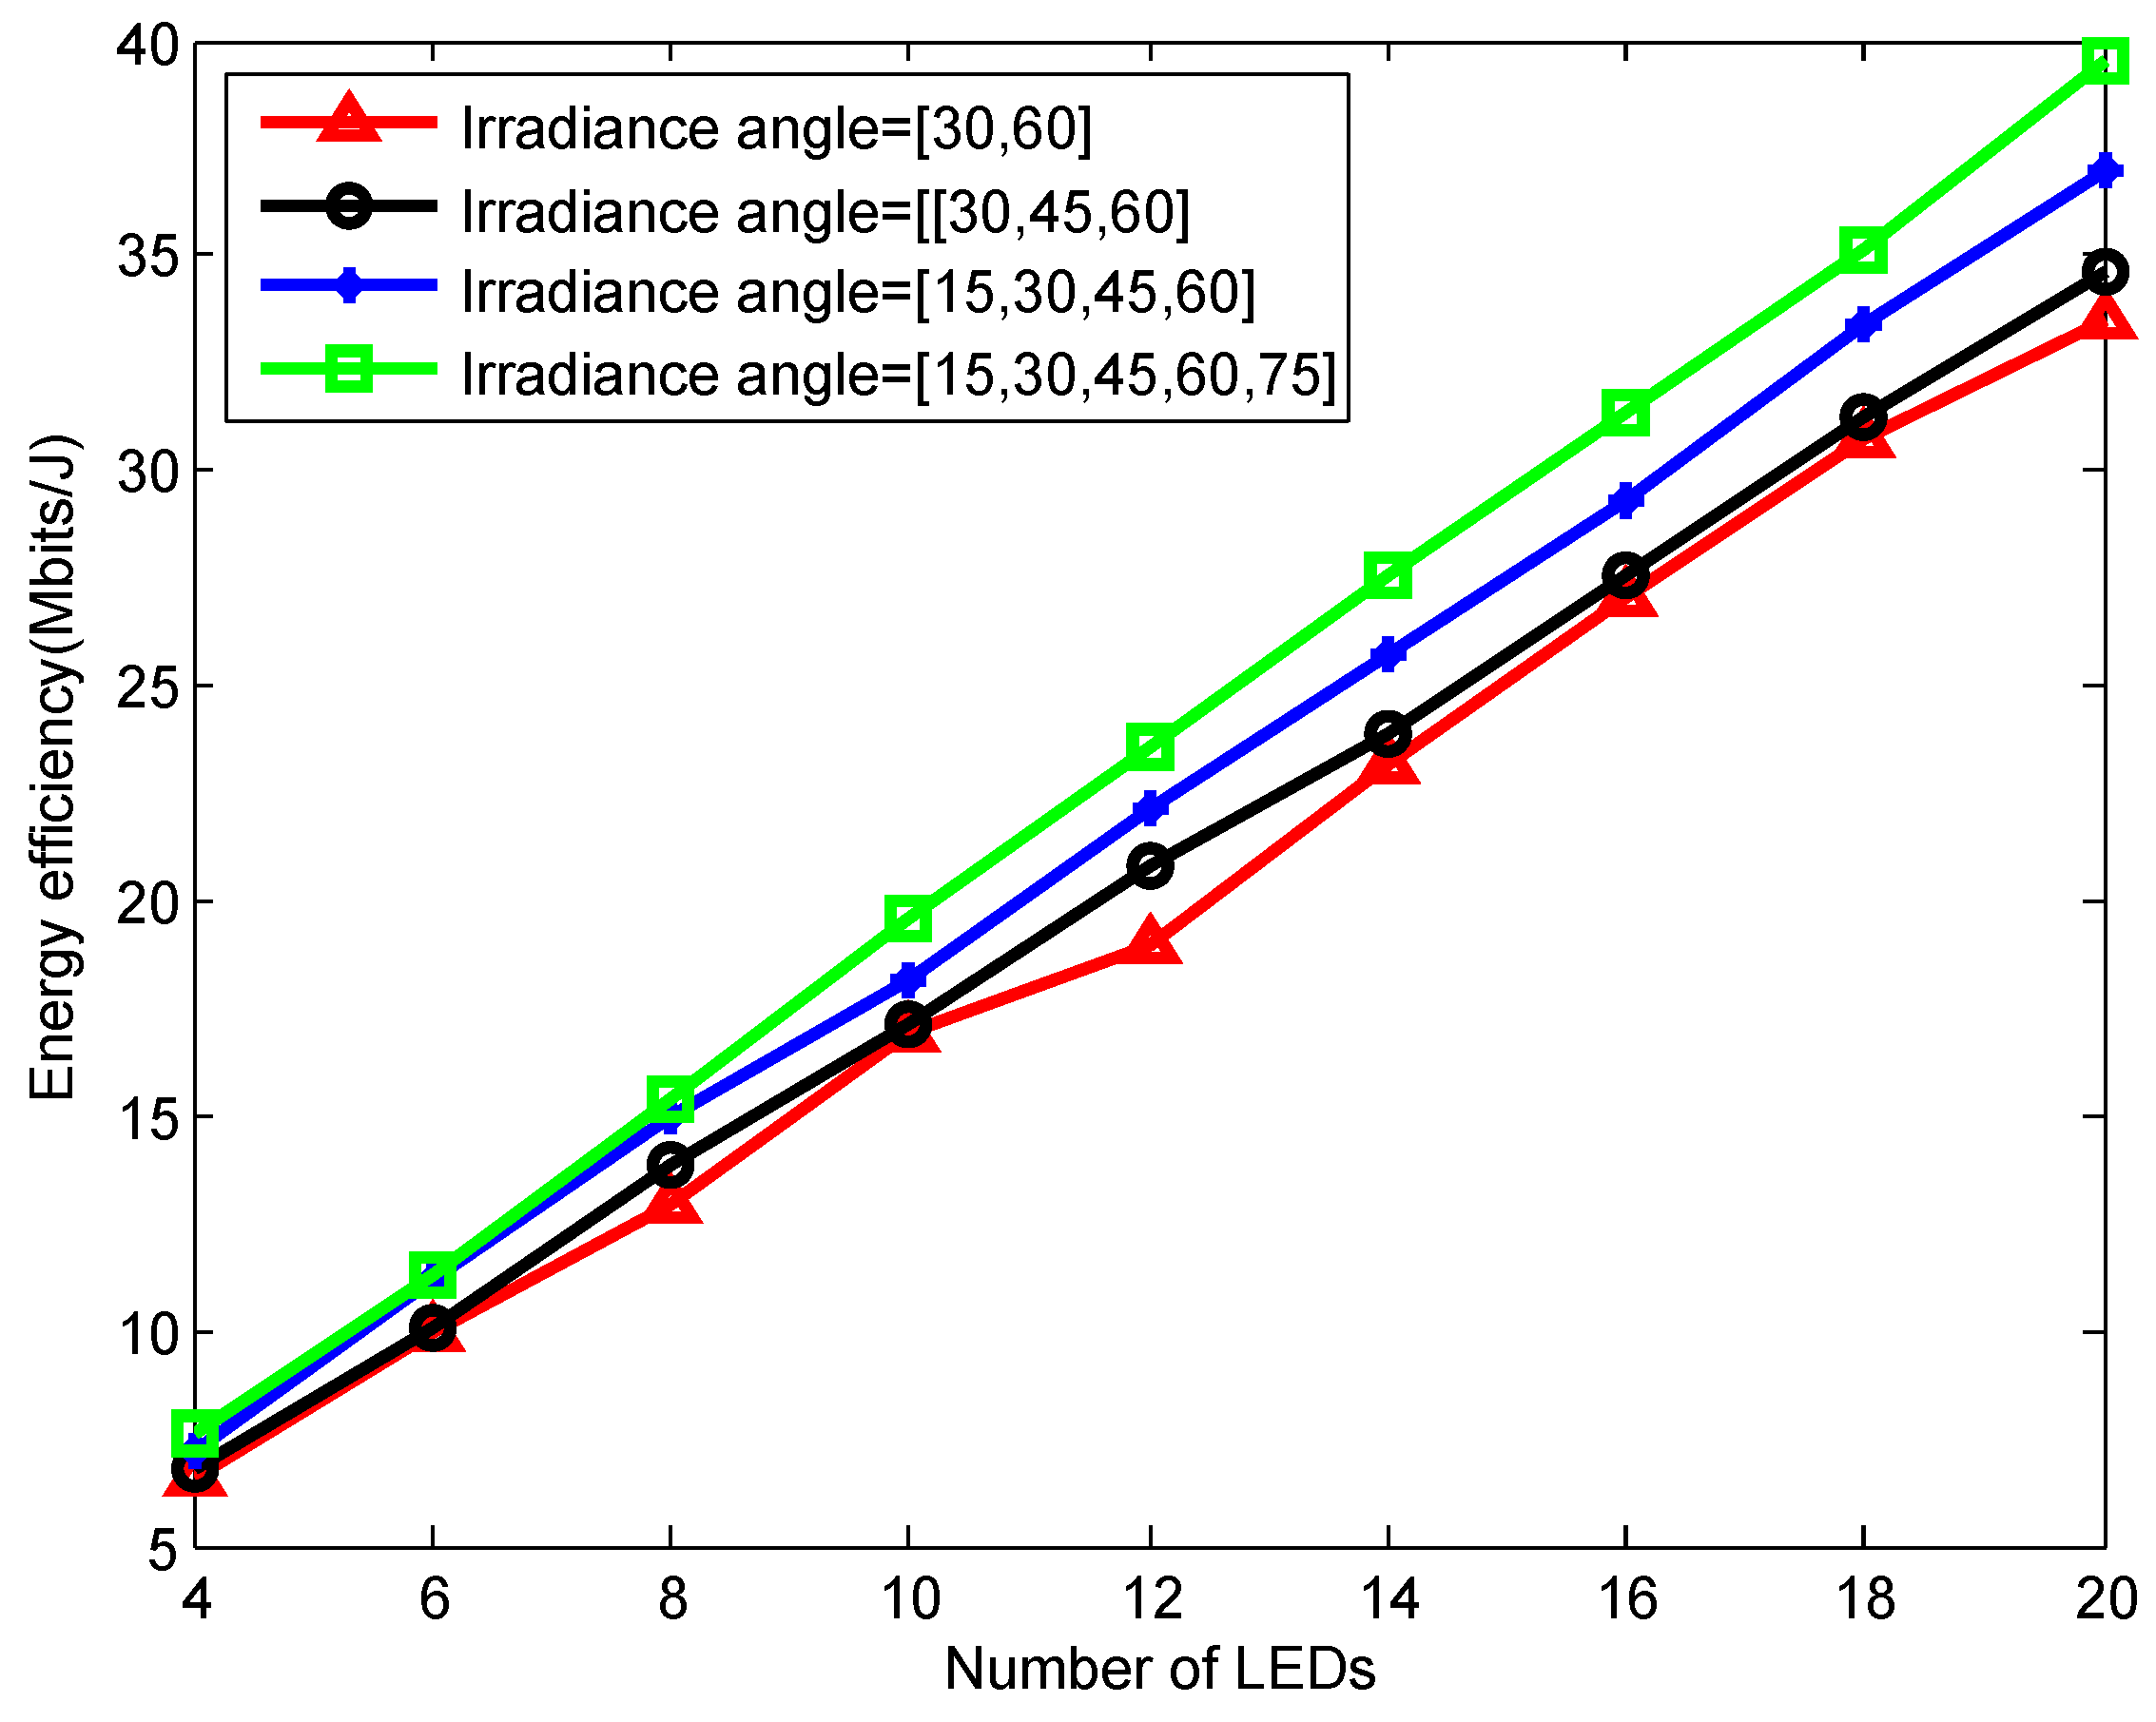
Figure 9.
Energy efficiency varying with distance for a different transmitted angle range.

Figure 10.
Energy efficiency varying with the number of LEDs for different distance steps.
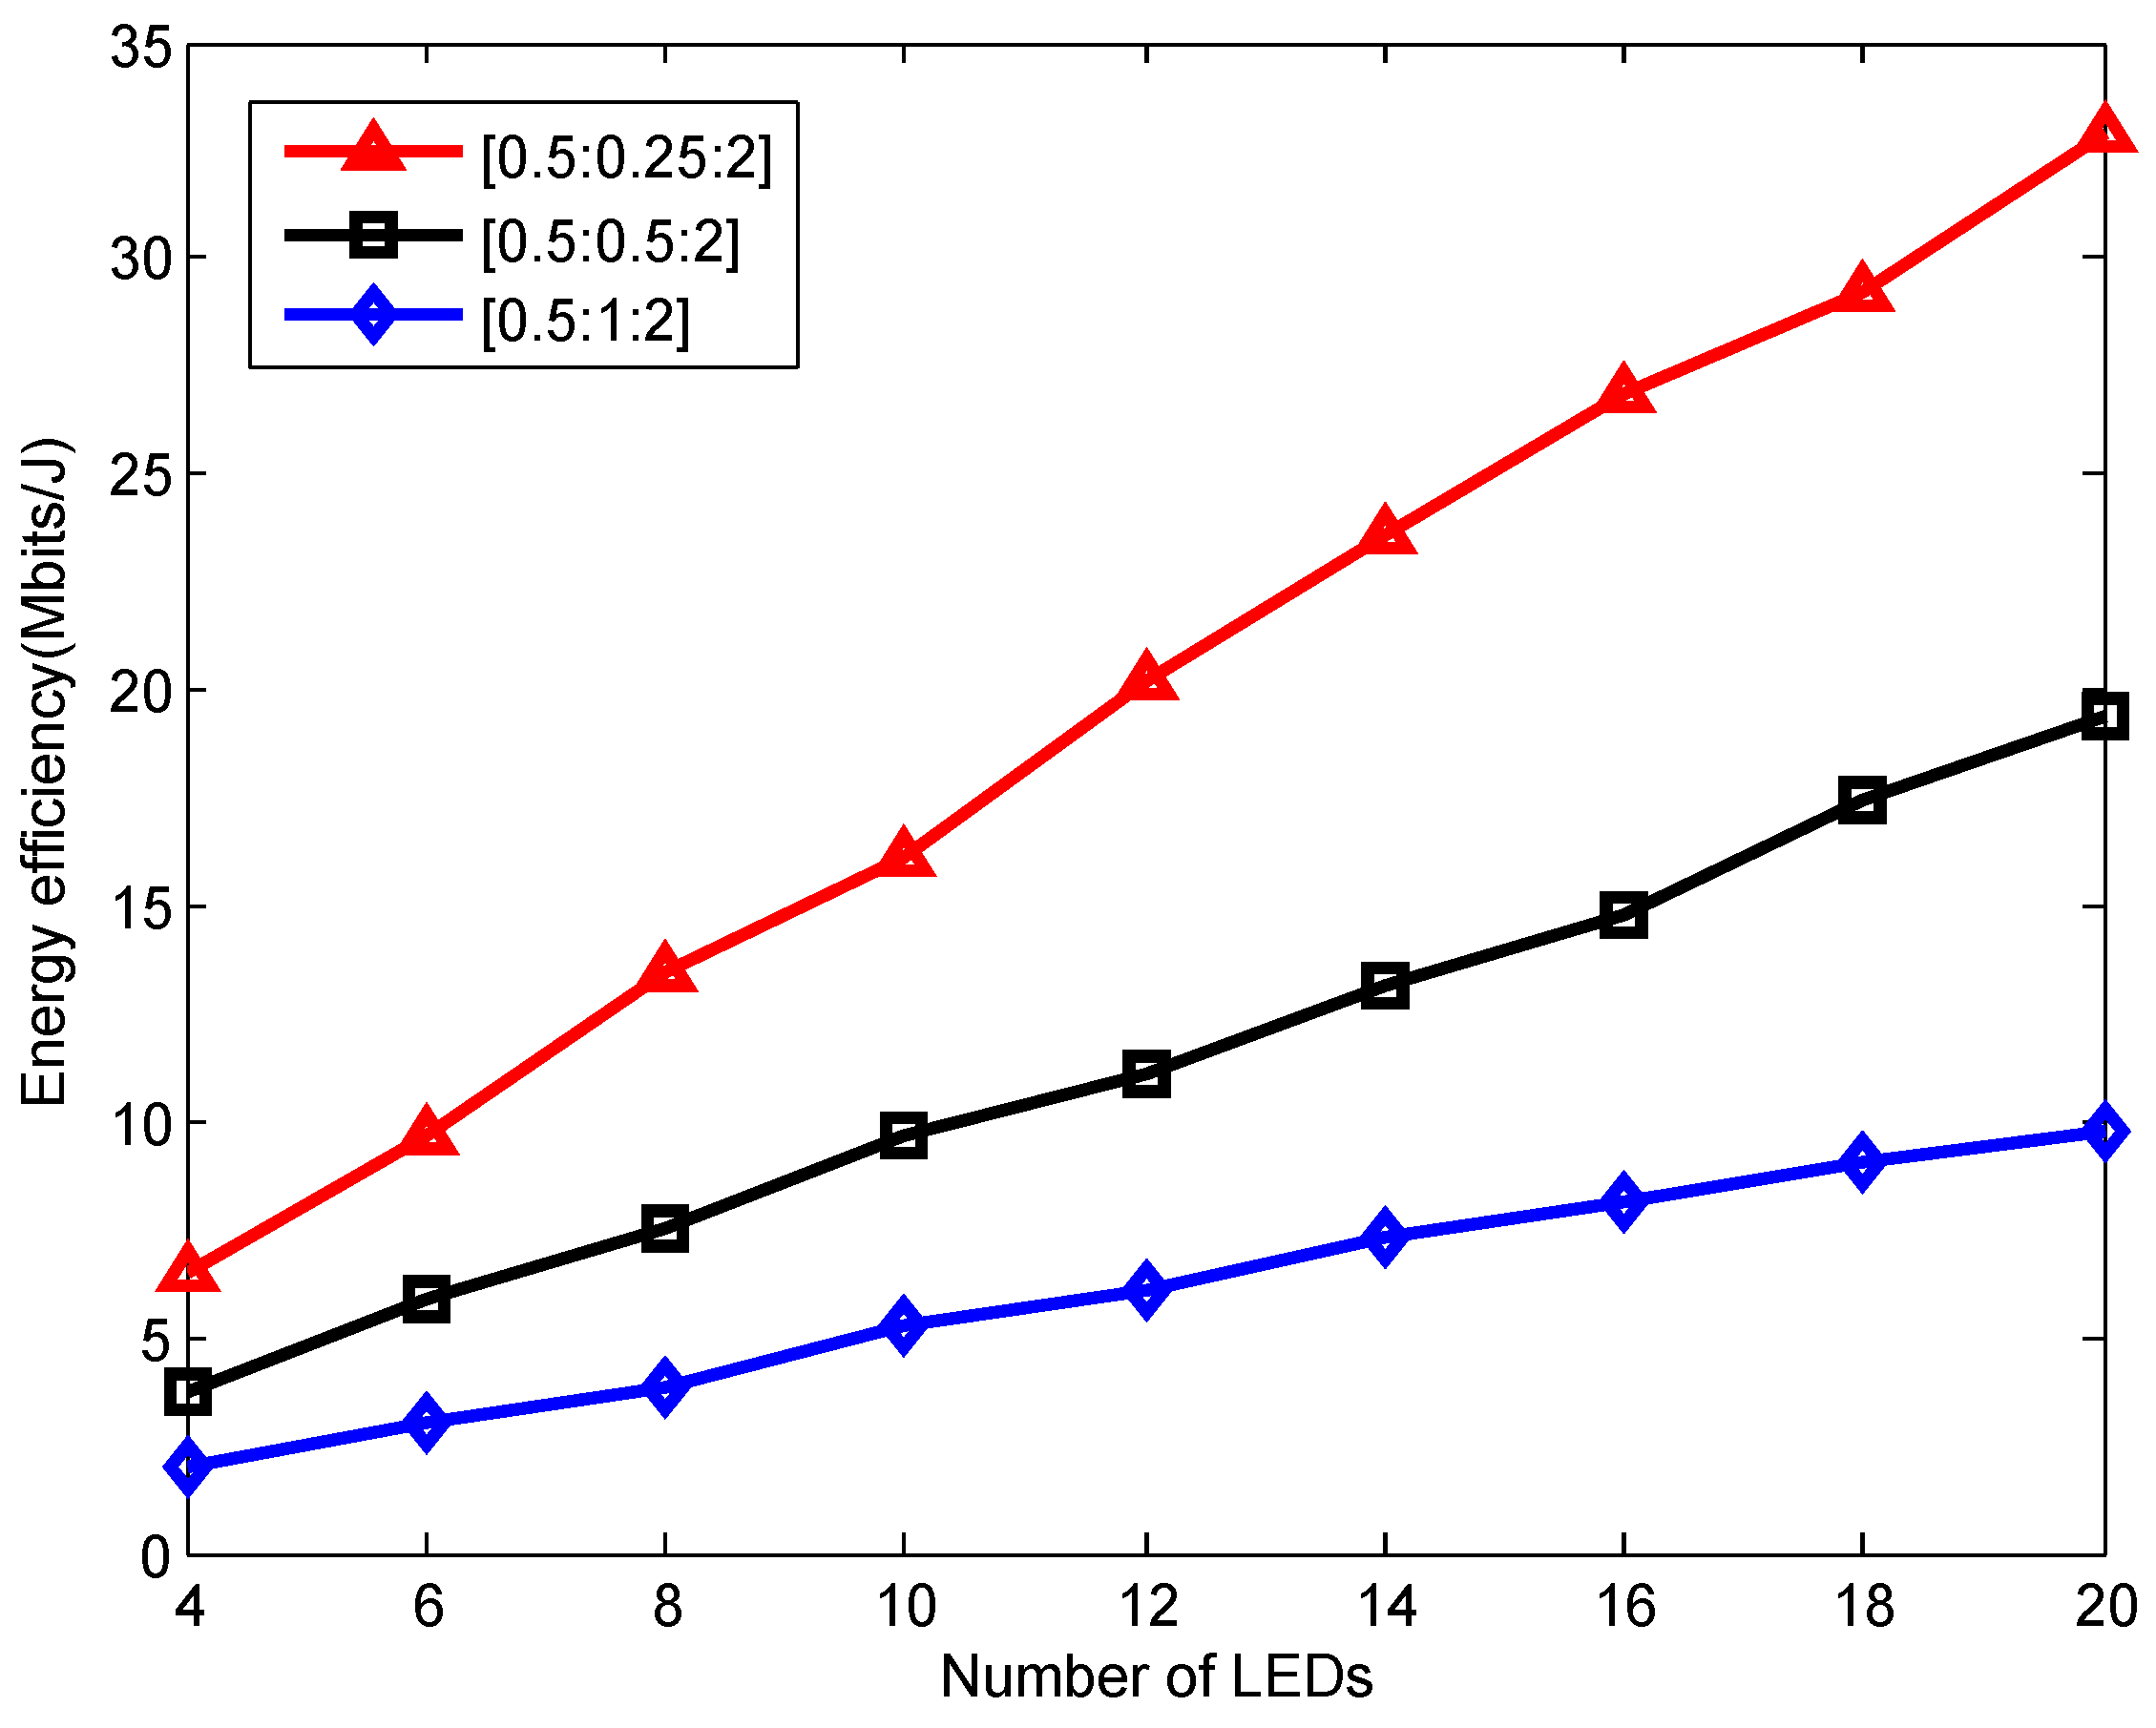
Figure 11.
EE performance comparison for different transmission bandwidths.
Figure 12.
Transmission capacity performance gain for different transmission bandwidths.
Figure 13.
Outage probability performance comparison for 2—multiplexing and 3—multiplexing LEDs.
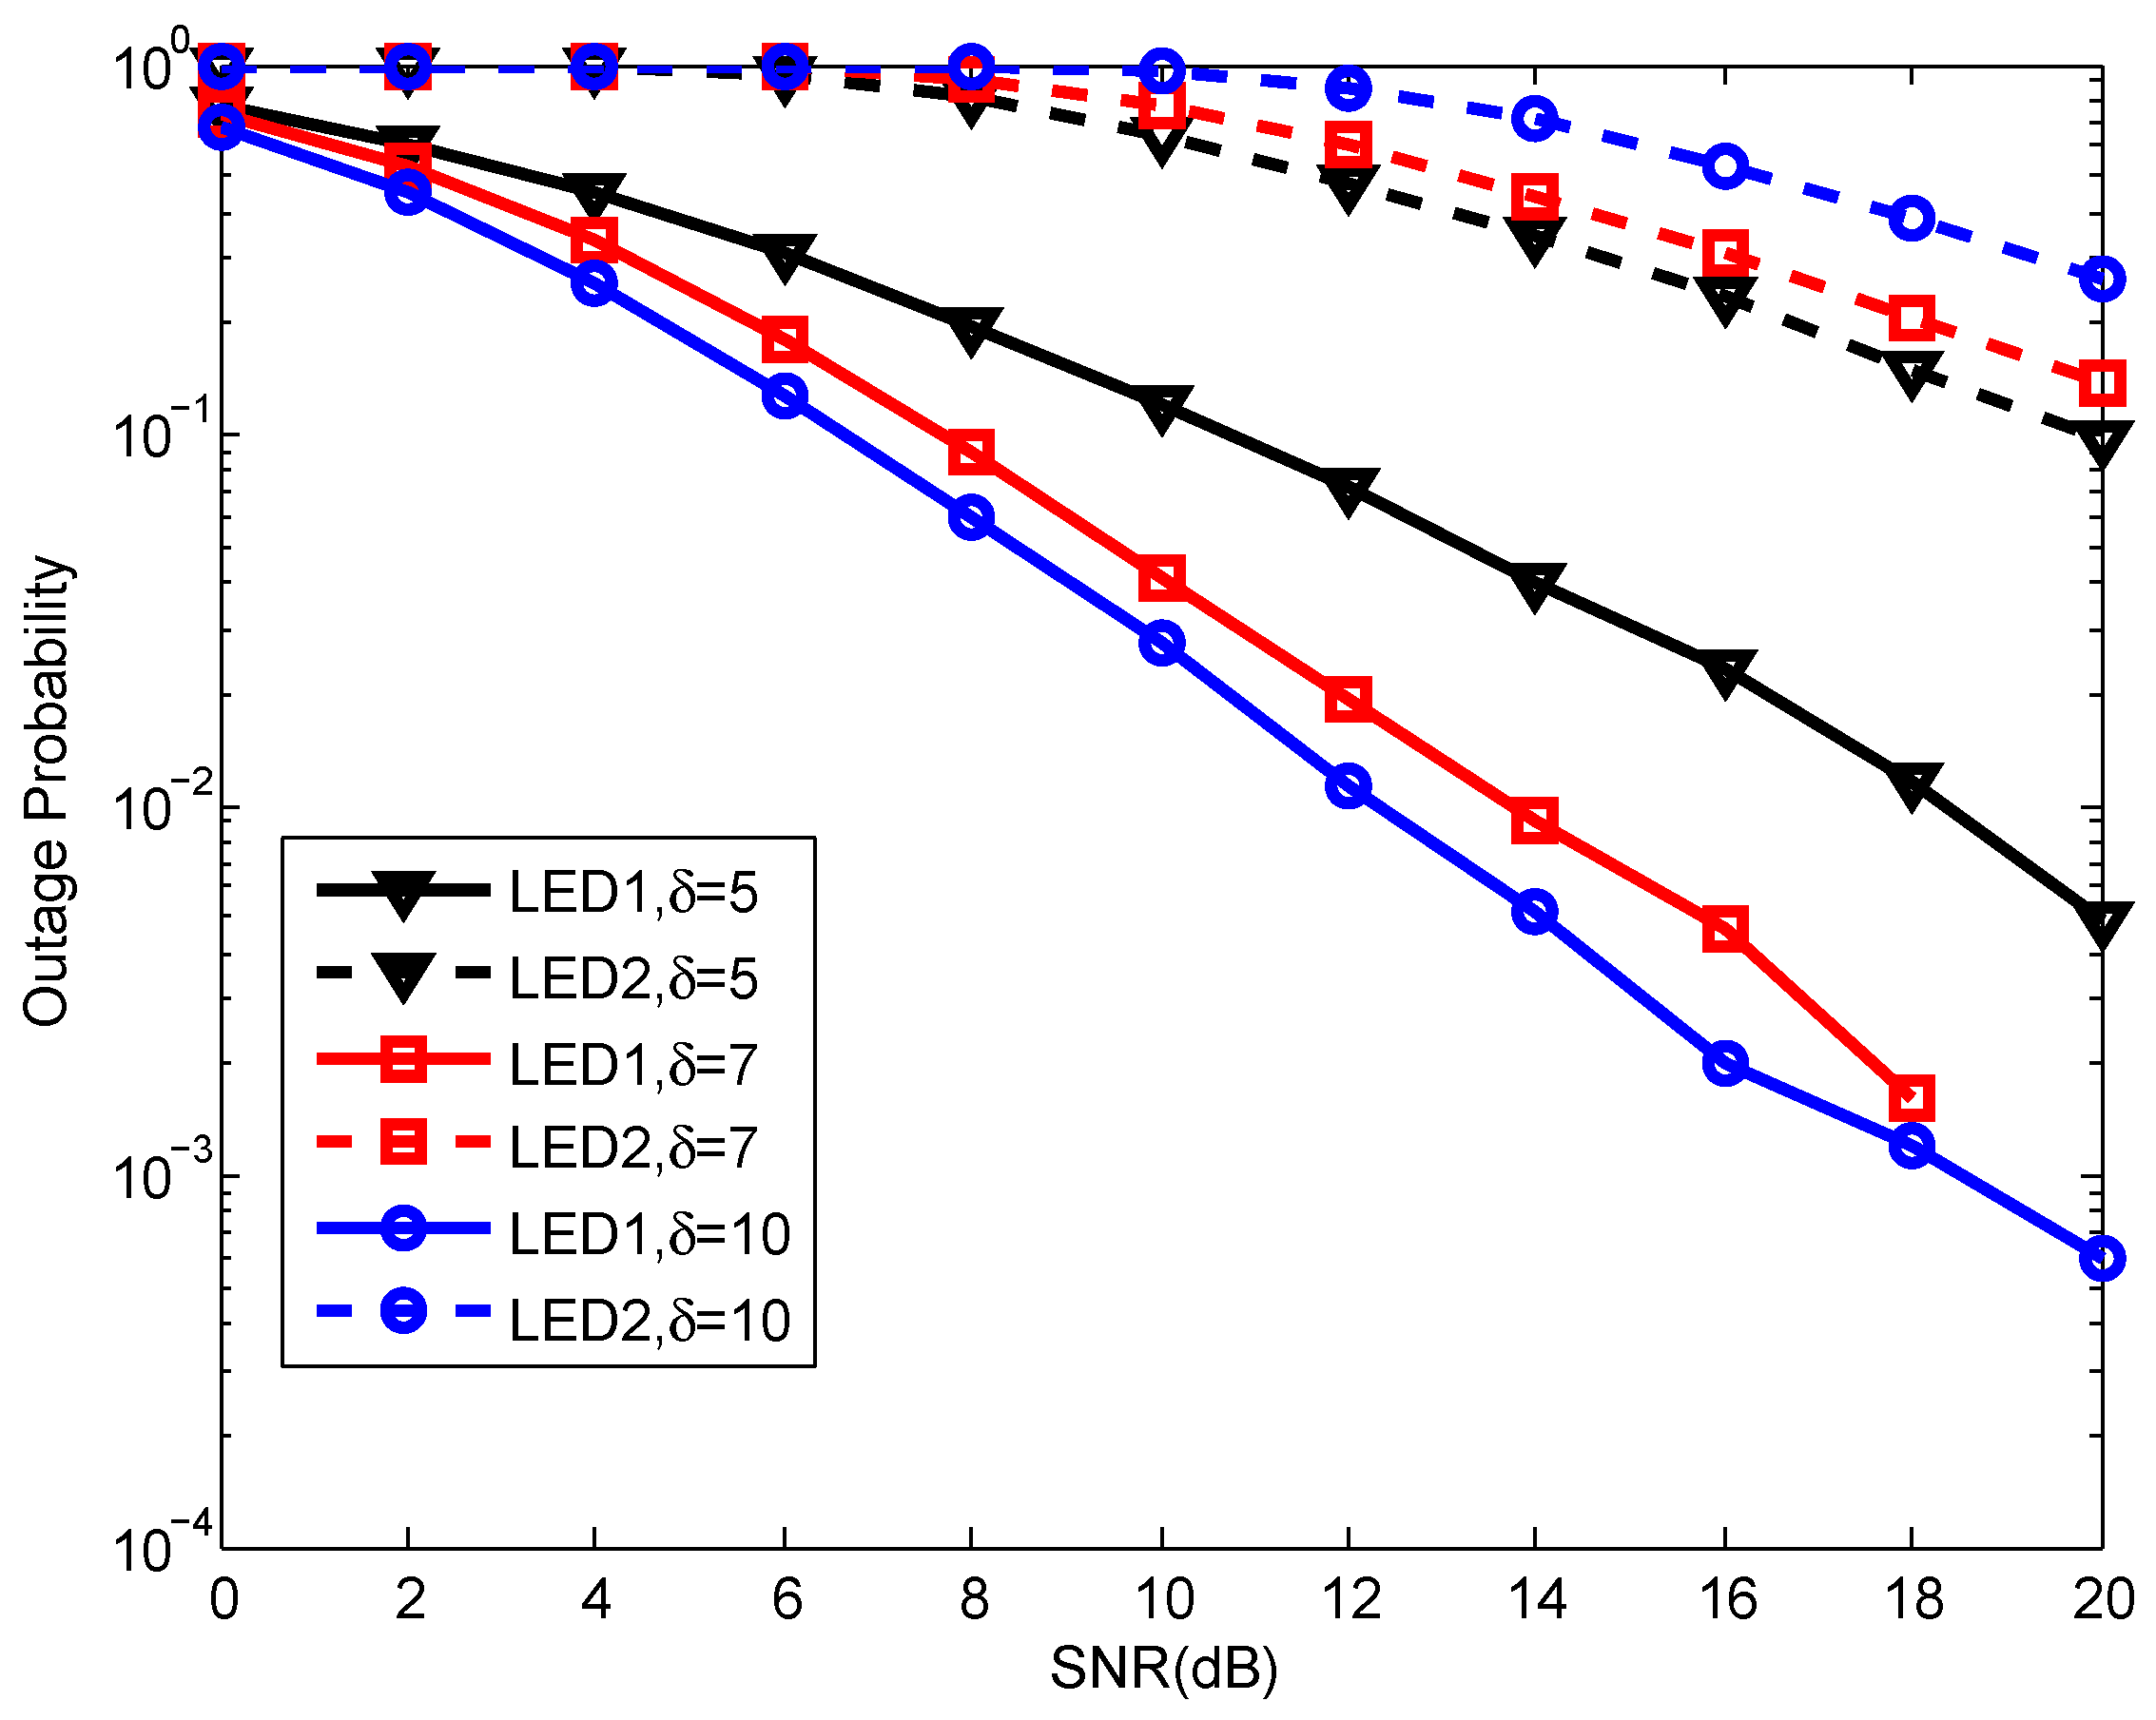
Figure 14.
Room configuration and scenarios.
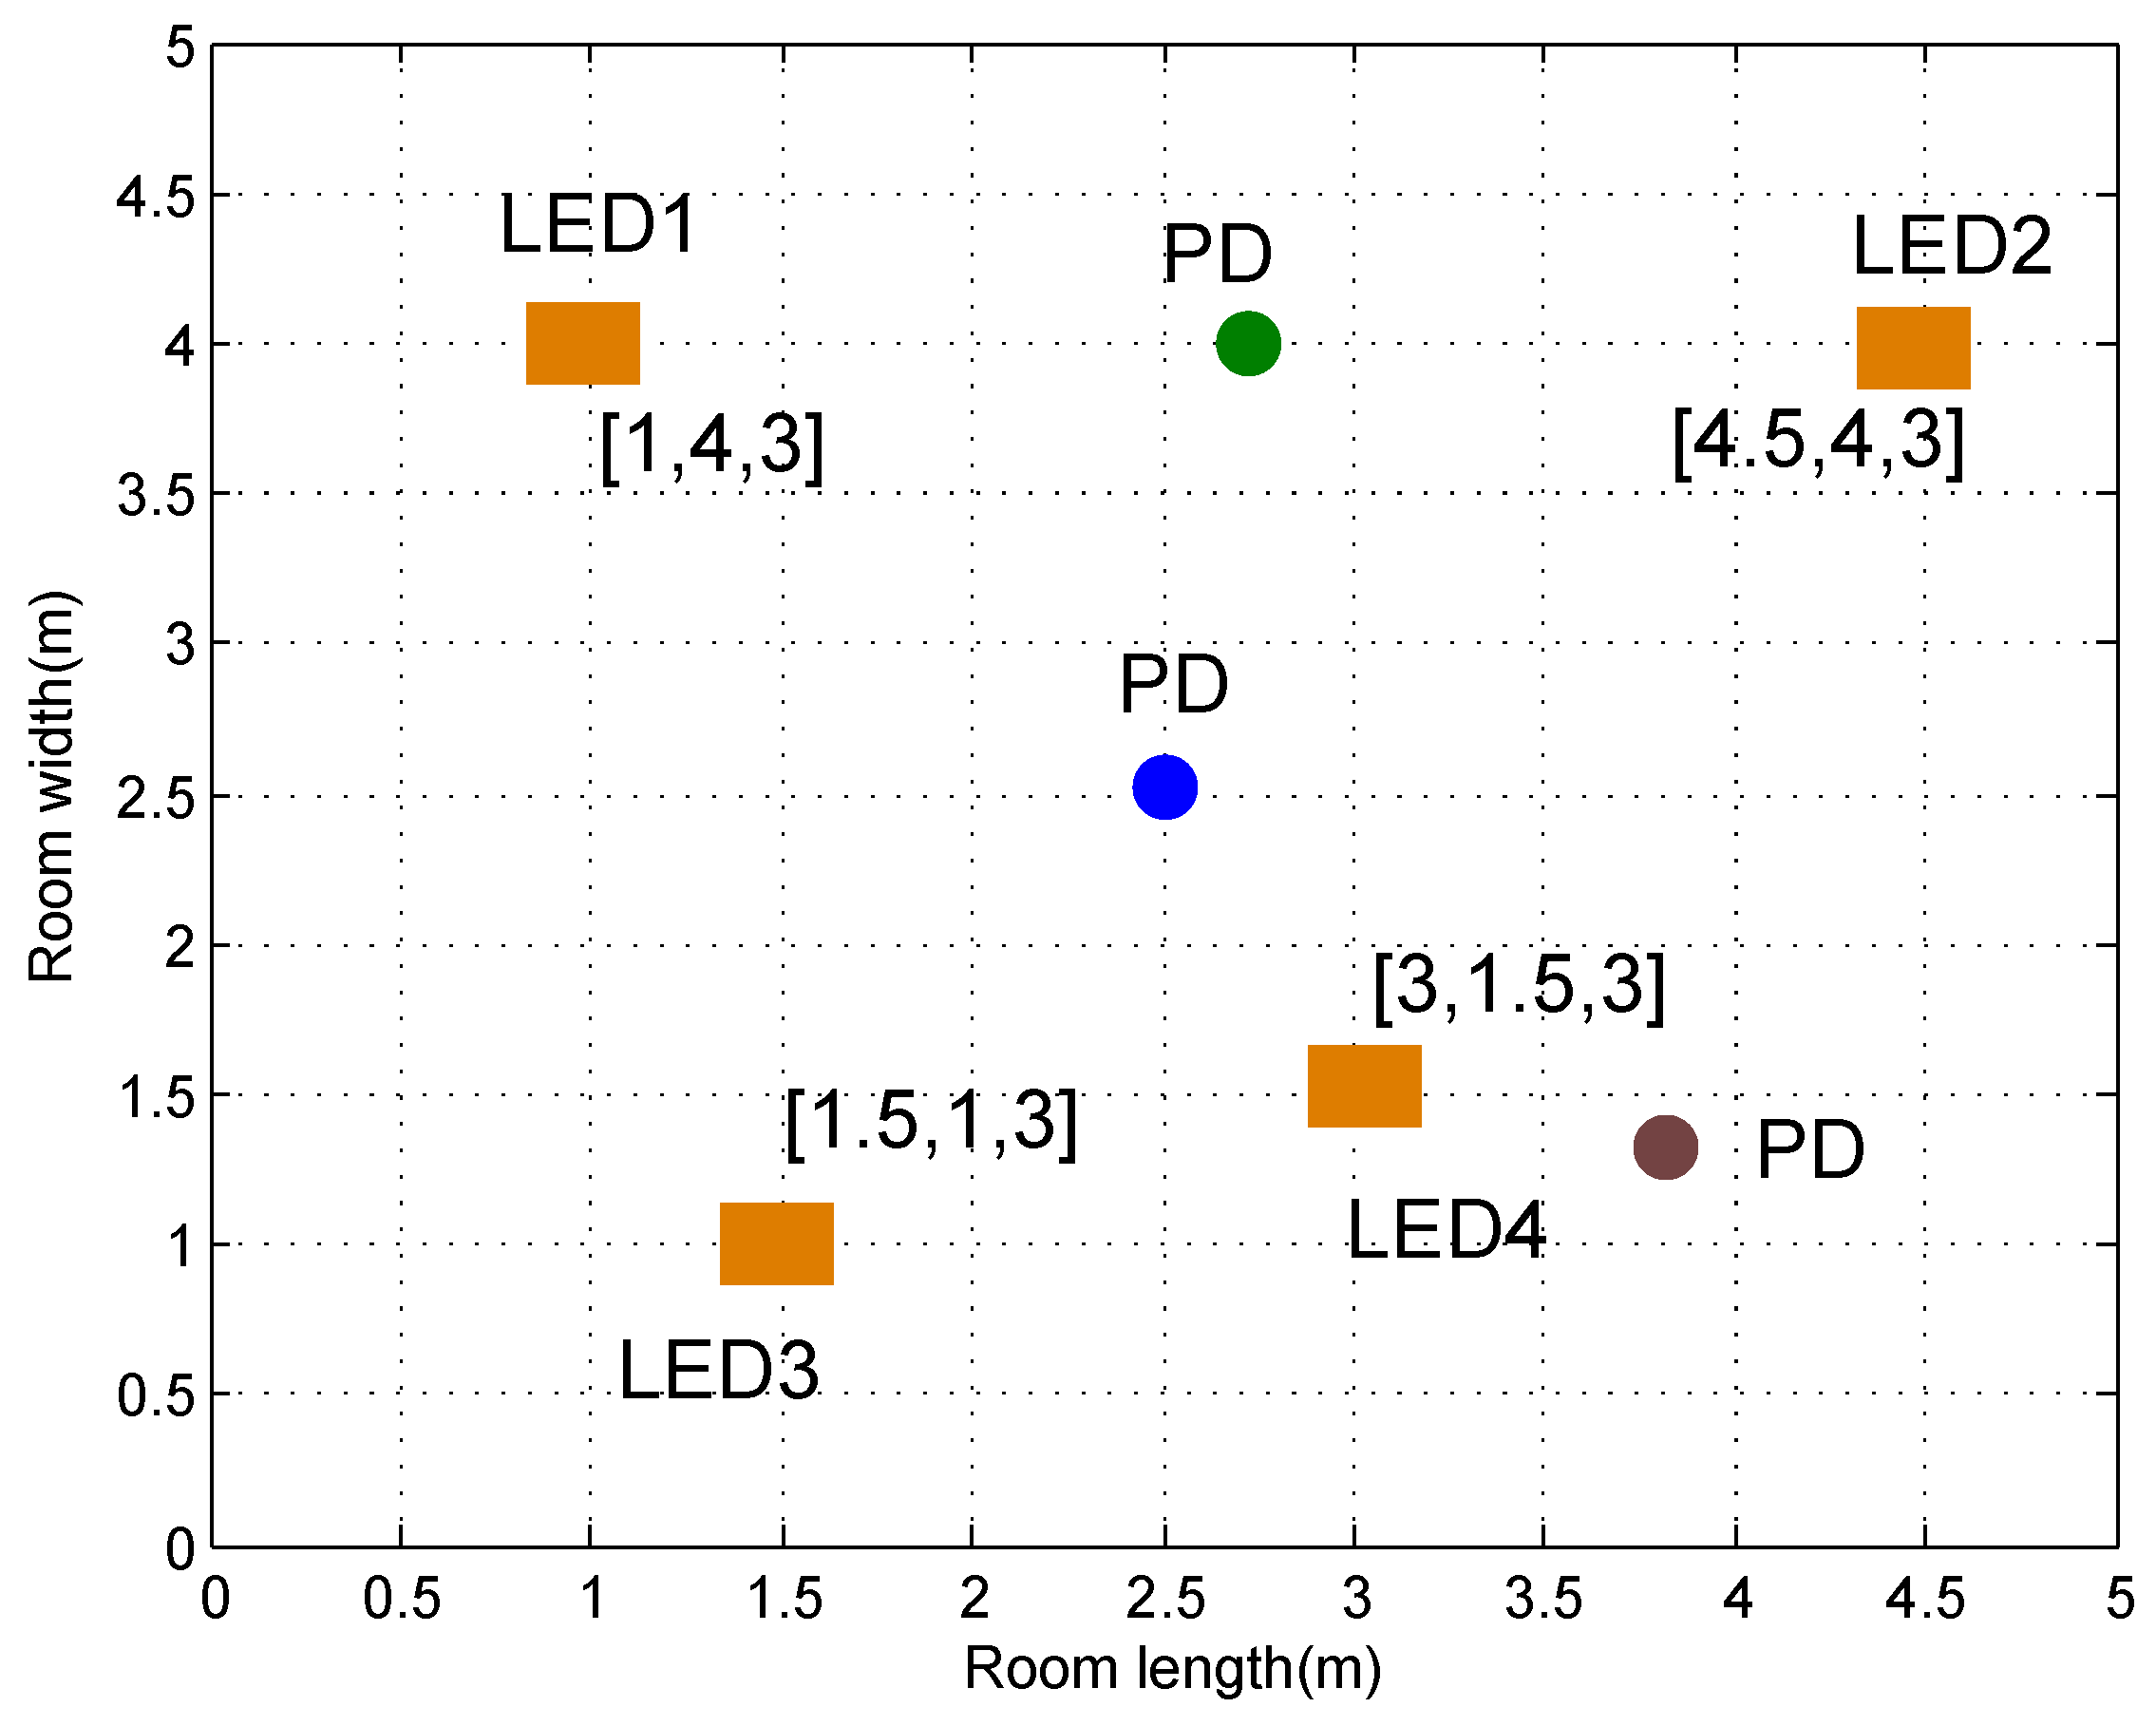
Figure 15.
EE performance comparison for different clusters.


Table 1.
System parameters.
| Symbol | Parameter | Value |
|---|---|---|
| /(°) | Emission semi-angle of LED | 30 |
| /W | Transmitted power of LED | 8 |
| /(°) | Irradiance angle of LED | [30,60] |
| /Mbps | Data rate requirement | |
| /(°) | Receiver FOV | 30 |
| /m | Linear distance interval of the LEDs and PD | [0.5:0.25:2] |
| / | Effective receiving area of PD | 1 |
| n | Reflective index | 1.5 |
| Gain of optical filter | 1.0 | |
| N | Power multiplexing factor | 2 |
| /dBm | Detection threshold at SIC receiver | 10 |
Table 2.
Performance analysis of the user clustering algorithm.
| Aspects | TSCA | RCA | PGCA [25] |
|---|---|---|---|
| Principle | Exhaustive search | Random selection | Based on the channel gain difference |
| Advantage | Good performance | Implement simply | Compromise between performance and simplicity |
| Disadvantage | High complexity | Poor effect without considering the channel condition | Harder to choose an appropriate channel threshold interval |
Table 3.
Performance analysis of power allocation algorithms.
| Aspects | FPA [26] | FTPA [27] | FSPA |
|---|---|---|---|
| Principle | Set a fixed power distribution factor | Dynamic power allocation based on channel gain | Exhaustive search |
| Advantage | Implement simply | Compromise between performance and simplicity | Good performance |
| Disadvantage | Unguaranteed system performance | Harder to set the power allocation factor | High complexity, not applicable to actual scenarios |
Disclaimer/Publisher’s Note: The statements, opinions and data contained in all publications are solely those of the individual author(s) and contributor(s) and not of MDPI and/or the editor(s). MDPI and/or the editor(s) disclaim responsibility for any injury to people or property resulting from any ideas, methods, instructions or products referred to in the content. |
© 2024 by the authors. Licensee MDPI, Basel, Switzerland. This article is an open access article distributed under the terms and conditions of the Creative Commons Attribution (CC BY) license (https://creativecommons.org/licenses/by/4.0/).
Share and Cite
MDPI and ACS Style
Wu, Y.; Sun, L.; Liu, X.; Lin, X. Research on Energy Efficiency Optimization of Visible Light Communication Based on Non-Orthogonal Multiple Access. Electronics 2024, 13, 1562. https://doi.org/10.3390/electronics13081562
AMA Style
Wu Y, Sun L, Liu X, Lin X. Research on Energy Efficiency Optimization of Visible Light Communication Based on Non-Orthogonal Multiple Access. Electronics. 2024; 13(8):1562. https://doi.org/10.3390/electronics13081562
Chicago/Turabian StyleWu, Yali, Lei Sun, Xiaoshuang Liu, and Xiaoran Lin. 2024. "Research on Energy Efficiency Optimization of Visible Light Communication Based on Non-Orthogonal Multiple Access" Electronics 13, no. 8: 1562. https://doi.org/10.3390/electronics13081562
Note that from the first issue of 2016, this journal uses article numbers instead of page numbers. See further details here.