Article

A Validated Analytical Model for Availability Prediction of IPTV Services in VANETs

Department of Computer Science, University of Hamburg, Vogt-Kölln-Str. 30, D-22527 Hamburg, Germany
*
Author to whom correspondence should be addressed.
Electronics 2014, 3(4), 689-711; https://doi.org/10.3390/electronics3040689
Submission received: 30 October 2014 / Revised: 3 December 2014 / Accepted: 11 December 2014 / Published: 19 December 2014
(This article belongs to the Special Issue Connected Vehicles, V2V Communications, and VANET)

Abstract

:
In vehicular ad hoc networks (VANETs), besides the original applications typically related to traffic safety, we nowadays can observe an increasing trend toward infotainment applications, such as IPTV services. Quality of experience (QoE), as observed by the end users of IPTV, is highly important to guarantee adequate user acceptance for the service. In IPTV, QoE is mainly determined by the availability of TV channels for the users. This paper presents an efficient and rather generally applicable analytical model that allows one to predict the blocking probability of TV channels, both for channel-switching-induced, as well as for handover-induced blocking events. We present the successful validation of the model by means of simulation, and we introduce a new measure for QoE. Numerous case studies illustrate how the analytical model and our new QoE measure can be applied successfully for the dimensioning of IPTV systems, taking into account the QoE requirements of the IPTV service users in strongly diverse traffic scenarios.

Graphical Abstract

1. Introduction

Currently, one can observe strong growth in the elaboration of vehicular ad hoc network (VANET) technologies [1,2] and their usage to support various applications, which, at the beginning, were mainly concerned with the desire to improve traffic safety [3]. A network design framework that focuses on safety and security has been proposed by Qian et al. [4]. Meanwhile, applications related to infotainment in VANETs [5] are being focused on more and more by researchers and developers, too. This trend towards infotainment does result, e.g., in the increasing relevance of the provisioning of IPTV services in VANETs. When IPTV services are offered, the quality of the services as experienced by the end-users (i.e., the “quality of experience” [6] or QoE) is of utmost importance. Most of the existing studies concerned with QoE in the context of audio/video communications in real time have been related to the audio-visual quality of the audio/video stream as it is offered to the receiver (i.e., the human end-user). The audio-visual quality of the received stream is judged by QoE measures, such PESQ/PEAQ/PEVQ (perceptual evaluation of speech/audio/video quality) [7], POLQA (perceptual objective listening quality assessment) [8] or by means of MOS (mean opinion score) [9]. Bellalta et al. [10] propose an interesting approach for a dynamic adaptation of the video bit rate in order to maintain a certain level of video quality in a scenario of vehicular video surveillance. Another study, again related to vehicular video surveillance in VANETs (based on IEEE 802.p), has been published by Belyaev et al. [11]. Here, too, QoE is evaluated in terms of visual quality and its impairment by packet losses. A mechanism for error-resilience coding is investigated. Of course, the audio-visual quality is also relevant to judge the QoE of IPTV services in VANETs, more so because the TV channels are offered to the corresponding car passengers via wireless access networks, and this may have a strongly negative impact on the quality of the stream delivered to its receiver(s). Zhou et al. [12] measure user-satisfaction when users access media services via peer-to-peer (P2P)-based VANETs. In particular, they propose a scheme that solves content dissemination, cache update and fairness problems for P2P-based VANETs. However, unlike our studies, Zhou et al. do not consider IPTV services, nor do they assume multicast for the provisioning of the media services.
Anyway, the audio-visual quality is only one aspect of IPTV service quality in VANETs, and this aspect may even be much less important than the availability of desired TV channels, which is an additional highly important QoE measure for IPTV services in VANETs. The reason why the availability of TV channels is becoming so relevant in VANETs results from the fact that the users of the service (car passengers) may move very fast, which can lead to very frequent changes of cells (implying handovers) in the cellular access networks. In case of bottlenecks regarding the available bandwidth in the corresponding cell, it may be possible that a newly-desired TV channel (during a channel switching event within a given cell) or the currently-watched TV channel (during a handover event) can no longer or cannot at all be offered to the IPTV user. This demonstrates that TV channels may be temporarily unavailable, which is particularly annoying in the case of a handover, when a currently-watched channel may become unavailable upon reaching a new cell.
During the past, already, comprehensive studies have been carried out to evaluate the availability of IPTV for different types of access networks. In particular, Lai has investigated the availability-related QoE for DSL-based access networks [13], which offer IPTV to non-mobile users at their homes [14,15]. Moreover, Abdollahpouri has done similar investigations for WiMAX-based access networks [16] by which IPTV is offered to either non-mobile or (slightly) mobile users [17]. More recent research, done by Momeni et al., has started to study the availability of IPTV in the context of VANETs with their rather specific mobility models [18,19]. All of these investigations are exclusively based on the usage of simulation models. This paper, to the best of our knowledge, is the first publication for which the results allow one to evaluate the availability of IPTV in VANETs, not only by using simulation models, but also by applying a realistic analytical model. As is well-known, analytical models typically have significant advantages compared to simulation models, e.g., in terms of model execution times, the expenditure of experimentation, strong simplification of comprehensive parameter studies, e t c . These advantages also hold for the analytical model presented in this paper.
The paper is structured as follows: Section 2 contains some fundamentals for our work, such as VANETs, IPTV, as well as QoE measures, to assess the availability of IPTV services. Section 3 presents the analytical model and is followed in Section 4 by the results that we obtained during the test and validation phase of our model. Section 5 and Section 6 contain comprehensive case studies that make use of our validated model. The paper concludes with Section 7.

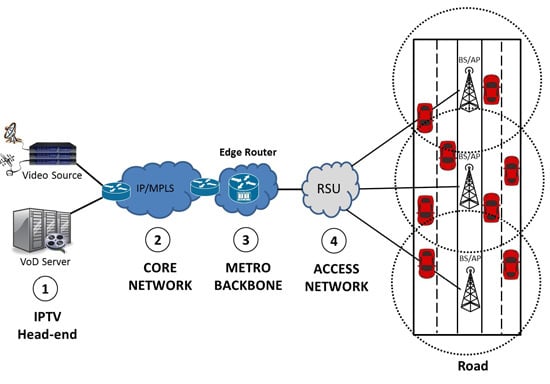
2. VANETs, IPTV Services and Their Evaluation

2.1. Vehicular Networks

Vehicular networks are a new class of wireless networks that have appeared thanks to developments in wireless technologies and in the automobile industry. Vehicular networks are formed between moving vehicles equipped with wireless interfaces that can be related to either homogeneous or heterogeneous technologies.
In vehicular networks, as shown in Figure 1, on the one hand, vehicles can communicate with each other, which is called inter-vehicle communication or vehicle-to-vehicle communication (V2V). On the other hand, vehicles can connect to the Internet via a dedicated infrastructure, typically based on road-side units (RSU), and this is called vehicle-to-roadside or vehicle-to-infrastructure communication (V2I). In this paper, we consider VANETs, in which vehicles are driving on motorways, resp. freeways (with a different number of lanes and various traffic densities).
Vehicular networks have attracted significant interest and have led to a strongly increasing number of research and development activities in recent years. Furthermore, vehicular networks have become more and more important because of the need to support the growing number of wireless products that can now be used in vehicles [20,21]. These products include remote keyless entry devices, tablets, laptops, smart phones and mobile phones. Vehicular networks can be utilized for a broad range of safety and non-safety applications and allow for value-added services, such as vehicle safety, traffic management, enhanced navigation and infotainment applications. Connected vehicles will be able to offer several services to their users, like provisioning of entertainment content. Entertainment applications can transform a boring trip to an enjoyable experience. These applications will help to make the travel experience enjoyable, as vehicle users will be able to have access to Internet content, like web pages, IPTV services, and so on.
Figure 1. Vehicle-to-vehicle (V2V) and vehicle-to-infrastructure (V2I) networks.
Electronics 03 00689 g001

2.2. IPTV Systems, Services and User Behavior

These days, the convergence of telecommunications, the Internet and information technologies offers the opportunity to service providers to gain more subscribers, as well as being able to earn more annual revenue. This becomes particularly obvious if we look at the recent appearance of triple-play services. Amongst the triple-play services that have become more and more popular, we find, e.g., Internet Protocol TV (IPTV) [22], which makes use of IP packets to transport audio, video and control signals. IPTV is a new digital broadband technology that offers voice, data and video at the same time. The main advantage of IPTV is its ability to provide a rich TV viewing experience to the users. IPTV services can be divided into two classes: video on demand (VoD) for stored content and broadband-TV (BTV) for live TV channels. An IPTV network is typically constituted of an interconnection of several broadband networks that are capable of supporting the required bandwidth for video delivery (in particular, the delivery of TV channels). Figure 2 illustrates an IPTV network topology that is split into five main parts: IPTV head-end, core network, metro backbone, access network and subscribers.
The IPTV head-end is responsible for delivering video and content, i.e., the original TV channels, to the core network, which represents a high-speed communication infrastructure. The core network distributes the video streams from the head-end to the metro backbone. The metro backbone interconnects the core network with the different access networks. The metro backbone transports the multimedia content to the end users (subscribers), reachable via the access network. Such an access network manages the user demands by using the return channel. The main requirement of an access network is to have enough bandwidth to support multiple IPTV channels as demanded by the currently-active set of subscribers. Finally, the subscribers may be connected to the access network either directly or have their own local network, which enables indirect communication and information exchange between the user’s device (e.g., TV set) and the access network. This direct or indirect communication allows accessing the available resources on the IPTV network.
Figure 2. Main components of a VANET-based IPTV system.
Electronics 03 00689 g002
Nowadays, neither the core network nor the metro backbone (which might be an interconnection of several broadband networks) will become a bottleneck for the delivery of IPTV services. Therefore, let us assume that bottlenecks in the delivery of IP channels to their vehicular users will mainly result from the limited bandwidth of the access network.
To deliver the TV channels to the users upon their demand, an IPTV service may either use multicast or unicast transmission. Evidently, multicast transmission of a TV channel into a given cell of the access network only makes sense if, at the given instant, this channel is demanded (watched) by more than one user in this cell. Astonishingly, Abdollahpouri and Wolfinger were able to show that in some situations, unicast may be able to outperform multicast, even if more than one user is demanding the corresponding channel (for details, cf. [23]).
When using multicast, so-called multicast-trees are dynamically established, and the users of a multicast channel C i form a multicast-group MG( C i ) [24]. If a new user is now demanding C i , this user issues a JOIN request for MG( C i ). On the other hand, if a current user of C i no longer wants to watch, C i would issue a LEAVE request for MG( C i ), possibly followed by a JOIN request for another channel C j that he/she wants to switch to now. Evidently, LEAVE and JOIN requests may lead to a restructuring of the corresponding multicast-tree. When analyzing IPTV services, the duration between successive pairs of (LEAVE( C i ), JOIN( C j )) requests for a given user are of utmost importance. If the user is “zapping” through a sequence of channels, the corresponding time intervals are rather short (≈10 s); if he/she is in a “viewing” phase, the length of such a phase could, on average, be in the order of 5 to 10 min [17]. Another important characteristic relevant for IPTV users is the probability with which users choose their channels (when they start a zapping or viewing phase). The probabilities of the channels to be selected by users are called channel popularities. Studies in the past have demonstrated that modeling channel popularities by means of the Zipf distribution (also called Zipf’s Law) leads to quite realistic models [17].
Therefore, in this paper, we have decided to also use the Zipf distribution [25], which, in the context of IPTV, offers good ability to represent the skewed popularity distribution of the TV channels. In particular, the probability p i that the i-th popular channel is requested is determined by the Zipf distribution in the following manner:
p i = 1 / i Θ k = 1 N ( 1 / k Θ )
where N denotes the total number of distinct channels, k is their rank and Θ is the Zipf parameter that determines the degree of popularity skew. In our case studies, e.g., for Θ, we choose a value of 1.3, which is realistic according to measurements of IPTV user behavior (cf. [17]).

2.3. Measures to Assess IPTV Service Availability

In this subsection, we want to introduce a set of measures that allow us to quantify QoE for IPTV, focusing on the availability of TV channels as requested by the service users. We distinguish between measures that are related to the set of all IPTV users and those ones that concern only individual users.

2.3.1. QoE Measures Related to All Users

Let us assume that the IPTV service is offered during a time interval:
T = [ t 1 , t 2 ] , t 2 > t 1 , | T | = t 2 - t 1
Let us furthermore denote:
  • nr(T): the number of all channel requests issued by all users in interval T
  • nb(T): the number of all channel requests that cannot be satisfied by the IPTV service provider (i.e., they are blocked) and that were issued by all users in interval T
  • n r h (T) and n r s (T): the number of handover-related, resp. switching-related, requests issued by all users in interval T
Thus, n r h (T) + n r s (T) = nr(T).
  • n b h (T) and n b s (T): the number of handover-related, resp. switching-related, requests (again, issued by all users) that are blocked
Thus, n b h (T) + n b s (T) = nb(T).
Based on these variables, we can now define a set of channel blocking frequencies for interval T, e.g.,
  • CBF(T) n b ( T ) n r ( T ) , which we call the overall channel blocking frequency
  • HBF(T) n b h ( T ) n r ( T ) , called the handover-related channel blocking frequency
  • SBF(T) n b s ( T ) n r ( T ) , called the switching-related channel blocking frequency
We now assume the limit |T| → and obtain:
  • CBP lim | T | CBF(T), called the overall channel blocking probability
  • HBP lim | T | HBF(T), called the handover-related blocking probability
  • SBP lim | T | SBF(T), called the switching-related blocking probability
and consequently:
  • CA ≜ 1 - CBP will denote the overall channel availability.
The QoE measures related to all users are mainly of interest to the provider of the IPTV service, who tries to optimize the service quality experienced (on average) by the set of all of its users.

2.3.2. QoE Measures, Individual Users

Unlike the QoE measures for all users, the measures for individual users become dependent on the driving behavior of the car (in particular, the vehicle speed) in which IPTV is used. A new measure for QoE of IPTV services in VANETs that looks very promising to us should be related to the mean number of blockings to be expected per hour of watching IPTV and driving at a velocity of v (km/h). Therefore, we introduce the following variables that can be used as meaningful QoE measures:
  • b p h ( v ) : the expected number of channel blockings per hour experienced by a user permanently using the IPTV service and driving at a constant speed of v
  • b p h s : the expected number of switching-related blockings per hour experienced by a user permanently using the IPTV service
  • b p h h ( v ) : similar to b p h s , but now for handover-related blockings per hour (instead of switching-related blockings).
In particular, the speed v of a vehicle has a direct impact on the number of handovers per hour, because the time Δ h o between successive handovers at a vehicle speed of v , driving through a cell with diameter 2 · c r , will be:
Δ h o = 2 · c r v [ k m ] [ k m / h ] = 2 · c r v [ h ]
This indicates that b p h h is a function of v , which is illustrated in detail in our case studies (cf. Section 5 and Section 6). If CBP is identical in all cells that are passed by a vehicle within one hour, then b p h s remains independent of v . Evidently, the CBP value of adjacent cells will remain identical if the traffic scenario, the access network and the IPTV service characteristics of both cells do not vary, which is assumed in our studies.

3. An Analytical Model to Assess IPTV Availability

3.1. Model Requirements and Basic Assumptions

In this section, we are going to elaborate on an analytical model that allows us to determine all of the QoE measures introduced in Section 2.3. In particular, the model will focus on the assessment of those QoE measures that are related to individual users. One of our main requirements towards our analytical model is that it should be able to predict the availability of IPTV services in VANETs for a large variety of scenarios, e.g., with respect to vehicular traffic characteristics, to the properties of the wireless access networks used, as well as the characteristics of the IPTV service and of TV user behavior. In particular, the analytical model should offer parameters regarding the:
(a)
Traffic on the motorway section observed, e.g.,
-
k: the number of lanes per direction
-
Per lane L i : the speed of vehicles v i (in (km/h)) driving in this lane (assumed to be constant) and d m i n , i ≜ the minimum acceptable distance between adjacent vehicles in lane L i ( d m i n , i being dependent on v i ) and d i (in (m)) the actual mean distance between adjacent vehicles (where d i d m i n , i has to be fulfilled)
-
The motion model of vehicles, assuming that vehicles are driving with constant speed in their lane (neglecting taking-over events)
(b)
The wireless network used to distribute the TV channels
-
The radius c r of the cells
-
The maximum bandwidth B W c available in a cell to distribute TV channels ( B W c , assumed to be constant; as we assume a constant data rate required to send each TV channel, we can specify B W c as the maximum number of TV channels that can be distributed in parallel in the given cell)
(c)
The IPTV service offered, as well as its users’ behavior
-
The total number N of TV channels offered by the IPTV service
-
The probability α that a vehicle will use the IPTV service
-
The parameters to specify user behavior (e.g., assuming the Zipf distribution with parameter θ to specify the probabilities of TV channels accessed and a mean time ΔT (in (h)) for two successive channel switching events of an IPTV user).
The parameters as listed above are all to be supported by the analytical model introduced in Section 3.2.

3.2. Our Analytical Model

The analytical model will be based on the following main steps:
Step 1:
Determine the mean number of IPTV users N c to be expected in a cell of the wireless access network (among others, N c will be dependent on the traffic scenario, the cell diameter, α, e t c . ).
Step 2:
Determine CBP = CBP( N c ) for a given number N c of IPTV users (cf. Step 1) by means of Monte Carlo simulation (among others, CBP( N c ) will be dependent on B W c , the total number N of TV channels offered, specified user behavior, e t c . ).
Step 3:
Determine the rate r s with which, for a given user, switching-induced blockings will occur per hour (being, e.g., dependent on ΔT, i.e., the mean time between successive channel switching events). The mean number of switching events per hour is 1 Δ T , and therefore:
r s = b p h s = 1 Δ T · C B P b l o c k i n g s h
Step 4:
Determine the rate r h with which, for a given user driving at a speed of v , handover-induced blockings will occur per hour (being, e.g., dependent on the cell diameter besides the car speed). The mean number of handover events per hour is v 2 · c r , and therefore:
r h = b p h h ( v ) = v 2 · c r · C B P b l o c k i n g s h
Step 5:
Determine the expected number of channel blockings per hour for an individual user b p h ( v ) = b p h s + b p h h ( v ) .
We observe that the analytical model, besides determining CBP in an early step, allows us to determine all of the QoE measures related to individual users (cf. Section 2.3.2).
What is still missing is a refinement of Steps 1 and 2, which will be discussed now.
  • Refinement of Step 1: The expected number N c of IPTV users in a cell can be derived in a straight-forward manner as follows: Lane L i , i ∈ {1, 2, ..., 2k}, has a length of 2· c r between the borders of the cell, and assuming a mean distance d i between adjacent vehicles, we can expect 2 · c r d i vehicles in lane L i in this cell, which corresponds to α· 2 · c r d i IPTV using cars, i.e.,
    N c = i = 1 2 k α · 2 · c r d i
    because we have two directions and k lanes per direction. Here, ⌈x⌉ denotes the “ceiling function”, which we use to get an integer value for N c and, moreover, to have a (slightly) pessimistic estimate of CBP in Step 2.
  • Refinement of Step 2: The refinement of this step is not as straight-forward as Step 1. The reason for this mainly stems from the fact that, for a given traffic scenario, the value of CBP will evolve over time (i.e., CBP will tend to decrease). Looking at a fixed traffic scenario in the early phase, the bandwidth of the cell could still partially be exhausted by rather unpopular TV channels, but in the long run, the IPTV system for a fixed scenario will tend to a state in which the most popular TV channels will occupy nearly all of the available bandwidth in a bottleneck situation, where B W c different TV channels are delivered within the cell. That is why, in Step 2, we use two different types of submodels of our analytical model: one for the early period of the observed traffic situation (e.g., during the first h) and another one for the late period of the traffic situation (e.g., fourth to fifth h). Please note that, in reality, a given traffic situation typically will not last much longer than 5 h, excluding traffic situations at night, which are not of much interest.
    (a)
    Late period of the traffic scenario observed:
    The basic idea underlying our solution to determine CBP( N c ) in Step 2 for the late period is the following:
    We perform N c successive draws of TV channels according to their watching probabilities (cf. the Zipf distribution). After this experiment, we get a certain number of different channels that we have drawn during the experiment. Let us call this number n j for the j - t h experiment. If we repeat this experiment for numerous times (which leads to a Monte Carlo simulation [26]), we can finally calculate the probabilities P i for needing exactly i different TV channels to fulfill the random channel selections of N c users (governed by the Zipf distribution).
    If B W c different channels can be multicast in parallel, the probability P * that we get into a state where no bandwidth for a new channel would be available is:
    P * = i = B W c + 1 N P i
    If we assume that we are in the late period of a traffic scenario and that in a situation where the complete bandwidth is exhausted, all of the bandwidth B W c will be used by the most popular channels, we now can determine CBP( N c ). Namely, blocking occurs if currently no free capacity is available and the next TV channel requested has a channel number greater than B W c .
    Thus:
    C B P ( N c ) = P * · j = B W c + 1 N p j ,
    where p j denotes the watching probability of TV channel C j .
    (b)
    Early period of the traffic scenario observed:
    CBP( N c ) in Step 2 for the early period is quite well covered by the following analytical model:
    This second, alternative model still continues to use P * (determined by Monte Carlo simulation, as described above).
    However, we assume that we want to calculate CBP for the first customer who executes a channel switching event in a bottleneck situation, i.e., the first customer who switches to a new channel after B W c different TV channels are transmitted in parallel for the first time. Clearly, this happens very early during the period of observation.
    Our calculation will be based on
    Z i ≜ mean the number of draws (of the desired TV channels) until i different channels are required for the first time.
    Again, Z i can be determined in a straight-forward manner by Monte Carlo simulation (similar to the way we calculate P * ).
    Let Z * denote the mean number of draws until the complete bandwidth B W c will be exhausted for the first time, i.e., Z * = Z i with i = B W c .
    Then, a specific channel C j being requested during the ( Z * + 1 ) - t h channel switching event, during a situation when the complete bandwidth is exhausted, will be unavailable, iff channel C j had not been drawn during the first Z * draws, but it is desired just now. This happens with probability p j ( 1 - p j ) Z * , as we assume the independent behavior of IPTV users.
    Therefore,
    C B P ( N c ) = P * · j = 1 N p j · ( 1 - p j ) Z *
    where, evidently, only the first term on the right-hand side, i.e., P * , is dependent on N c .
    This concludes the refinement of Steps 1 and 2, as well as the presentation of the analytical model, including its two variants covering different periods of the traffic scenario observed. Of course, because of using Monte Carlo simulation in Step 2, we could call our analytical model also a hybrid model (i.e., a combination of the analytical and simulation models). Anyway, we stay with the notion of the analytical model because, besides Step 2, all steps of our model are strictly based on mathematical calculations, as is the case in analytical models.

4. Model Test and Validation

4.1. Model Test

After having implemented our analytical model in its two variants, we applied numerous tests to judge the plausibility of the results delivered by the model. In particular, we assumed sets of experimental boundary conditions for which results can be calculated by hand. We observed perfect agreement between the model results and the results expected a priori. Therefore, we considered the model being correct in the sense that it satisfies its specification.

4.2. Model Validation

A different question, of course, is whether the analytical model produces results that are sufficiently valid. We tried to answer this question by means of using a simulator that we had developed to support our research on IPTV service availability in VANETs in the past (e.g., [27]). This simulator models in detail the exact behavior of IPTV users, such as published in [28], even distinguishing between the zapping and viewing behavior of users.
In order to validate both variants of our analytical model, we carried out simulation experiments, only considering the early period of a given traffic scenario (starting model observation directly after the end of the initial transient phase at the beginning of the simulation experiment), as well as experiments covering the late period of the scenario (starting model observation, i.e., the collection of experimental data only after, e.g., 4 h). Therefore, we compared the simulation results obtained for each of both periods to the results determined by the corresponding analytical model. In all of our experiments, simulations and analytical models, we assume:
-
B W c = 40
-
N = 100
-
θ = 1.3
-
k = 3

4.2.1. Series I of the Validation Experiments

In the validation experiments of Series I, we aimed at finding out whether our analytical models are close enough to reality if we (strongly) change the cell sizes, keeping the traffic situation on the motorway, as well as the characteristics of the IPTV service constant. The traffic parameters assumed were:
  • ( v 1 , v 2 , v 3 ) = (90, 120, 150)
  • ( d 1 , d 2 , d 3 ) = (15, 20, 25)
with symmetric assumptions regarding speed and distance between vehicles in the other direction. The cell sizes considered were determined by the following cell radii c r ∈{3 km, 5 km, 7 km}.
The following model assumptions were made:
  • Simulation model:
    -
    The behavior of individual users was modeled in detail
    -
    The simulation results were collected for an early period [ t 0 , t 0 +30 min] and for a late period [1h, 2h], as well as for the overall period [ t 0 , 2h], where t 0 denotes the end of the transient phase of the corresponding simulation experiment.
  • Analytical model:
    -
    The behavior of individual users was not modeled, but only their aggregated behavior, in particular ΔT = 180 s.
All other assumptions, in particular regarding traffic on the motorway, the wireless network used and the characteristics of the IPTV service offered, were the same, both for the simulation as for the analytical model(s).
During the simulation experiments, it turned out that the behavior of the IPTV system, as expected for the late period of a scenario, was always reached astonishingly early and that the CBP values predicted by the simulation experiments were significantly smaller than those ones predicted by our analytical model A M e for the early period. Anyway, A M e in all of our experiments, up to now, delivered an upper bound for the CBP values obtained in the simulation. Our analytical model A M l for the late period is much closer to the simulation model (SM). Therefore, we suggest using A M e to get a rather reliable upper bound for CBP, which may also be of strong interest to an IPTV service provider.
Table 1 summarizes the results of Series I experiments. Besides the CBP values predicted by A M e and A M l , we give the CBP value obtained by simulation (SM). As CBP does not vary significantly during an observation interval of 2 h (as assumed in the simulation experiments), we just determine the CBP that results for the whole interval, only neglecting the initial transient phase of the experiment.
Table 1. The channel blocking probability (CBP) predicted by the analytical models ( A M e and A M l ) and the simulation model (SM) and the deviations between A M l and SM.
Series I
Cr (km)CBP (%)Deviation (%)
AMeAMlSMRelativeAbsolute
38.7165.8332.91650.0092.917
512.6448.4636.7520.2411.713
712.6458.4648.3930.8390.071
Table 1 also calculates the:
  • Relative deviation between the CBP of A M l and SM, calculated as follows:
    C B P ( A M l ) - C B P ( S M ) C B P ( A M l ) · 100 ( % )
    and the:
  • Absolute deviation between CBP of A M l and SM, calculated as follows:
    ( C B P ( A M l ) - C B P ( S M ) ) · 100 ( % )
Table 1 shows that for c r = 3 km, A M l is rather pessimistic (with quite significant relative deviation). For c r = 5 km, the deviation starts to become acceptable, and for c r = 7 km, the agreement between CBP ( A M l ) and CBP(SM) is perfect. Anyway, in judging the deviations, we have to take into account that CBP(SM) is not really a point, but rather a confidence interval of non-negligible size, which makes deviations even more acceptable.

4.2.2. Series II of Validation Experiments

In the validation experiments of Series II, we now fix the cell size ( c r = 3 km), but we vary the traffic situation on the motorway. In particular, we investigate three strongly different traffic situations characterized by the following sets of parameters:
  • Low utilization
    ( v 1 , v 2 , v 3 ) = (80, 130, 150)
    ( d 1 , d 2 , d 3 ) = (30, 40, 50)
  • Medium utilization
    ( v 1 , v 2 , v 3 ) = (80, 100, 120)
    ( d 1 , d 2 , d 3 ) = (20, 30, 40)
  • High utilization
    ( v 1 , v 2 , v 3 ) = (10, 15, 20)
    ( d 1 , d 2 , d 3 ) = (10, 15, 20)
Again, speeds and distances between vehicles are symmetric for the lanes in the reverse direction.
All other assumptions were identical to those of Series I. We also made the same comparisons between A M e , A M l and SM as in Series I. Table 2 summarizes the results of the Series II experiments. We see that for low and medium utilization, we get perfect agreement between CBP( A M l ) and CBP(SM), as even the first digit after the comma is identical. Besides, the relative deviation of −800% for low utilization has no relevance because the CBP value is negligibly small in the case of A M l and SM. The relative deviation between A M l and SM for high utilization may still be acceptable, again taking into account the fact that there is uncertainty in CBP(SM), cf. non-negligible confidence interval size.
Table 2. CBP predicted by the analytical models ( A M e and A M l ) and the simulation model (SM) and deviations between A M l and SM.
SERIES II
UtilizationCBP (%)Deviation (%)
AMeAMlSMRelativeAbsolute
Low0.0040.0020.018(−800)−0.016
Medium0.6330.4240.4220.4720.002
High12.5368.3985.62633.0082.772
To shortly summarize the outcome of both series of validation experiments, we had perfect agreement in three of six scenarios investigated. In the three other scenarios, A M l turned out to be pessimistic, but still applicable to estimate CBP with reasonable precision. We executed various additional validation experiments in which we observed similar deviations. The good news is that in all validation experiments executed by us so far, the absolute deviation between CBP( A M l ) and CBP(SM) was less than 3% and, in most cases, even less than 2%.

5. Case Study A: Blocking Probability in Different Traffic Scenarios

After we have introduced, tested and validated the new analytical models, we will continue to utilize them in order to study the implications that a varying number of offered IPTV channels have on the QoE for IPTV subscribers in VANETs. Our studies in Case Study A will assume strongly different traffic scenarios.
The aim of any provider of IPTV services is to ensure the best possible QoE for the subscribers, including a (nearly) blocking free viewing experience while providing a choice between numerous different channels with only limited network resources. It is to be expected that a wider range of possibly accessible channels will result in a greater number of distinct channels being requested. This yields the general problem that the likelihood of a cell’s bandwidth becoming exhausted is higher, and mainly in the early periods of a traffic scenario, this may also lead to the inaccessibility of popular channels, since they were not yet able to enforce their current multicast transmission. Additionally, the probability that a requested channel is not yet being transmitted becomes higher, amplifying the effects of the high workload of the IPTV system.
To address the aforementioned issues, it is important to analyze the relation between an increasing number of offered IPTV channels (under the condition of a constant bandwidth) and the QoE measures b p h s and b p h h ( v ) , as they were introduced in Section 3.2 using both analytical models for the early and late periods of a traffic scenario. Furthermore, as mentioned, different traffic scenarios will be taken into account.
In Case Study A, we will take a look at b p h s and b p h h ( v ) separately, since this approach allows us to discuss the simulation results with respect to different QoE-thresholds for both values.
Traffic scenarios:
  • Low utilization (LU)
    ( v 1 , v 2 , v 3 ) = (80, 130, 150)
    ( d 1 , d 2 , d 3 ) = (30, 48, 56)
  • Medium utilization (MU)
    ( v 1 , v 2 , v 3 ) = (80, 100, 120)
    ( d 1 , d 2 , d 3 ) = (30, 37, 45)
  • High utilization (HU)
    ( v 1 , v 2 , v 3 ) = (10, 15, 20)
    ( d 1 , d 2 , d 3 ) = (10, 10, 15)
Constant parameters:
  • k = 3
  • c r = 5 km
  • B W c = 40
  • θ = 1.3
  • α = 0.1
  • ΔT = 180 s
Variable parameters:
Number of channels N ∈ {40, 50, 60, ..., 150}, i.e., from 40 to 150 in steps of 10.
For both QoE measures, the values of b p h s and b p h h ( v ) can be expected to rise with respect to a growing number of possibly accessible channels. As already discussed, this is due to the greater probability of the occurrence of a blocking scenario and the greater probability of a requested channel not being accessed yet, which both grow with the number of possibly accessible channels (if we are keeping the bandwidth constant). In the following two parts, we discuss the results of b p h s and b p h h ( v ) separately.

5.1. Results Obtained for b p h s and Their Interpretation

This subsection introduces the results for b p h s using both of our analytical models. The results are illustrated by Figure 3, which includes a QoE threshold for switching-induced blockings per hour of using the IPTV service without pauses.
Figure 3. b p h s dependent on the number of offered channels for different traffic scenarios for both analytical models.
Electronics 03 00689 g003
In accordance with the simulation results, we now want to discuss four different properties of the presented data. First of all, we want to take a look at the differences between the different traffic scenarios; then, we continue to compare the number of blockings per hour as predicted by both variants of our analytical model (also called submodels in the sequel), followed by an analysis of the effects of a growing number of offered channels. Finally, we discuss the implications for the QoE threshold introduced in Figure 3.
  • The results of the simulation particularly highlight the effects of the different traffic scenarios on the QoE measure b p h s . Onwards from the point where a blocking situation occurs, the curves for high utilization, medium utilization and low utilization are on top of each other. In their respective submodels, they never cross each other, and the curve for HU is always above the curve of MU, which itself is always above the curve of LU. This was to be expected: higher utilization implies more subscribers, which leads to a greater probability of the occurrence of a blocking situation and, therefore, also to a greater blocking probability for a switching event.
  • Comparing both submodels, it is obvious that the curves for HU, MU and LU for the early period are always above their counterparts in the submodel covering the late period. The reason for this is intrinsic to the central difference between those two models and represents exactly the need for both of them. While the late period model considers the most popular channels being multicast, the early period model is considering an initial situation, when still quite a few channels with low popularity are transmitted. When a blocking situation occurs, it is an obvious disadvantage if channels with a low popularity are currently transmitted, since this results in popular channels (with greater requesting probability) being inaccessible and, therefore, making the blocking probability rise. The result is a larger b p h s in the early period model than in the late period model, where all of the most popular channels are considered to be already requested and where another request is highly likely to be for one of those already broadcast channels.
  • As already mentioned before, the effects of a growing number of offered TV channels (while keeping the bandwidth constant) is plainly visible. The higher the number of offered TV channels, the higher b p h s for every traffic scenario in both submodels. It is noteworthy, however, that both curves for MU are approaching relatively closely the respective HU curves (based on the same analytical model) when we come closer to the maximum number of analyzed channels, i.e., N = 150, which is an unexpected behavior.
  • The QoE threshold introduced in Figure 3 is what we believe to be an acceptable boundary to represent the user tolerance. We consider one blocking per hour, while switching the channels, to be acceptable for an individual subscriber. Hence, the data in the figure gives very valuable information about what boundary conditions could make fulfilling such a (harsh) QoE requirement possible. Of course, other QoE specifications are possible. For example it could be argued that most of the time, motorways are not densely populated, and therefore, HU scenarios should not be taken into account from the point of view of a strict QoE threshold or, on the other hand, that especially during a traffic jam situation, entertainment may become highly interesting.

5.2. Results Obtained for b p h h ( v i ) and Their Interpretation

Figure 4 and Figure 5 show the blocking probability per hour for distinctive lanes in different traffic scenarios. What is recognizably the easiest is the similarity between both figures. Moreover, we closely study the development of the specific curves due to the rise in number of offered channels, and we finish our discussion by taking a look at the implications of the QoE threshold introduced for handover-induced blockings.
  • The resemblance of Figure 4 and Figure 5 is unexpectedly overwhelming. The curves in both figures behave in a perfectly similar fashion. When a curve is above, below or intersecting another one at a certain position on the x-axis in one figure, it does exactly the same in the other figure. Only the values of b p h h ( v i ) are changing, i.e., they are decreasing when we approach the later period of a scenario.
  • It can be observed that within their traffic scenario, vehicles moving with the faster speed of the inner lanes ( v 3 ) have a greater probability of the occurrence of handover-induced blockings than the slower vehicles in their respective traffic scenario. This was to be expected. What was unpredictable though was the relation between the HU and MU. It could not be said a priori how much the number of offered channels would affect the occurrence of a blocking situation and what that would inflict on the b p h h ( v i ) . We observe that for any number of offered TV channels in the MU scenario, b p h h ( v i ) is greater for ( v 1 ) and ( v 3 ) than their respective counterparts in LU. Even though the vehicles move faster, blocking due to handover is less likely to happen.
  • Without loss of generality, to get concrete numbers, we decided to weight channel blockings that occur at handover events five-times as worse as blocking events that occur during channel switching. An interruption in the viewing process of a specific channel is considered to have a significantly greater negative impact on the user experience than a (desired) channel being temporarily inaccessible. Consequently, we have introduced the QoE threshold at b p h h ( v i ) . This threshold means that every configuration of boundary conditions, traffic scenarios and parameters that leads to b p h h ( v i ) being greater than 0.2 will be unacceptable for the user. In both submodels, 80 different offered channels still allow the QoE requirement regarding handover-induced blockings to be fulfilled.
Figure 4. b p h h ( v i ) dependent on the number of offered channels for distinct lanes of different traffic scenarios in the early period model.
Electronics 03 00689 g004
Figure 5. b p h h ( v i ) dependent on the number of offered channels for distinct lanes of different traffic scenarios in the late period model.
Electronics 03 00689 g005

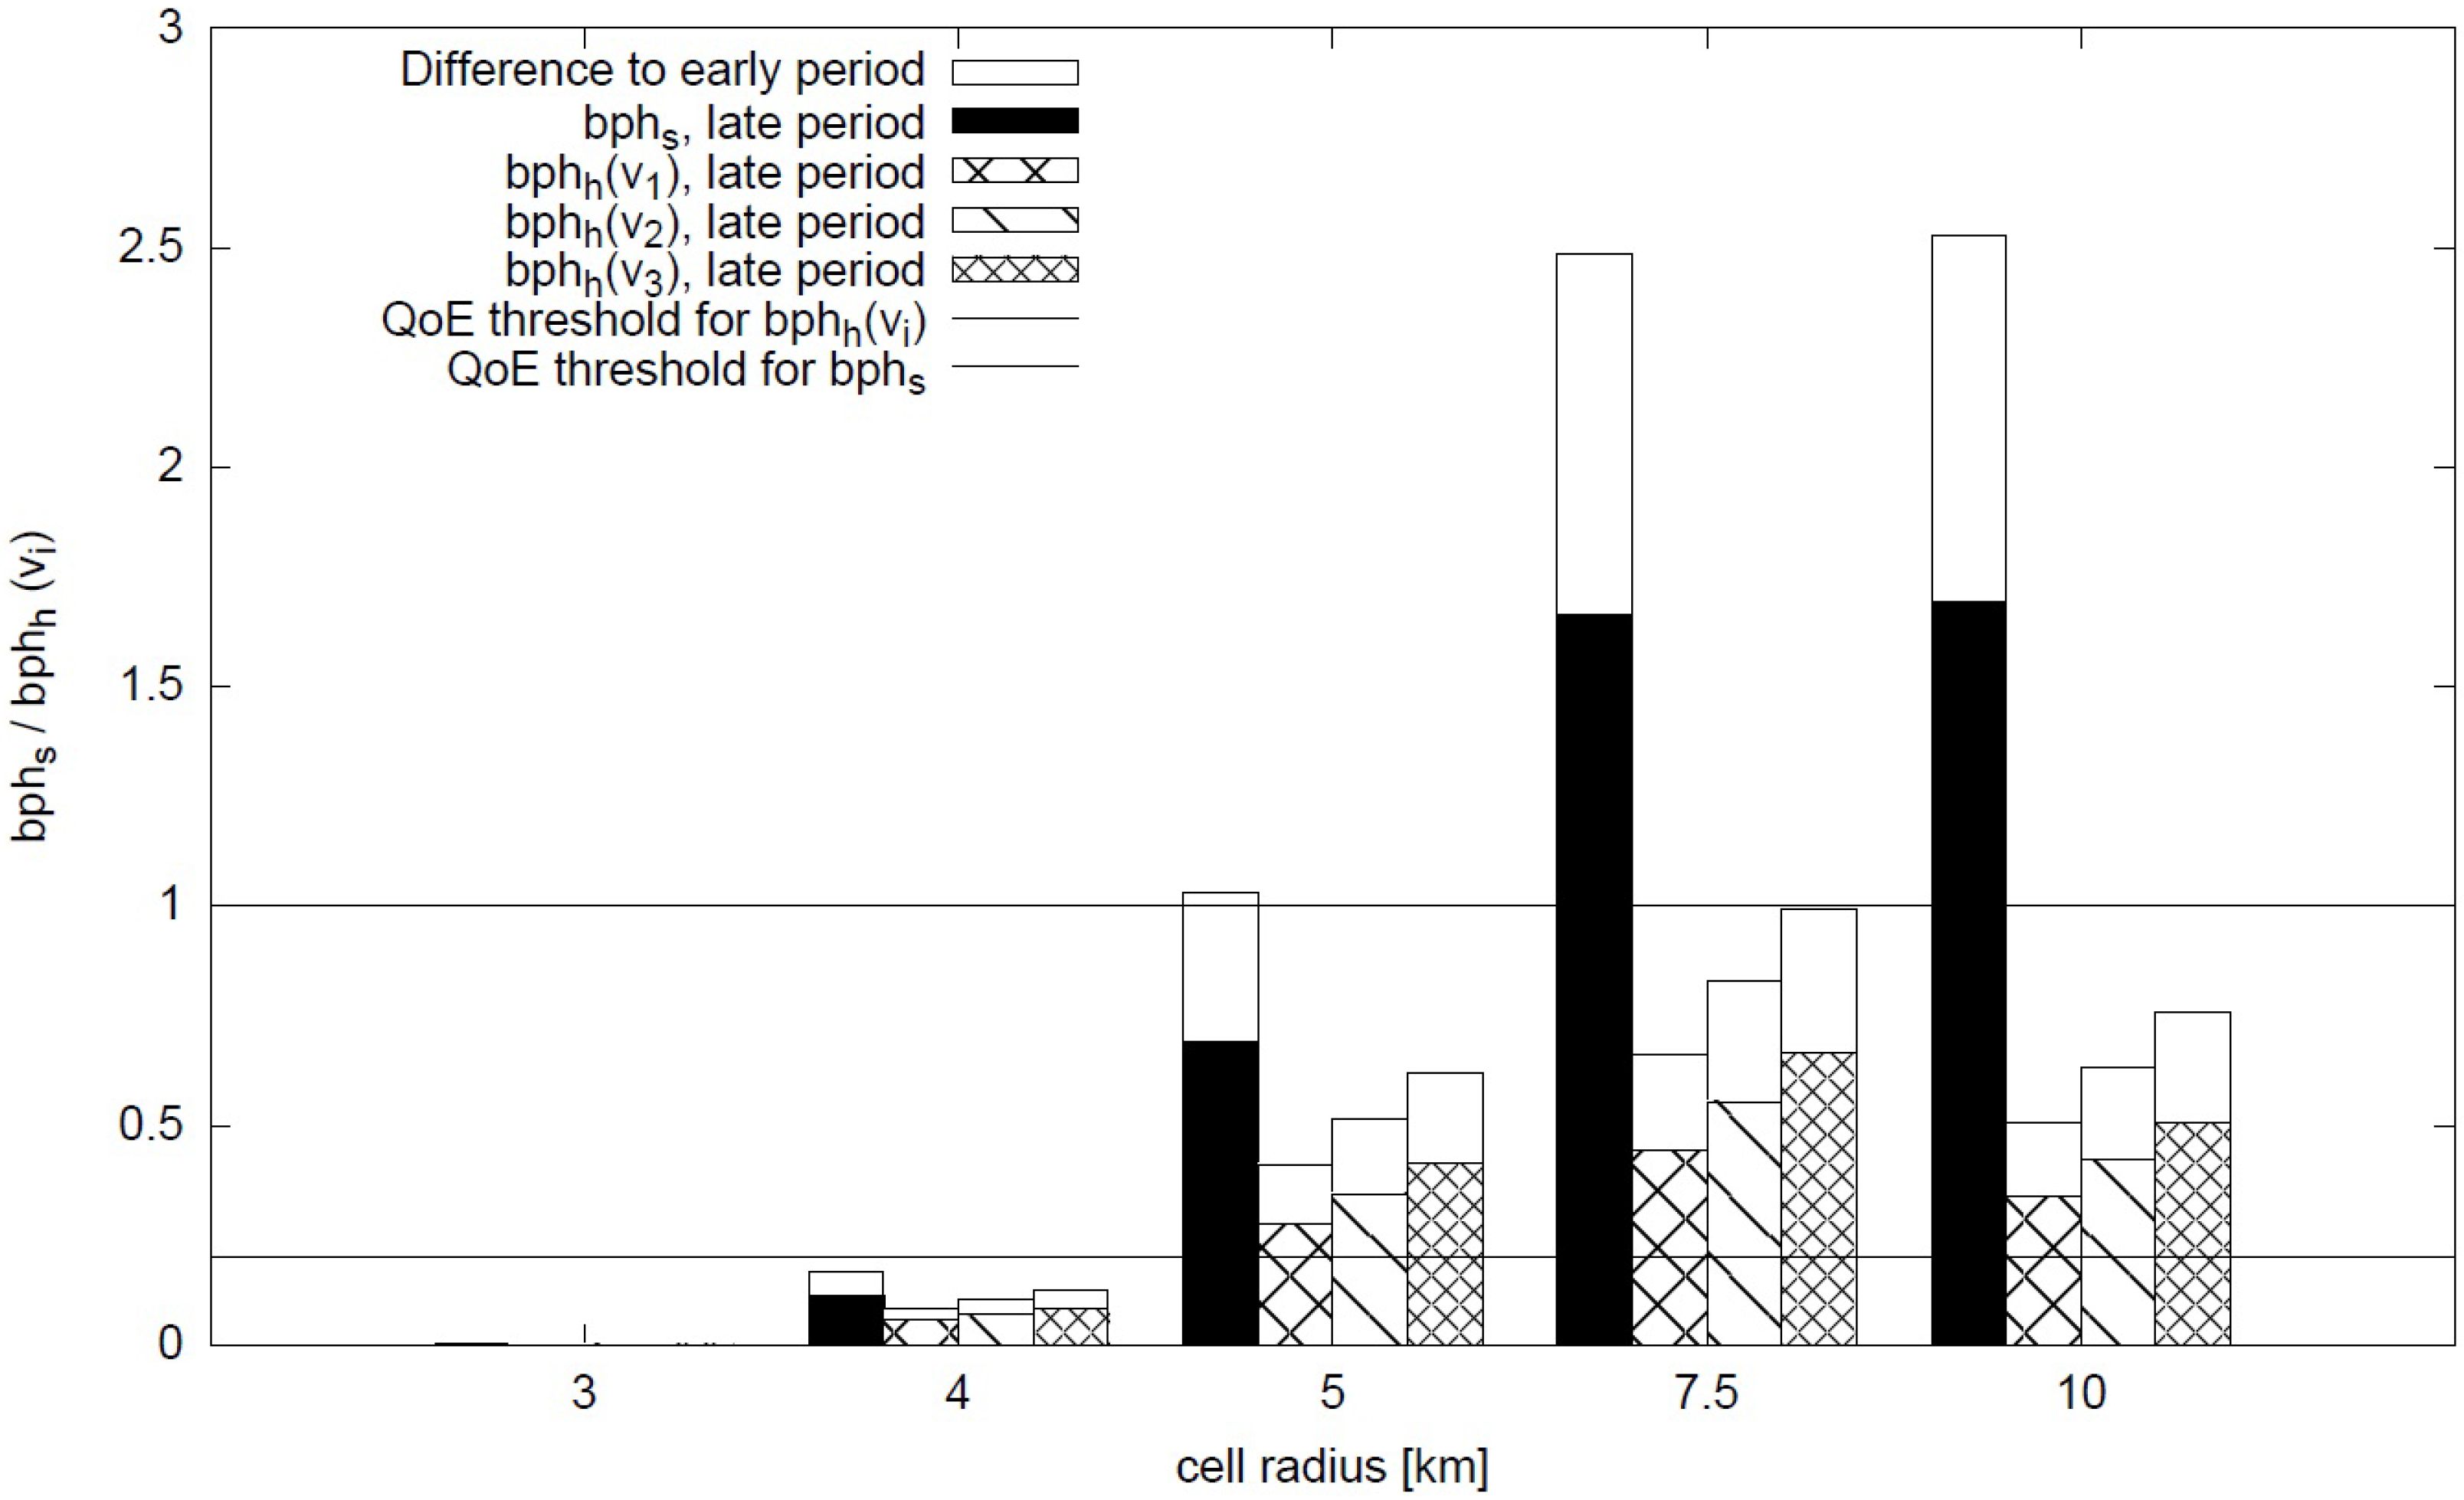
6. Case Study B: The Impact of Different Network Technologies on IPTV Availability

To minimize the deployment costs of an IPTV infrastructure, which leads to a great initial investment, it is important to geographically position the base stations/access points as efficiently as possible. Nonetheless, the distance between two IPTV transmitting installations is limited by the achievable cell size, which is based on the access technology that is used. Different access technologies allow different cell sizes. Concerning the cell size, it is important to keep in mind that differences in the cell size also imply positive and negative effects for the transmission of IPTV. Smaller cell sizes, on the one hand, make handovers more frequent, which may have a negative impact on handover-induced blockings, while, on the other hand, smaller cells allow one to allocate the bandwidth to a smaller number of subscribers, which leads to a reduced CBP value.
In order to analyze the effects that different cell sizes have on both QoE measures b p h s and b p h h ( v ) in both submodels, we were required to keep the number of offered channels at a fixed value. By this means, we can see how increasing and decreasing the cell size influences the competition of IPTV subscribers for channels, the occurrence of blocking situations and also the effects on handover-induced blocking events. It can be assumed that, the smaller N c is, resulting from a smaller cell, the lower the probability of the occurrence of a blocking situation in a cell will become, thus reducing b p h s . Hence, we are going to reuse the boundary conditions, traffic scenarios and parameters that were used in Case Study A with only two minor changes:
  • Constant parameters:
    Number of channels N = 100
  • Variable parameters:
    c r ∈{3, 4, 5, 7.5, 10} km
  • Throughout the complete Case Study B, medium utilization (MU), as defined in Case Study A, was used.
The following observations are made in Figure 6:
  • The simulation results show that the expectation that b p h s is growing with the cell size is correct. For c r = 3 km, the values of b p h s , as well as those of b p h h ( v i ) ∀i are still negligibly small and, therefore, not visible in the figure. We can observe a great difference of b p h s if we increase c r from 4 to 5 km and an even greater one between a c r of 5 and 7.5 km. However, there exists only a relatively small difference between the 7.5-km and 10-km cell size. This illustrates that already at 7.5 km, a traffic scenario is reached in which a blocking situation is common.
  • The intuitive thought that a greater cell size would cause b p h h ( v i ) to be smaller is incorrect. Even though handovers become less common for a driving vehicle when the cell becomes larger, the cells get more crowded. Therefore, the likelihood of the occurrence of a blocking situation increases and, therefore, the probability for blocking events during a handover becomes greater when the cell size is increased.
  • The threshold for b p h s is respected up to a cell radius of 5 km, at least if we look at the situation in the cell at a late period of observation. However, for all speeds of vehicles ( v i ) covered by Figure 6, b p h h ( v i ) does not satisfy the threshold limit of 0.2 if the cell radius is ≥ 5 km. This shows that, in quite a few scenarios, the b p h h ( v i ) threshold is the more restrictive bound regarding the acceptable frequency of blocking events.
As a main lesson learned from Case Studies A and B, we saw that it is possible to directly use the analytical models to test whether a QoE threshold for switching-induced and/or handover-induced blocking events will be respected by a given scenario of an IPTV system comprising a specific combination of traffic situation, cell properties and characteristics of the IPTV service. It also became clear that the number of blocking events to be expected may quite significantly vary if we look at the early and the late period of a scenario.
Figure 6. b p h s and b p h h ( v i ) for different cell sizes and different speeds of vehicles (both for the early and late period of the scenarios observed).
Electronics 03 00689 g006

7. Summary and Outlook

In this paper, we have investigated in-depth the quality-of-experience (QoE) as it is offered to human end users of IPTV services in VANETs. Unlike earlier studies of this problem based exclusively on simulation models, we have been able to elaborate a rather realistic analytical model (available even in two model variants), which is easily applicable and allows us to derive comprehensive QoE predictions for IPTV usage in VANETs. We have successfully validated the analytical model by means of comparing it to a significantly more detailed and, therefore, more realistic simulation model. Our numerous case studies demonstrate clearly the advantages of investigations based on an analytical modeling approach as opposed to simulation-based experiments (e.g., in terms of experimental expenditure). Moreover, the studies show how these types of models can be used to obtain valuable decision support for an IPTV service provider. Last, but not least, we have introduced new measures for QoE, which take into account the disadvantages of handover-induced blocking events as opposed to switching-induced TV channel blockings. These new measures, in particular, allow one to quantify the strongly negative impact of handover-induced blockings.
In our future research work, we will try to derive algorithms to reduce the probability of channel blocking events during car handover when crossing cell boundaries. Such algorithms seem to be an indispensable step in order to significantly improve QoE of IPTV services in VANETs.

Acknowledgments

The authors would like to thank Edgar E. Báez for his very valuable help during the thorough validation phase regarding the analytical models.

Author Contributions

Bernd E. Wolfinger was in charge of the direction of the research activities. In addition, he elaborated both analytical models (introduced in Section 3 and used in all case studies), and he also suggested the new QoE measures. Arian Hübner was responsible for implementing a tool to predict TV channel availability based on the analytical models. He also carried out the case studies based on our analytical approach. Sadaf Momeni was responsible for implementing the detailed simulation model to access IPTV service availability in VANETs, and she carried out the simulation experiments required during validation of the analytical models.

Conflicts of Interest

The authors declare no conflict of interest.

References

  1. Huang, Q.; Yang, Y.; Chai, R.; Chen, Q. Relay vehicle based access network selection scheme for Vehicular Ad Hoc Network. In Proceedings of the International Conference on Wireless Communications and Signal Processing (WCSP2012), Huangshan, China, 25–27 October 2012; pp. 1–6.
  2. Olariu, S.; Weigle, M.C. Vehicular Networks: From Theory to Practice; Chapman & Hall/CRC Press: Boca Raton, FL, USA, 2009. [Google Scholar]
  3. Nafi, N.S.; Khan, J.Y. A VANET based Intelligent Road Traffic Signalling System. In Proceedings of the Australasian Telecommunication Networks and Applications Conference (ATNAC2012), Brisbane, Queensland, Australia, 7–9 November 2012; pp. 1–6.
  4. Qian, Y.; Moayeri, N. Design of Secure and Application-Oriented VANETs. In Proceedings of the IEEE Vehicular Technology Conference (VTC 2008), Singapore, 11–14 May 2013; pp. 2794–2799.
  5. Baiocchi, A.; Cuomo, F. Infotainment services based on push-mode dissemination in an integrated VANET and 3G architecture. J. Commun. Netw. 2013, 15, 179–190. [Google Scholar] [CrossRef]
  6. Malkos, S.; Ucar, E.; Akdeniz, R. Analysis of QoE key factors in IPTV systems: Channel switching. In Proceedings of the 5th International Conference on Application of Information and Communication Technologies (AICT2011), Baku, Azerbaijan, 12–14 October 2011; pp. 1–5.
  7. Chen, T.; Rao, R.R. Audio-visual integration in multimodal communication. IEEE Proc. 1998, 86, 142–149. [Google Scholar]
  8. Gaoxiong, Y.; Wei, Z. The Perceptual Objective Listening Quality Assessment algorithm in telecommunication: Introduction of ITU-T new metrics POLQA. In Proceedings of the 1st IEEE International Conference on Communications in China (ICCC), China, 15–17 August 2012; pp. 351–355.
  9. Urrea Duque, J.P.; Gaviria Gomez, N. Quality assessment for video streaming P2P application over wireless mesh network. In Proceedings of the XVII Symposium of Image, Signal Processing, and Artificial Vision (STSIVA2012), Antioquia, Colombia, 12–14 September 2012; pp. 99–103.
  10. Bellalta, B.; Belyaev, E.; Jonsson, M.; Vinel, A. Performance evaluation of IEEE 802.11p-enabled vehicular video surveillance system. IEEE Commun. Lett. 2014, 18, 708–711. [Google Scholar] [CrossRef]
  11. Belyaev, E.; Vinel, A.; Surak, A.; Gabbouj, M.; Jonsson, M.; Egiazarian, K. Robust vehicle-to-infrastructure video transmission for road surveillance applications. IEEE Trans. Veh. Technol. 2014, in press. [Google Scholar] [CrossRef]
  12. Zhou, L.; Zhang, Y.; Song, K.; Jing, W.; Vasilakos, A.V. Distributed Media Services in P2P-Based Vehicular Networks. IEEE Trans. Veh. Technol. 2011, 60, 692–703. [Google Scholar] [CrossRef]
  13. Cota, P.; Pavicic, T. New technologies for improvement of characteristics in DSL access networks. In Proceedings of the 34th International Convention on Information and Communication Technology, Electronics and Microelectronics (MIPRO2011), Opatija, Croatia, 26–30 May 2011; pp. 511–516.
  14. Lai, J. Evaluation and Improvement of TV Channel Availability for IPTV Services; Shaker Verlag GmbH: Aachen, Germany, 2012. [Google Scholar]
  15. Lai, J.; Wolfinger, B.E.; Heckmüller, S. Decreasing Call Blocking Probability of Broadband TV Services by a Channel Access Control Scheme. In Proceedings of the International Conference on Ultra Modern Telecommunications (ICUMT2010), Moscow, Russia, 18–20 October 2010.
  16. Lu, K.; Qian, Y.; Chen, H.H.; Fu, S. WiMAX networks: from access to service platform. IEEE Netw. 2008, 22, 38–45. [Google Scholar] [CrossRef]
  17. Abdollahpouri, A. QoS Aware Live IPTV Streaming Over Wireless Multi-hop Networks; Shaker Verlag GmbH: Aachen, Germany, 2012. [Google Scholar]
  18. Momeni, S.; Wolfinger, B.E. Availability of IPTV Services in VANETs Using Different Access Network Technologies. EURASIP J. Wirel. Commun. Netw. 2014, 2014. [Google Scholar] [CrossRef]
  19. Momeni, S.; Lai, J.; Wolfinger, B.E. Availability Evaluation of IPTV Services in Roadside Backbone Networks with Vehicle-to-Infrastructure Communication. In Proceedings of the IEEE Conference (IWCMC2013), Cagliari, Sardinia, Italy, 1–5 July 2012.
  20. Raya, M.; Hubaux, J.-P. The Security of Vehicular Ad Hoc Networks. In Proceedings of the Third ACM Workshop on Security of Ad-Hoc and Sensor Networks (SASN2005), Alexandria, VA, USA, 7 November 2005.
  21. Harsch, C.; Festag, A.; Papadimitratos, P. Secure position based routing for VANETs. In Proceedings of the IEEE 66th Vehicular Technology Conference (VTC2007-Fall), Baltimore, MD, USA, 30 September–3 October 2007; pp. 26–30.
  22. Veselinovska, B.; Gusev, M.; Janevski, T. State of the art in IPTV. In Proceedings of the 37th International Convention on Information and Communication Technology, Electronics and Microelectronics (MIPRO2014), Opatija, Croatia, 26–30 May 2014; pp. 479–484.
  23. Abdollahpouri, A.; Wolfinger, B.E. Measures to quantify the gain of multicast with application to IPTV transmissions via WiMAX networks. Telecommun. Syst. 2014, 55, 185–198. [Google Scholar] [CrossRef]
  24. Perlman, R. Models for IP multicast. In Proceedings of the 12th IEEE International Conference on Networks (ICON 2004), Singapore, 16–19 November 2004; Volume 2, pp. 678–682.
  25. Newman, M.E.J. Power Laws, Pareto Distributions and Zipf’s Law. Contemp. Phys. 2005, 46, 323–351. [Google Scholar] [CrossRef]
  26. Chowdhury, A.A.; Bertling, L.; Glover, B.P.; Haringa, G.E. A Monte Carlo Simulation Model for Multi-Area Generation Reliability Evaluation. In Proceedings of the International Conference on Probabilistic Methods Applied to Power Systems (PMAPS2006), Stockholm, Sweden, 11–15 June 2006.
  27. Momeni, S.; Wolfinger, B.E. Availability of IPTV Services in VANETs Using Different Access Network Technologies. In Proceedings of the 13th International Conference on ITS Telecommunications (ITST2013), Tampere, Finland, 5–7 November 2013.
  28. Abdollahpouri, A.; Wolfinger, B.E.; Lai, J.; Vinti, C. Modeling the Behavior of IPTV Users with Application to Call Blocking Probability Analysis. Prax. Inf. Kommun. 2012, 35, 75–81. [Google Scholar] [CrossRef]

