
Monitoring and Analyzing of Circadian and Ultradian Locomotor Activity Based on Raspberry-Pi

 ,
, 
Abstract
:1. Introduction
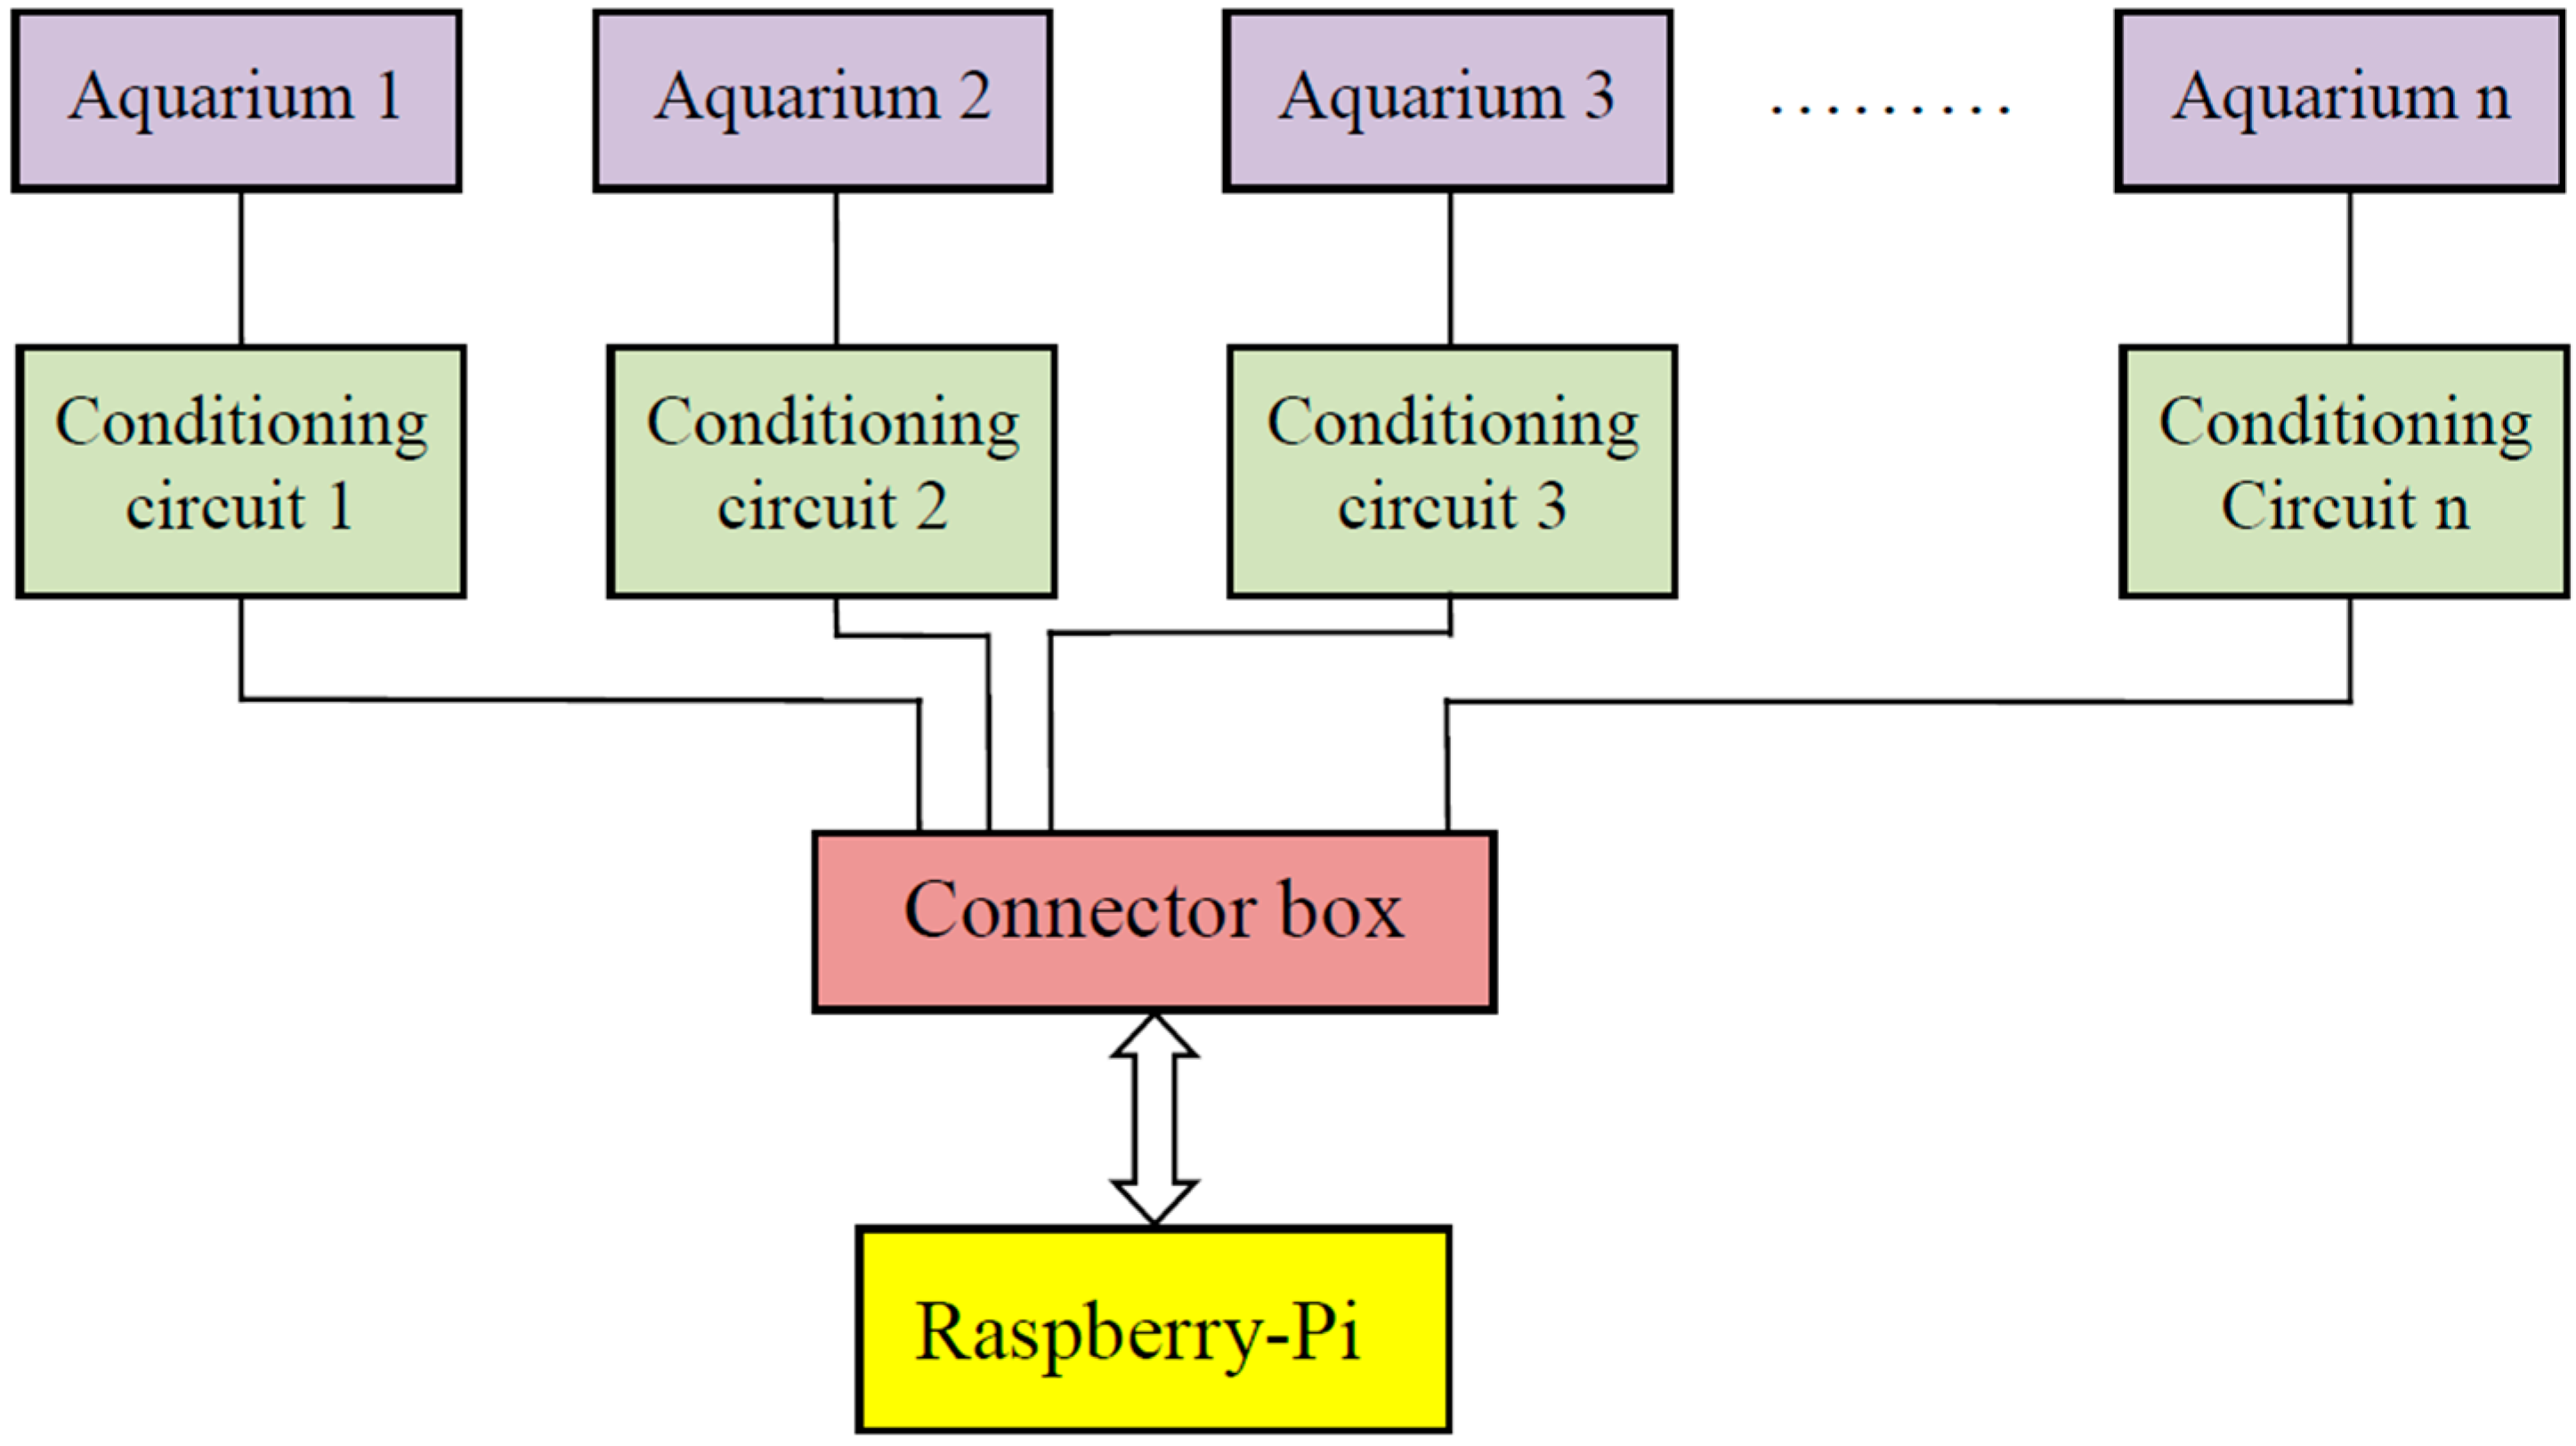
2. Monitoring and Data Analysis
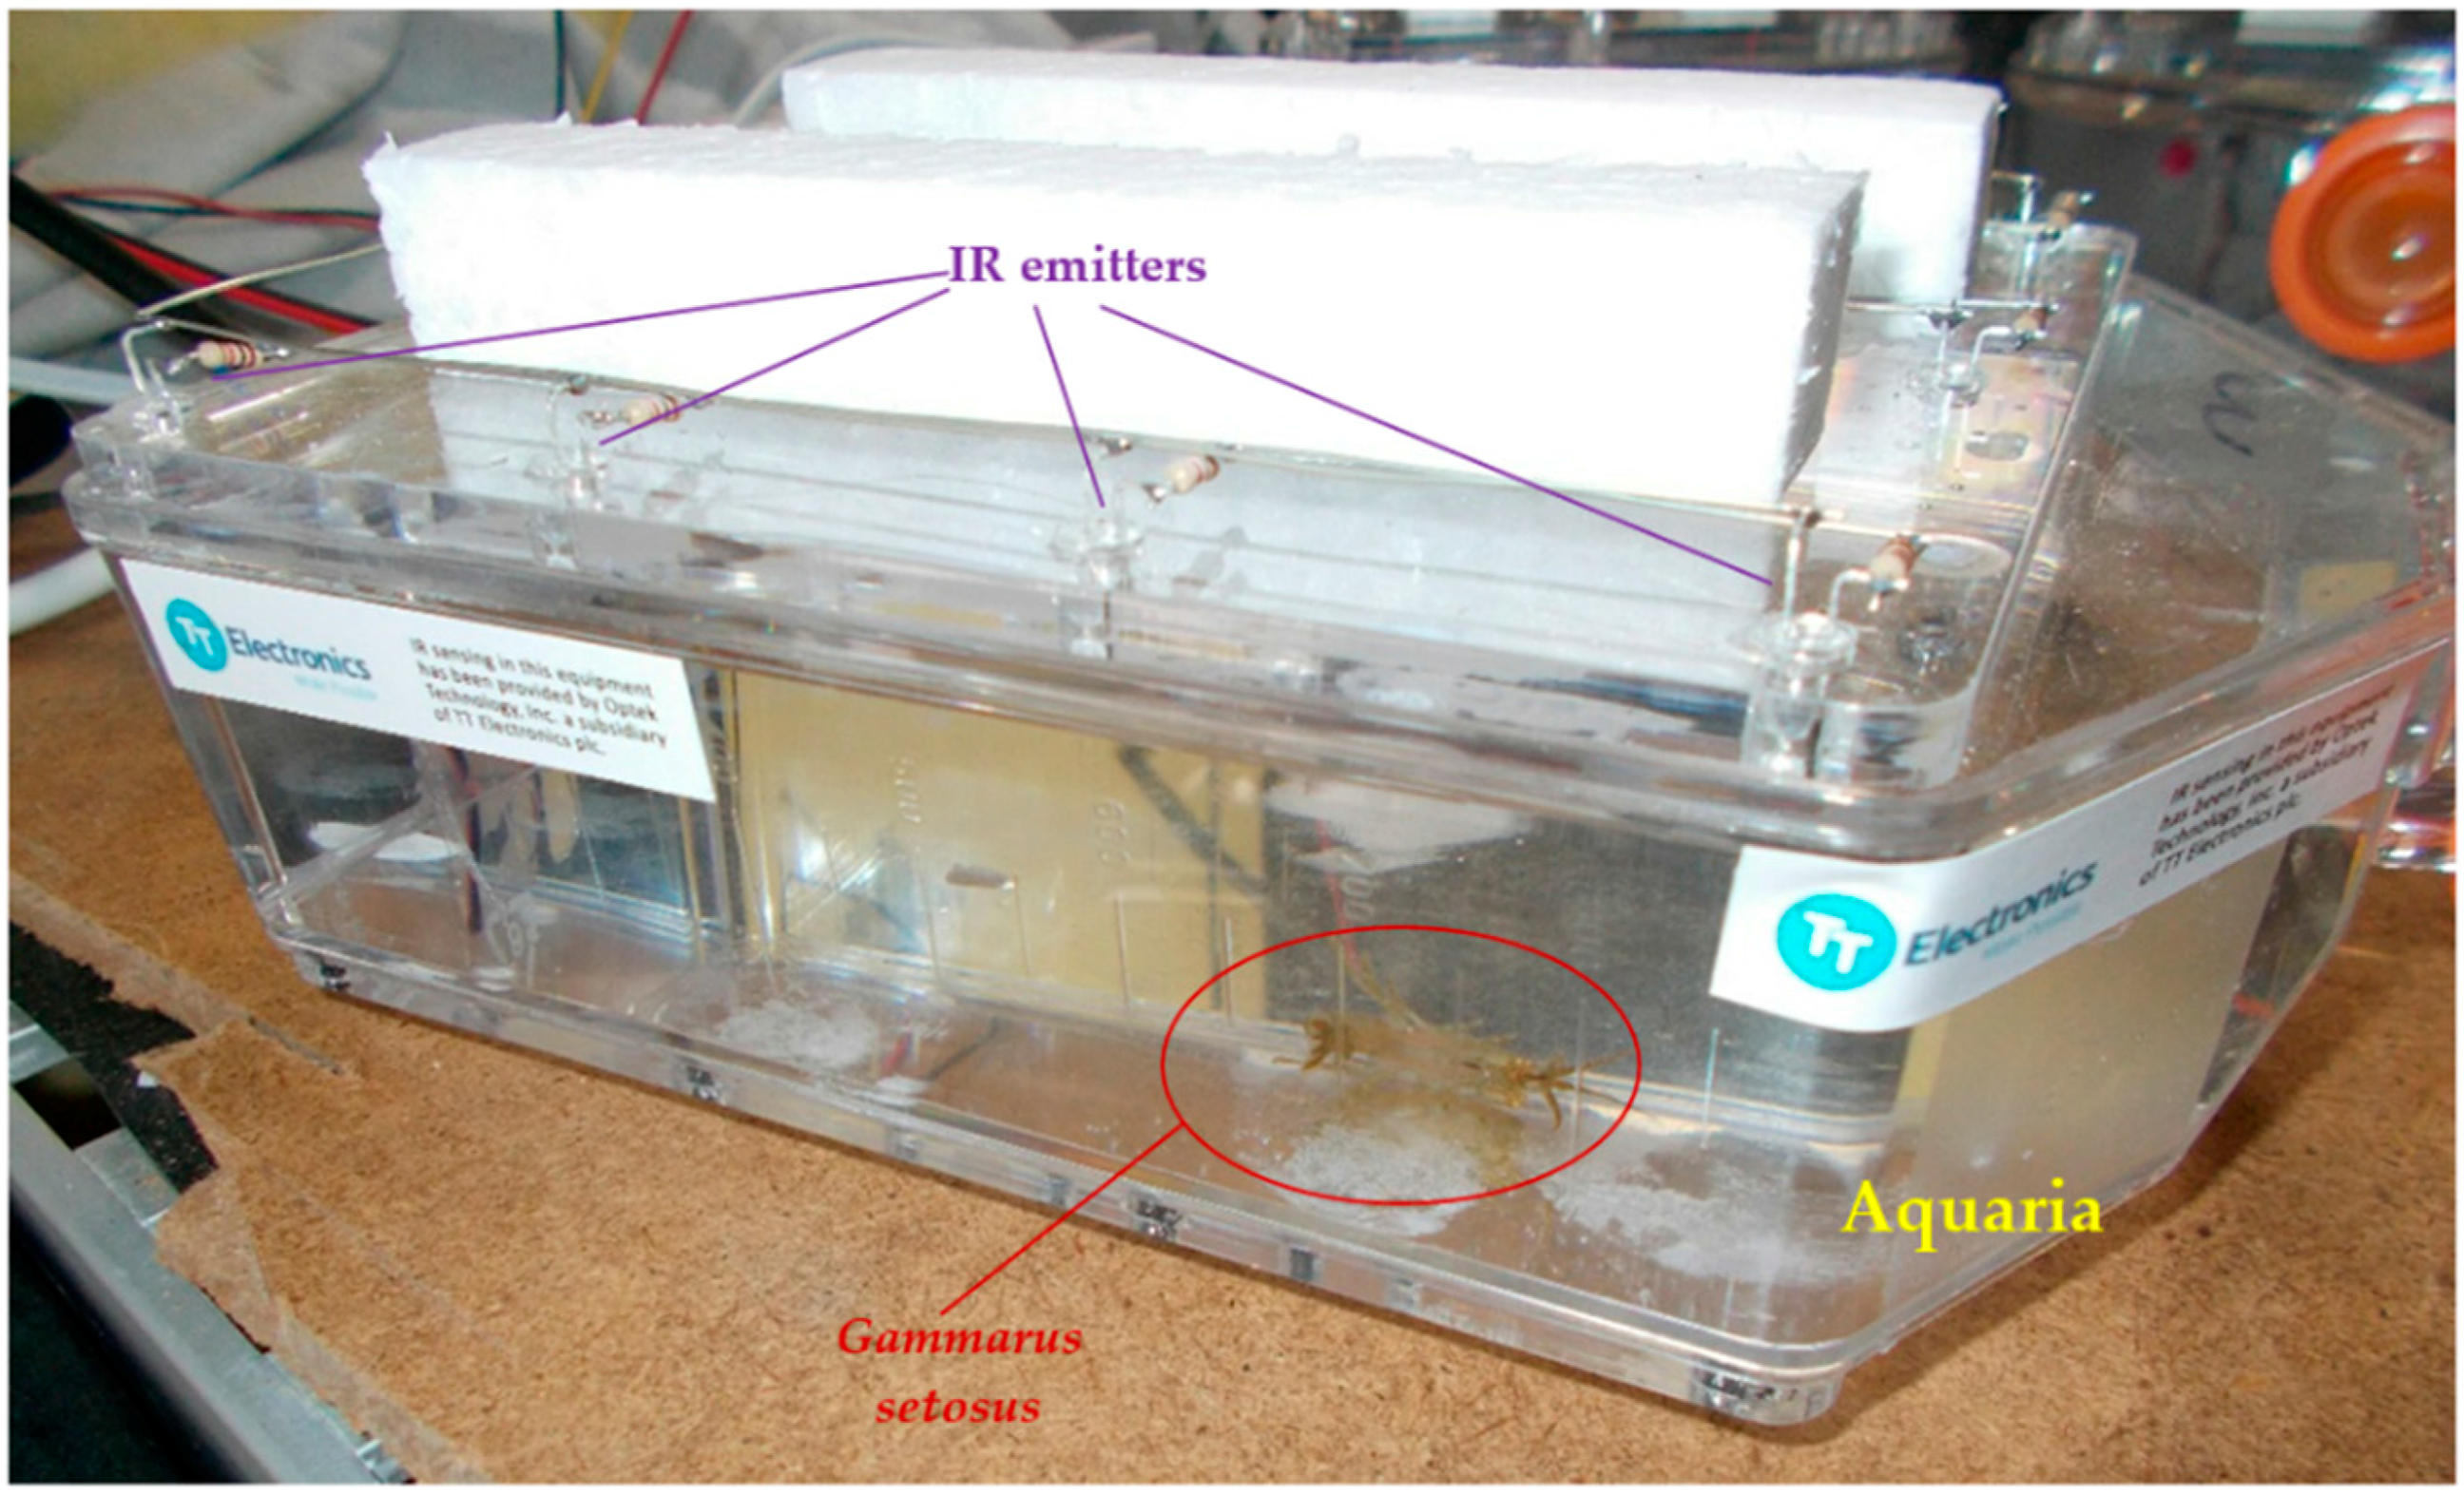
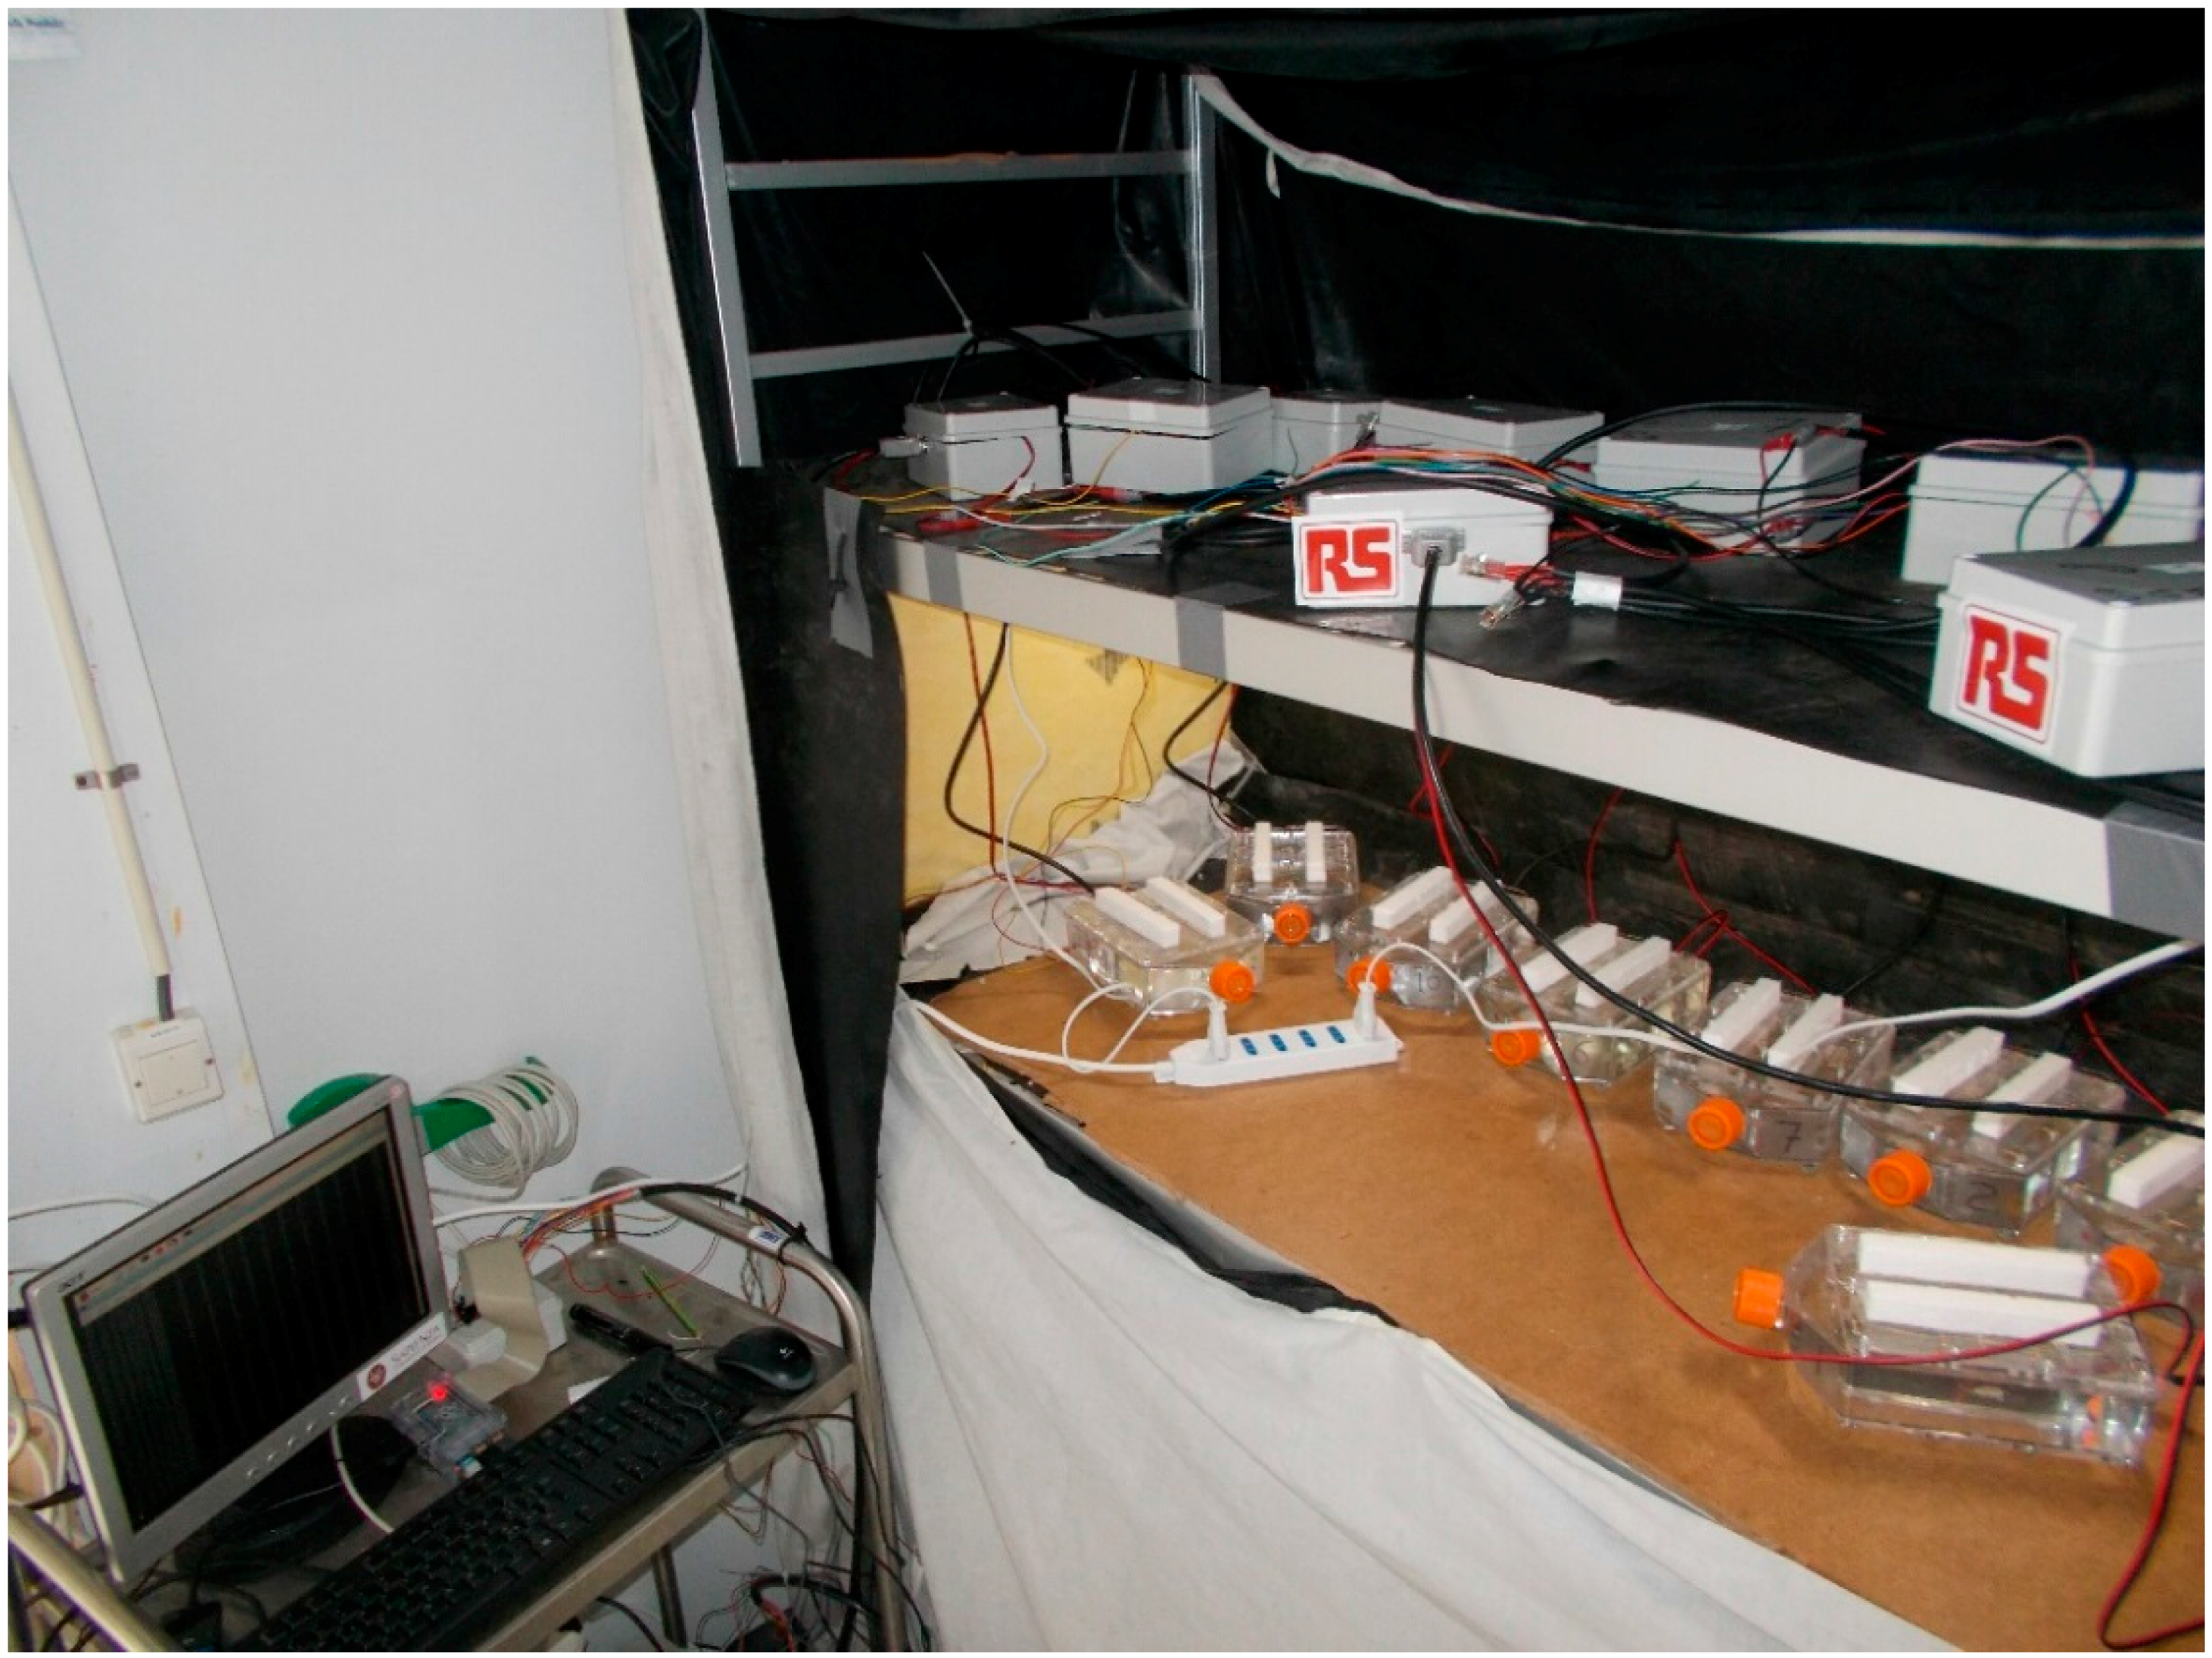
2.1. Aquaria
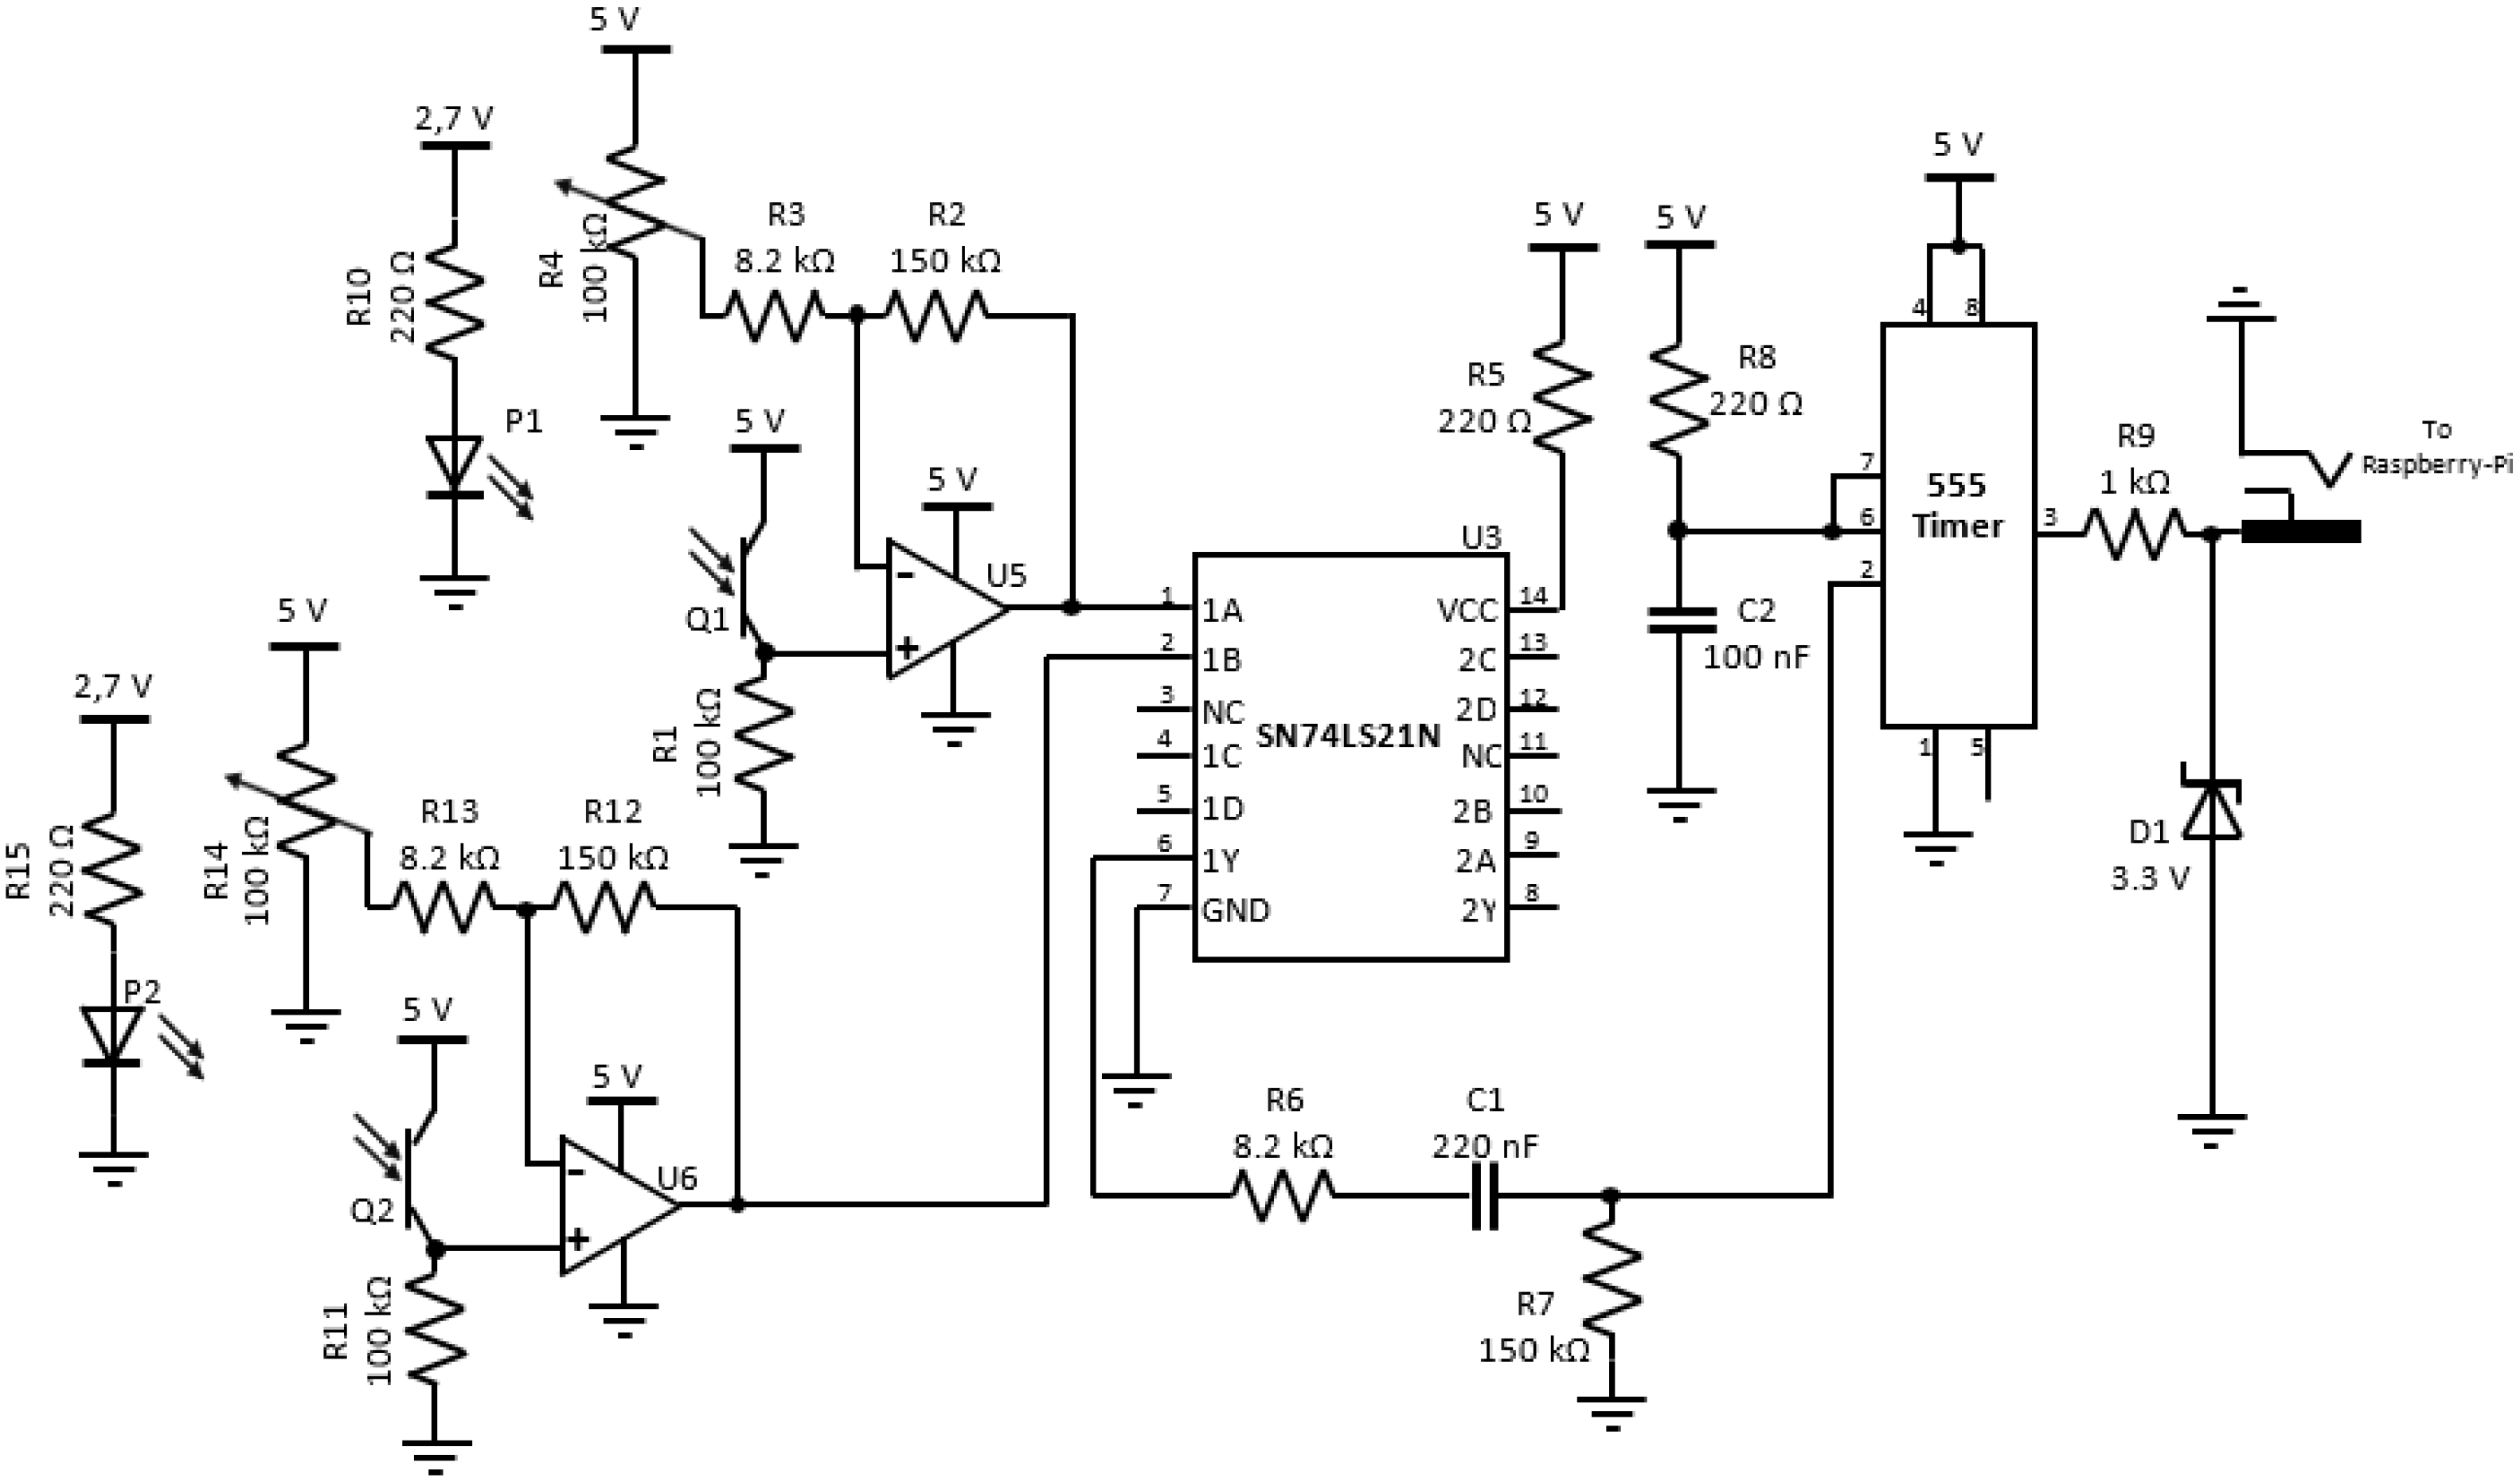
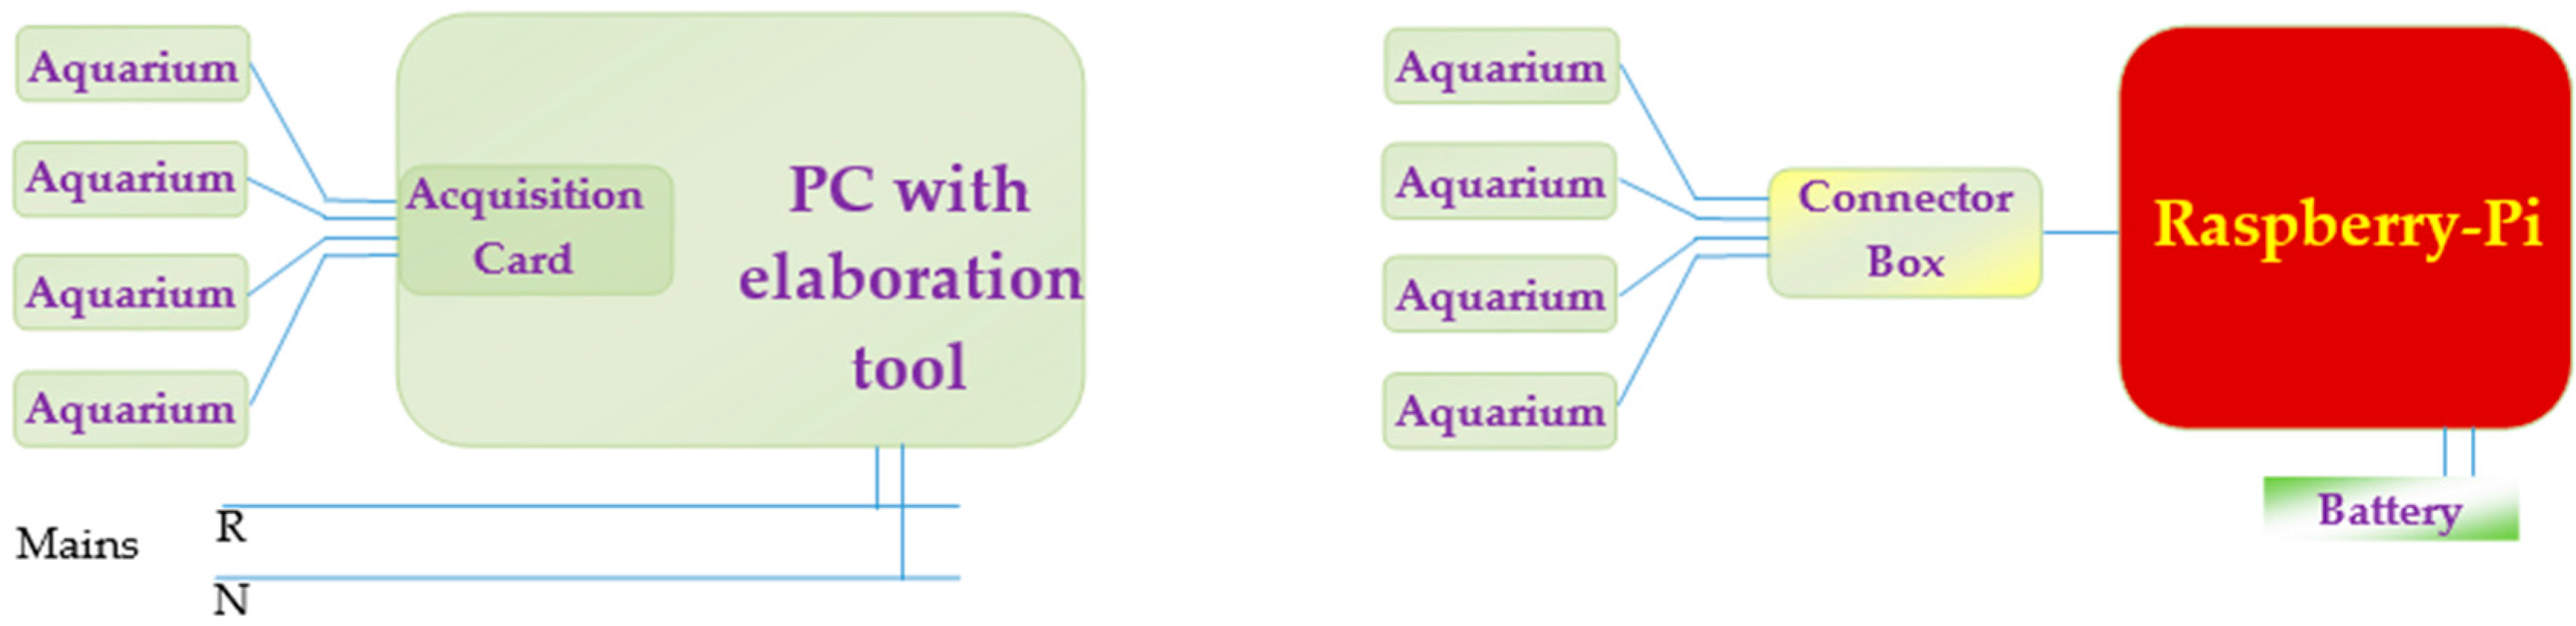
2.2. Electronics
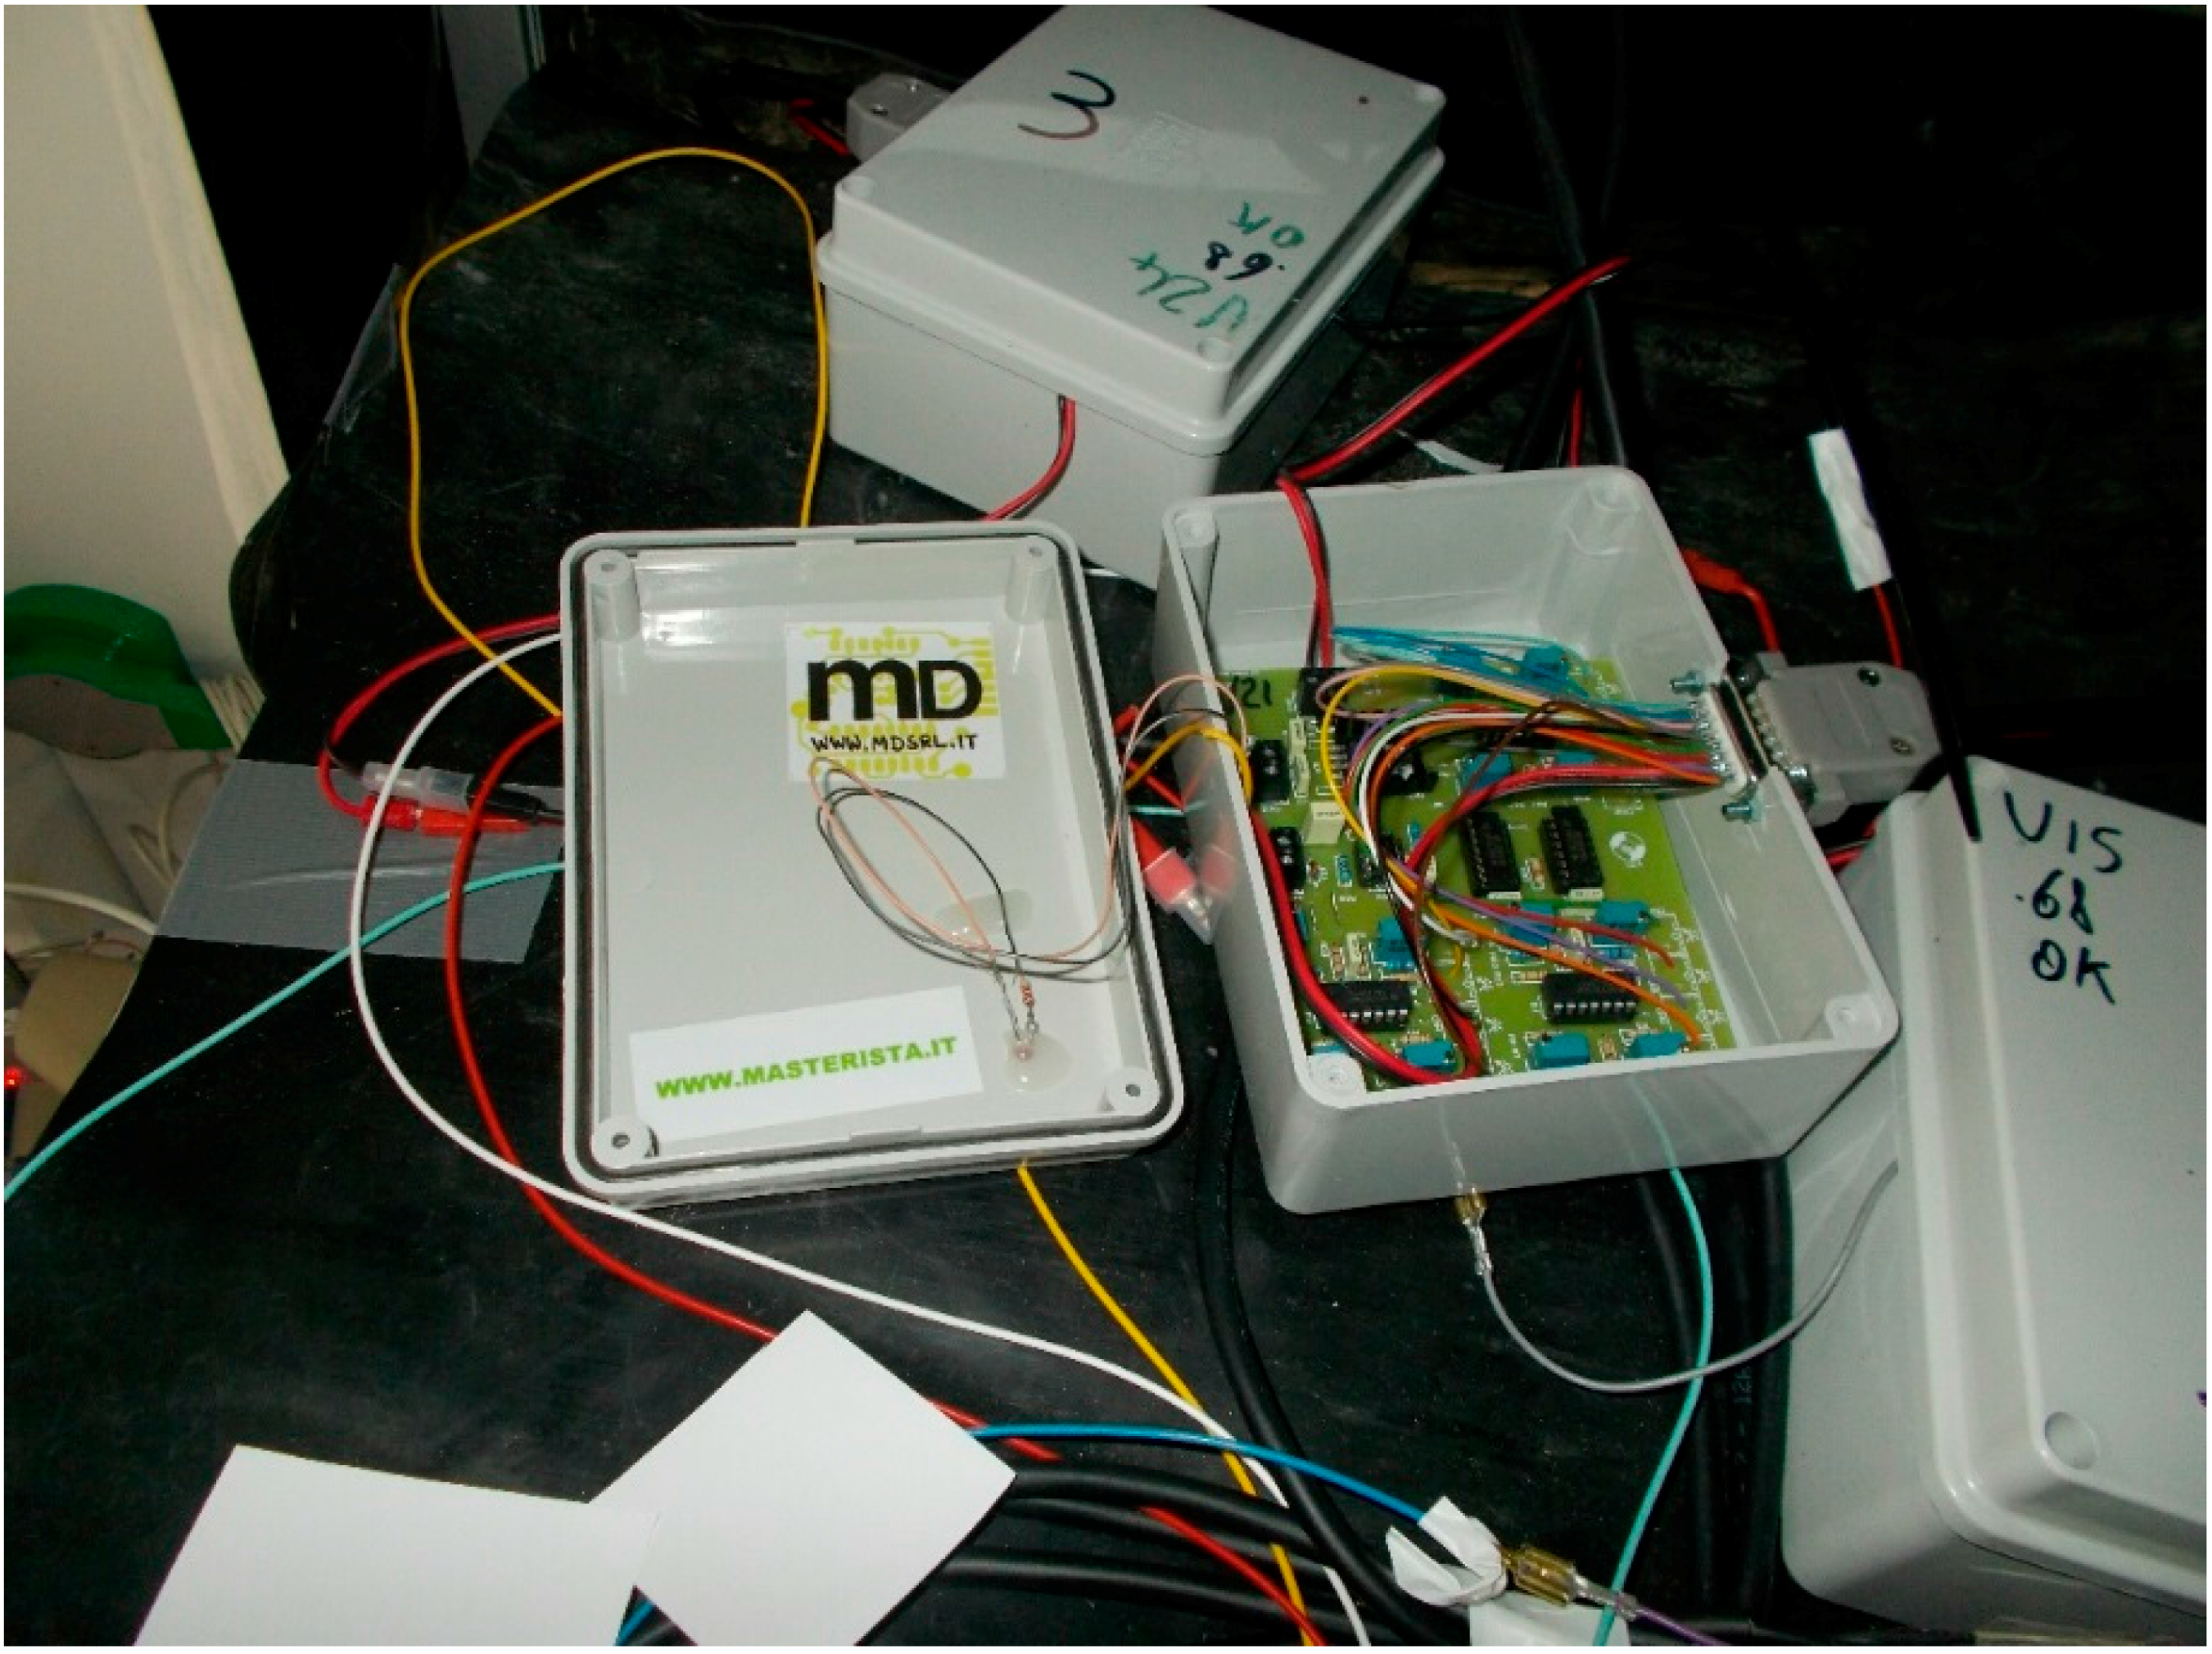
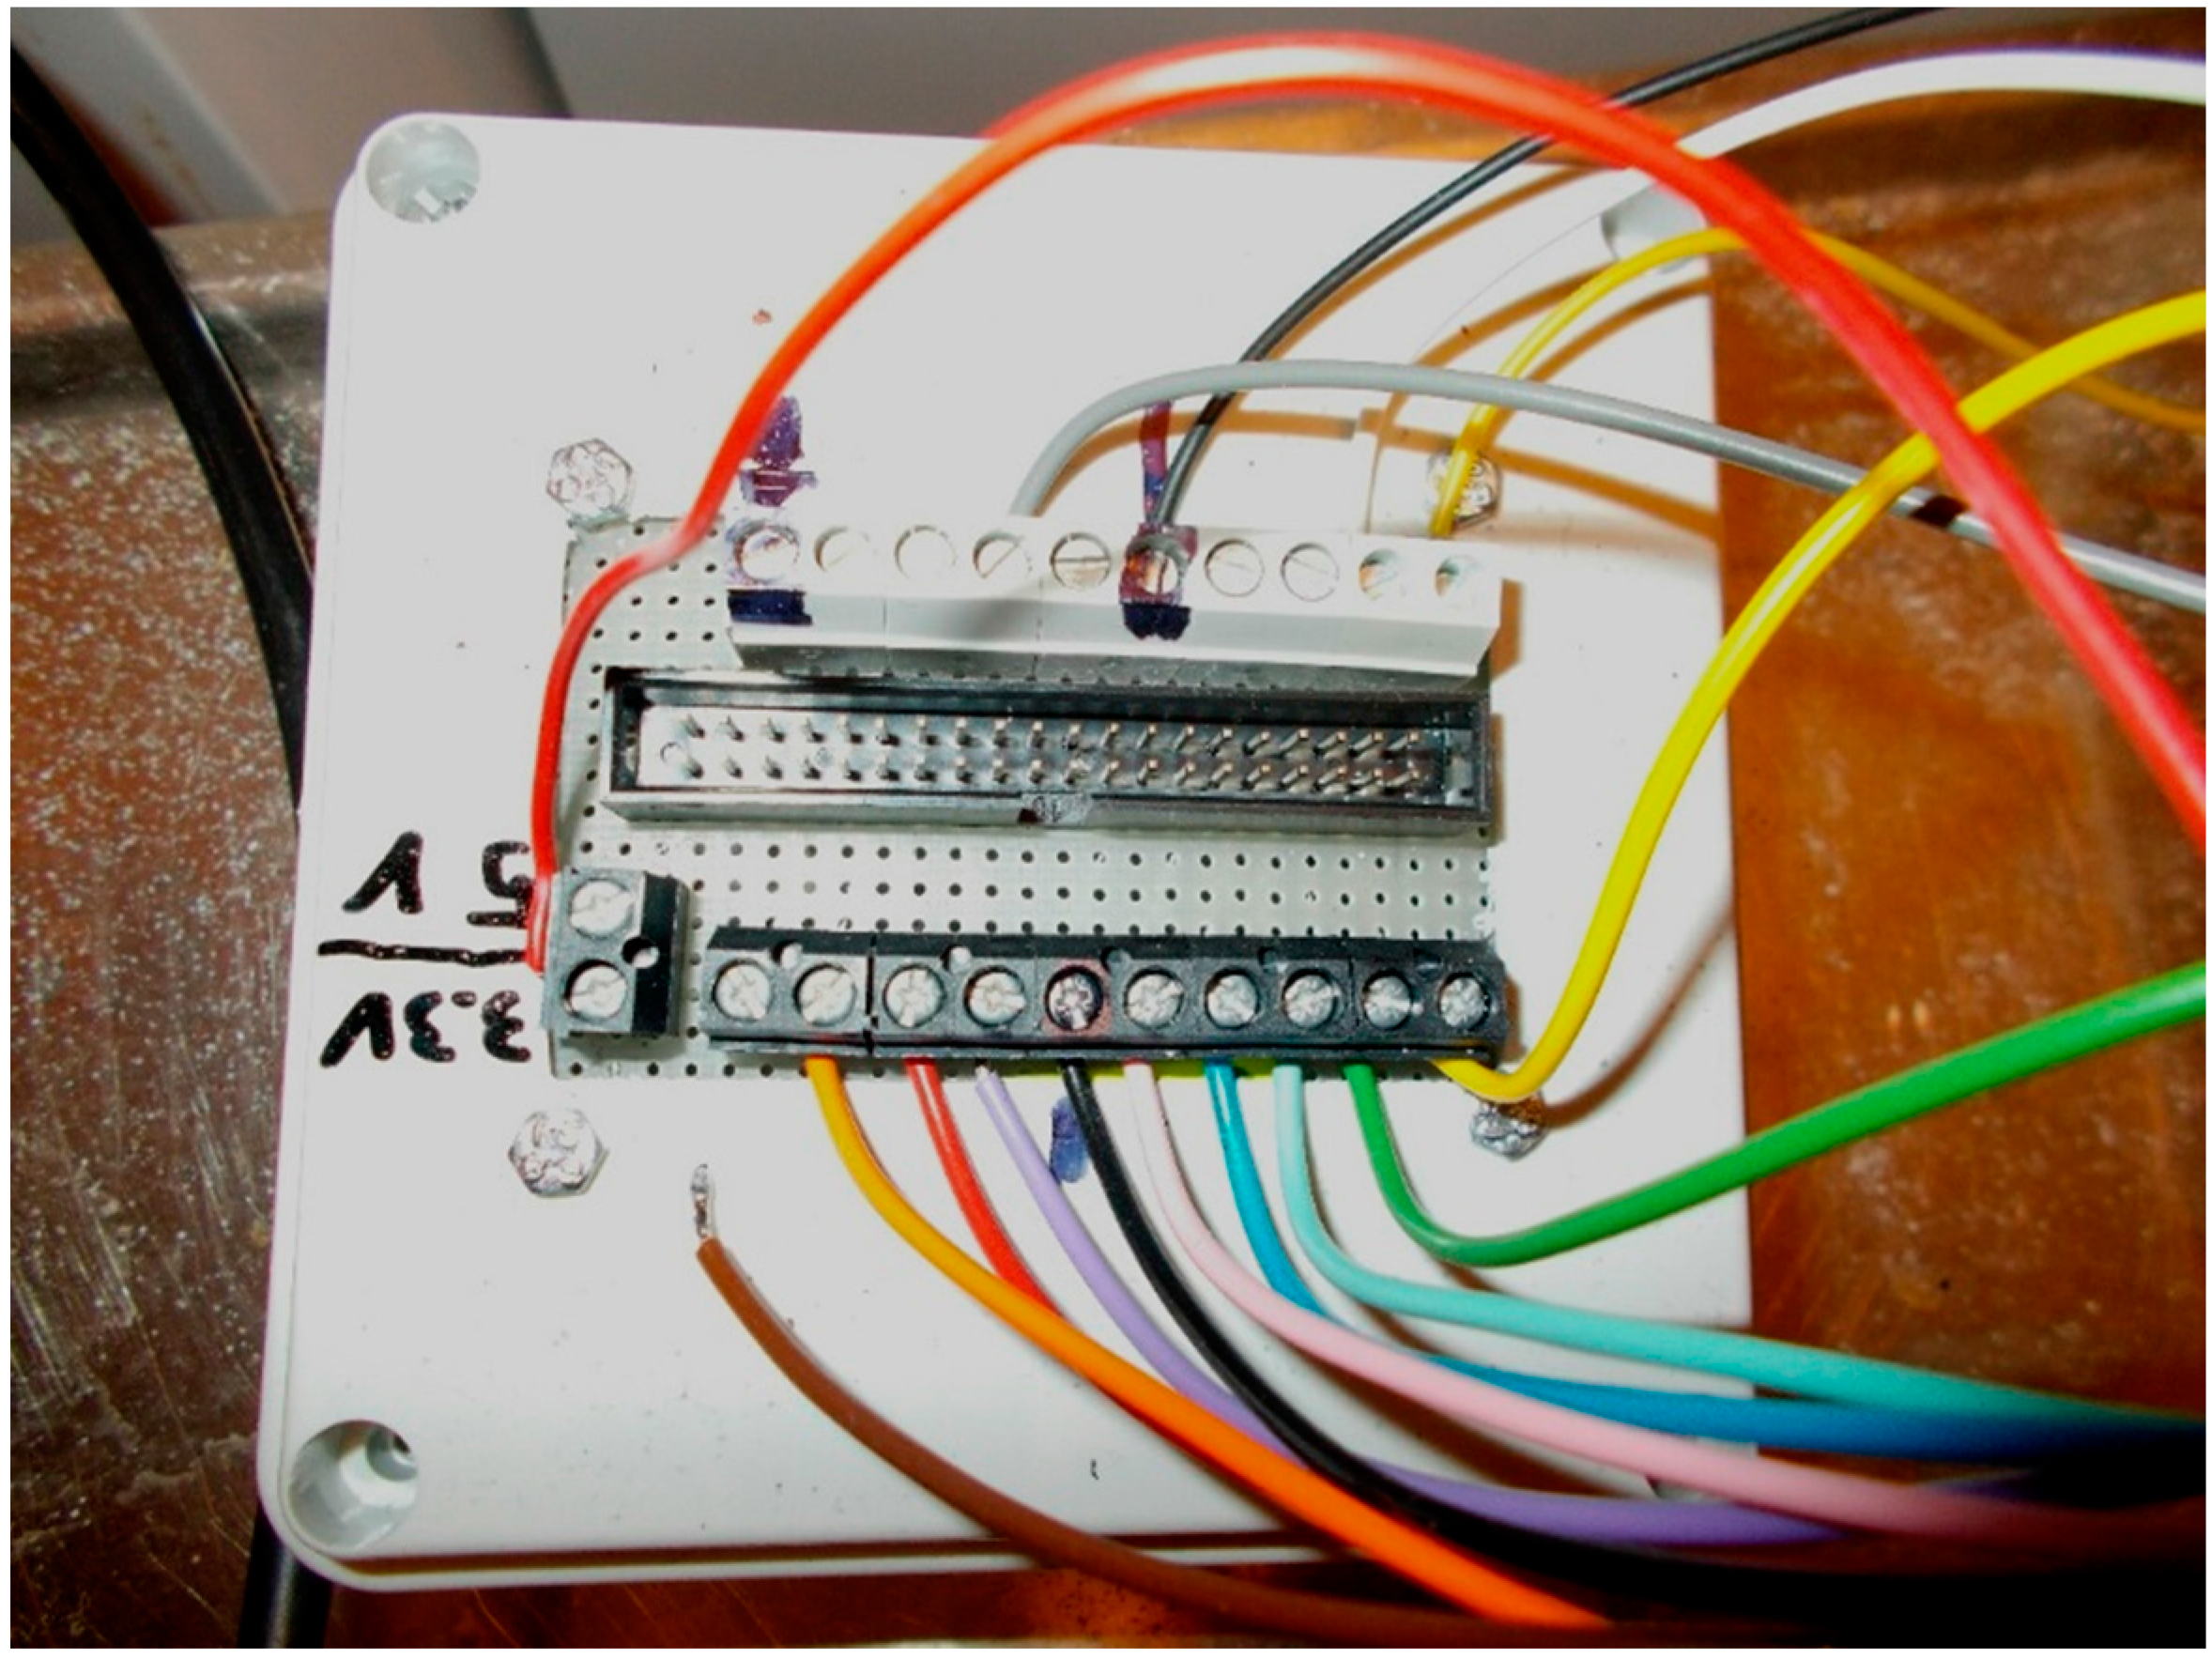
2.3. Connector Box
2.4. Software Package
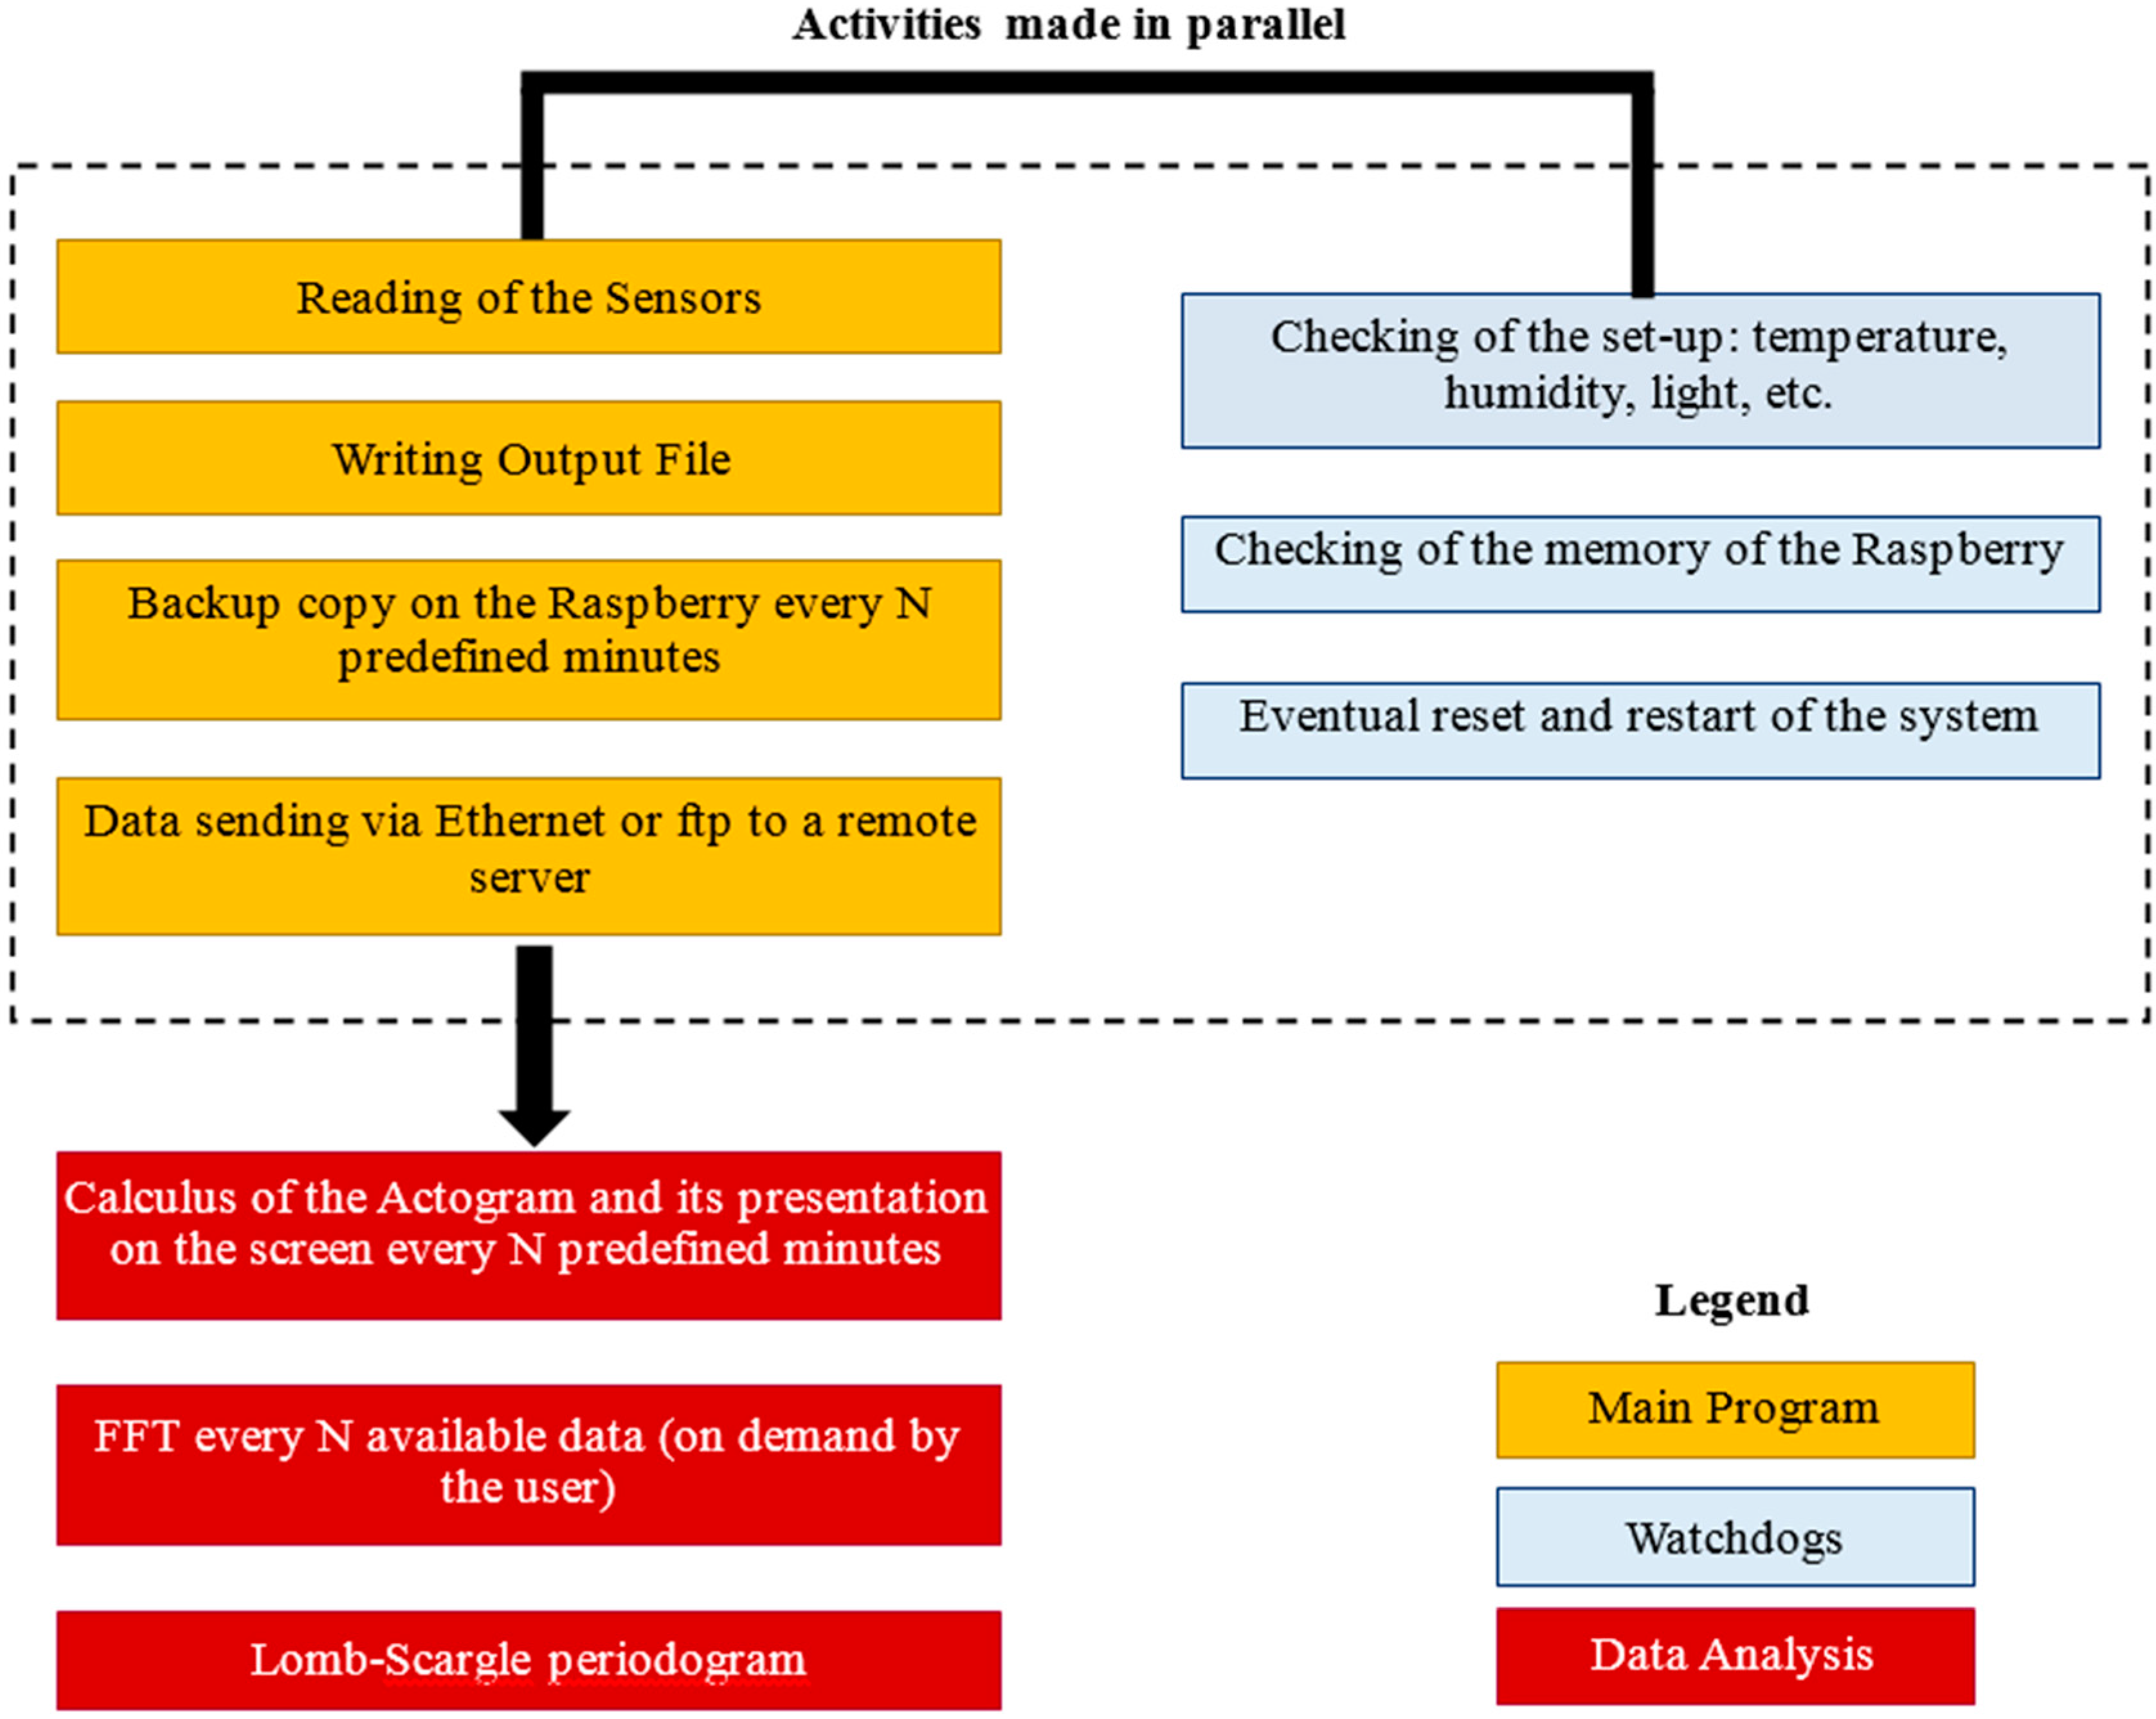
2.4.1. Main Software
2.4.2. Real Time Analysis
2.4.3. A Posteriori Analysis
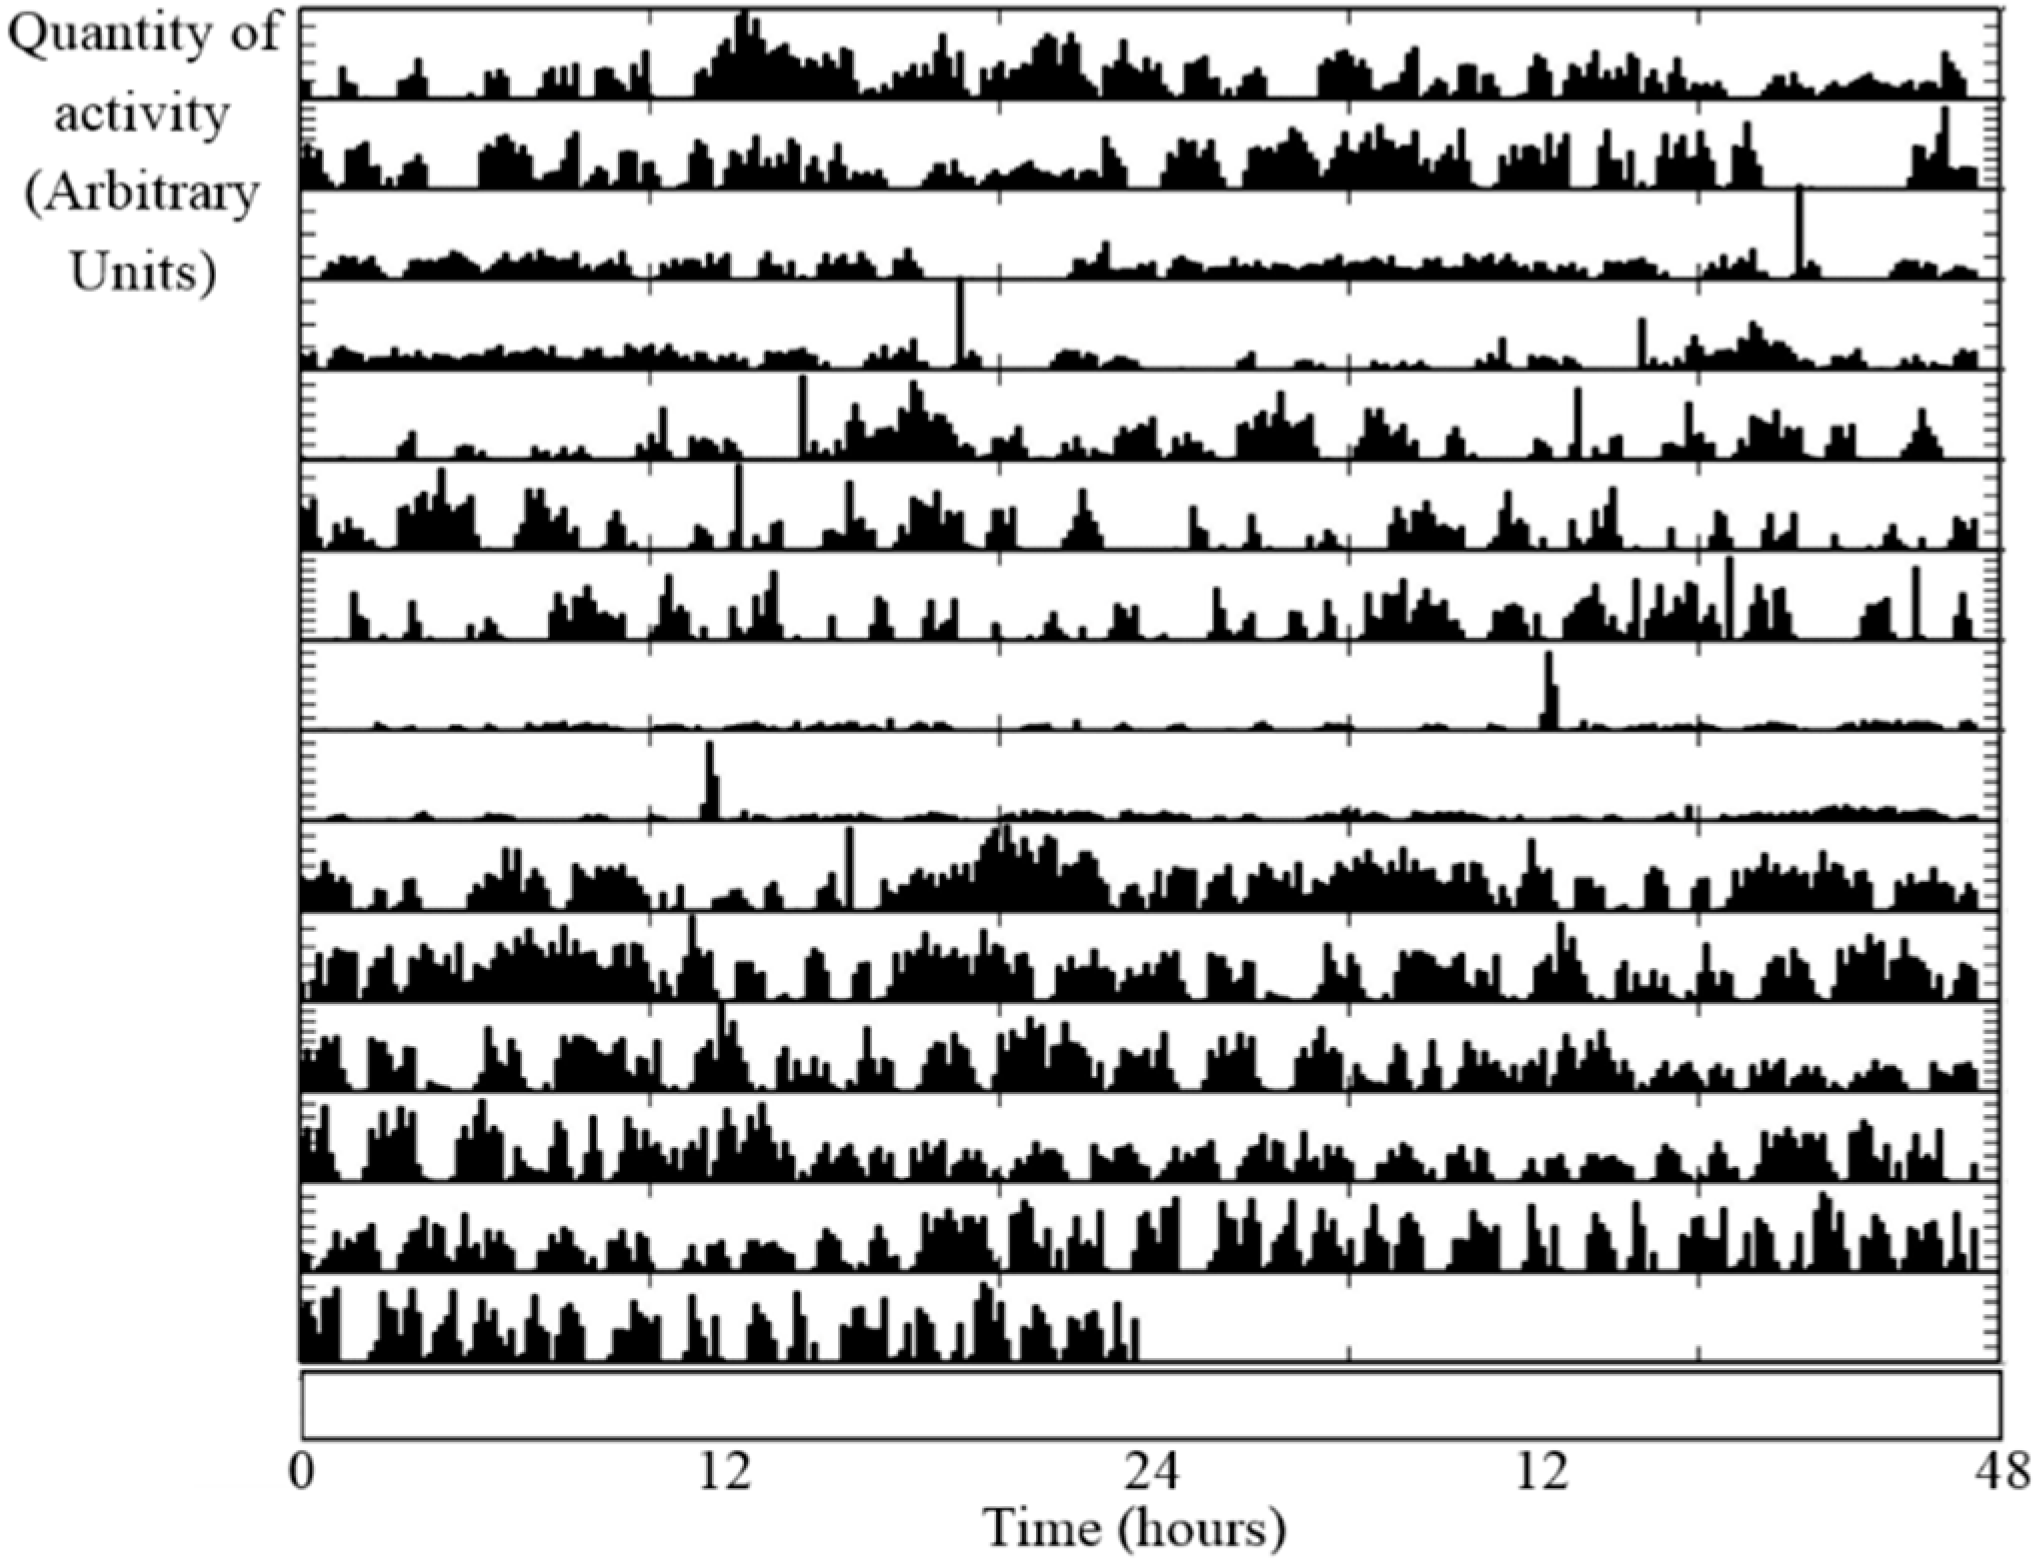
Total Actogram Generator
The Fourier Transform Module
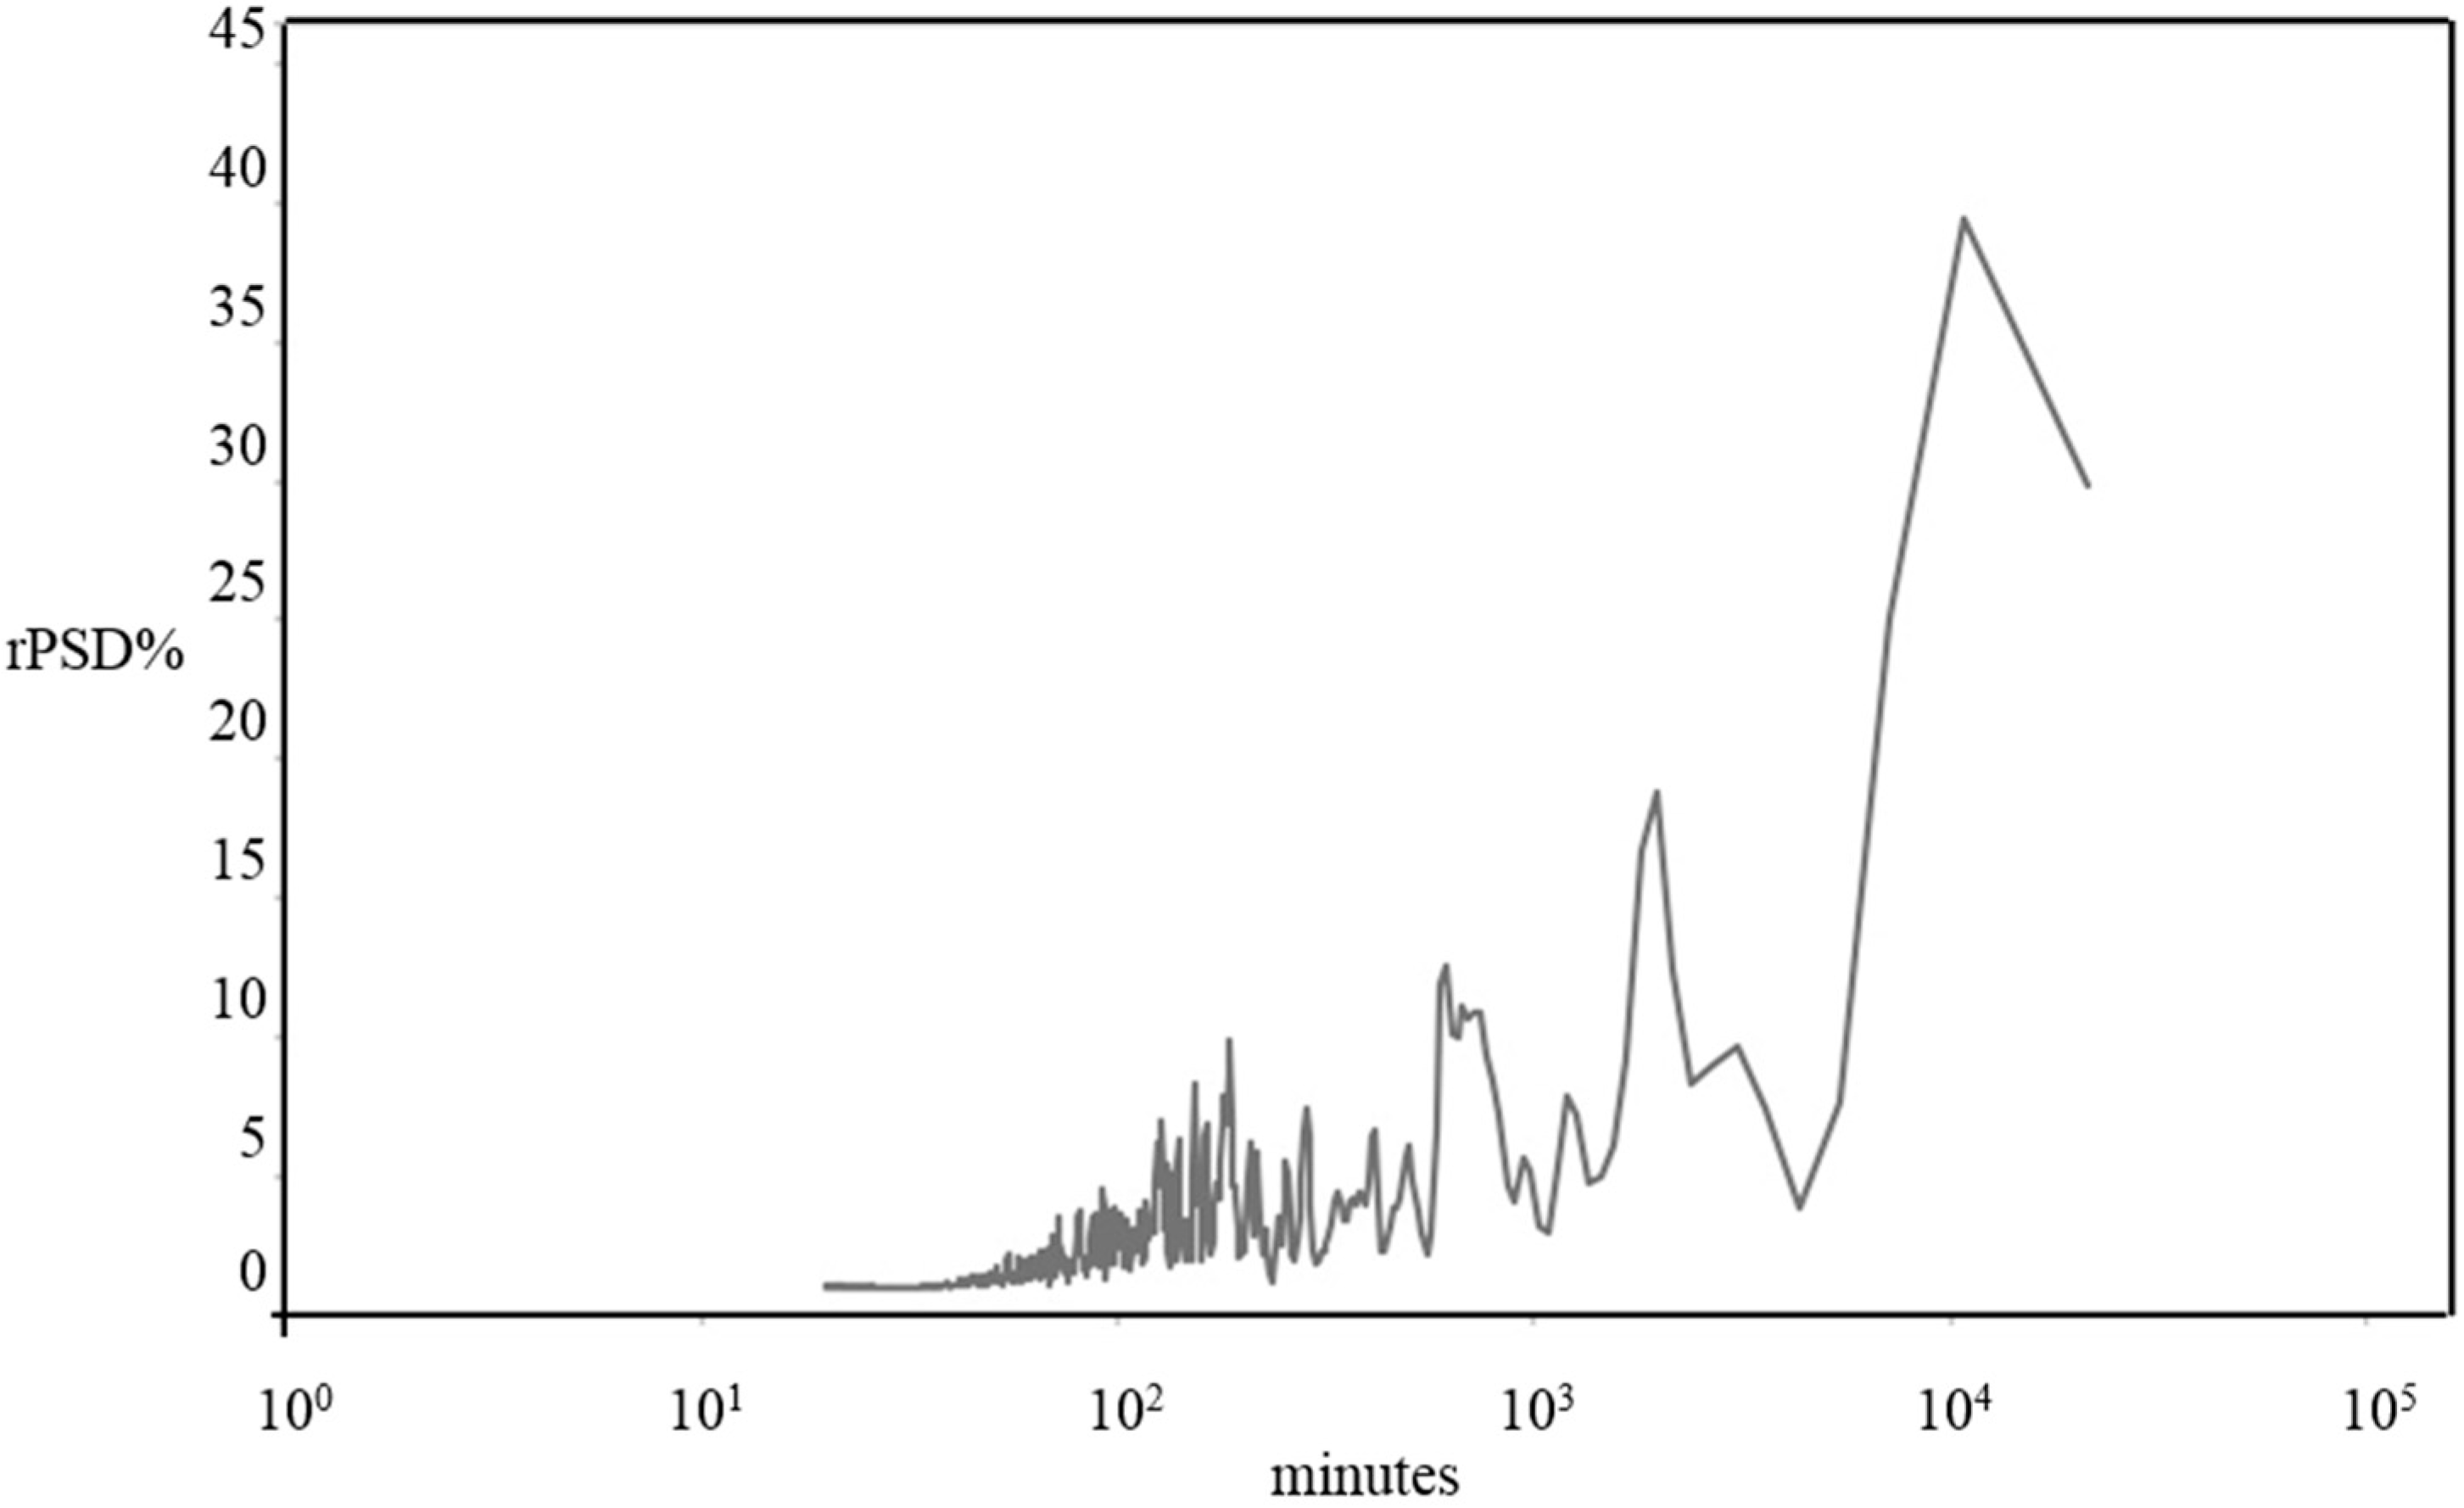
Lomb–Scargle Periodogram
Health Monitoring System Subroutines (HMSS)
- Photodiode control: if the logical binary state of photodiode does not change over an extended period, it is probably broken, and a warning message appears on the screen. Using an external GSM (Global System for Mobile Communications) module, the Raspberry-Pi sends an SMS message or an email to the user.
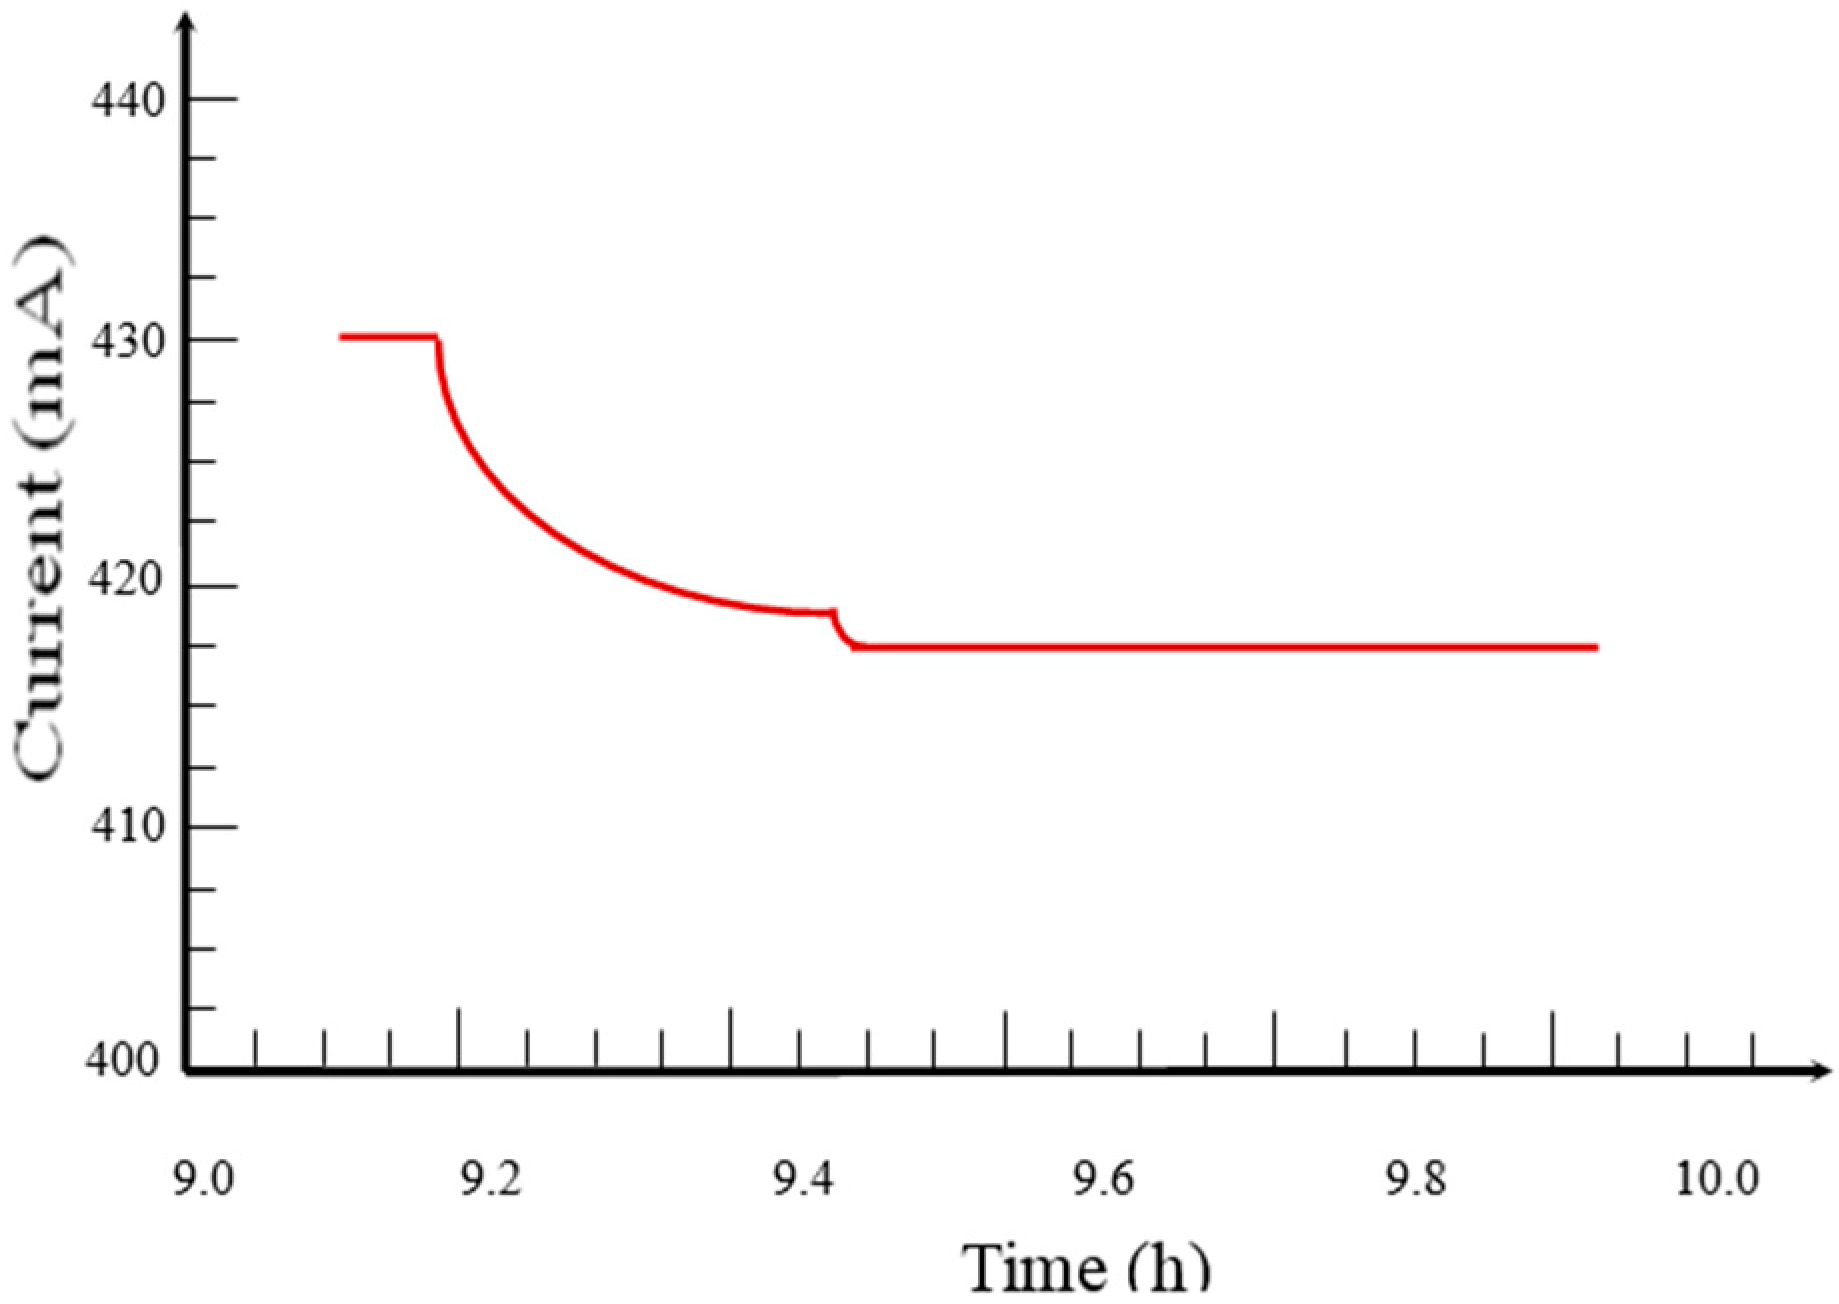
- Battery control: the Raspberry-Pi can be powered by an external battery, so it is important to control the charge state of this battery.
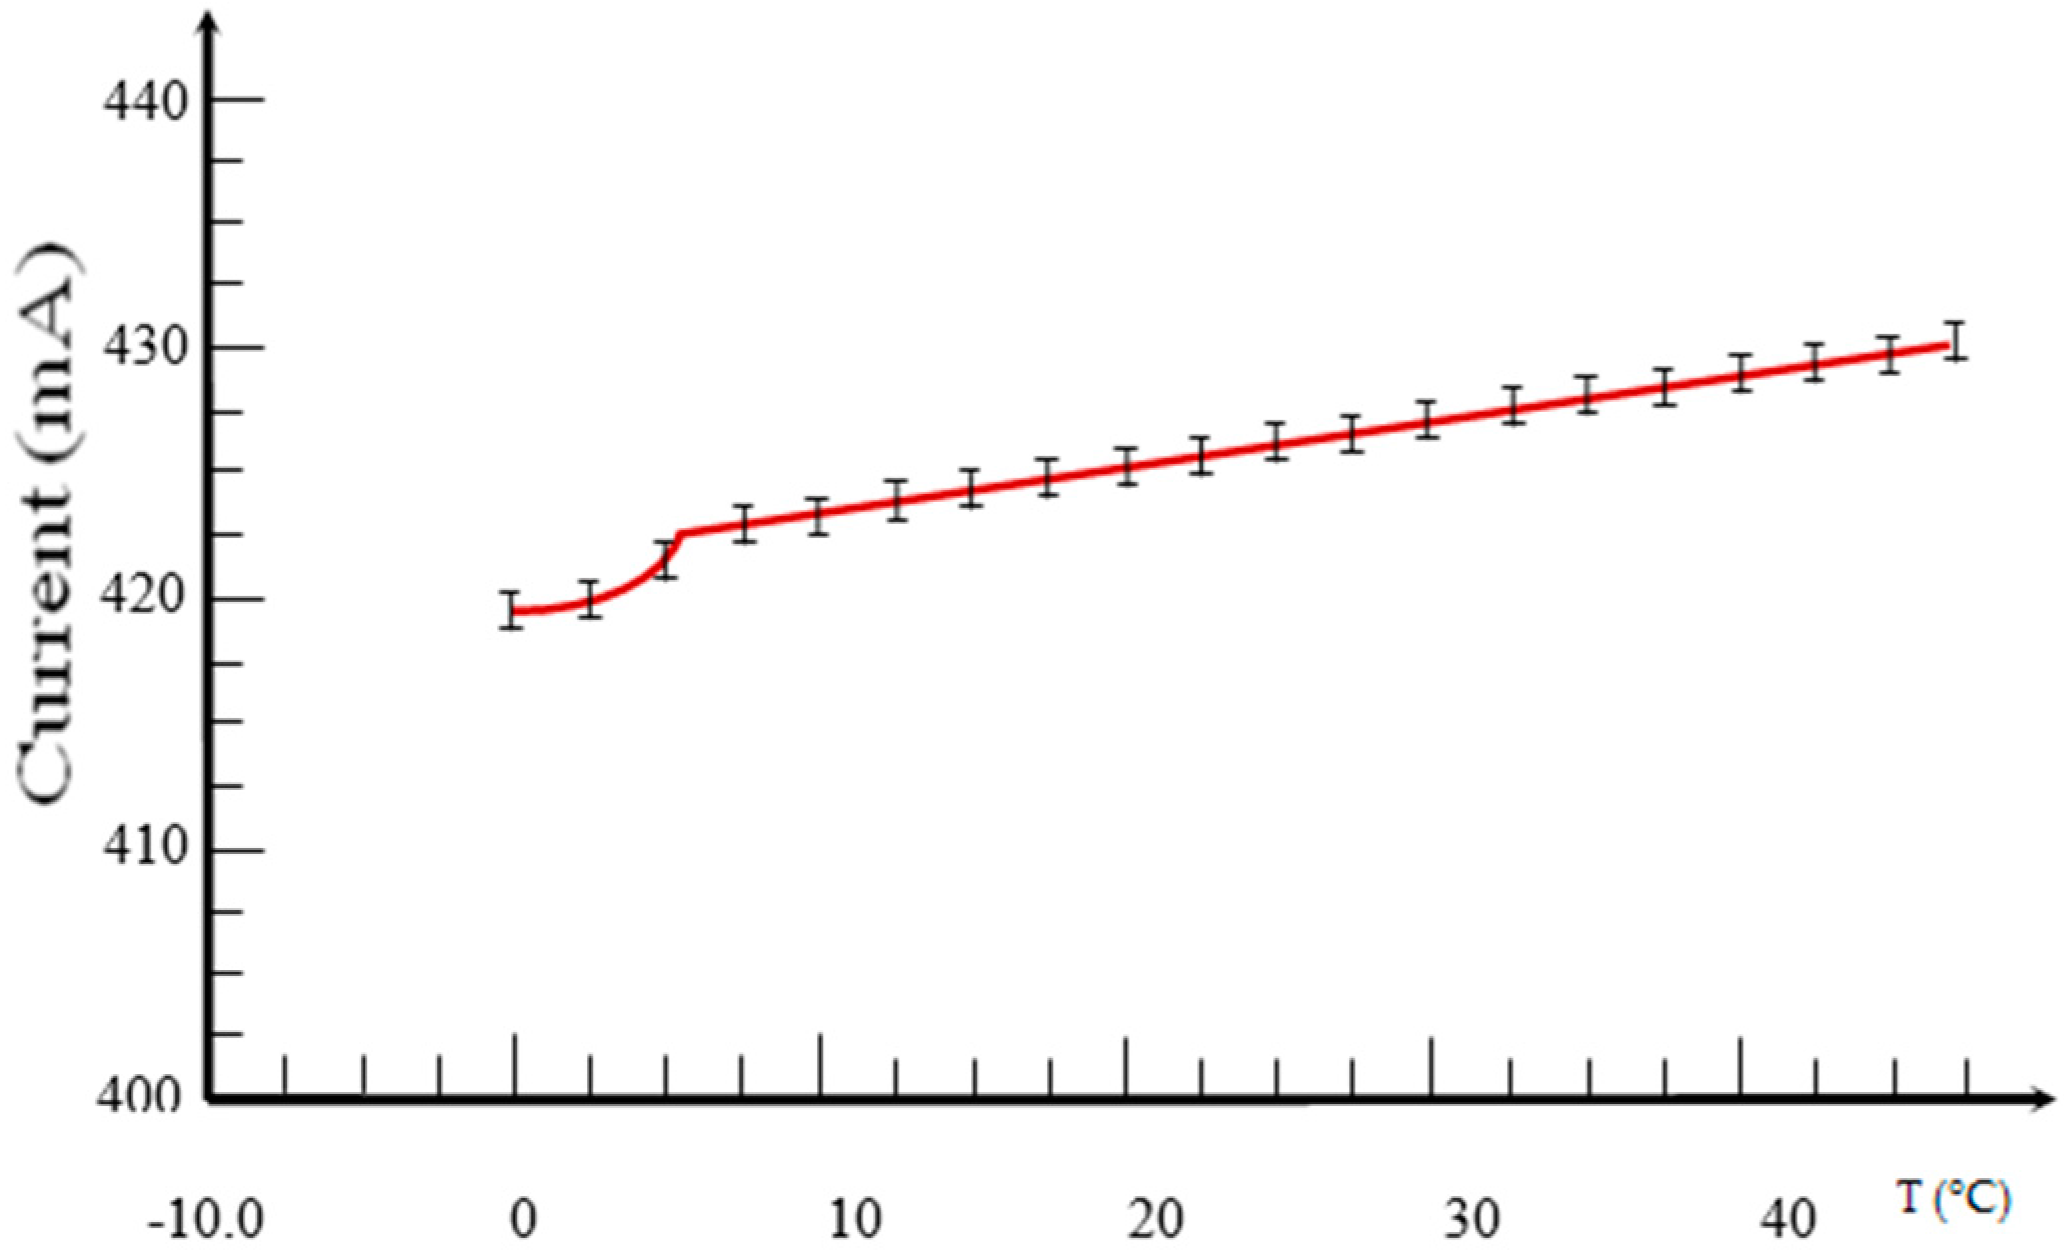
- Physical state of the set-up: the Raspberry-Pi performs a continuous control on intensity of light, temperature, and humidity in the room.
- Memory control: the Raspberry has a SD memory card on which data is written. If the available memory falls below ten percent, the Raspberry-Pi compresses the data on the SD card. After the compression, the Raspberry-Pi enters a low-resolution mode where it reduces the bit size of data acquired and starts to overwrite the oldest data. A warning message is sent to the user.
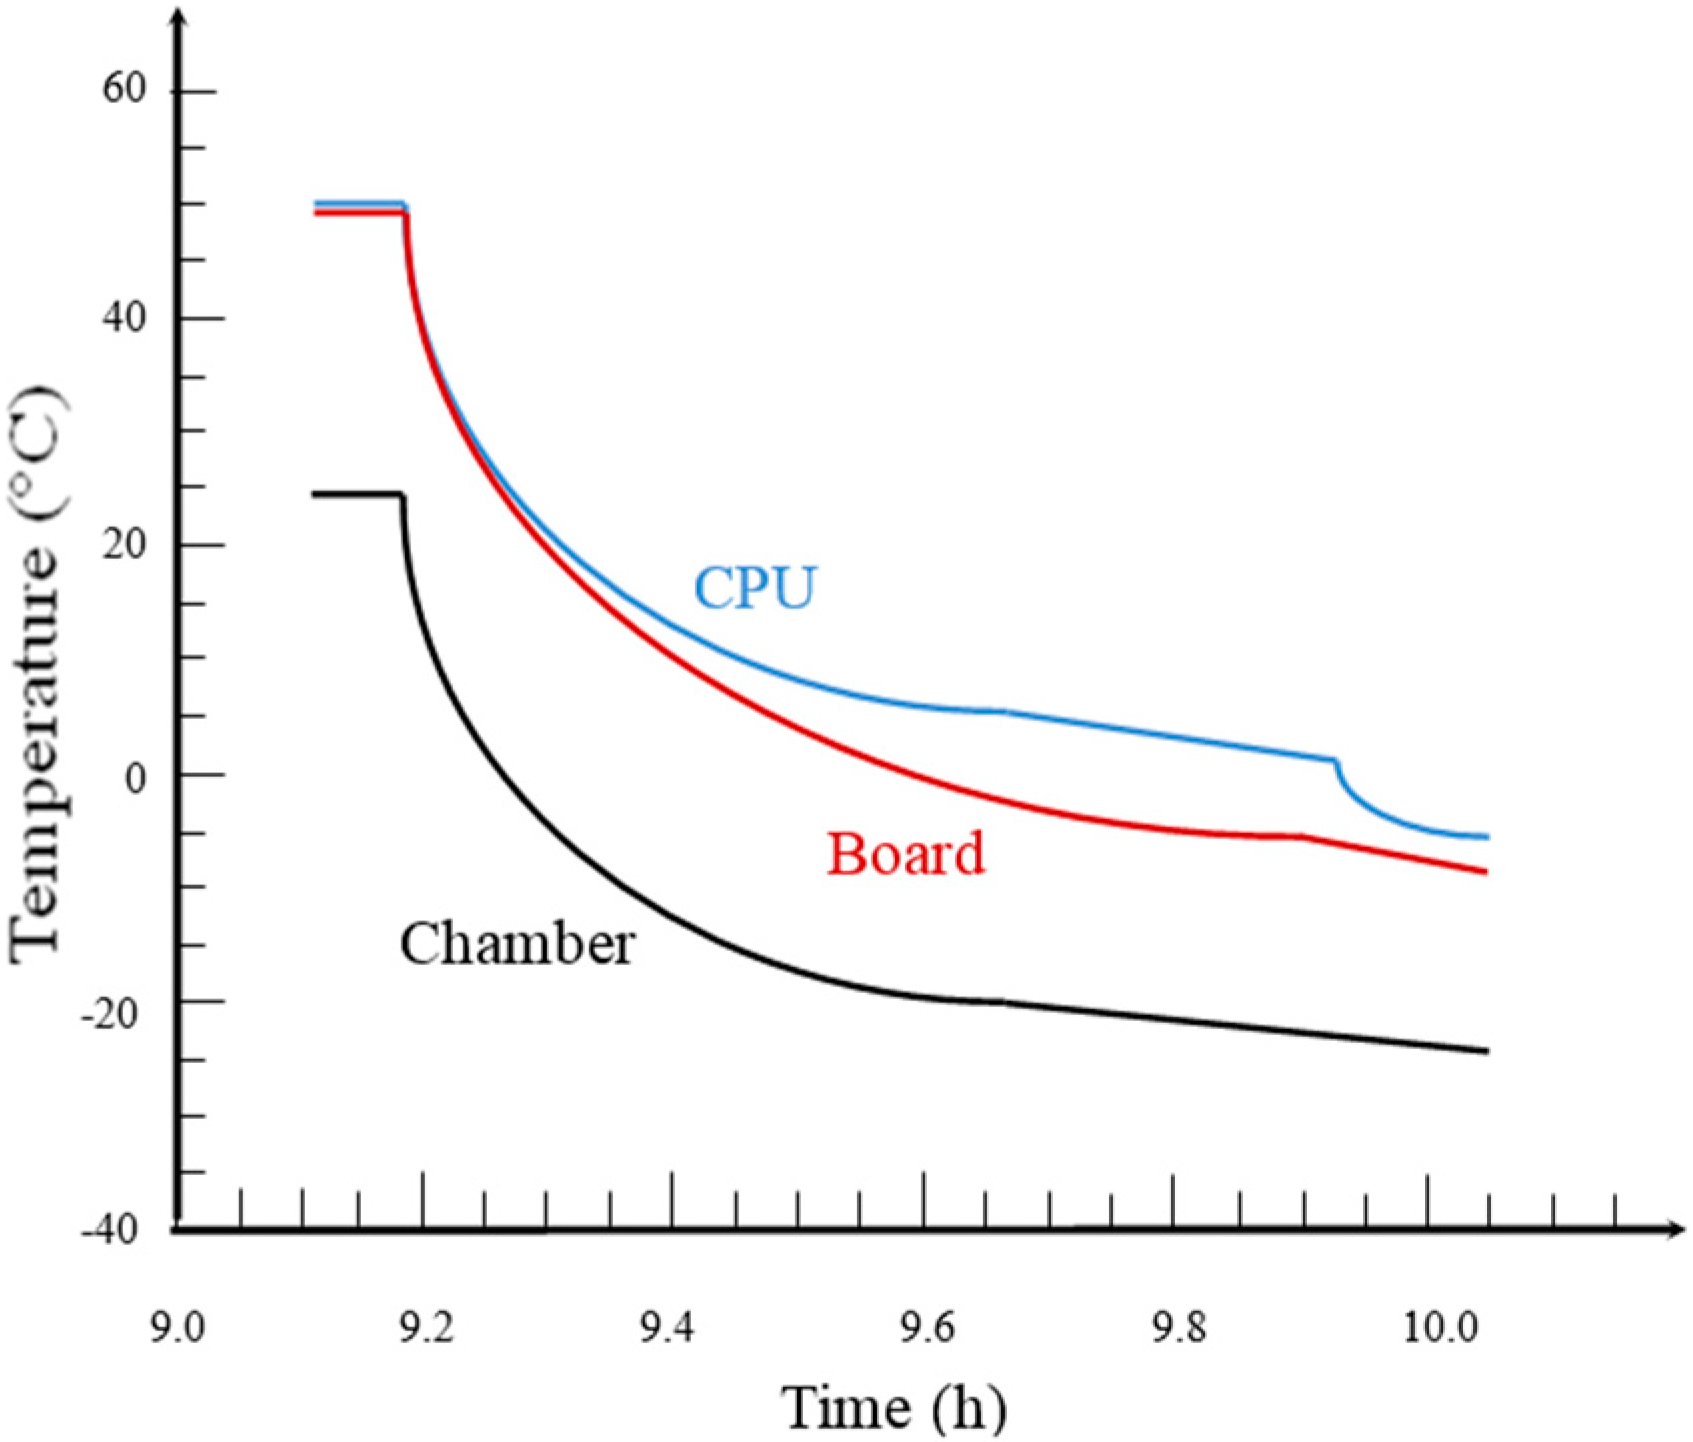
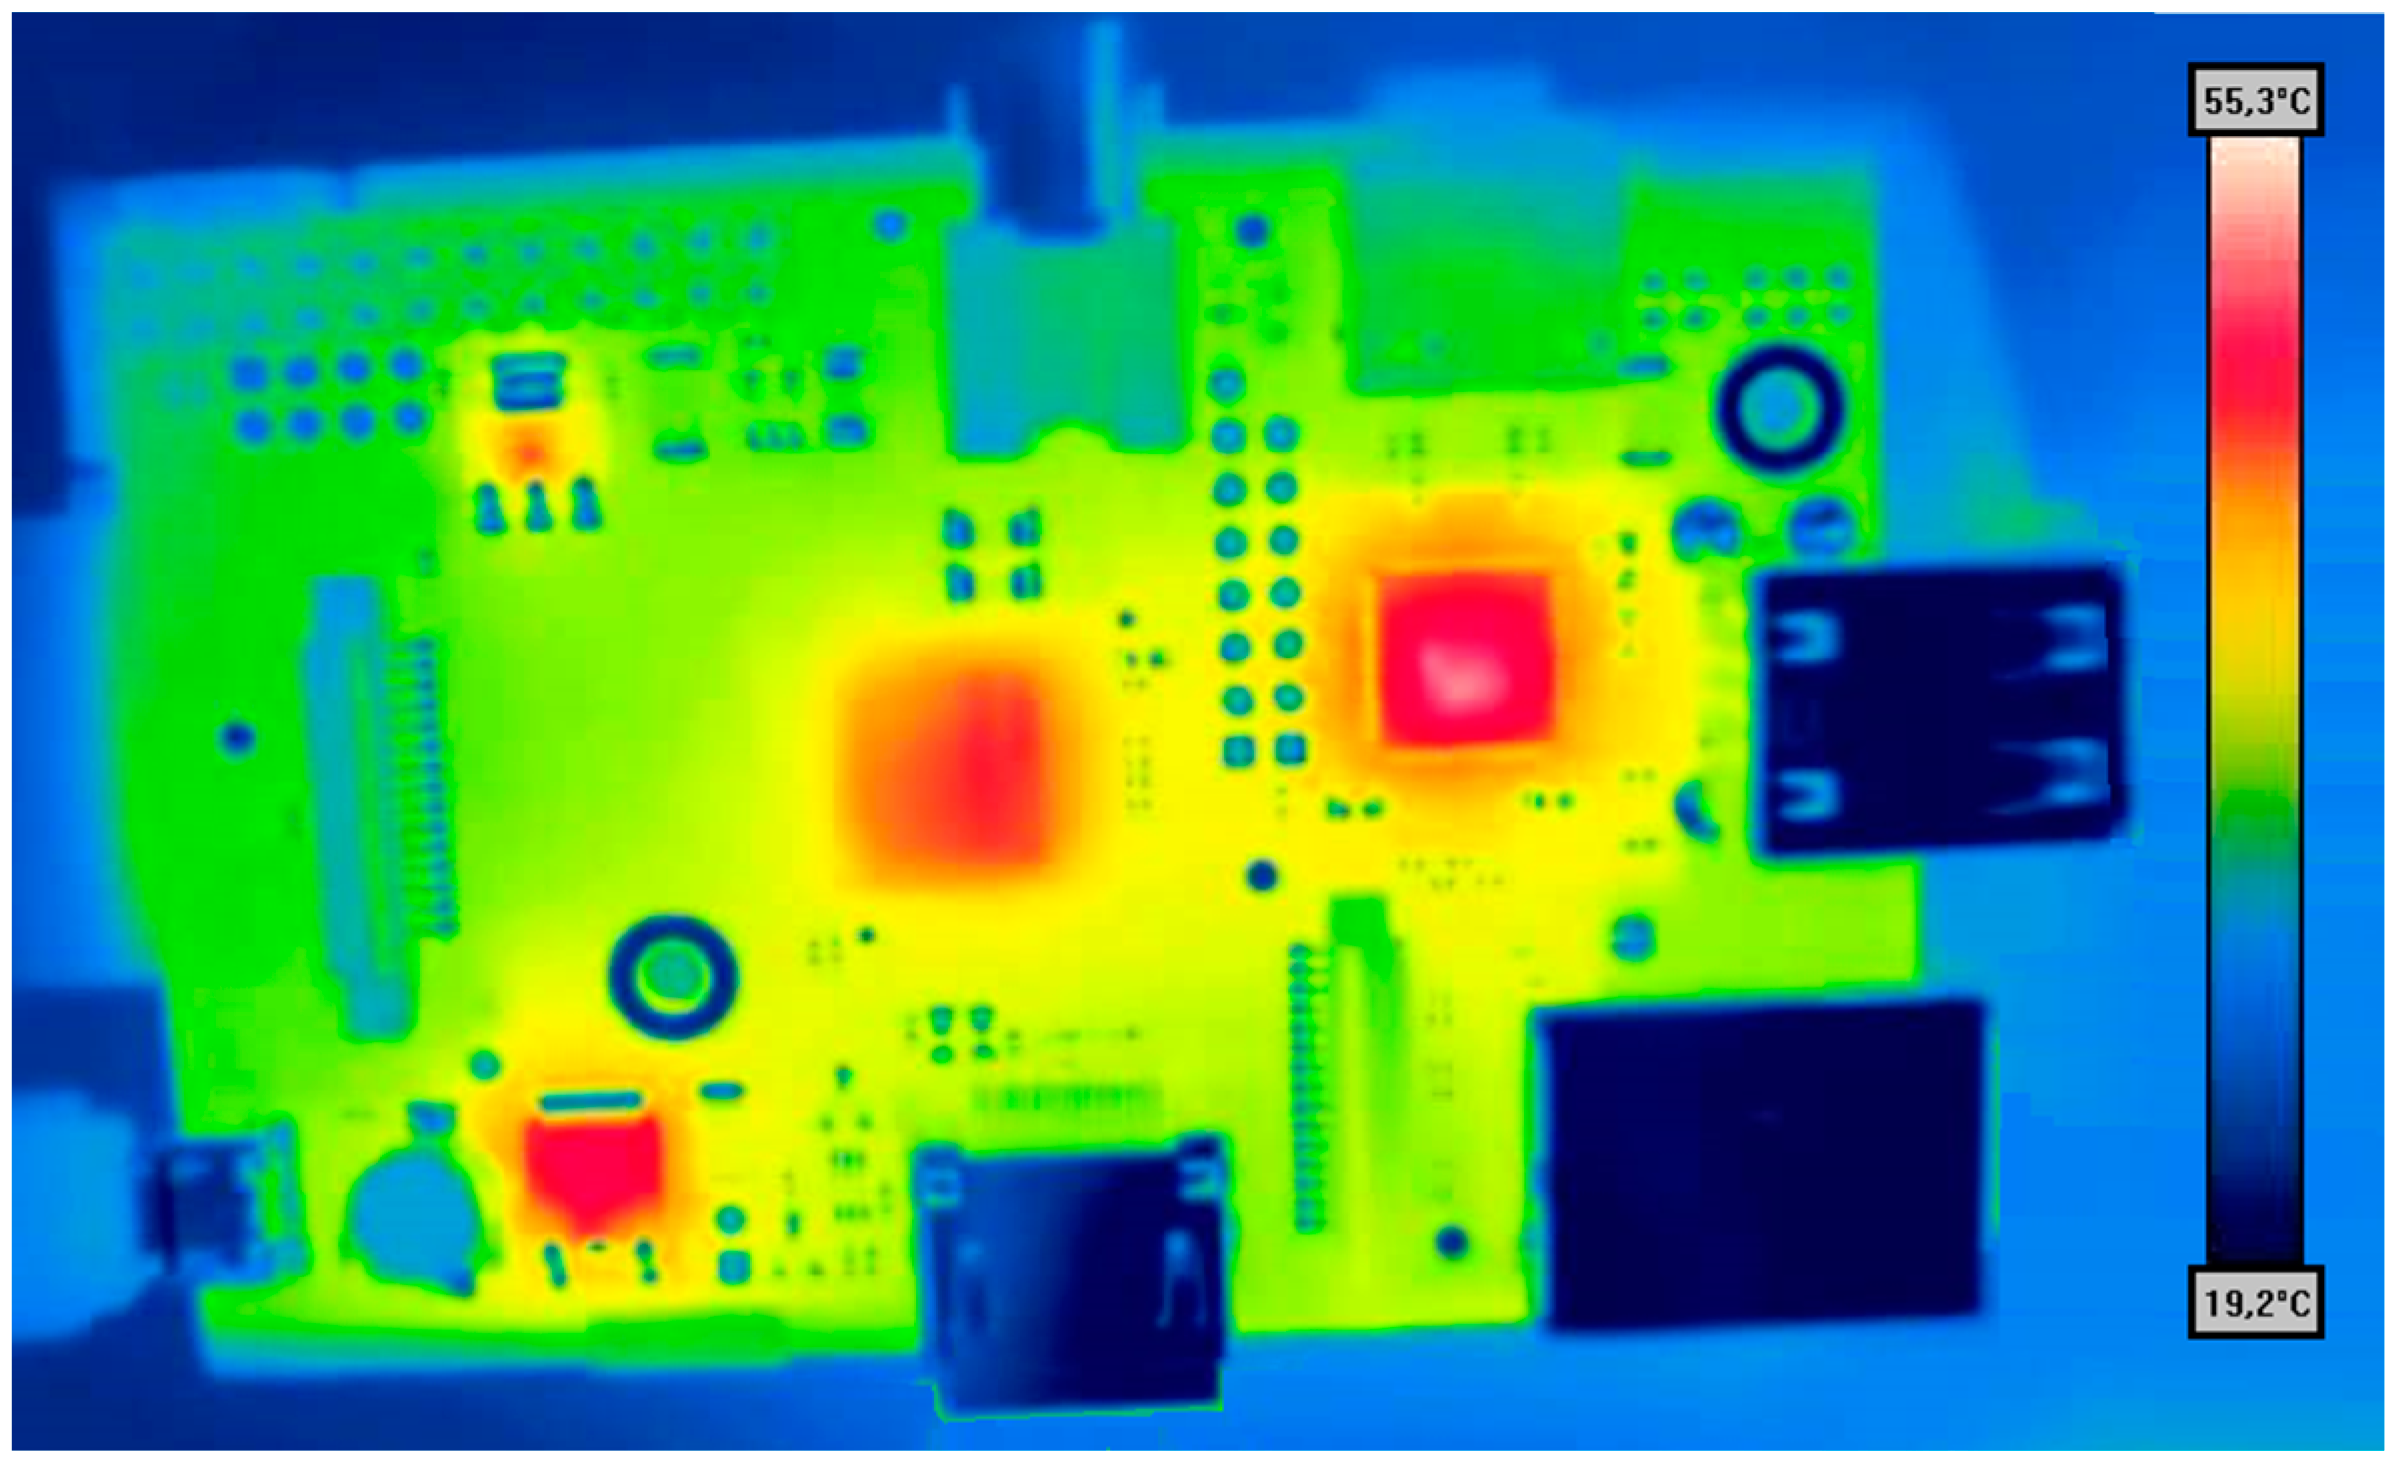
- CPU temperature: the Raspberry can operate in strenuous environments, often with a high demand on the CPU, so its temperature is monitored. If the temperature becomes critical (around 90 °C), all activities are stopped.
3. Comparison with Previous System
- (1)
- The hardware sections, available on the market, are preset and custom configurations are not allowed, e.g., they may not afford the use of a combination of sensors with different technologies in the same measurement bench or to conceive different spatial geometries for the placing of the sensors, themselves, reducing the overall flexibility.
- (2)
- Acquisition cards have prefixed characteristics that could not match the exigencies of new configurations. Hardware upgrades are usually impossible.
- (3)
- The PC-based architectures are required to be installed in lab facilities. This requires moving the animals away from their natural environment. This prevents the possibility of in-field activity and could even introduce a bias.
- (4)
- The software for the data elaboration available on the market need an operative system as Windows or MacOS to run. This increases the overall cost of the system.
- (5)
- The overall dimensions are usually big.
- (6)
- The overall costs of these systems could be extremely high.
- (1)
- It allows designing of specific configurations (combination of sensors with different technologies and different spatial geometries for the placing of the sensors),
- (2)
- It avoids buying a specific acquisition card.
- (3)
- It allows the use of batteries to supply the system allowing in field acquisition campaigns.
- (4)
- Using a release of Linux, it avoids use of proprietary OSs.
- (5)
- It allows for direct programming by the user; therefore, it is possible to develop both the standard algorithms already used for this kind of research and new statistical functions that could show new interesting parameters for the study of these animals.
- (6)
- The overall dimensions are extremely reduced with respect to a PC-based system.
- (7)
- The costs are very low.
4. Experiment, Results and Discussions
4.1. Animals
4.2. Experimental Procedure
4.3. Results and Discussion
- (1)
- The reliability offered by the Raspberry-Pi is certified by field tests carried out for many days and has demonstrated that the Raspberry can be used to fabricate an instrument suitable for extremely harsh environments, such as those in Arctic and Antarctic. Consequently, this technology presents new opportunities for researchers working in similarly difficult situations, e.g., in outer space.
- (2)
- The challenge to reduce the dimensions and the weight with respect to a PC-based, has been accomplished. This is also extremely important for various research where the weight and the dimensions are a variable fundamental for keeping shipment costs low.
- (3)
- The device, which works @ 12 Vdc; therefore, it can be supplied by a battery as in our case. This allows one to place the device directly in the field without the mains, as contrasted with a PC-based system. This allow researchers to leave the animal in its natural environment without disturbing it.
- (4)
- The use of the Raspberry allows researchers to conceive of new hardware for specific tasks.
- (5)
- The possibility to directly program the device increases the overall flexibility of the instrument. In fact, new algorithms can be conceived by researchers to find new information. This feature is not always present in commercial tools that provide only predetermined functions.
5. Conclusions
Acknowledgments
Author Contributions
Conflicts of Interest
References
- Mancinelli, G.; Pasquali, V. Body size-related constraints on the movement behaviour of the arctic notostracan Lepidurus arcticus (Pallas, 1973) under laboratory conditions. Rend. Lincei 2016, 27, 207–215. [Google Scholar] [CrossRef]
- Naylor, E. Chronobiology of Marine Organisms; Cambridge University Press: Cambridge, UK, 2010. [Google Scholar]
- Elliott, E.; Manashirov, S.; Zwang, R.; Gil, S.; Tsoory, M.; Shemesh, Y.; Chen, A. Dnmt3a in the medial prefrontal cortex regulates anxiety-like behavior in adult mice. J. Neurosci. 2016, 36, 730–740. [Google Scholar] [CrossRef] [PubMed]
- De Bruin, N.M.; Schmitz, K.; Schiffmann, S.; Tafferner, N.; Schmidt, M.; Jordan, H.; Parnham, M.J. Multiple rodent models and behavioral measures reveal unexpected responses to FTY720 and DMF in experimental autoimmune encephalomyelitis. Behav. Brain Res. 2016, 300, 160–174. [Google Scholar] [CrossRef] [PubMed]
- Aarts, E.; Maroteaux, G.; Loos, M.; Koopmans, B.; Kovaçevic, J.; Smit, A.B.; Verhage, M.; van der Sluit, S. The light spot test: Measuring anxiety in mice in an automated home-cage environment. Behav. Brain Res. 2015, 294, 123–130. [Google Scholar] [CrossRef] [PubMed]
- Bernadou, A.; Ruther, J.; Heinze, J. Avoid mistakes when choosing a new home: Nest choice and adoption of leptothorax ant queens. J. Insect Physiol. 2015, 79, 88–95. [Google Scholar] [CrossRef] [PubMed]
- Ghezzi, D.; Arzuffi, P.; Zordan, M.; Da Re, C.; Lamperti, C.; Benna, C.; Uziel, G. Mutations in TTC19 cause mitochondrial complex III deficiency and neurological impairment in humans and flies. Nat. Genet. 2011, 43, 259–263. [Google Scholar] [CrossRef] [PubMed]
- Noguchi, T.; Lo, K.; Diemer, T.; Welsh, D.K. Lithium effects on circadian rhythms in fibroblasts and suprachiasmatic nucleus slices from Cry knockout mice. Neurosci. Lett. 2016, 619, 49–53. [Google Scholar] [CrossRef] [PubMed]
- Basu, P.; Wensel, A.L.; McKibbon, R.; Lefebvre, N.; Antle, M.C. Activation of M1/4 receptors phase advances the hamster circadian clock during the day. Neurosci. Lett. 2016, 621, 22–27. [Google Scholar] [CrossRef] [PubMed]
- Aguzzi, J.; Sbragaglia, V.; Sarriá, D.; García, J.A.; Costa, C.; Río, J.D.; Sardà, F. A new laboratory radio frequency identification (RFID) system for behavioural tracking of marine organisms. Sensors 2011, 11, 9532–9548. [Google Scholar] [CrossRef] [PubMed] [Green Version]
- Last, K.S.; Hobbs, L.; Berge, J.; Brierley, A.S.; Cottier, F. Moonlight Drives Ocean-Scale Mass Vertical Migration of Zooplankton during the Arctic Winter. Curr. Biol. 2016, 26, 244–251. [Google Scholar] [CrossRef] [PubMed]
- Proietti, A.; Panella, M.; Leccese, F.; Svezia, E. Dust Detection and Analysis in Museum Environment based on Computational Intelligence. Measurement 2015, 66, 62–72. [Google Scholar] [CrossRef]
- Zordan, M.A.; Benna, C.; Mazzotta, G. Monitoring and analyzing Drosophila circadian locomotor activity. Methods Mol. Biol. 2007, 362, 67–81. [Google Scholar] [PubMed]
- Cagnetti, M.; Leccese, F.; Trinca, D. A New Remote and Automated Control System for the Vineyard Hail Protection Based on ZigBee Sensors, Raspberry-Pi Electronic Card and WiMAX. J. Agric. Sci. Technol. B 2013, 3, 853–864. [Google Scholar]
- Leccese, F.; Cagnetti, M.; Trinca, D. A Smart City Application: A Fully Controlled Street Lighting System Isle Based on Raspberry-Pi Card, ZigBee Sensor Network and WiMAX. Sensors 2014, 14, 24408–24424. [Google Scholar] [CrossRef] [PubMed]
- D’alessandro, G.; de Bernardis, P.; Masi, S.; and Schillaci, A. Common-mode rejection in Martin–Puplett spectrometers for astronomical observations at millimeter wavelengths. Appl. Opt. 2015, 54, 9269–9276. [Google Scholar] [CrossRef] [PubMed]
- Gualtieri, R.; Battistelli, E.S.; Cruciani, A.; de Bernardis, P.; Biasotti, M.; Corsini, D.; Gatti, F.; Lamagna, L.; Masi, S. Multi-mode TES Bolometer Optimization for the LSPE-SWIPE Instrument. J. Low Temp. Phys. 2016, 184, 527–533. [Google Scholar] [CrossRef]
- OPTEK, OP298B Datasheet. Available online: http://optekinc.com/partNumberSearch.aspx?partNumber=op298 (accessed on 22 July 2016).
- OPTEK, OP598B Datasheet. Available online: http://optekinc.com/partNumberSearch.aspx?partNumber=op598 (accessed on 22 July 2016).
- Texas Instruments, MC3303 Datasheet. Available online: http://www.ti.com/product/mc3303 (accessed on 21 March 2015).
- Texas Instruments, 74LS21 Datasheet. Available online: http://www.futurlec.com/74LS/74LS21.shtml (accessed on 21 March 2015).
- Texas Instruments, LM555 Datasheet. Available online: http://www.ti.com/lit/ds/symlink/lm555.pdf (accessed on 21 March 2015).
- Pasquali, V.; D’Alessandro, G.; Gualtieri, R.; Leccese, F. A new Data Logger based on Raspberry-Pi for Arctic Notostraca Locomotion Investigations. Measurements 2016. submitted. [Google Scholar]
- ISO/IEC 9899:TC2 WG14/N1124 Committee Draft—6 May 2005. Available online: http://www.open-std.org/jtc1/sc22/wg14/www/docs/n1124.pdf (accessed on 8 September 2016).
- IFFL LINUX Freedom. Available online: http://www.lffl.org/2014/09/xming-avviare-applicazioni-linux-remoto-windows.html (accessed on 8 September 2016).
- Pasquali, V. Raw Data Used for the Article. Available online: http://dx.doi.org/10.5281/zenodo.61747 (accessed on 13 September 2016).
- Low-Zeddies, S.S.; Takahashi, J.S. Chimera analysis of the clock mutation in mice shows that complex cellular integration determines circadian behavior. Cell 2001, 105, 25–42. [Google Scholar] [CrossRef]
- Lomb, N.R. Least-squares frequency analysis of unequally spaced data. Astrophys. Space Sci. 1976, 39, 447–462. [Google Scholar] [CrossRef]
- Scargle, D. Studies in astronomical time series analysis. II—Statistical aspects of spectral analysis of unevenly spaced data. Astrophys. J. 1982, 263, 835–853. [Google Scholar] [CrossRef]
- Townsend, R.H.D. Fast calculation of the Lomb–Scargle periodogram using graphics processing units. Astrophys. J. Suppl. Ser. 2010, 191, 247–253. [Google Scholar] [CrossRef]
- Caciotta, M.; Leccese, F.; Schirripa Spagnolo, G.; Cozzella, L. Automatic Industrial Electrical Circuit Firing Prevention using Infrared Termography. In Proceedings of the 20th IMEKO TC-4 International Symposium Measurement of Electrical Quantities, Benevento, Italy, 15–17 September 2014.
- Calizza, E.; Costantini, M.L.; Rossi, D.; Pasquali, V.; Careddu, G.; Rossi, L. Stable isotopes and digital elevation models to study nutrient inputs in high-Arctic lakes. Rend. Lincei 2016, 27, 191–199. [Google Scholar] [CrossRef]
- Magnusson, K.; Magnusson, M.; Östberg, P.; Granberg, M.; Tiselius, P. Bioaccumulation of 14 C-PCB 101 and 14 C-PBDE 99 in the marine planktonic copepod Calanus finmarchicus under different food regimes. Mar. Environ. Res. 2007, 63, 67–81. [Google Scholar] [CrossRef] [PubMed]
- Ugolini, A.; Pasquali, V.; Baroni, D.; Ungherese, G. Behavioural responses of the supralittoral amphipod Talitrus saltator (Montagu) to trace metals contamination. Ecotoxicology 2012, 21, 139–147. [Google Scholar] [CrossRef] [PubMed]
- Pasquali, V. Locomotor activity rhythms in high arctic freshwater crustacean: Lepidurus arcticus (Branchiopoda; Notostraca). Biol. Rhythm Res. 2015, 46, 453–458. [Google Scholar] [CrossRef]
- Lincoln, G.A.; Johnston, J.D.; Andersson, H.; Wagner, G.; Hazlerigg, D.G. Photorefractoriness in mammals: Dissociating a seasonal timer from the circadian-based photoperiod response. Endocrinology 2005, 146, 3782–3790. [Google Scholar] [CrossRef] [PubMed]
- Costa, C.; Aguzzi, J.; Chiesa, J.J.; Magnifico, G.; Cascione, D.; Rimatori, V.; Caprioli, R. Evidences on the transient disruption of Sabella spallanzanii (Polychaeta, Sabellidae) fan activity rhythm in laboratory constant darkness. Ital. J. Zool. 2008, 75, 337–344. [Google Scholar] [CrossRef]
- Pasquali, V.; Anna, C.; Paolo, R. Circadian and ultradian rhythms in locomotory activity of inbred strains of mice. Biol. Rhythm Res. 2010, 41, 63–74. [Google Scholar] [CrossRef]


| Raspberry-Pi System | Standard System | ||
|---|---|---|---|
| Hardware | ~75 € | Hardware | From 500 to 10,000 € |
| Software | Free | Software (Operative System) OS + elaboration tool) | From 500 to 3,500 € |
| Total | ~75 € | Total | From 1,000 to 13,500 € |
© 2016 by the authors; licensee MDPI, Basel, Switzerland. This article is an open access article distributed under the terms and conditions of the Creative Commons Attribution (CC-BY) license (http://creativecommons.org/licenses/by/4.0/).
Share and Cite
Pasquali, V.; Gualtieri, R.; D’Alessandro, G.; Granberg, M.; Hazlerigg, D.; Cagnetti, M.; Leccese, F. Monitoring and Analyzing of Circadian and Ultradian Locomotor Activity Based on Raspberry-Pi. Electronics 2016, 5, 58. https://doi.org/10.3390/electronics5030058
Pasquali V, Gualtieri R, D’Alessandro G, Granberg M, Hazlerigg D, Cagnetti M, Leccese F. Monitoring and Analyzing of Circadian and Ultradian Locomotor Activity Based on Raspberry-Pi. Electronics. 2016; 5(3):58. https://doi.org/10.3390/electronics5030058
Chicago/Turabian StylePasquali, Vittorio, Riccardo Gualtieri, Giuseppe D’Alessandro, Maria Granberg, David Hazlerigg, Marco Cagnetti, and Fabio Leccese. 2016. "Monitoring and Analyzing of Circadian and Ultradian Locomotor Activity Based on Raspberry-Pi" Electronics 5, no. 3: 58. https://doi.org/10.3390/electronics5030058