1. Introduction
Steganography is the art of hiding information within other media, known as “cover media”. The objective of steganography is to conceal secret data into the contents of the “cover media” in a manner that renders the probability of unintended users finding this secret data extremely low [
1]. This way of securing information in communication technology differentiates itself from the well-known encryption method because in the encrypted information one can presume the existence of the secret data and try guessing key(s) or a portion of message to decipher the secrets [
2]. Another information concealment method in the field of secure data communication is watermarking. Although, it ensures the integrity of the data, it limits the secret data communication standard by exhibiting the concealed data to the third party [
3]. Hence, steganography is hastily becoming a bewitching process in the field of secret data transmission for both wire and wireless communications. Consequently, its’ uses are spreading from hiding regular data to more specialized information, including medical [
3] (a unique contribution by the authors on offline healthcare service) and forensic data [
4]. As a working space, it is expanding its scope from worldwide communication to standalone applications like authenticating a smart card inserted into a terminal [
2] or storing data by embedding them inside media [
5]. For the reason of data security, nowadays, digital data like intellectual properties, copyrights, documents of forensics and law-enforcing agencies, social media data, and multimedia data in various applications are covertly transmitted, stored, and governed by this data embedment strategy.
Based on the embedding domain, image steganography can be classified into four subgroups—image domain [
6,
7,
8,
9], transform domain [
10,
11], histogram domain [
12,
13,
14,
15], and compressed domain [
16,
17,
18]. In the image domain, also known as the spatial domain, embedding is done directly into pixel values. The common methods used in such domain are the replacement of the least significant bit (LSB), LSB matching, and addition or subtraction to/from the pixels’ value. Another useful procedure is to transform the image data into coefficients such as the processes of discrete cosine transform (DCT) coefficients, first Fourier transforms (FFT) coefficients, wavelet transforms coefficients, and so on. These coefficients are used as an embedding space. After embedding, an inverse transformation is performed to return to the image domain. One more useful and famous technique is to embed information into the histogram of the image data or to the histogram of some processed information like pixel differences and prediction errors. A prediction-error histogram is generated from the difference of the cover values and their respective predicted values [
13]. These errors are used as the embedding space. There, the histograms are either shifted unevenly or associated and reflected evenly by the pattern of the chunk of the concealed data. The other less likely used space is the compressed domain where the image data is first compressed by any standard method like vector quantization (VQ) [
16,
17], M-sequence coding [
18] or truncation [
19], and then the secret data is embedded contents.
Embedding processes are classified into two other major categories—reversible and reversible—based on their capability of extracting the implanted secret data as well as recovering the original image pixels. The data embedment rules modify the cover pixels by implanting the secret data. At the receiver end, the decoder retrieves the concealed information from the stego image. If the decoder extracts only the secrets and becomes unable to reconstruct the cover image, the method is termed as the irreversible embedding process [
20,
21,
22,
23,
24,
25]. On the other hand, if the decoder reconstructs the cover image during its message extraction, the process is referred to as a reversible data hiding (RDH) scheme [
26,
27,
28,
29,
30]. The reversible data hiding schemes, by nature, offer less embedding capacity than irreversible embedding schemes, because to manage the reversibility, these schemes implant some addition information into the image and leave many of the pixels without concealing any bits. These nonconceived pixels are also shifted by an amount stipulated by the embedding rules. Consequently, the ratio of distortion to embedding capacity in the reversible processes is notably higher than the irreversible procedures. Nevertheless, the associated activities—such as measuring prediction errors or pixel differences, implanting additional bits, and defining the embeddable contents—have enriched the security of the reversible process because without the exact knowledge of this associated information, data extraction is impossible. Therefore, the involvement of such an associated activity of the reversible scheme (e.g., generation of prediction errors as an embedding space) in an irreversible process will enhance both the security of the implanted data and the embedding capacity.
In 2009, Chao et al. [
30] proposed a diamond encoding (DE)-based irreversible data embedment process. A neighborhood function is used to make a diamond from each pair of pixels. The number of cells in the diamond is measured from a polynomial function. In 2012, Hong and Chen [
28] observed that the diamond shape is not a compact region. The neighborhood function and the cells’ set of the diamond are redefined by this scheme. During the embedment of a digit, in both the cases (i.e., in [
28,
30]) a pair of pixels are replaced by another pair in the cell of the diamond. In the scheme of Hong and Chen, the embedding capacity and the image quality are improved by the application of adaptive pixel pair matching. Again, Hong et al. [
6] in 2012 modified Chao et al.’s scheme to embed data at multiple bases of the diamond. Bases are generated by partitioning the gray scale into multiple parts. The shifting of pixels are bounded within the base. The difference of each adjacent pixel is used to map a gray partition. This strategy has improved the stego-image quality by reducing the amount of displacement of the stego pixels caused by the data embedment. In 2011, Liao et al. [
9] implanted bits by replacing the least significant bits (LSBs) of the image pixels. They divided the cover image into blocks of four pixels. The average distance of the pixels from the minimum one in the block is measured. If the distance value is smaller than a threshold, fewer LSBs are replaced by the data bits; otherwise, a greater number of bits are replaced. This way, message bits are embedded into all blocks by the rules of LSB substitutions. Although, the scheme notably increases the embedding capacity, it noticeably decreases the image quality. In 2010, Hong et al. [
13] proposed a reversible scheme to embed into two-peak presented errors in the prediction error histogram. The embedding rate of that scheme only depends on the frequencies of these two-peak presenting errors.
These diamond encoding-oriented irreversible schemes show some limitations. The calculation of diamond characteristic values (i.e., cells sets) during the diamond generation and again searching the characteristic values for a matching of pixel pair (i.e., matching of two pixel values with two diamond characteristic values) are time consuming processes. If the number of bits in each pair of pixels is a single bit, the scheme cannot present higher embedding capacity; rather, the distortions for each bit of data embedment is increased. In addition, the partitioning of image is fixed to two pixels only. On the contrary, the reversible scheme of Hong et al. [
13] has minimized the amount of pixel shifting in the stego image by allowing the pixels to be shifted by one unit at most. Kamal and Islam [
23] in 2015 improved the embedding capacity and the image quality regarding the results of [
13] by introducing a new predictor that utilizes the Euclidean distance in their prediction rules. That scheme does not modify the embedding rules. The same authors, as well as the authors of this article, in 2016, [
21] have applied multiple predictors to improve the prediction accuracy. Although this attempt has improved the prediction accuracy, the application of multiple predictors has increased the time complexity. These authors, in another work in 2016 [
22], have improved the embedding capacity my embedding into several errors multiple times. However, this not a single-layer data embedment process. Besides, this increases the time complexity by embedding multiple times. The same authors, in [
20,
24], have improved the embedding capacity by employing prediction errors for shifting a block of pixels from one gray part to another. These works are devoted to improving the embedding capacity in the research area of the image distortion-based scheme, where a stego image is distorted to a level so that the cover contents are not sensible. This is another area of image steganography. Hence, in the area of quality preservation-based embedment processes, the application of the difference of an adjacent pixel (as is observed in [
6]) and the embedding rules of [
13,
21,
22,
23] will improve both the embedding rate, the stego-image quality, as well as the security. In this paper, the scheme of [
6,
13,
23] are modified by measuring the difference of each of the pixels from a reference pixel rather than from two adjacent pixels or block of pixels. This reference pixel will also improve the data security, as it is a private key. An encoder is used to encode these differences into two values only. The encoded differences are distributed only into two bins in the histogram of the encoded difference values. The embedding rules allow all the encoded difference values to accept a message bit. Thus, the quantity of embedded bits and the image quality are enhanced. Such a scheme will aid many applications running in devices like robots, personal digital assistance, and mobiles to embed massive data as well as manage the visual quality of a stego image. The security provided by that scheme will also make it effective for uses in such robotic applications/services.
The remaining paper contains four sections. The following first and foremost section is devoted to narrate the proposed work.
Section 3 and
Section 4 delineate the embedding efficiency and resistance against threats, respectively. Finally, concluding remarks are provided in
Section 5.
2. Proposed Scheme
Let the cover image and the secret message stream be
I and
S, respectively. Each secret message bit
s (i.e.,
s ε
S) is implanted into each different pixel of the image (e.g.,
s is implanted into the pixel
Ii,j, where (
i, j) indicates the location of the pixel in the image). The size of the image is
, where
h and
w are the height and width of the image, and these are divisible by
m and
n, respectively. Now divide the cover image into
/
blocks of size
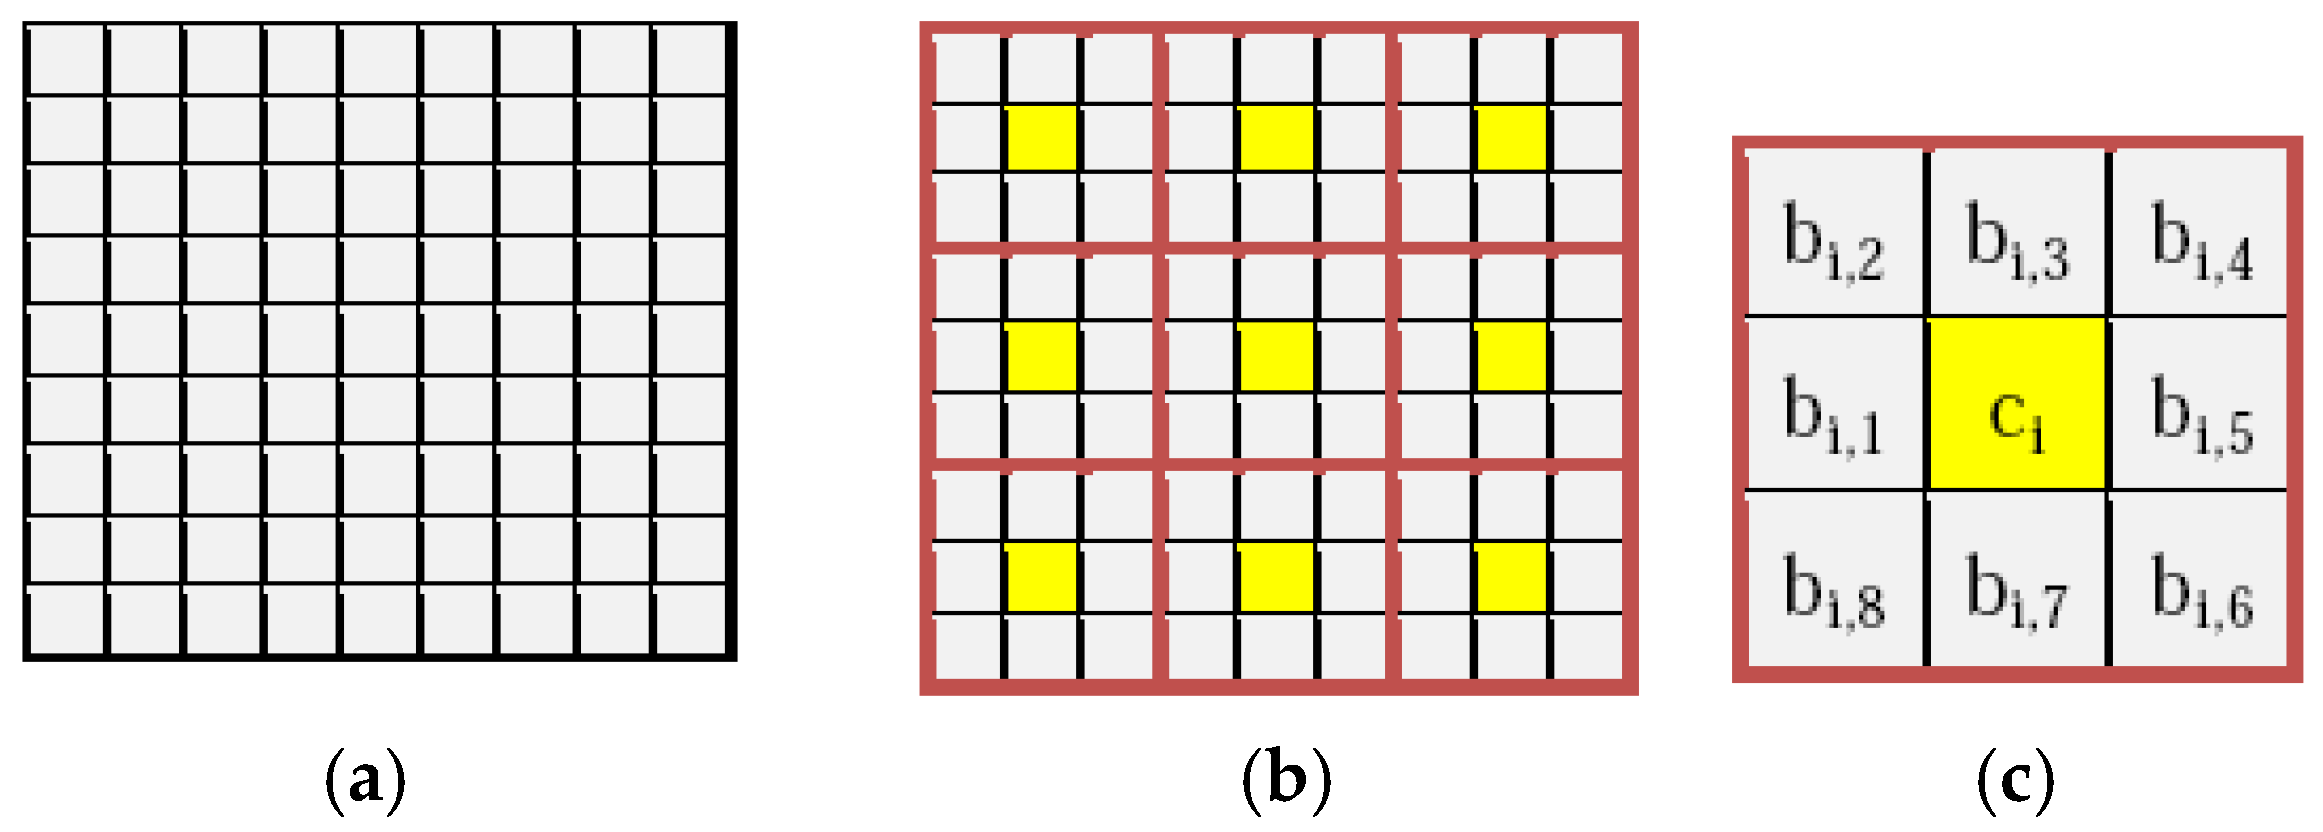
each as it is shown in the
Figure 1a,b.
The reference pixel can be of any value within the range from 0 to 255. This is either a negotiated value, a derived value, or a pixel value in the image (e.g., the center pixel of each block or the first pixel of the image). For convenience of better explaining the proposed scheme, let the center pixel
ci of each block
i be used as a reference value for the other pixels
bi,j in the block. These
bi,j values of each block are read along a spiral path, as shown in the
Figure 1c.
2.1. Measuring Distance from the Reference Pixel
Firstly, the distances
di,j—indeed, the differences of all the
jth pixels in the
ith block from the reference pixel
ci—are calculated by Equation (1).
The range of the values of di,j is from −255 to 255; di,j can then be categorized into two groups by based on whether it is less than 0 or not.
2.2. Calculating Encoded Errors and Encoded Values
The reference value distances
di,j are encoded into one of two values, say encoded errors
, by Equation (2).
Considering these encoded errors are similar to the prediction errors, we relate that process with the prediction error-based scheme. The concept of the predicted values is replaced here by the terminology of encoded values, where the encoded value
for each encoded error
is found by Equation (3).
These ei,j are then used as an embedding space.
2.3. Embedding Message Bits
First, the length of the message is measured, say this is
L. This
L is converted to 24-bit binary number. These 24 bits are embedded into the first three pixels of the cover image by replacing their values. Thereafter, the message bits are embedded into the encoded errors. During this data embedment process, the first three encoded errors of the first row of the error matrix are skipped so that this does not affect the values of the first three pixels, where the message length is embedded. Next, each message bit
s of the secret message stream
S is embedded into each of the remaining encoded errors in the error matrix
ei,j. The embedding procedure modifies the error matrix by Equation (4).
If the reference values are chosen from the image pixels, the list of these pixels are not changed during the data embedment. Consequently, their corresponding errors are skipped in Equation (4).
Due to the error modification, the cover pixels with values of 0 or 255 may exceed the gray scale in the stego image (e.g., −1 or 256). These events of exceeding the gray scale by the stego values are termed underflow and overflow, respectively. The overflow or underflow is handled by Equation (5).
Finally, the stego pixels
are calculated adding the modified errors
to the encoded values
in Equation (6).
The whole embedding process is explained in Example 1.
2.4. Minimizing Distortion
Equation (4) states that the XOR operation
is responsible for shifting the encoded error values by 1 or −1. To minimize the amount of shifting, the message bits are processed first. The whole message is divided into
t blocks
BKt of length
l each. All the
di,j values are converted to a single dimensional data array by Equation (7).
The number of pixels to be shifted, say
, among
l pixels are computed by Equation (8), checking all the bits
sk of
BKt, where
.
Here, returns two values and . The is a matrix that contains the results of XOR operation () for tth chunk and .
If it holds that , a complementation of message bits in BKt is taken, which, indeed, results in . Otherwise, set . Because is used in Equation (4) directly (e.g., the computation time is minimized. A binary data array is maintained to keep track of whether a complementation is done or not. This is concatenated to the end of the message. This portion is executed just after Equation (3) and before the start of the message-embedding part. The process is explained here, rather than above, so that it does not introduce any ambiguity in realizing our proposed scheme.
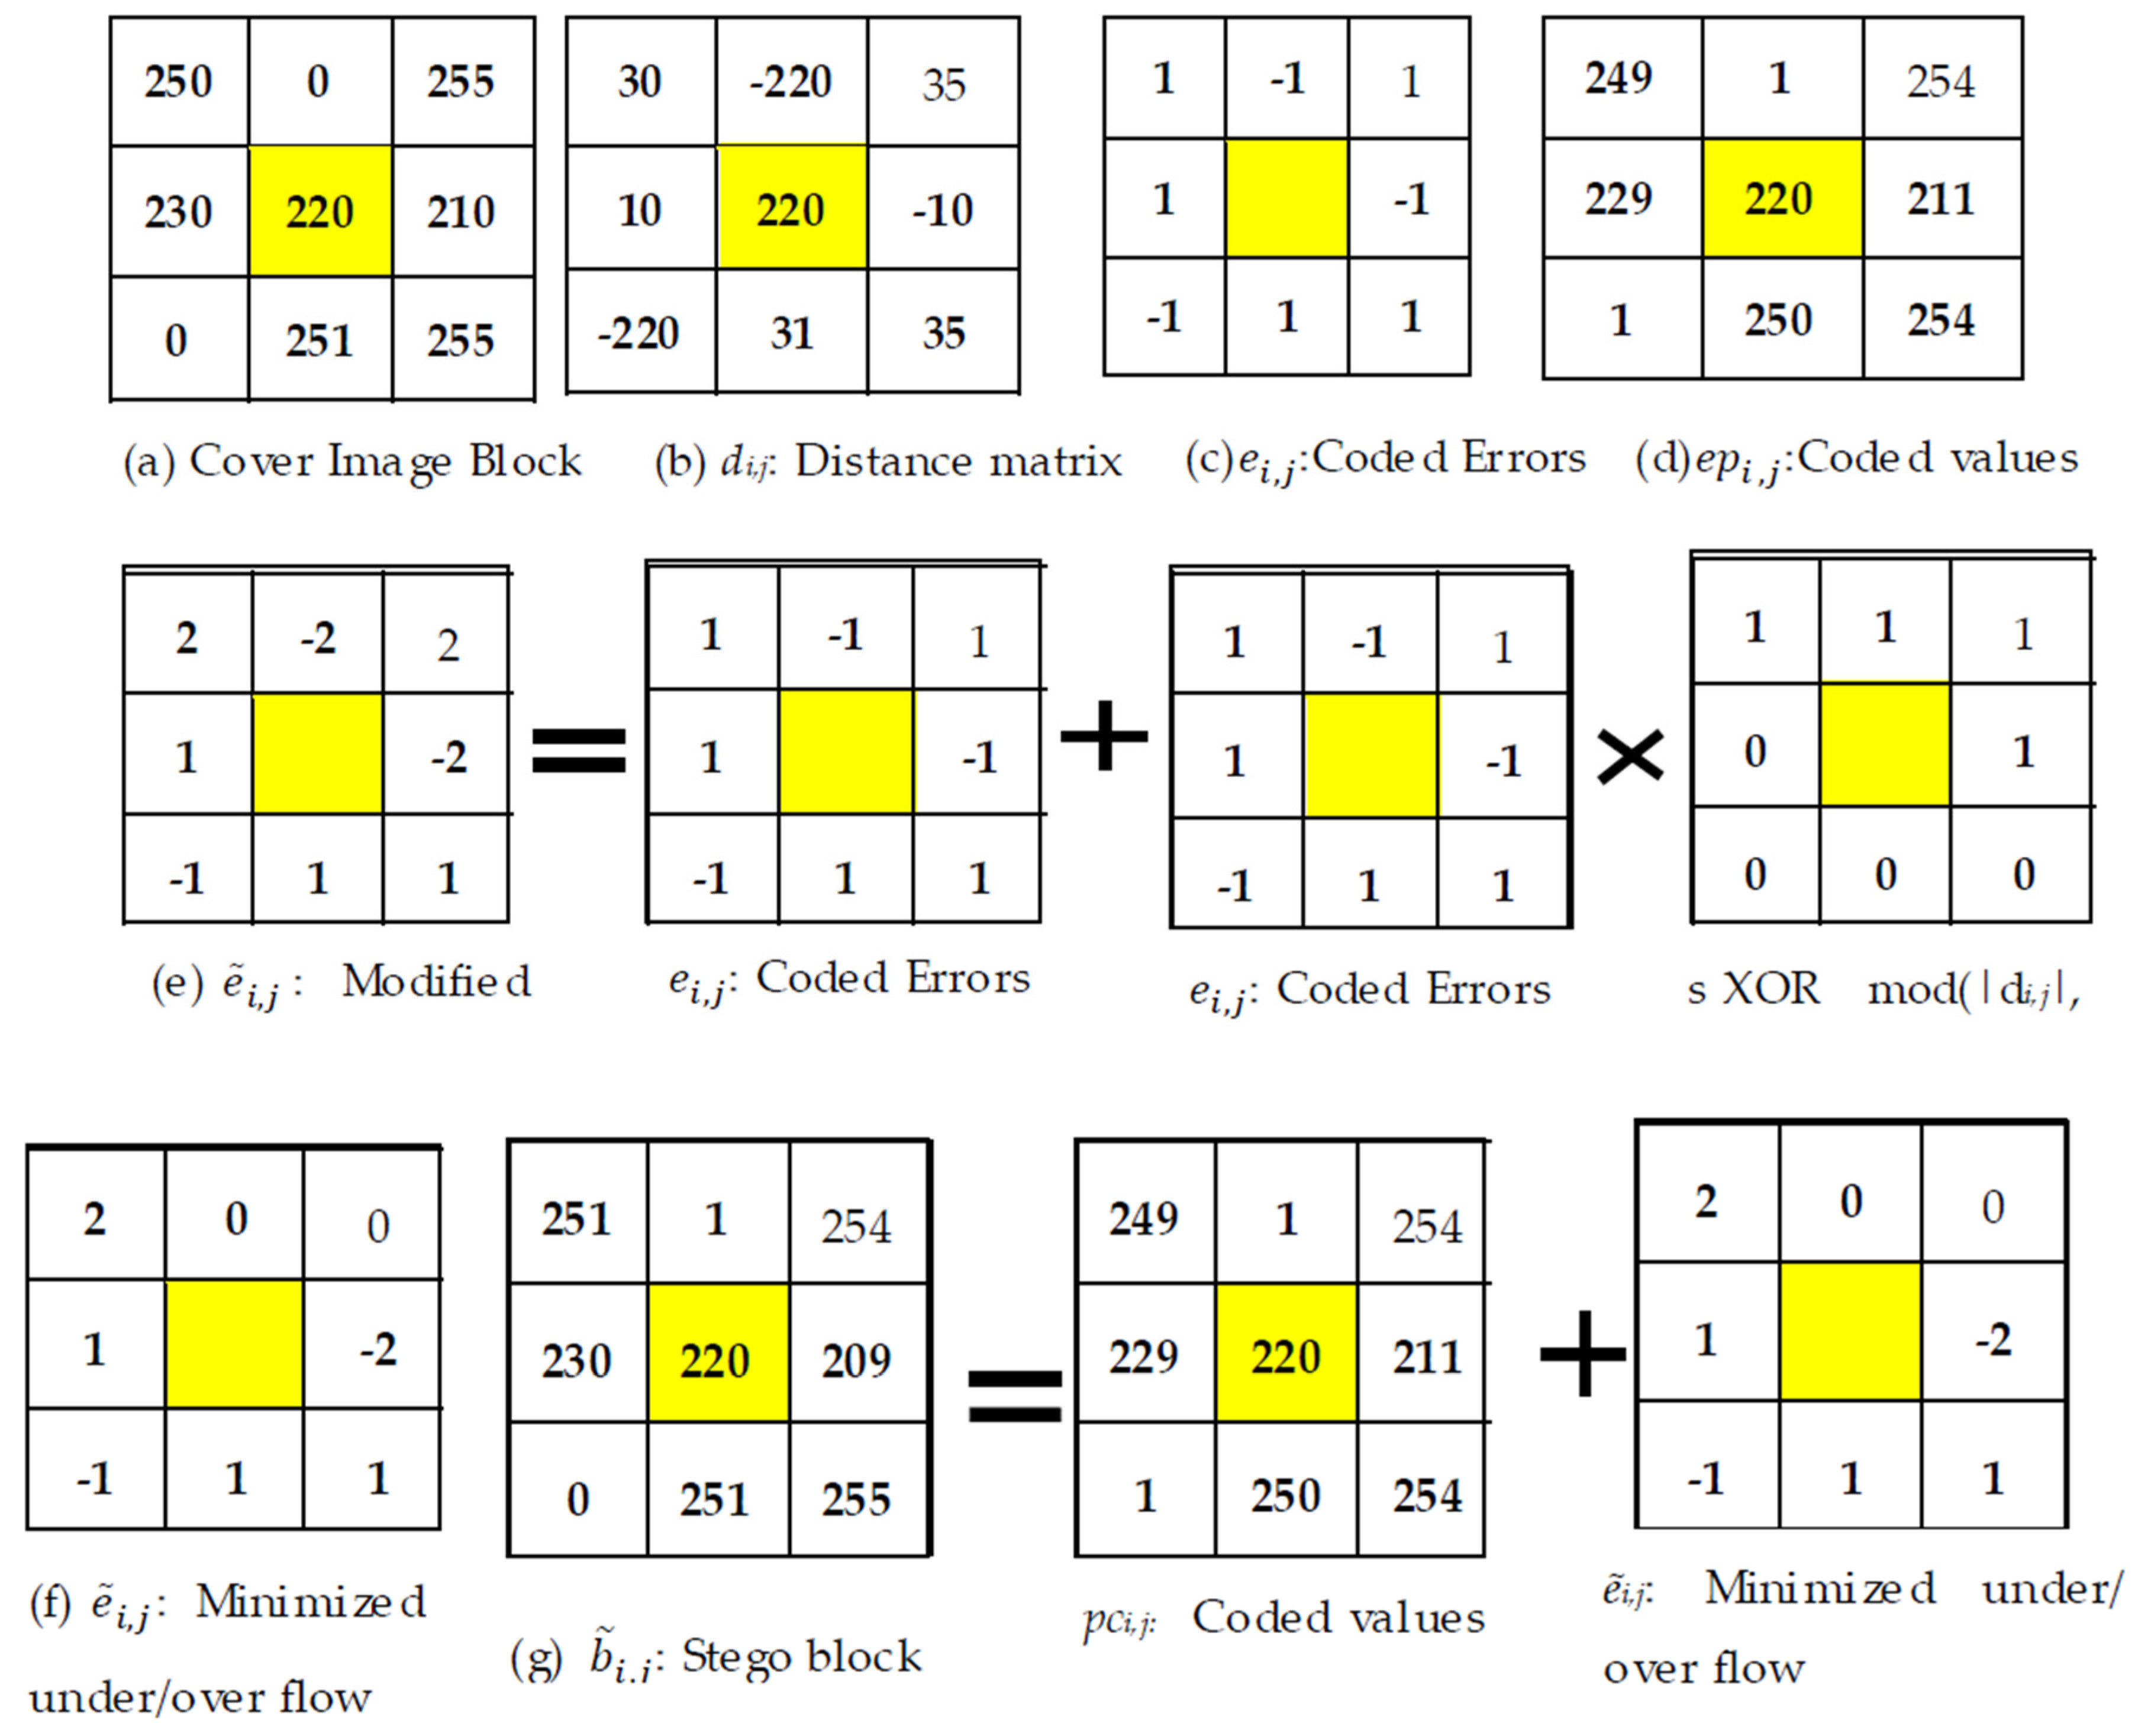
Example 1. Consider the following image block of size 3 × 3 in Figure 2a and the value of the center pixel, which is 220 in this example, as a reference value. Equations (1)–(3) result in Figure 2b–d, respectively. Let the to-be-embedded message stream be 01101110, (i.e., S = 01101110). The outcome of Equation (4) is depicted in Figure 2e. Again, to remove the problem of underflow and overflow, Equation (5) is applied on the modified errors in Figure 2e, and the result is tabulated in Figure 2f. Finally, the stego block is generated by applying Equation (6). The stego block is presented in Figure 2g. 2.5. Message Extraction at the Receiver
The message extractor (i.e., the decoder) divides the stego image into
/
blocks of size
each. The reference values are unchanged at the embedding phase by the data hider. The absolute distance between each stego pixel
and its reference value
ci is calculated by Equation (9).
Lastly, the secret message bit
sj is extracted from that distance matrix by Equation (10).
The scenario of message extraction is demonstrated in Example 2.
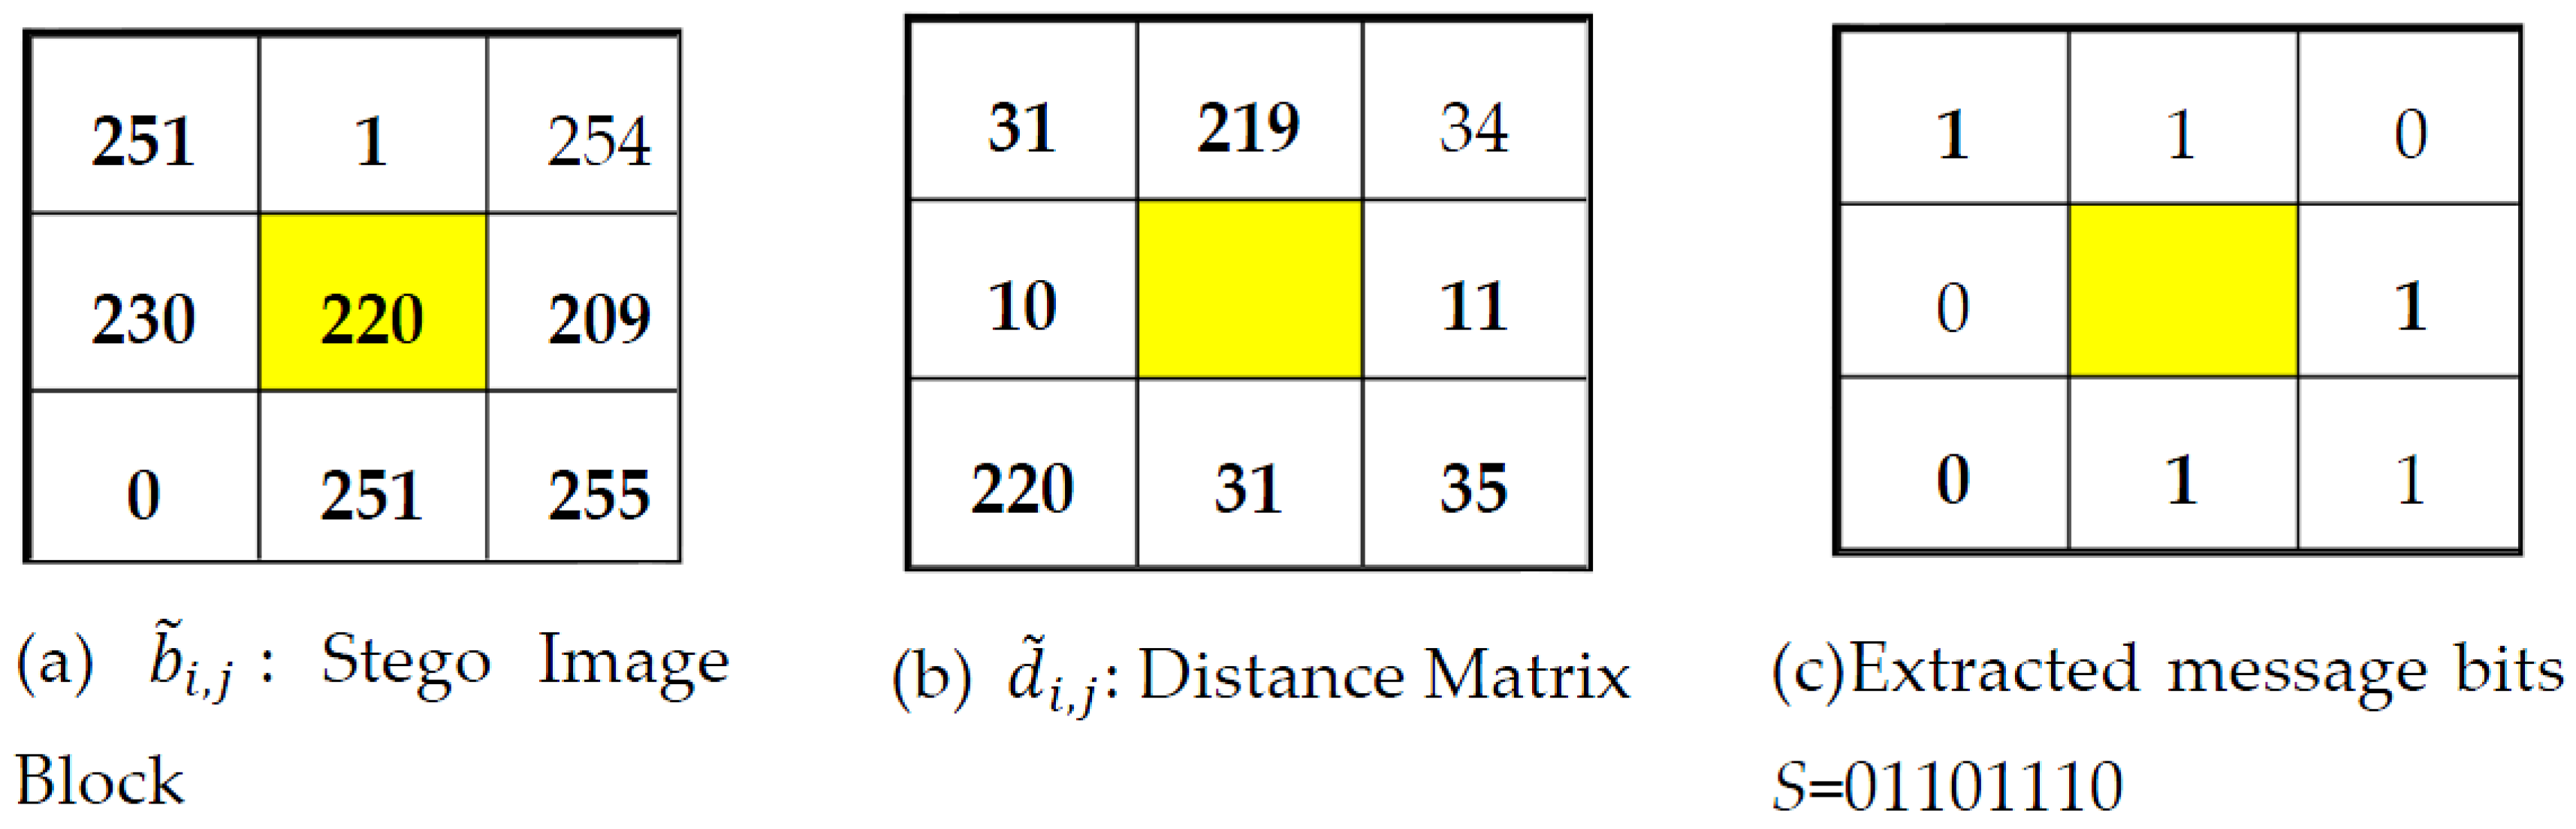
Example 2. The distance matrix of Figure 3b and extracted message bits of Figure 3c are found by applying, respectively, Equations (9) and (10) in Figure 3a. 3. Performance Analysis in Terms of Embedding Efficiency
In the field of steganography, three performance parameters are used in measuring the embedding efficiency. These are payload or capacity, visual quality, and processing complexity. The visual quality is commonly assessed either by mean square error (MSE) or peak signal-to-noise ratio (PSNR). The embedding capacity, MSE, and PSNR of an image of size
are computed by Equations (11)–(13), respectively.
where
I and
are the cover and the stego image, respectively. Again, when the length of the secret message is too short, only a portion of the image is accessed to conceal the message bit. In that case, Equations (11)–(13) will not provide the pure value, as all the
pixels do not participate in conceiving message bits. Hence, to find the pure capacity and the pure MSE, the value of
m and
n are replaced by
x and
y in Equations (11) and (12), where
x and
y are the total number of accessed rows and columns, respectively. In very usual case,
y is
n.
The processing complexity is another important parameter that bestows a comparison of processing speed in terms of time between the related algorithms. However, the measurement of execution times, t, of an algorithm by a processor may not depict the correct figure of time complexity, as t also depends on the uses and controlling mechanisms of instructions and loops in the programming code. Therefore, the same processor can spend more time executing a programming code of an algorithm over the other implementations if the algorithm is not written with optimum code and right placement of instructions. For this reason, the number of arithmetic and logical operators listed in the algorithms and their execution frequencies are compared as the performance of the schemes regarding the time complexity. The execution time for each arithmetic and logical operator (e.g., =, >>, <<, +, −, /, *, , mod, ceil, floor) is assumed to be one clock cycle. The number of arithmetic and logical operators listed in the algorithms and their execution frequencies are tabulated in Table 4 and discussed later on.
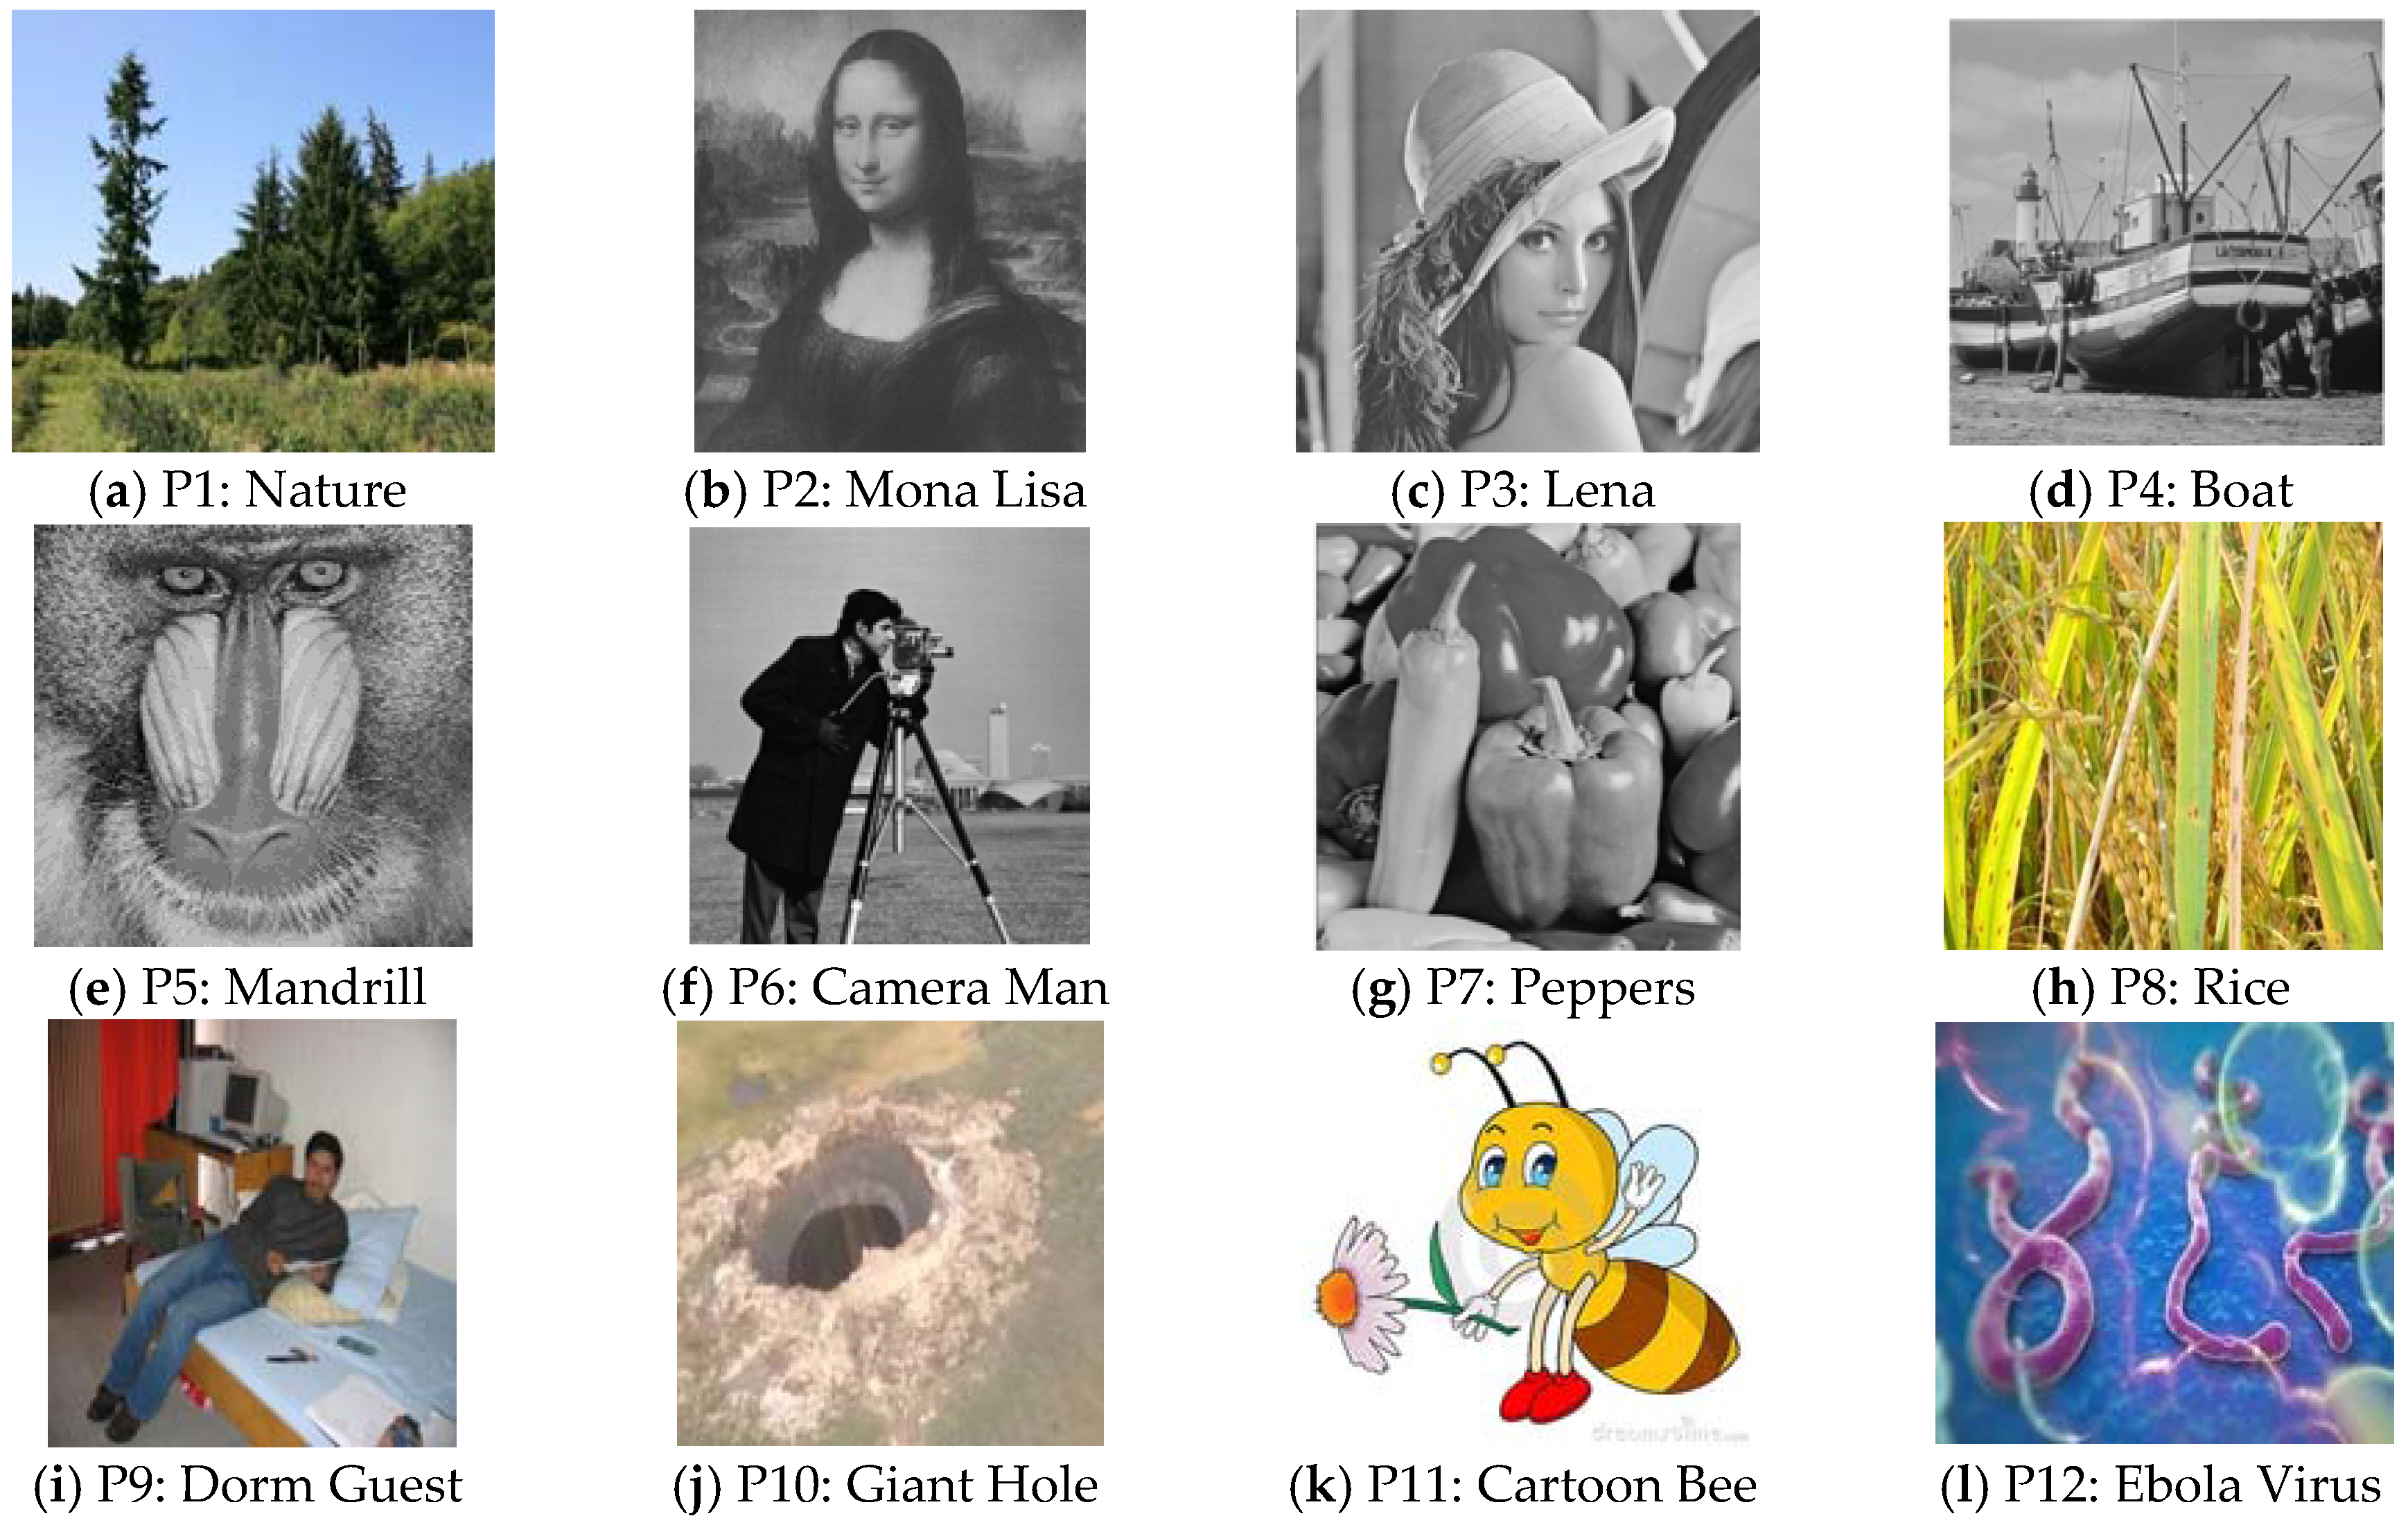
To test the stated issues related to the embedding efficiency, a good number of experiments were done in MATLAB using BOSS image data set of 500 images and 200 collected standard images. These standard images were downloaded from several research sites. Among these experimented images, Nature, Mona Lisa, Lena, Boat, Mandrill, Camera Man, Peppers, Rice, Dorm Guest, Giant Hole, Cartoon Bee, and Ebola Virus are depicted in
Figure 4. In all the experimented images, our proposal dominates Chao et al.’s DE scheme, Hong and Chen’s adaptive pixel-pair matching (APPM) DE scheme, W. Hong et al.’s multiple base DE scheme, W. Hong et al.’s prediction error (PE), Kamal and Islam’s Euclidean distance-based scheme (Euclidean), and Liao et al.’s LSB replacement-based scheme [
9] in all the three performance parameters. In this article, only the results of DE, APPM, Euclidean, and LSB replacement schemes are compared with the proposed one.
3.1. Capacity Analysis
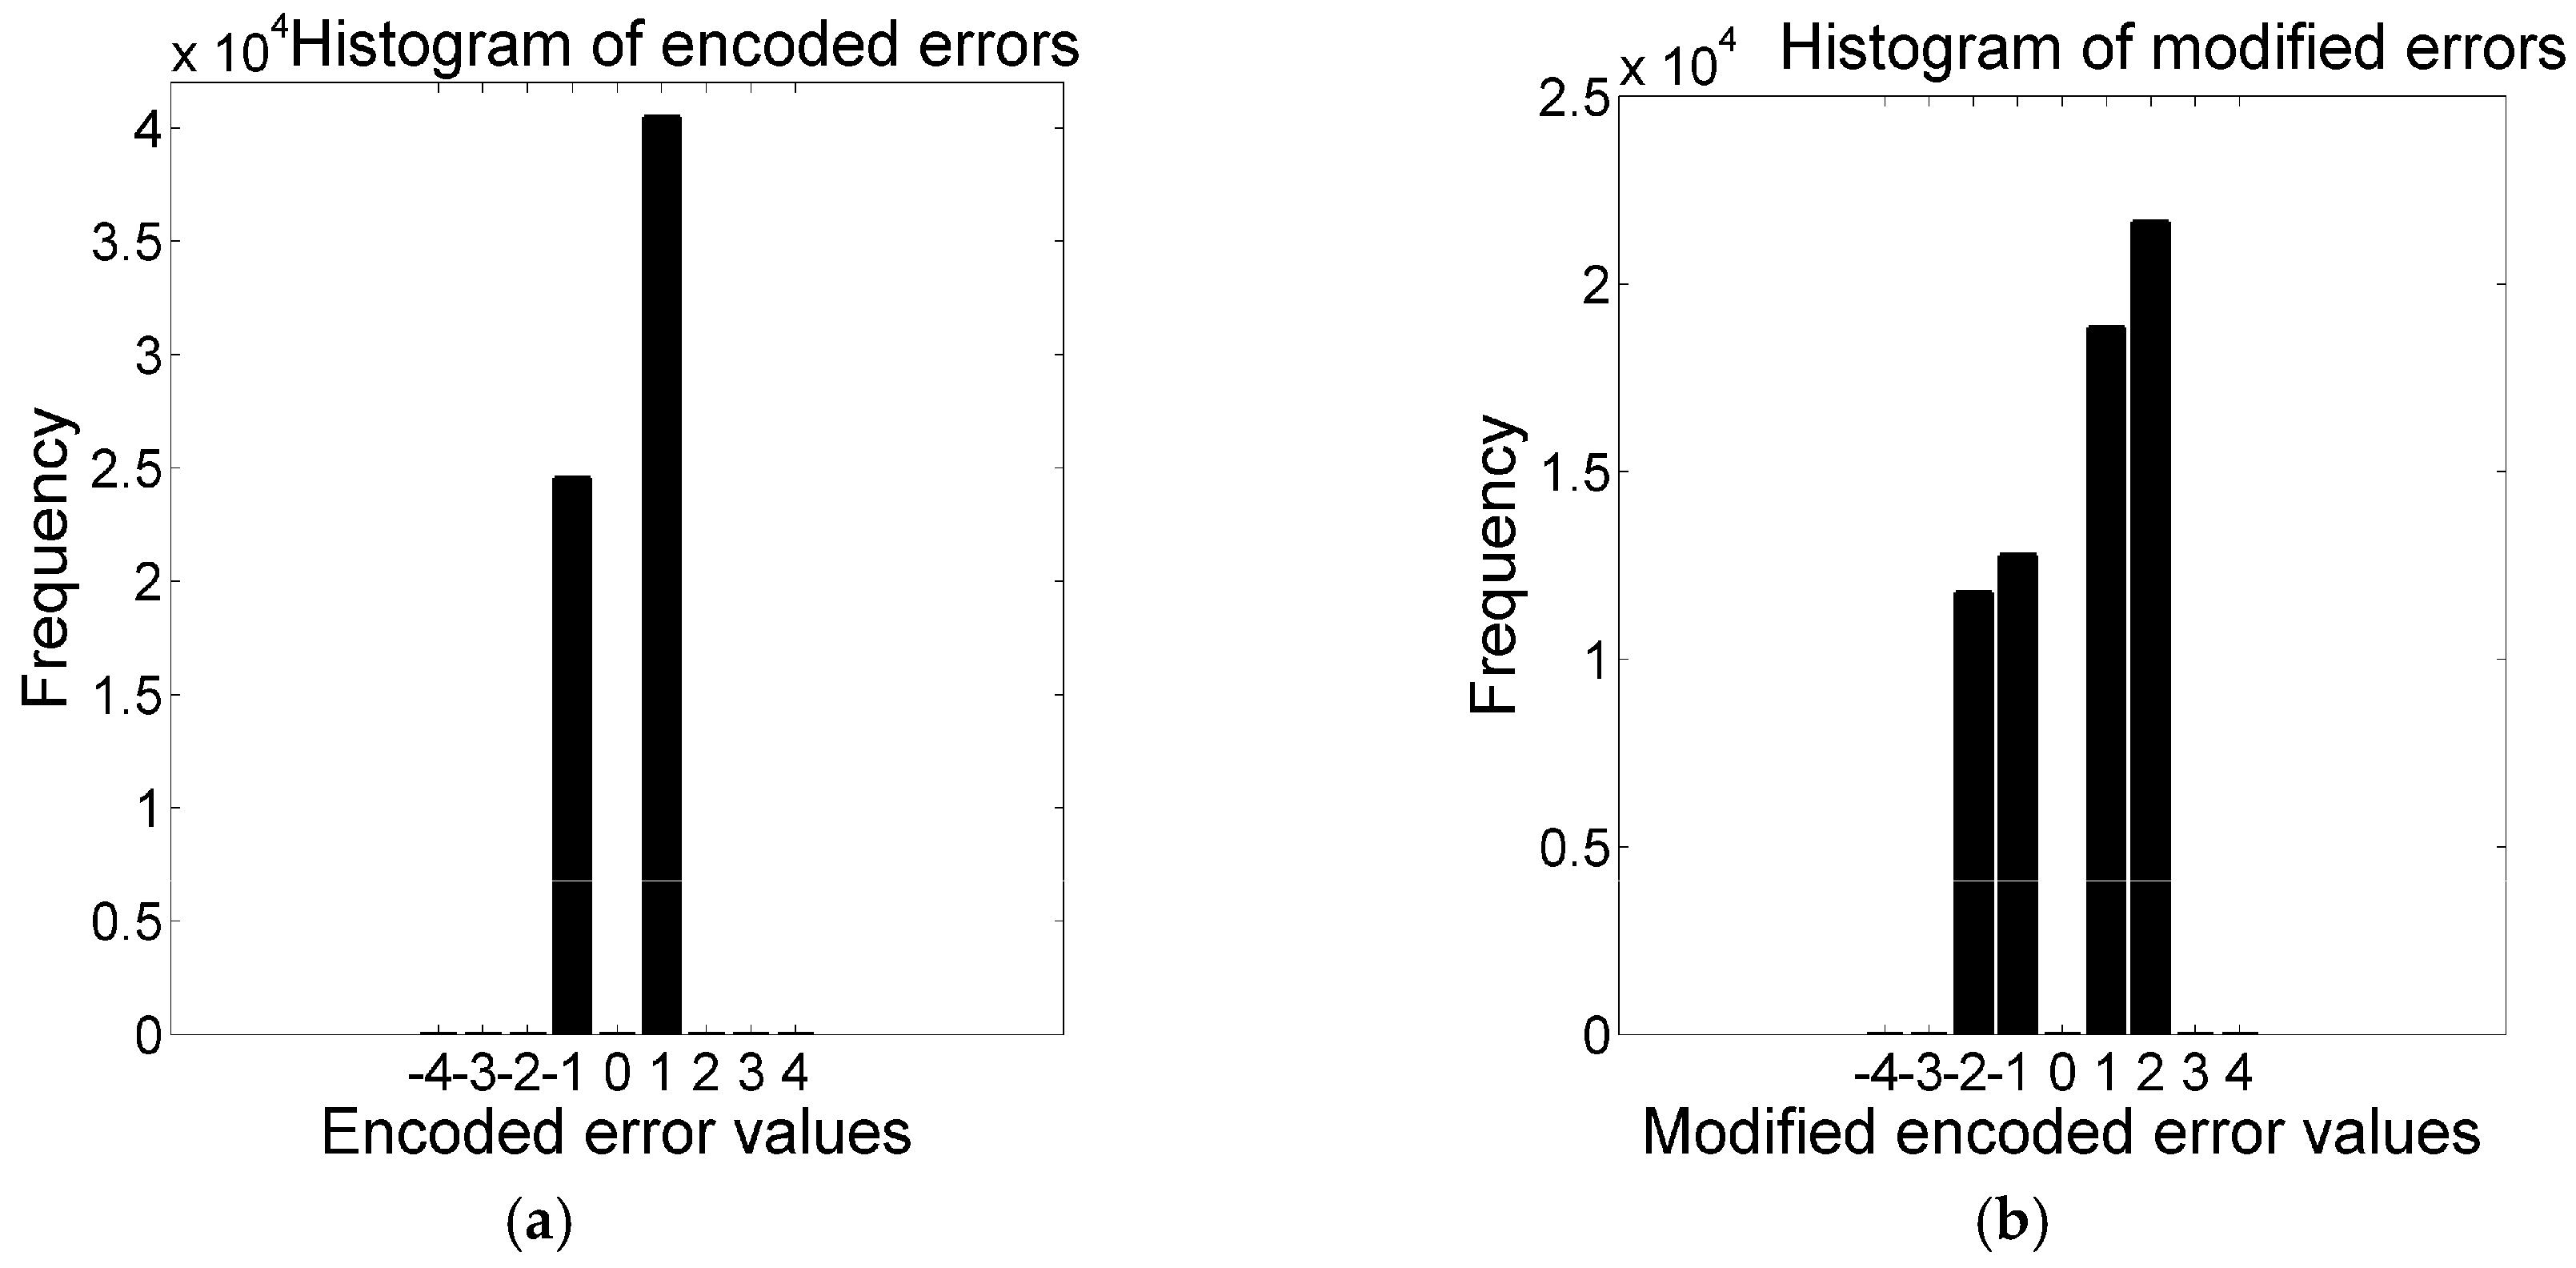
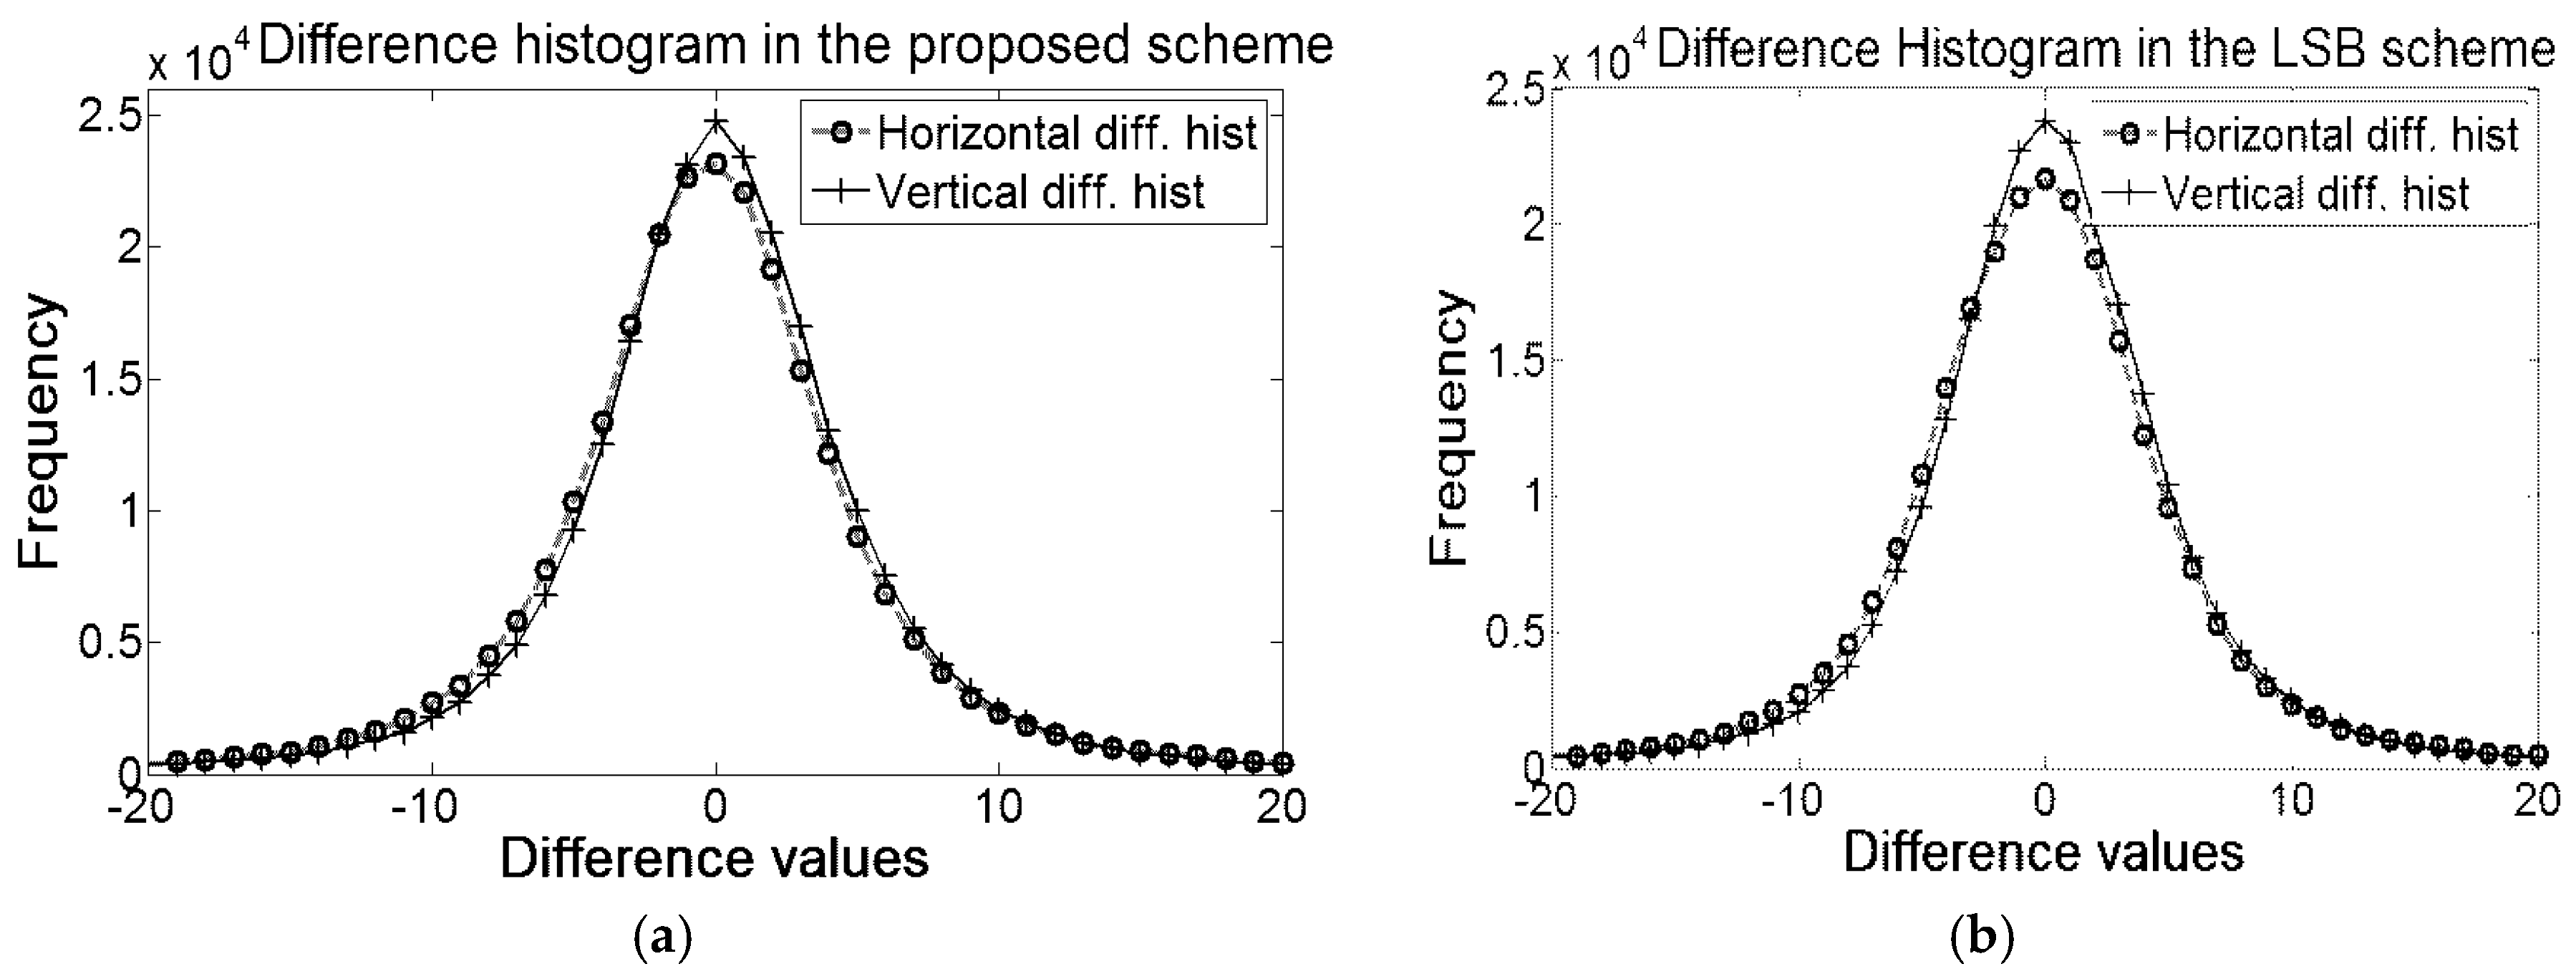
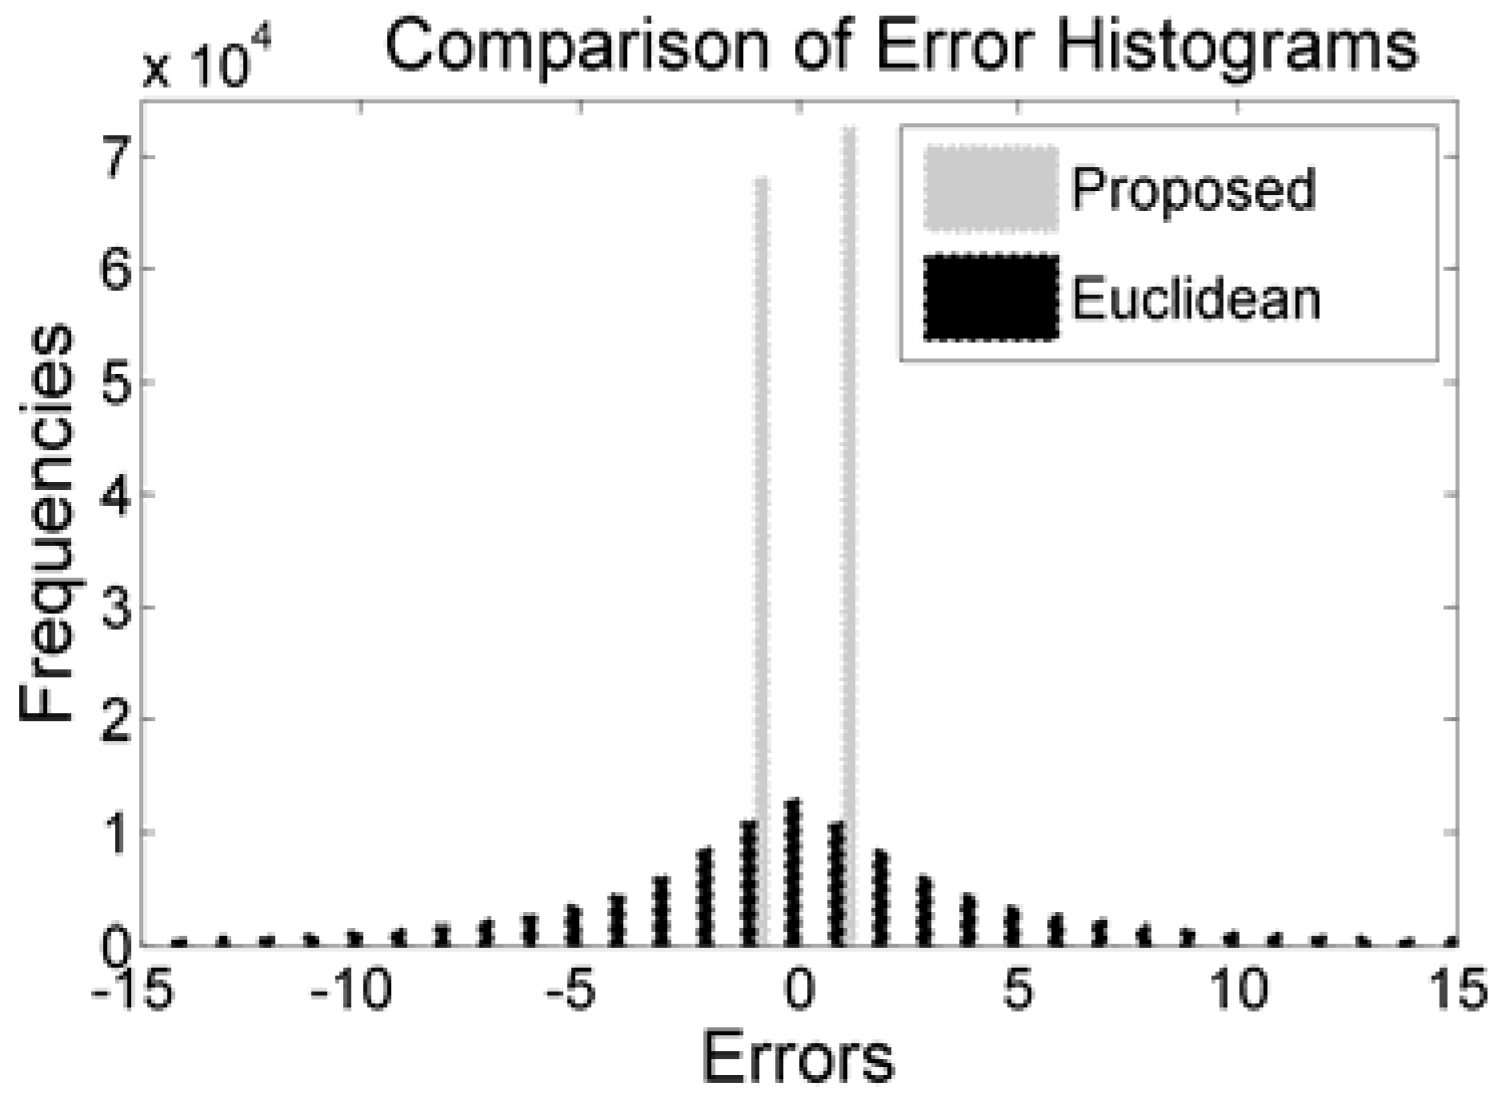
By encoding all the differences into two encoded errors, the scheme has obliged all the pixels (other than the reference values and first three pixels) to accept message bit. That strategy has notably boosted the embedding capacity. The comparisons of histograms of the proposed method with Euclidean are depicted in
Figure 5. The figure clearly depicts that the values of all the encoded errors are either −1 or 1. The distributions of encoded errors into −1 and 1 allow the proposed embedding rules to implant 1 bit into each of the pixels.
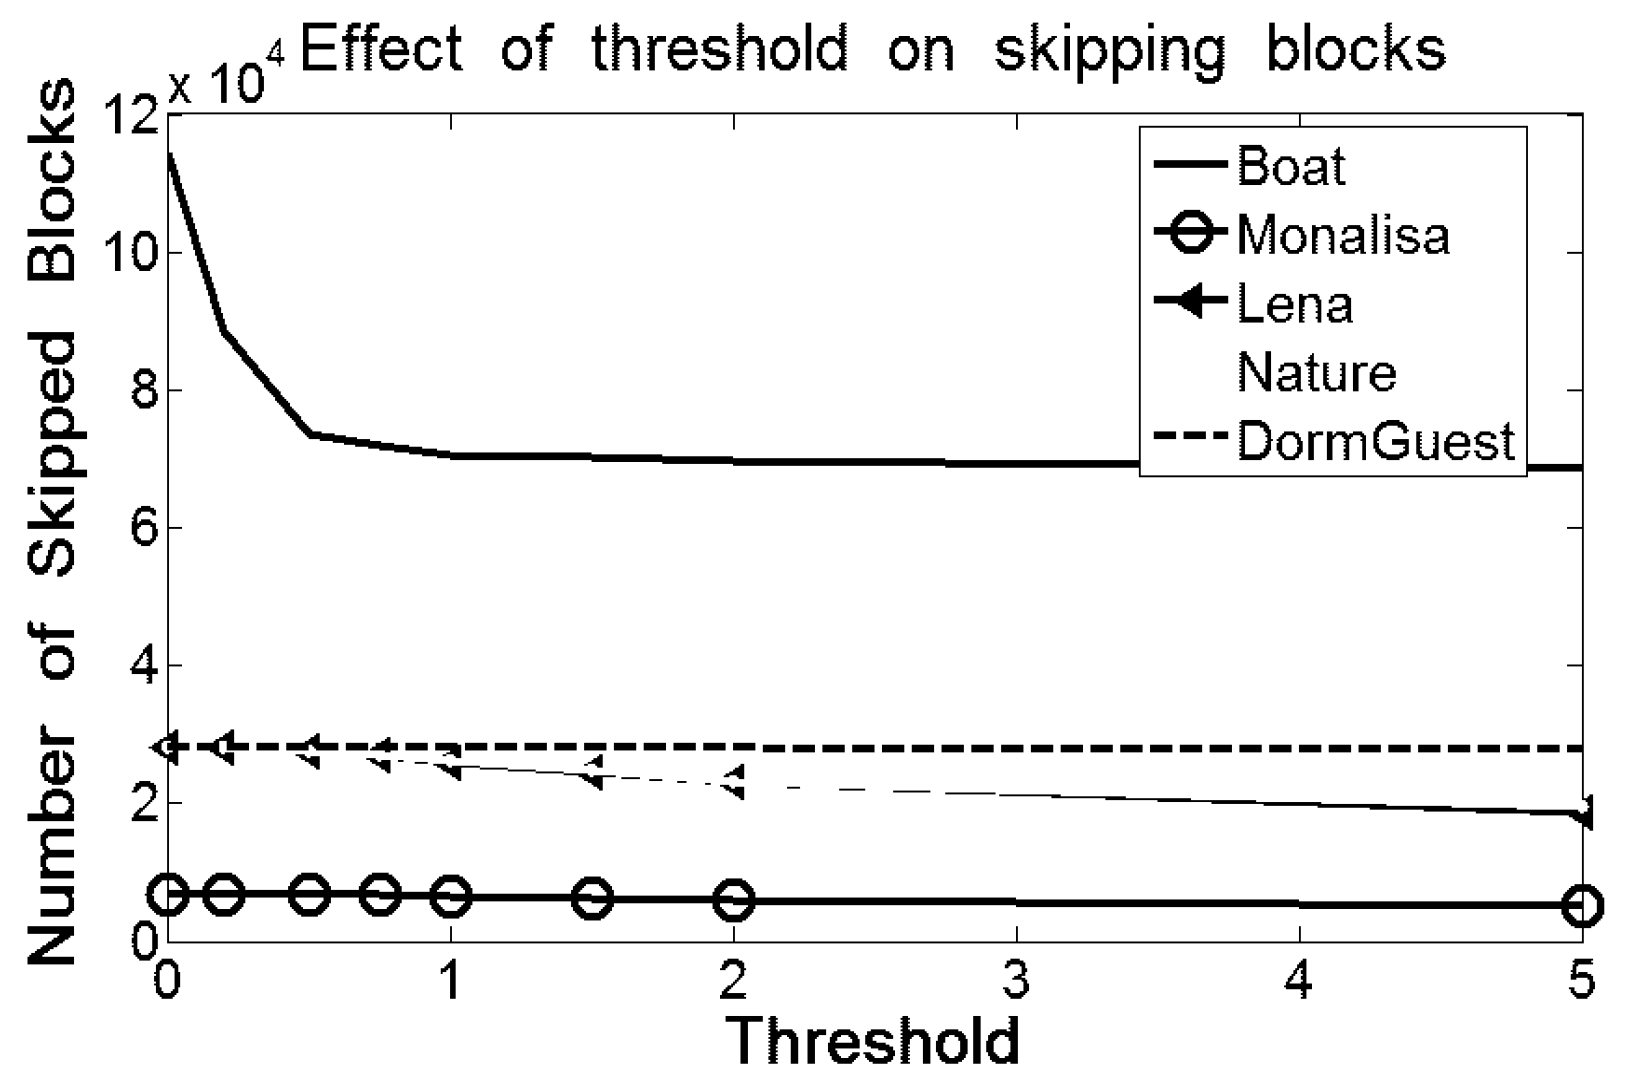
Summation of these two peaks of the proposed scheme is greater than the summation of the frequencies of all the bins in the errors histogram of Euclidean because the Euclidean scheme skips many blocks which are less likely for embedding. The skipping of blocks in both Hong et al.’s and Kamal and Islam’s scheme are governed by a threshold parameter to protect image distortions. The effect of threshold is also depicted in
Figure 6. The skipping of blocks decreases as the value of the threshold becomes higher; however, the larger threshold increases the probability of the image distortions which, indeed, demolishes the prime objective of the schemes and, hence, the capacity cannot be improved.
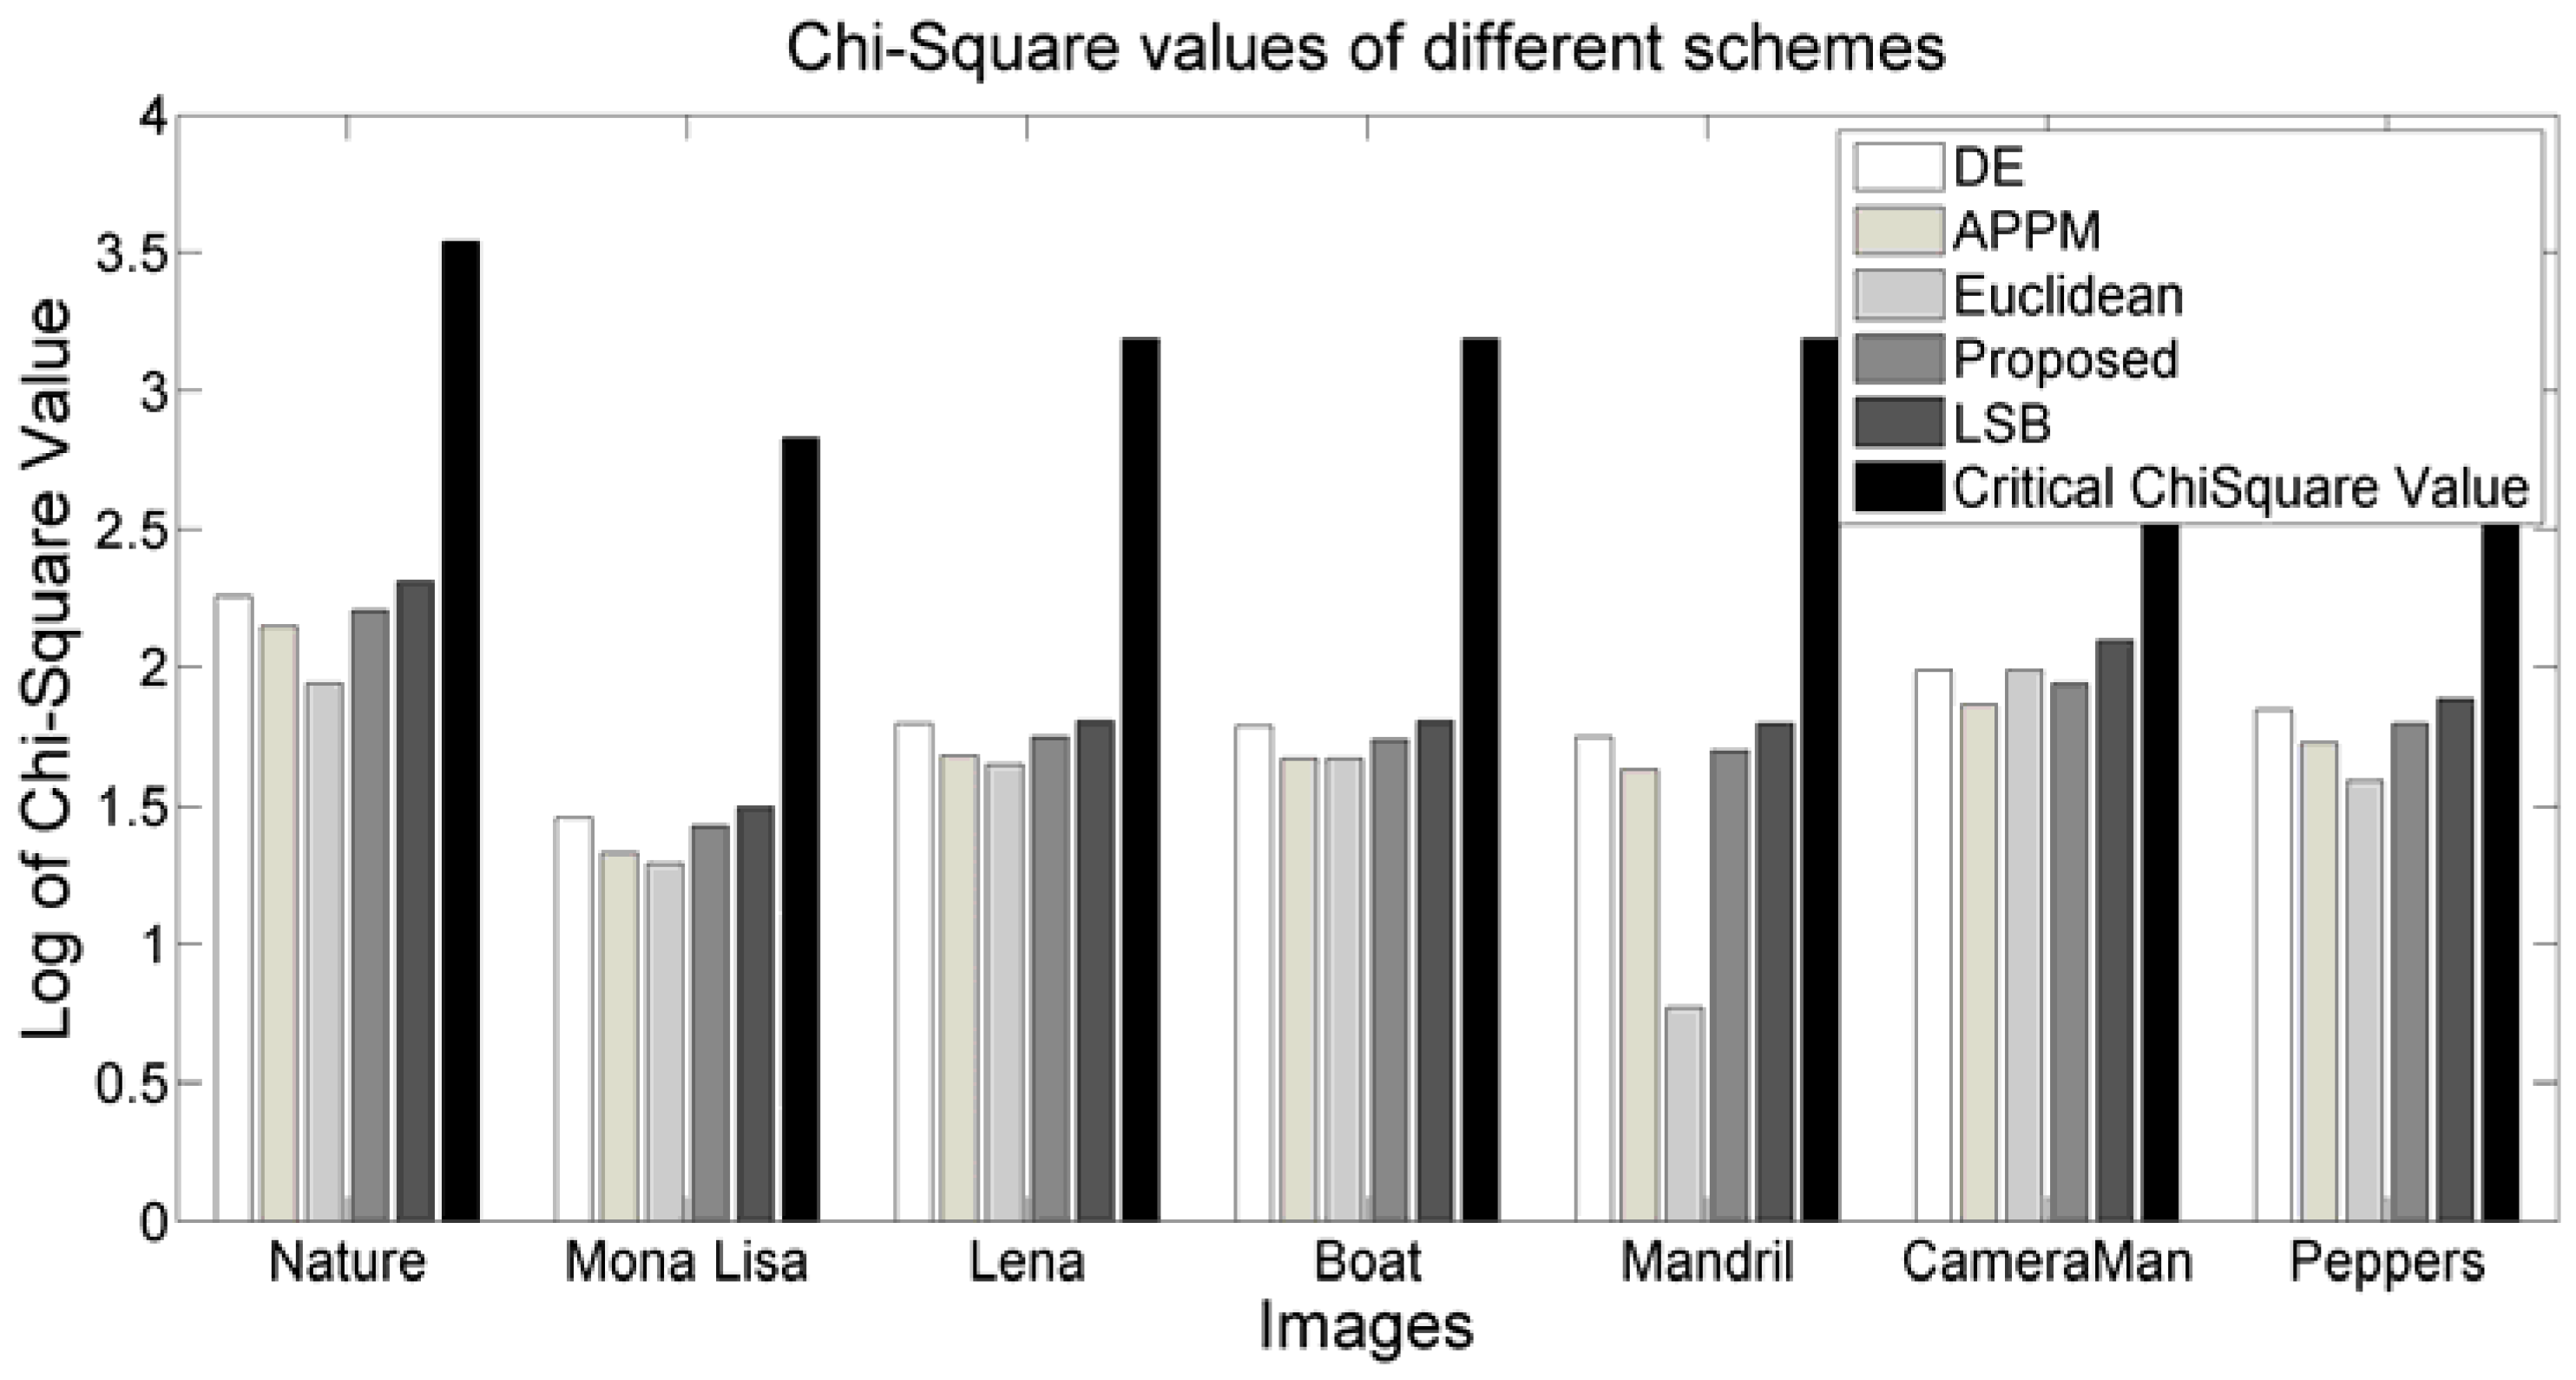
Again, DE schemes reduce the scope of embedding by making pixel groups and allowing the embedding procedure to embed only one bit per group. Although the LSB replacement-based scheme supports modification of multiple LSBs, in our experiment, we restricted that scheme to modify only a single LSB for the sake of comparison with our scheme. Besides, replacement of multiple bits will obviously destroy the image quality, noticeably. On the contrary, the proposed scheme allows all the pixels to conceive message bits. In the proposed scheme, the errors are shifted to the right by 1 when “1”s are embedded into the error 1, and to the left by 1 when “1”s are implanted into −1. That strategy has led our scheme to present dominating results in terms of capacity over the others by obliging all pixels equally to accept message bits.
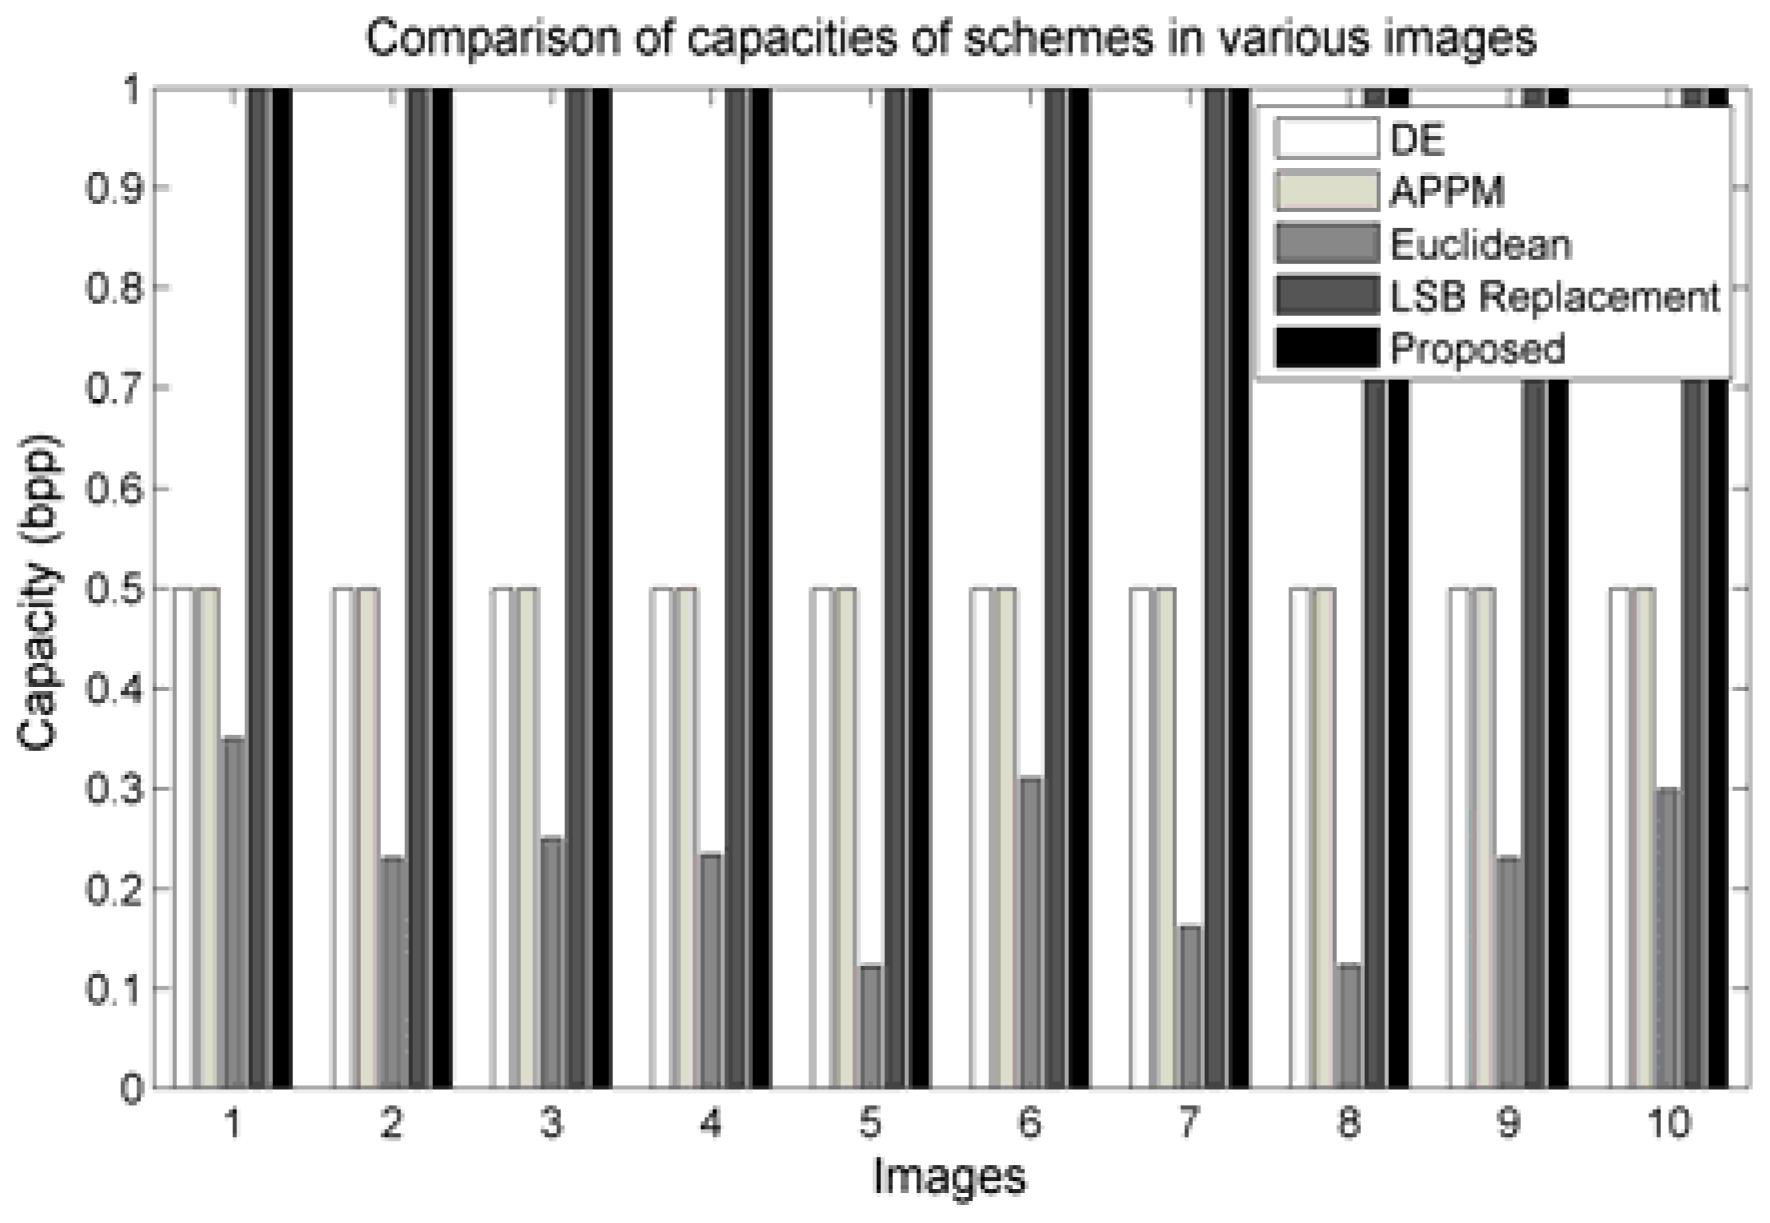
Figure 7 demonstrates some of the results. The embedding capacity of DE, APPM, Euclidean, LSB replacement, and proposed scheme are depicted as groups for each image. Our proposed scheme and the LSB replacement scheme achieve the capacity of 1 bit per pixel (bpp), while the others provide no more than 0.5 bpp. Therefore, to meet the higher embedding capacity, the proposed algorithm and the LSB replacement scheme would serve the objective. Nevertheless, the LSB replacement schemes are more vulnerable to statistical attacks, as demonstrated in
Section 4.
3.2. Visual Quality Analysis
According to the embedding rules, only the modified pixels can be changed by 1 because the encoded errors are shifted by 1 at most, as shown in the
Figure 8. Now, say the probability of changing the value of a pixel by 1 is
p and thus the probability of not changing is (1 −
p). The total number of pixels that changed by 1 after the data embedment is
. As all the pixels accept message bits and these are changed by 1 at most, it can be said that
Therefore, Equation (12) is rewritten by:
The cover pixels are equally probable for changing their values in the stego pixels. Hence, the theoretical value of MSE is 0.5. The adopted minimizing distortion strategy presents much smaller value of MSE than 0.5.
The experimental values of visual quality are measured to check the actual distortion rate. The experimental results in
Table 1 demonstrate that although the embedding capacity of the proposed algorithm is more than twice of all the others regarding the distortion parameters, the tabulation of competing results, because the application of Equation (8), assists the encoder in generating better stego-image quality. However, this proposed scheme provides better image quality than the LSB replacement scheme, as shown in the
Table 1,
Table 2 and
Table 3, only for the use of Equation (8). Our scheme provides better image quality than the diamond-encoding scheme for all images, and even better than the Euclidean-based scheme and APPM scheme for some images. Frequencies of dominations for PSNR values are mostly observed by the APPM scheme because it reduces shifting quantity by using multiple bases with its diamond-encoding procedures. However, the amount of degradation in the proposed scheme, if it happens, is very small and even negligible compared to the others, though the proposed scheme conceives message bits more than twice the quantity of the other methods.
The number of bits that can be embedded into an image (i.e., payload) varies from scheme to scheme. Due to the variation in the payload, the MSE as well as the PSNR also differ from scheme to scheme. The matter of boosting up the payload to some multiples can be tolerated if the amount of the image degradation is not changed multiplicatively and can be appreciated if it is not noticeable and realizable by any steganalyzer. However, payload directly affects the MSE [
26]. With the increment of payload, MSE will show additive results. Again, for a much smaller payload, distortion will be limited to a smaller region of the image (where embedding is done), whereas the MSE by Equation (12) will be computed for the entire image.
Therefore, to have an exact idea of image degradation per tempered pixel, the MSE is generalized in Equation (15).
Here, the proposed algorithm shows incredible improvement. The gain figures yielded by our scheme in
Table 2 demonstrate outstanding performance. Each row represents the results of individual image. The gains in
Table 1,
Table 2 and
Table 3 are computed by the following relation (16).
where
X = MSE or PSNR of the proposed algorithm and
Y = MSE or PSNR of the other schemes.
The improvements in PSNR gains (GenPSNR) are summarized in the
Table 3. These are also very much alike. There, each row represents the result of an individual image.
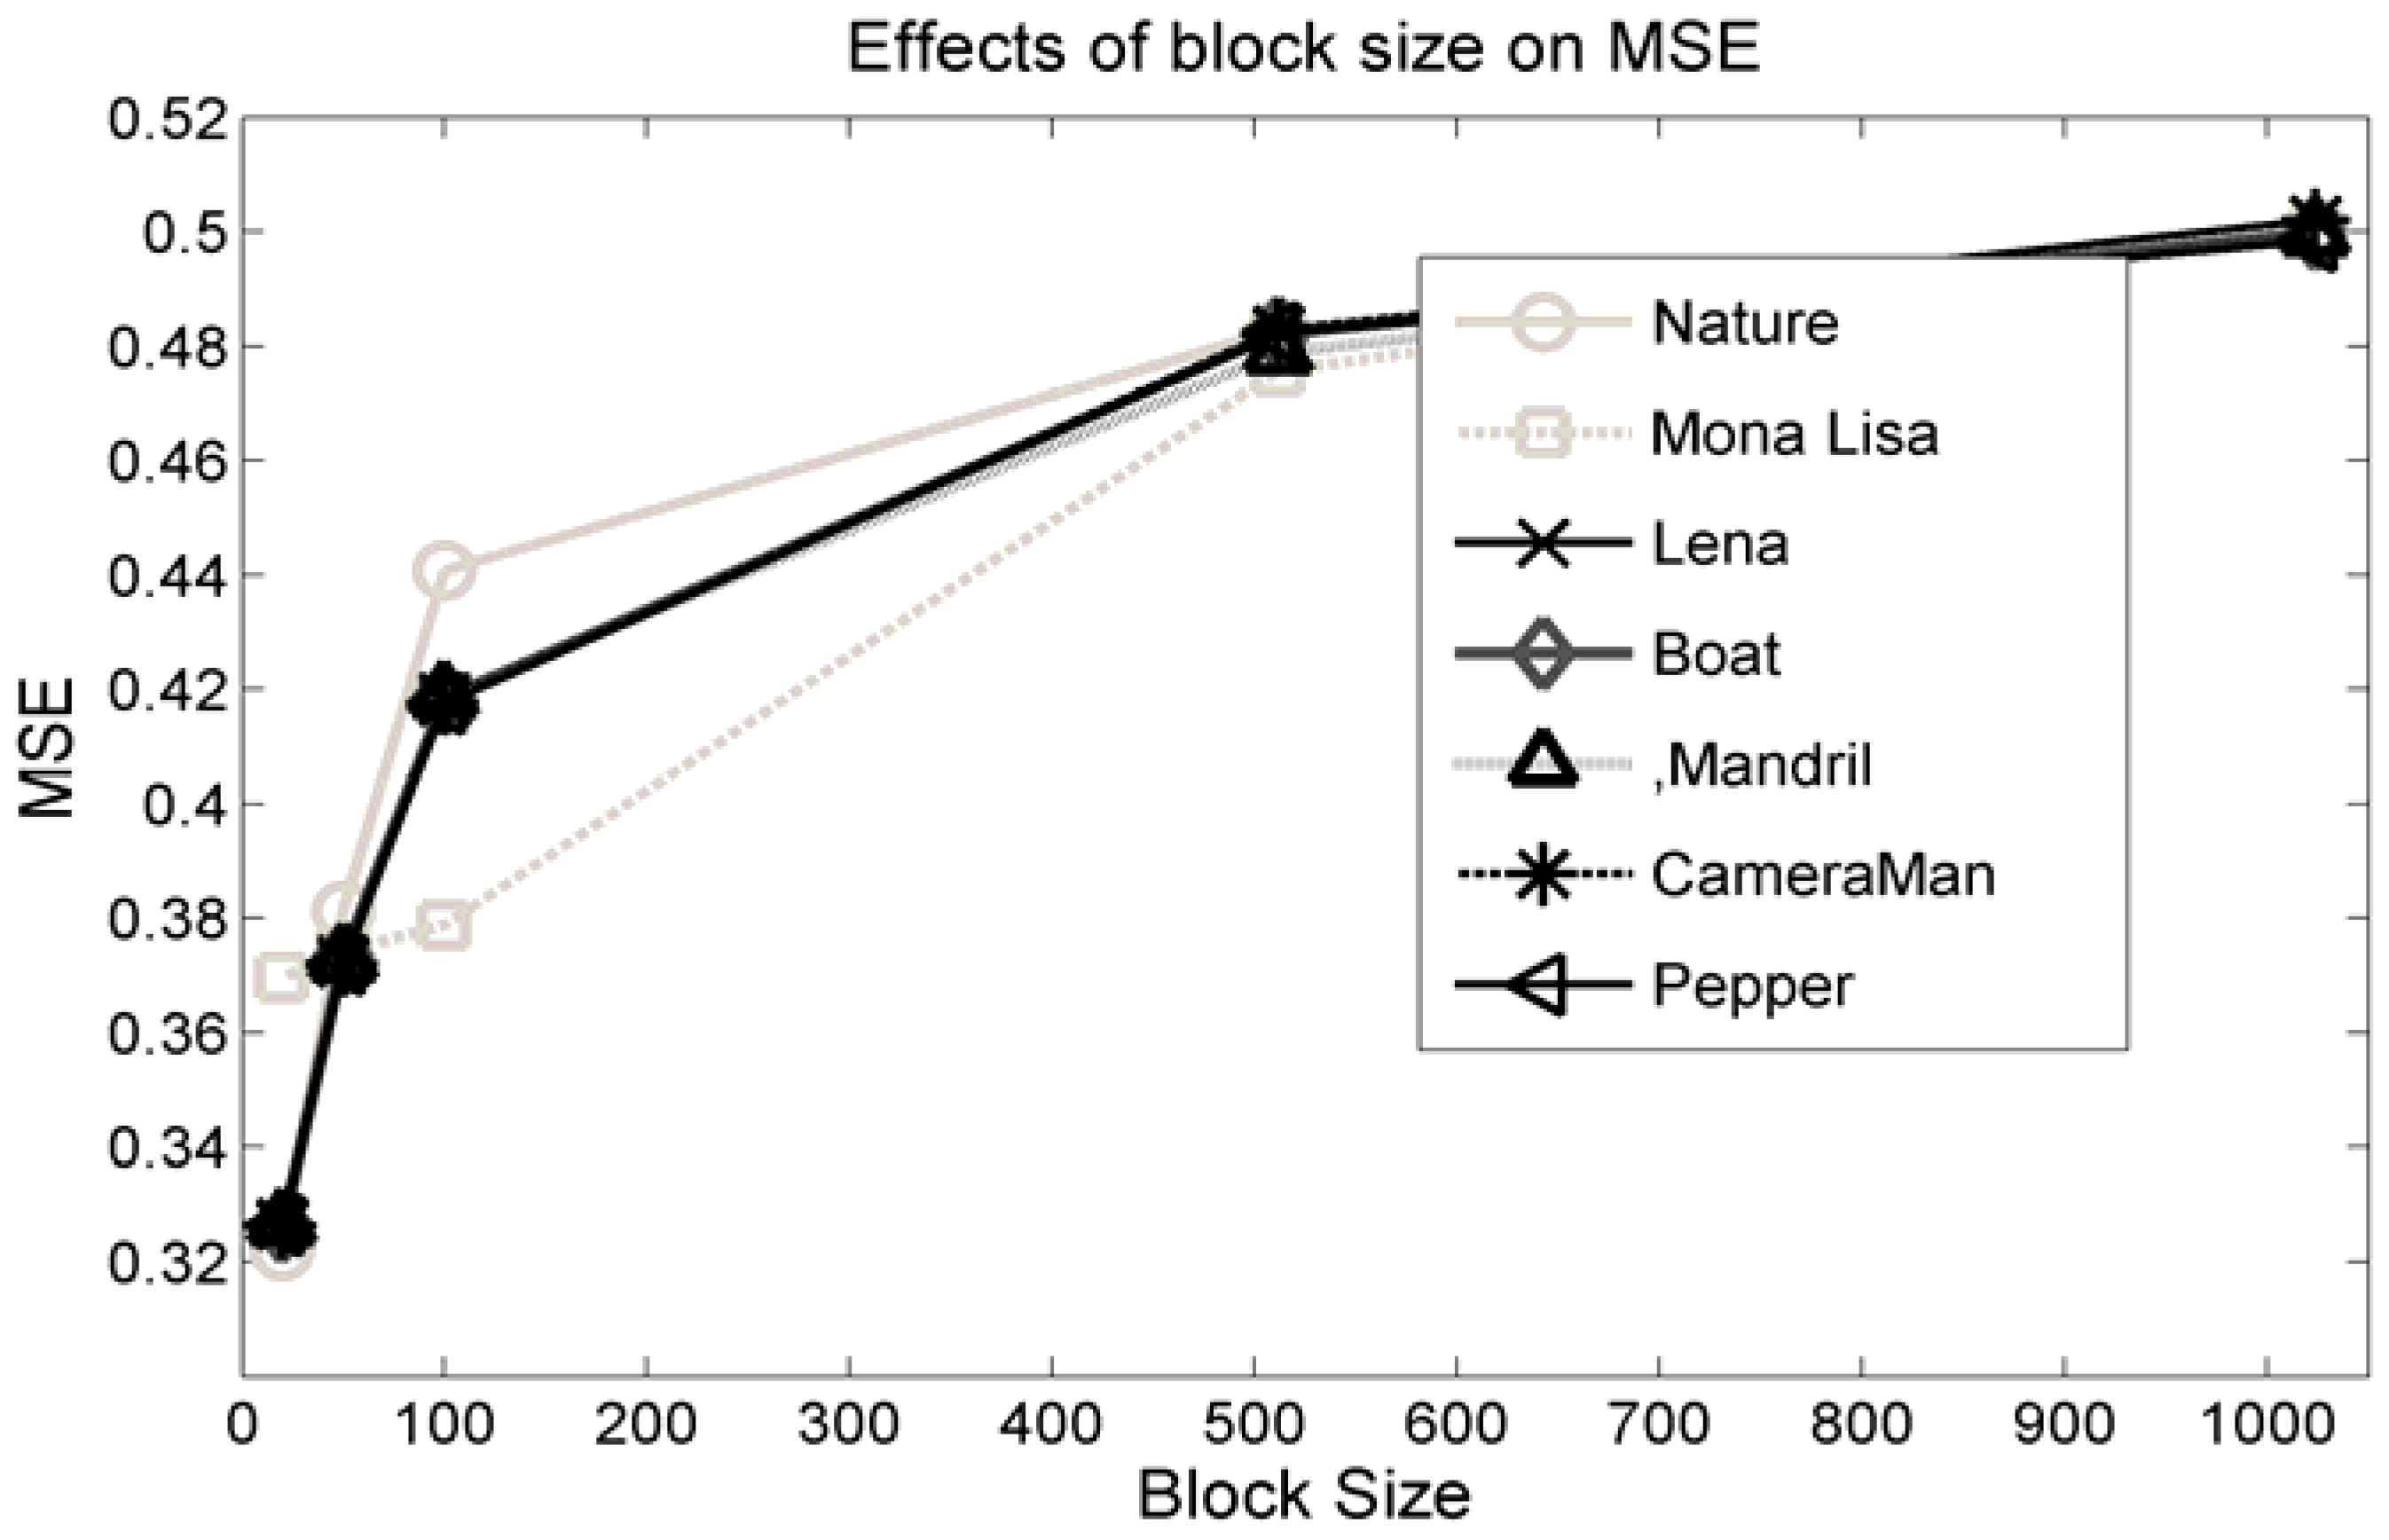
Another important parameter is the size of message chunk
l. This
l is used in Equation (11) to reduce the amount of the image distortion. That length,
l is also analyzed in this article. Experimental result are demonstrated in
Figure 9. This shows that to minimize the distortions, smaller sizes of message blocks are preferred. However, too small a value for
l will increase the size of
as well as the size of the assistant information because
is a part of the assistant information.
Figure 9 delineates that the MSE is affected sharply for
l ε {20–512}. For
l = 512, MSE is about the maximum. Again, though, MSE is at the minimum for
l = 16, and it increases the size of
tremendously, which is, in fact, 1/17th of the portion of the transmitted data and thus it will reduce the effective payload. Therefore,
l should be a value so that it maintains the constraint
.
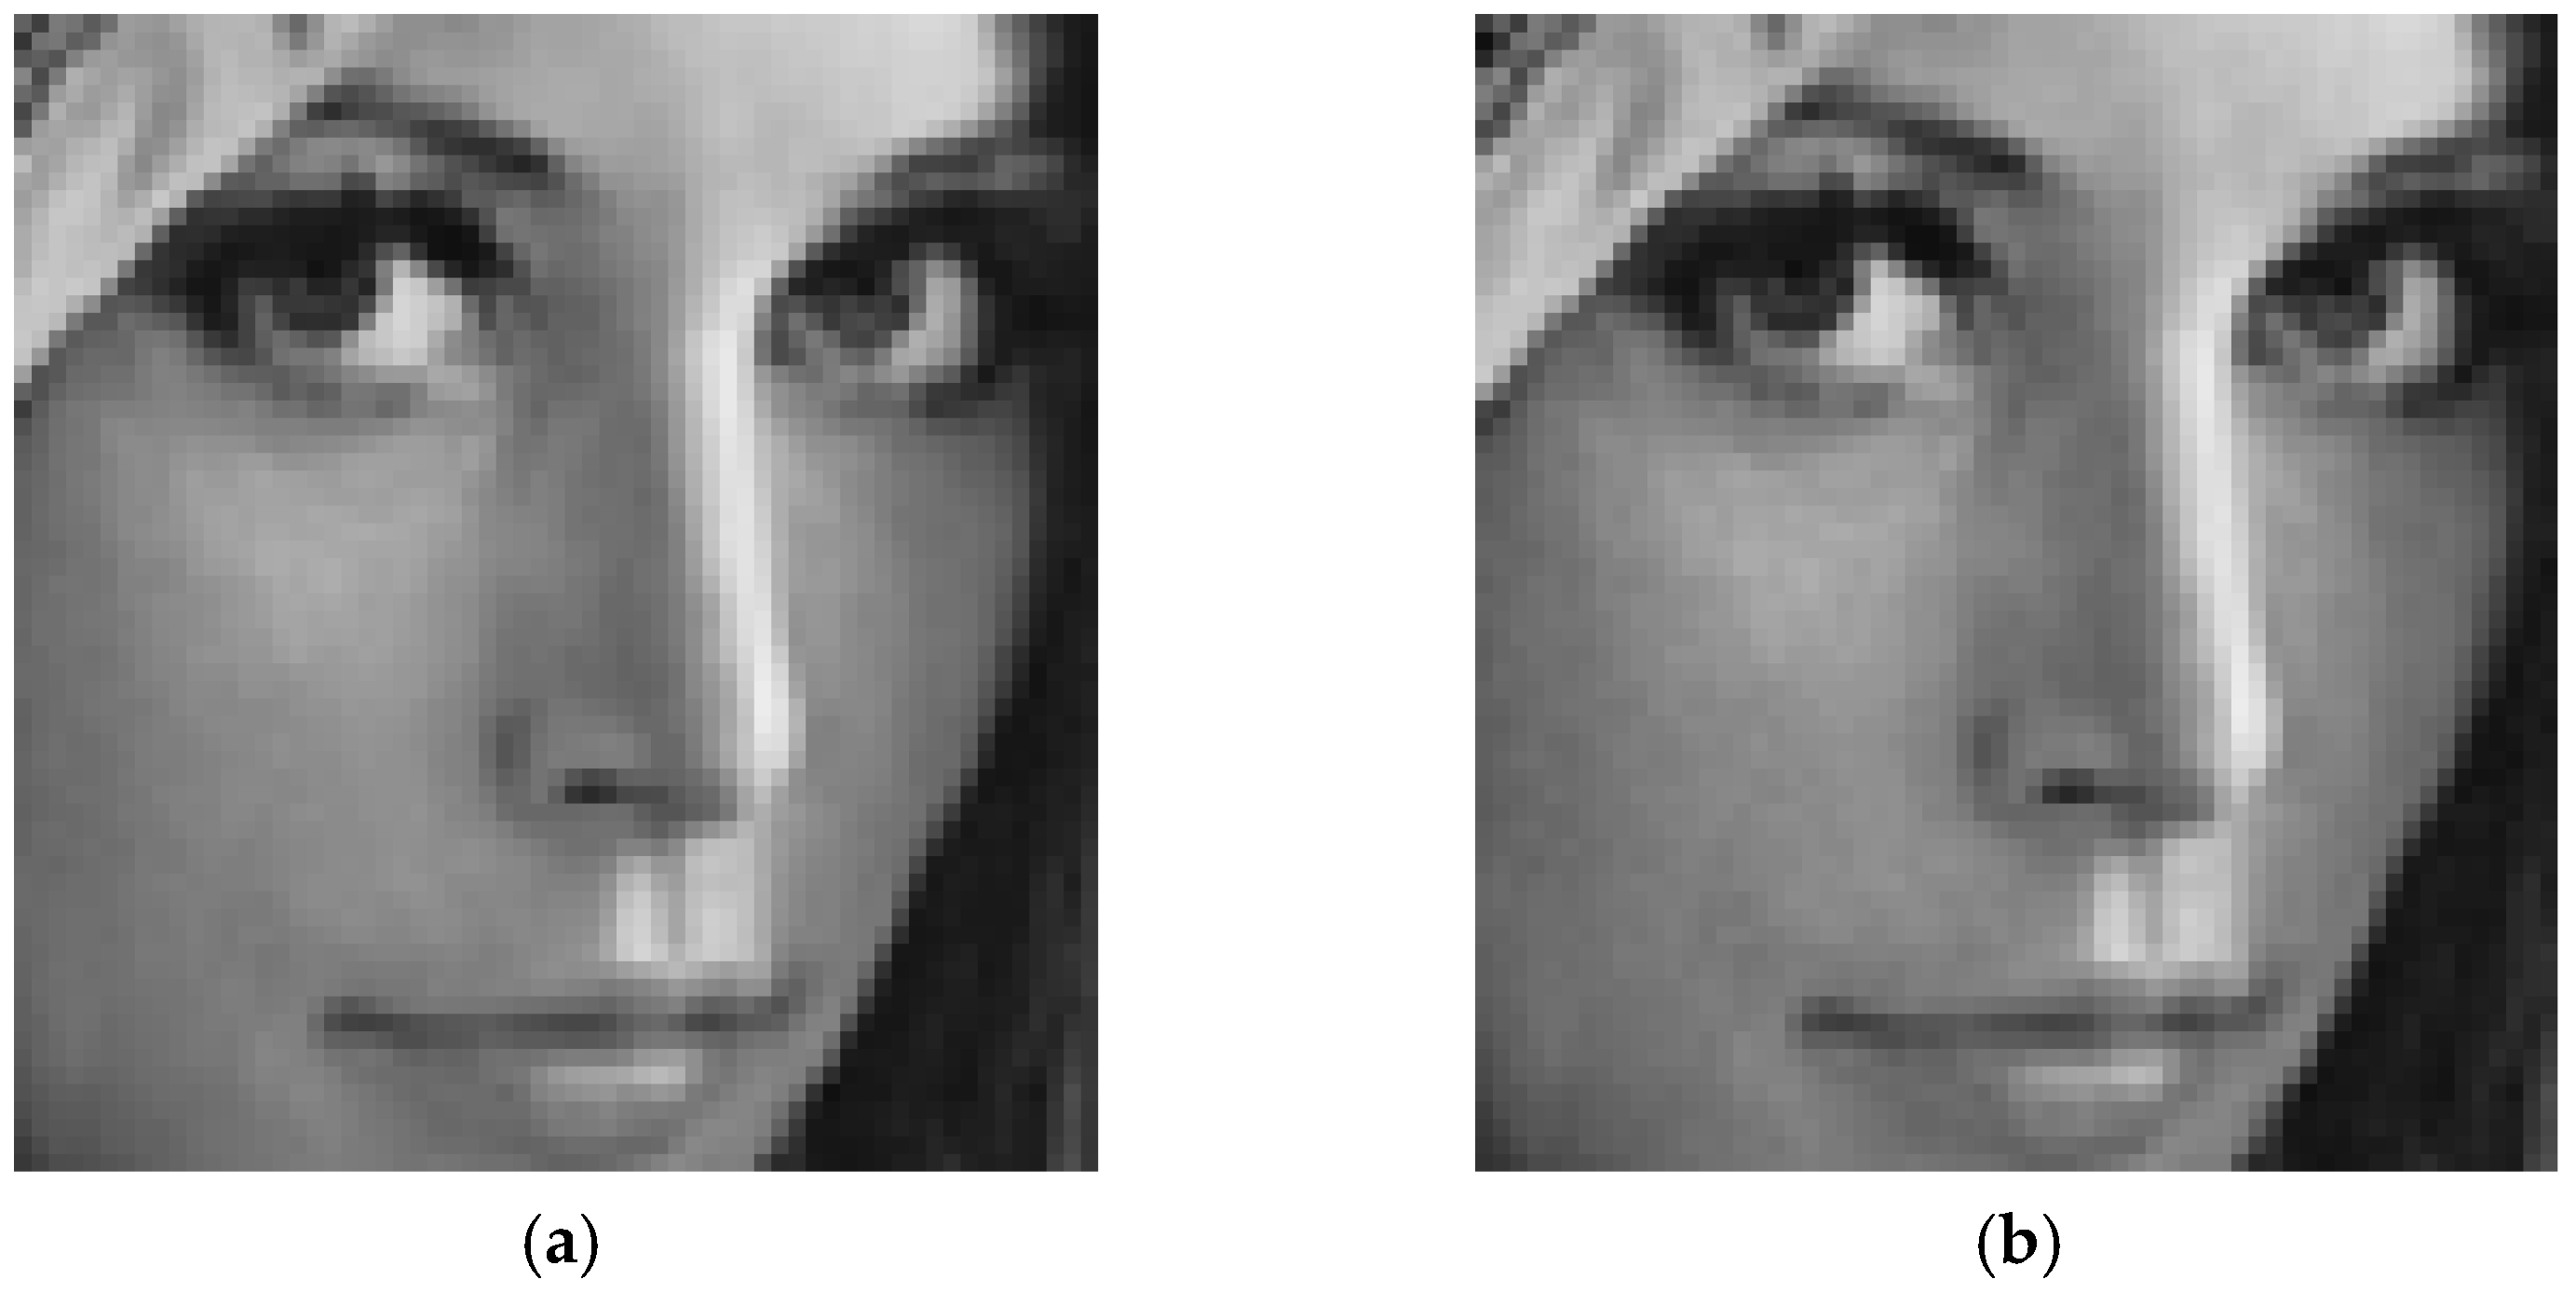
Finally, to observe more closely, only the face portion of the Lena image is clipped and zoomed in by 3. This is performed both for the cover and stego image. The resultant images are delineated in
Figure 10. These two images are so close that it seems as though one is a clone of the other.
3.3. Analysis on the Processing Complexity
The processing complexity is compared by the number of arithmetic and logical operators that are needed to be executed by that algorithm. The arithmetic and logical operators are symbolically defined here by
and
respectively. The comparison is summarized in
Table 4, where scheme S
1, S
2, S
3, S
4, and S
5 stand for the scheme of Chao et al.’s DE, Hong and Chen’s DE, Hong, Wien et al.’s DE, Kamal and Islam’s Euclidean, and proposed encoding errors (EE), respectively. At the DE, the block’s size is set to 2 pixels, while 9 pixels are used in the Euclidean. Hence, the comparison is presented for each processing of 18 pixels only.
From
Table 4, it is clear that the proposed scheme executes less number of instructions to complete the task than the others. The results prove the superiority of the proposed scheme regarding the processing complexity. It is at least two times faster than the Euclidean scheme and some multiples (up to 16) of others.


