A Review on Opportunities To Assess Hydration in Wireless Body Area Networks

College of Engineering and Science, Victoria University, Melbourne, VIC 8001, Australia
*
Author to whom correspondence should be addressed.
Electronics 2017, 6(4), 82; https://doi.org/10.3390/electronics6040082
Submission received: 6 September 2017
/
Revised: 28 September 2017
/
Accepted: 3 October 2017
/
Published: 12 October 2017
Abstract
:The study of human body hydration is increasingly leading to new practical applications, including online assessment techniques for whole body water level and novel techniques for real time assessment methods as well as characterization for fitness and exercise performance. In this review, we will discuss the different techniques for assessing hydration from electrical properties of tissues and their components and the biological relations between tissues. This will be done mainly in the context of engineering while highlighting some applications in medicine, mobile health and sports.
1. Introduction
Accurate measurement of the proportion of water in the various tissue compartments of the body is difficult to achieve. Due to the complexities associated with the regulation of body fluid and variations in tissue morphology, density and distribution, there has not been a superior procedure for determining accurate hydration levels during daily activities [1,2]. The challenge to determine reliable hydration status continues to drive the development of new assessment methods. Many pathophysiological conditions are related to critical disturbances in the amount of total body water or its relative proportion in the compartmentalised tissue spaces. Of the numerous tissue components, water is the most abundant and the major constituent of body cells, tissues and organs. The human brain and heart consist of 75% water, muscle 70%, lungs 83%, and skin 64% [3]. A loss of 10% of body water puts one at a considerable risk of death [4], while, without immediate compensation, a loss of more than 2% of body water causes reduction in brain performance, thermoregulation, cardiovascular functions, and a loss of body coordination. The strong electrical polarity of water allows it to serve as a building block for macromolecules like protein and a solvent for body minerals, vitamins, amino acids, and glucose. Water necessitates digestion, absorption, transportation, and the excretion of toxic substances and regulates body temperature. Ions in the body are hydrated by the dipole nature of water allowing the cells to be surrounded by aqueous electrolytes, which gives rise to electrolytic conductivity of tissues [5]. Hydration level dictates the concentration of cellular constituents, which influences cell metabolism, cell structure, and signalling pathways [6,7].
With hydration having a crucial role in human body metabolism, water management is key to reaching optimal performance, reliability, and lifetime goals. Body water losses occur through faecal excretion, sweat production, evaporation, respiration and urination. This is compensated through metabolic water production, oxidation of substrates that contain oxygen or nutrients that produce energy, dietary intake, and absorption through the skin. Research by Peronnet et al. [8] indicates that water appears in plasma and blood cells as soon as 5 min after intake. Rothlingshofer et al. [9] demonstrated that loss of body fluid could decrease the electrical conductivity of muscle tissues by 6%. Water balance is achieved when the amount of water losses are compensated by the amount of intake from food and beverages as well as metabolic water production. Metabolic water production accounts for 250 to 350 mL per day of body water in a sedentary person [10] and increases with an increase in physical activity. Metabolism increases with increased human activity, which also increases the average daily demand for water. Thus there is a relationship between metabolism and hydration. Resting metabolism, for example, accounts for 65%–70% of a total 24 h energy expenditure in humans. The Mifflin-St. Jeor equation [11] for resting metabolic rate (), also known as resting energy expenditure (), is widely used for estimating daily energy expenditure as relating to body metabolism [10];
By dividing by the square of a persons height we would arrive at a relation which suggests that our daily hydration pattern is related to an individual’s metabolic activity and his/her body mass index. Monitoring hydration status is critical to individual performances in sports and activities of daily living as well as in clinical settings. Physicians use records of hydration patterns of patients and the elderly as physical signs and symptoms for dehydration and other diseases associated with variations in body fluid level. Wireless technology provides the platform for real time remote monitoring and recording of physiological parameters such as hydration, blood pressure and temperature. However, portable hydration assessment technologies still lack in development.
This review aims to compile the latest research on hydration assessment techniques with a focus on wireless technology systems. In this paper, the terms “body fluid”, “body water” and “hydration level” may be used interchangeably by assuming that the difference in volume between body fluid and body water is negligible [12]. The rest of the paper is organised as follows. Section 2 briefly reviews the classical methods for assessing hydration. Section 3 discusses the state-of-the-art methods starting with the electrical properties of human body tissue followed by the human body as a transmission medium in Section 4 . In Section 5 , we present the electrical methods for assessing hydration which was subdivided into RF and non-RF methods. Finally, we have the current research issues in human body hydration assessment in Section 6 and a conclusion in Section 7 .
2. Classical Methods for Assessing Hydration
There are three main classifications of water level in the body: euhydration, which is the state of normal hydration; hyperhydration or the state of excess water in the body; and hypohydration or water deficit in the body [13,14], also called hyperosmolality of body solutes. Total body water (TBW) is the summation of all the water existing in the different tissue spaces in the body. It is the amount of fluid found in the intracellular and the extracellular tissue spaces, which accounts for approximately 63.3% (0.6 L per kg) of the body mass of an adult [15], (Figure 1). Fluid exchanges between the intracellular and the extracellular compartments are regulated by both osmotic and hydrostatic pressure in the body.
The earliest theories for estimating the total amount of water in the body used a two-compartment (2-C) model of a human body. The theory assumes the body as consisted of fat and fat-free components [17]. An application developed with this model is the under water weighing (UWW) or hydrodensitometry method [18]. In UWW, the subject is completely submerged in water and by Archimedes’ principle, the volume of water displaced or weight under water is combined with subject’s weight to calculate the density of the whole body . The total body weight is the summation of the weight due to fat mass and weight of fat free mass .
where and are the densities of the fat and fat-free component. This assumes that the density of fat is relatively constant, however, FFM is heterogeneous and varies with an individual’s activity [19]. Hydrodensitometry method is used in lymphoedema clinics to estimate changes in the volume of fluid accumulated in a lymphoedema affected limb [20]. Further development on the 2-C model led to 4-C model and most recently the 5-C model [21] with the disadvantage of increasing complexity.
2.1. Urine Color and Urine Specific Gravity
Experiments by Armstrong et al. [22] showed urine colour can be used to assess hydration status. By scaling urine colour against a numbered scale, the authors demonstrated a crude assessment of hydration for situations where exactness is not essentially required. The colour of urine changes relative to the amount of water consumed to dilute the concentration of blood. On the other hand, when insufficient fluid is ingested to dilute blood plasma concentration, a more concentrated urine is produced. However, other factors influence the concentration and colour of a urine, which affects the usefulness of this technique. Although urine colour is subjective, it was validated against urine specific gravity by Mentes et al. [23]. The authors argued that its strength lies on its ability to give a quick and easy assessment of hydration level but indicated that it needs reference to a baseline measurement preferably taken from the first voiding of the day. They reported that this may prove difficult for incontinent individuals.
The specific gravity of urine increases due to an increase in the concentration of solutes in urine or hypersthenuria. The specific gravity of a urine is the ratio of the density of urine to the density of equal amount of water. A specific gravity greater than one means the urine is denser than water and may be associated with dehydration [15]. Normal urine specific gravity usually lies between 1.000–1.030 [24] but the reference range in routine clinical measurement is 1.005–1.030 [25]. Hypersthenuria may be caused by loss of body fluid (dehydration), heart failure, renal artery stenosis, medications, or food supplements [26]. On the other hand, decreased urine specific gravity or hyposthenuria may be due to excess fluid intake or a kidney’s regulatory malfunction, for example, in cases of diabetes insipidus. Both urine specific gravity and urine osmolality measurement are associated with the concentration of chemical particles in a urine sample, and their results are influenced by similar factors. Although osmolality measurement is usually a preferred test for urine concentration, results from both methods do not give a reliable assessment of hydration status due to the influences of other metabolic activities in the body mentioned earlier.
2.2. Body Mass Changes
The body mass fluctuates daily as body fluid level changes. The dynamic changes in body mass is attributable to a loss or gain of body water, if measurements are taken in short time intervals, since a mass of 1 mL of water is equal to 1 gram [27]. This way, immediate changes in the volume of total body water are calculated as a simple index of hydration status. This method is more reliable than urine specific gravity but does not clearly quantify a hydration or dehydration level. It gives a reliable and more accurate estimate of average water turnover in a short time. Changes in body mass have been used for determining acute hydration status [28,29,30]. A 2% loss in body mass within a short period such as during physical activities, is regarded as severe dehydration [14]. In other experiments, this technique is often extended to measure the sweat rate by measuring post-exercise body mass and subtracting it from a predetermined average body mass. Measurement is before the start of an exercise, to estimate a reliable baseline, and to be able to calculate changes in body mass due to loss of body water. The sweat rate calculated this way is based on the assumption that changes in body mass during exercise is a result only of water loss through sweating. Its validity relies on a predetermined stable and healthy body mass. Some researchers have argued that using the variability in body mass as indicative of immediate change in fluid balance could be erroneous because body mass loss could occur from substrate oxidation which adds water to the body [31]. However, body mass measurement continues to enjoy popularity in both clinical and heat stress hydration measurements, in conjunction with other hydration indices, mostly because of the simplicity and ease of measurement.
2.3. Analysis of Blood Sample
An estimate of hydration using blood samples requires analysis of the concentration of blood changes with an increase or decrease of water in the body. As both the hemoglobin and hematocrit are contained in the blood sample, this method is dependent on plasma volume. Plasma Osmolality is considered by some as the most popular and reliable technique for assessing hydration in a laboratory setting [1,32]. The results are affected by changes in posture, exercise, and sodium chloride balance in the body. Some researchers have argued that plasma osmolality is only valid for changes in hydration state but not for estimating TBW [33]. The volume and concentration fluctuate with daily activities and do not respond quickly to loss of body fluid after exercise or other daily activities. An investigation by Francesconi et al. [34] showed that participants who lost up to 3% of body mass through sweating did not show any difference in haematocrit or serum osmolality immediately after. Armstrong et al. [22] and Sherrif [14] suggested that the volume of blood plasma does not necessarily change until a certain amount of water had been lost in order to maintain cardiovascular stability. Also, if water losses are accompanied by loss of salt or other nutrients, haemoconcentration may not be a reliable indicator of hydration status.
2.4. Isotope Dilution Method
Isotope dilution method is the most complex and expensive technique for assessing human body hydration. It involves the use of stable non-radioactive isotopes such as deuterium, tritium, oxygen-18, and radioactive potassium as a tracer to track the body’s distribution of water. The calculation is based on the assumption that if the quantity of the tracer substance is known, and the starting and equilibrium concentrations are measured, then the volume of the space into which the tracer was diluted can be calculated. Although this laboratory method is considered more accurate than others, it assumes that the tracer substance distributes in equal amount throughout the area under investigation so that initial concentration of plasma times the initial volume of plasma equals final concentration of plasma times final volume [35].
Important considerations for this technique includes determining that a tracer is non-toxic and the tracer element is able to circulate rapidly and uniformly, only in the targeted tissue space. A radioactive potassium, used to determine intracellular tissue volume should not spread beyond the intracellular space. In addition, if a tracer is affected by body metabolism, the volume estimate would be inaccurate if it spreads beyond the target space and the element must not be excreted before it is uniformly distributed (although a technique has been developed to correct for excretion). It takes 3–4 h to equilibrate, especially when the body is unsettled due to routine exercises or daily activities. It is administered orally or intravenously and only practicable in the laboratory, and the process can not be repeated quickly. Moreover, the technique requires expertise skills, and complex equipment like positron emission tomography tracer (PET-Tracer), which is expensive and not suitable for field measurements. Besides, the result is not totally accurate [36], and its ability to distribute uniformly in all tissue spaces is still debated. Amstrong et al. [1] have argued that there is not yet a tracer technique to directly assess and measure accurately the intracellular and interstitial fluid volume.
3. Electrical Property of Human Tissues
The use of electrical signals is probably the most widely used state-of-the-art method to assess hydration status. The principle of electrical current flowing through a material is determined primarily by the relative permittivity and the electrical conductivity, of the material. The relative permittivity of a medium is the factor by which the applied electric field between the charges is decreased relative to vacuum, where is the complex frequency-dependent absolute permittivity of the material with real and imaginary parts and is the permittivity of vacuum. The electrical conductivity of a material is the ability of the material to move charges under applied electric field. In biological materials, the electrical properties are determined by interacting tissue cells with electromagnetic (EM) radiation. EM waves passing through tissues have strong interaction with water and solutes in the tissue. The magnitude of the interaction depends on the frequency of the wave. When biological tissues are brought in contact with an electric field, conductivity occurs due to the mobility of hydrated ions. However, as biological tissues contains large cell membranes with very small thickness, capacitive conduction is prominent. The relative permittivity indicates the extent to which localized charge distributions can be distorted or polarized under the influence of the field. Each polarizable entity in the tissue has its own characteristic response to an electric field, which is described by the relative permittivity as a complex function of the form:
where is the permittivity measured at high frequencies necessary for the polarizable material to cease to respond to the applied electric field, is the limiting low frequency permittivity where the polarization effect is fully realized, is the angular frequency, i is , and is the relaxation time.
The real part relates to the relative permittivity between two parallel electrodes of area ‘A’ separated by distance ‘d’ in which the capacitance C is given by
and conductance,
The imaginary part corresponds to the dissipative losses associated with the polarization of charges moving in phase with the electric field. Schwan [37] measured the various resistance of tissues to current flow and provided fundamental processes underlying the electrical property of biological tissues. It was found that living tissues display properties similar to both insulators and conductors due to the presence of dipoles in them, which inhibits current and charges that support the movement of electric current. In general, he showed that tissue response to current flow vary differently with three frequency dispersive regions.
- The low frequency region called dispersion is the region associated with ionic diffusion on cellular membrane and occurs between 1 Hz to 100 kHz.
- dispersion or mid-frequency region is associated with the polarization of the cellular structure of membranes between the intracellular and the extracellular tissue and lies between 100 kHz to 10 MHz.
- dispersion operates primarily at frequencies in the gigarhertz range which is associated with higher radiation.
The dielectric properties are therefore classified as a function of frequency. From Equation (2), the magnitude of the dielectric dispersion is calculated from the difference between the low and high frequency dispersions.
Cole and Cole [38] introduced a relaxation model with parameter , where n lies between 0 and 1. The Cole-Cole parameter, Equation (6), describes the dispersion and absorption of liquid and dielectrics over a wide range on a logarithmic frequency scale. When is zero, the Cole-Cole model reduces to the Debby model for polar dielectrics and when is one, it describes when the locus of the dielectric constant in the complex plane has a circular arc whose end points are on the axis of the real part and the centre lying below the axis as shown in Figure 2.
The Cole–Cole parameter has been widely used for obtaining the dielectric properties of biological tissues because it can estimate the dielectric properties from zero frequency to infinite frequency [39,40]. However, the model uses interpolated data from a least squares regression. There were uncertainties relating to the empirical data used and the approximation of the measured data to the parametric model [41]. Gabriel and Peyman concluded that inhomogeneities in tissue samples, for example geometry, concentration and distribution, were responsible for the uncertainties in the measured data, which also causes inaccuracies in applications using the model such as in body fluid assessment.
4. Human Body as a Transmission Channel
In 2012, the Institute of Electrical and Electronic Engineering (IEEE) 802.15.6 was ratified for data communication in and around the human body [42]. The standard outlines three physical (PHY) layers, namely, narrowband (NB) and ultrawideband (UWB) and Human body communication (HBC). The protocol for NB and UWB PHY operations are based on RF propagation, while the HBC is the new non-RF based communication technique. Under this, a wireless communication without radio frequency signal, called human body communication or intrabody communication (IBC), is proposed with frequency centred at 21 MHz. The system uses living tissues as the communication channel. Several research models of human tissue have been proposed and investigated for characterising electrical signal propagation using galvanic or capacitive coupling. Research on human body channel for data communication started as Personal Area Network (PAN) by Zimmerman [43]. This technique uses near field and electrostatic coupling of signals, consequently, low frequency communication without electromagnetic radiation can be achieved that has the advantage of low power consumption. This assures safety and could further provide significant insight into human body composition since changes in the signal amplitude and phase are dependent on the changes in the medium through which the signals propagate and the electrodes and method through which they were connected. From this, other models emerged involving both electrical circuit [44,45] and finite element methods [46,47]. NB PHY include multiple frequencies of 402–405 MHz for implantable devices, 863–956 MHz for wearable applications, and 2360–2400 MHz for medical applications. UWB PHY operates in the higher frequencies ranging in the 3–5 GHz and 6–10 GHz bands with channel bandwidth of 499.2 MHz [42]. In general, RF interaction with tissues, cell membrane, tissue water and the solutes depends on the frequency of the wave. The electrical conductance is affected largely by the amount of water available for current flow. As current flows, energy is absorbed in relation to the quantity of solute available [48]. The resulting attenuation from a propagating radio frequency wave has been used to measure hydration [33,49]. In a similar manner, the attenuation of an electrical signal galvanically coupled to the body has been used to assess hydration level that indicated four different fluid states in the body [45]. Also, the impedance estimate of tissues when an electrical current is transmitted through the body has equally been used to estimate the amount of fluid changes in the body [50].
5. Hydration Assessment by Electrical Methods
Human tissue as a communication medium can be accomplished by directly transmitting a very small electrical signal safely through the body or by the use of radio-frequency signal in amounts safe for human body exposure to electromagnetic radiation. In both cases, the signal is affected by the frequency-dependent dielectric properties of tissues described above. The state of human tissue vary over time, which in turn varies the dielectric properties and the resultant tissue impedance, which plays a significant role in several models used for assessing hydration state or the overall body fluid level.
5.1. Bioelectrical Impedance Analysis
The bioelectrical impedance analysis (BIA) method for assessing fluid level is based on a relationship between the volume of a conductor (human body) and the length of the conductor (height), the impedance of the conductor, and the material it is made of. It assumes that the entire human body is a perfect cylindrical conductor and the impedance is related to the nature of the conductor (electrical properties of tissues in this case), its length, the cross-sectional area and the signal frequency. By assuming the body as a homogeneous cylindrical conductor with length proportional to the height (H) of an individual and negligible reactance component () then the equivalent body impedance is represented by the resistance (R). With these approximations, the volume of the cylindrical conductor would be proportional to
The BIA method is popular because it is non-invasive, cheap and easy to use. Measurements are performed using four electrodes, two at the wrist and two at the ankle. A single-frequency BIA operates at 50 kHz. The effects of capacitive behaviour of tissue membranes means that intracellular fluid volume (ICF) can only be measured at higher frequencies while extracellular fluid volume (ECF) can be measured at low frequencies. Human tissue has both resistive and reactive components and cell membrane capacitance contributes significantly to the effective impedance of electrical signals across tissues [5]. Single-frequency bioelectrical impedance (SF-BIA) are affected by changes in the body fluid state. This is because SF-BIA gives an estimate of FFM and TBW but does not accurately include intracellular water (ICW), and thus its value is most suitable for normally hydrated people. Asselin et al. [51] reported that a severe dehydration of 3% of body mass resulted in a water loss that is not properly accounted for by prediction equations in bioimpedance analysis as compared to the observed changes in individual body mass. The constraints in BIA led to the development of multi-frequency bioimpedance analysis (MF-BIA), and bioimpedance spectroscopy (BIS) which operates at broad frequency spectrum. MF-BIA usually uses two frequencies. Low or intermediate frequency for estimating the volume of extracellular water (ECW) and a higher frequency for estimating intracellular water volume (ICW), the sum of which gives an improved estimate of total body fluid in the different compartments. The relative variation in the amount of TBW is used to predict changes in hydration status.
5.2. Bioelectrical Impedance Spectroscopy (BIS)
BIS was proposed to distinguish clearly between the ECW and ICW volumes using a broader spectrum of frequencies than the MF-BIA. The extracellular water resistances are measured at low frequencies while the combined ICW and ECW are measured at higher frequencies. The exact range of frequencies are not clearly specified in literature. Nyboer has suggested below 5 kHz for extracellular fluids and between 500 and 800 kHz for both the extracellular and intracellular fluids [52,53]. Consequently, BIS allows resistance and reactance measurements over a broader spectrum of frequencies. Measurements of total body water with the BIS technique has been validated by Van Loan et al. (1993) [54] and Wabel et al. (2009) [55] as having strong correlation with isotope dilution methods. A typical instrument based on this model is Xitron, San Diego, CA, USA. BIS methods have the additional advantage in medical applications of information relating to cell functionality, immune deficiency and the likelihood of cancer disease and hemodialysis prognosis [56,57] with the measurement of tissue phase angles.
5.3. Galvanic Coupling Method
In intrabody method, an electrical signal is galvanically coupled to the body and propagated in the dispersive frequency spectrum. The propagating signal attenuates as the signal travels through the tissues. Our research on 12 male and eight female subjects showed the method can respond to four distinct fluid states, namely, hyperhydration: subjects with hydration metrics indicating excess water in the body. Measurement with galvanic coupling on these subjects showed the galvanic signal continued to increase in gain after an hour of fluid intake and urination and also corresponded to a low specific gravity measurement on the subjects. Normally hydrated subjects had no difference in the signal gain measured and the body mass measurement before fluid intake was the same with those measured after ingestion and urination. Mild dehydration and severe dehydration had increase in body mass measurement after fluid intake and urination. The signal decreased after subjects had urinated with higher rates occurring among subjects with high specific gravity measurements. The experiment demonstrated that the galvanic coupling method is sensitive to 100 mL of fluid intake, (Figure 3) [58]. We used changes in body mass and urine specific gravity measurement as the metric of hydration and to determine initial fluid states of the subjects after 10 hours of fluid abstinence and resumption of intake. The results indicated that despite strict adherence to the experiment protocols, all the subjects had different levels of experience of dehydration and thirst after fluid abstinence and subjects with high body mass index (BMI) retained water longer. Its main advantage is that it can be integrated into a wearable electronic device and is sensitive to minor changes in fluid level.
5.4. Radio Frequency Method
In 2003, Moran et al. [33] demonstrated the use of electromagnetic waves for assessment of hydration on 12 male subjects in a climatic chamber. The subjects were subjected to heat stress in various degrees. Hypohydration was measured by the variations in body mass measurement. The researchers concluded that changes in RF transmission measurements could infer hydration status with a correlation of 0.734 in comparison with measurements using variabilities in body mass measurement. Similarly, experiments by Wang et al., 2017 [49] tested the use of a wearable BioMindR RF sensor operating at 2.45 GHz industrial, scientific and medical (ISM) band to assess variabilities in hydration level. They used the received signal strength indicator (RSSI) to compare with the percentage changes in body mass water loss among 12 subjects before and after exercise. The percentage change in body mass, which represented body water loss, over a given period was compared with the dynamic changes in the measured RSSI values. The graph showed a linear relationship with a correlation of 0.77 between the percentage body water losses and the measured RSSI values, however it was unclear how the RSSI values measured corresponded to each change in body mass used as the hydration metric. Interference and background noise may have contributed to the measured RSSI values.
Figure 4 is a block diagram of a wearable hydration monitor based on this method. In 2015, Ionescu, M.A. and Guerin, H [63], invented a system that exploits a backscattering of an electromagnetic wave on the skin surface to determine hydration status. The system uses an external device such as a mobile phone to emit electromagnetic waves in the low GHz range, which is received by an RF tag antenna in contact with the skin. The backscattered waves sent back by the antenna is modulated by the electrical properties of the skin in contact with the tag. The loss between the incident and the backscattered waves are mainly due to the change in the impedance of the skin, which carries information about its hydration level. The antenna communicates the modulated signal to a wireless personal portable hub fitted with a RF reader, which processes and displays the measured hydration level. This way the hydration and other physiological parameters are monitored remotely with relative ease. However, the inventors did not provide statistical evidence of the reliability of their method in comparison with other hydration assessment techniques. For instance, the backscattering of the signal can be affected by the heating effect of the RF tag in contact with the skin or interference from external electronic devices. Moreover, it is not clear how sensitive it is to frequently changing hydration levels.
5.5. Remote Monitoring by Wireless Network
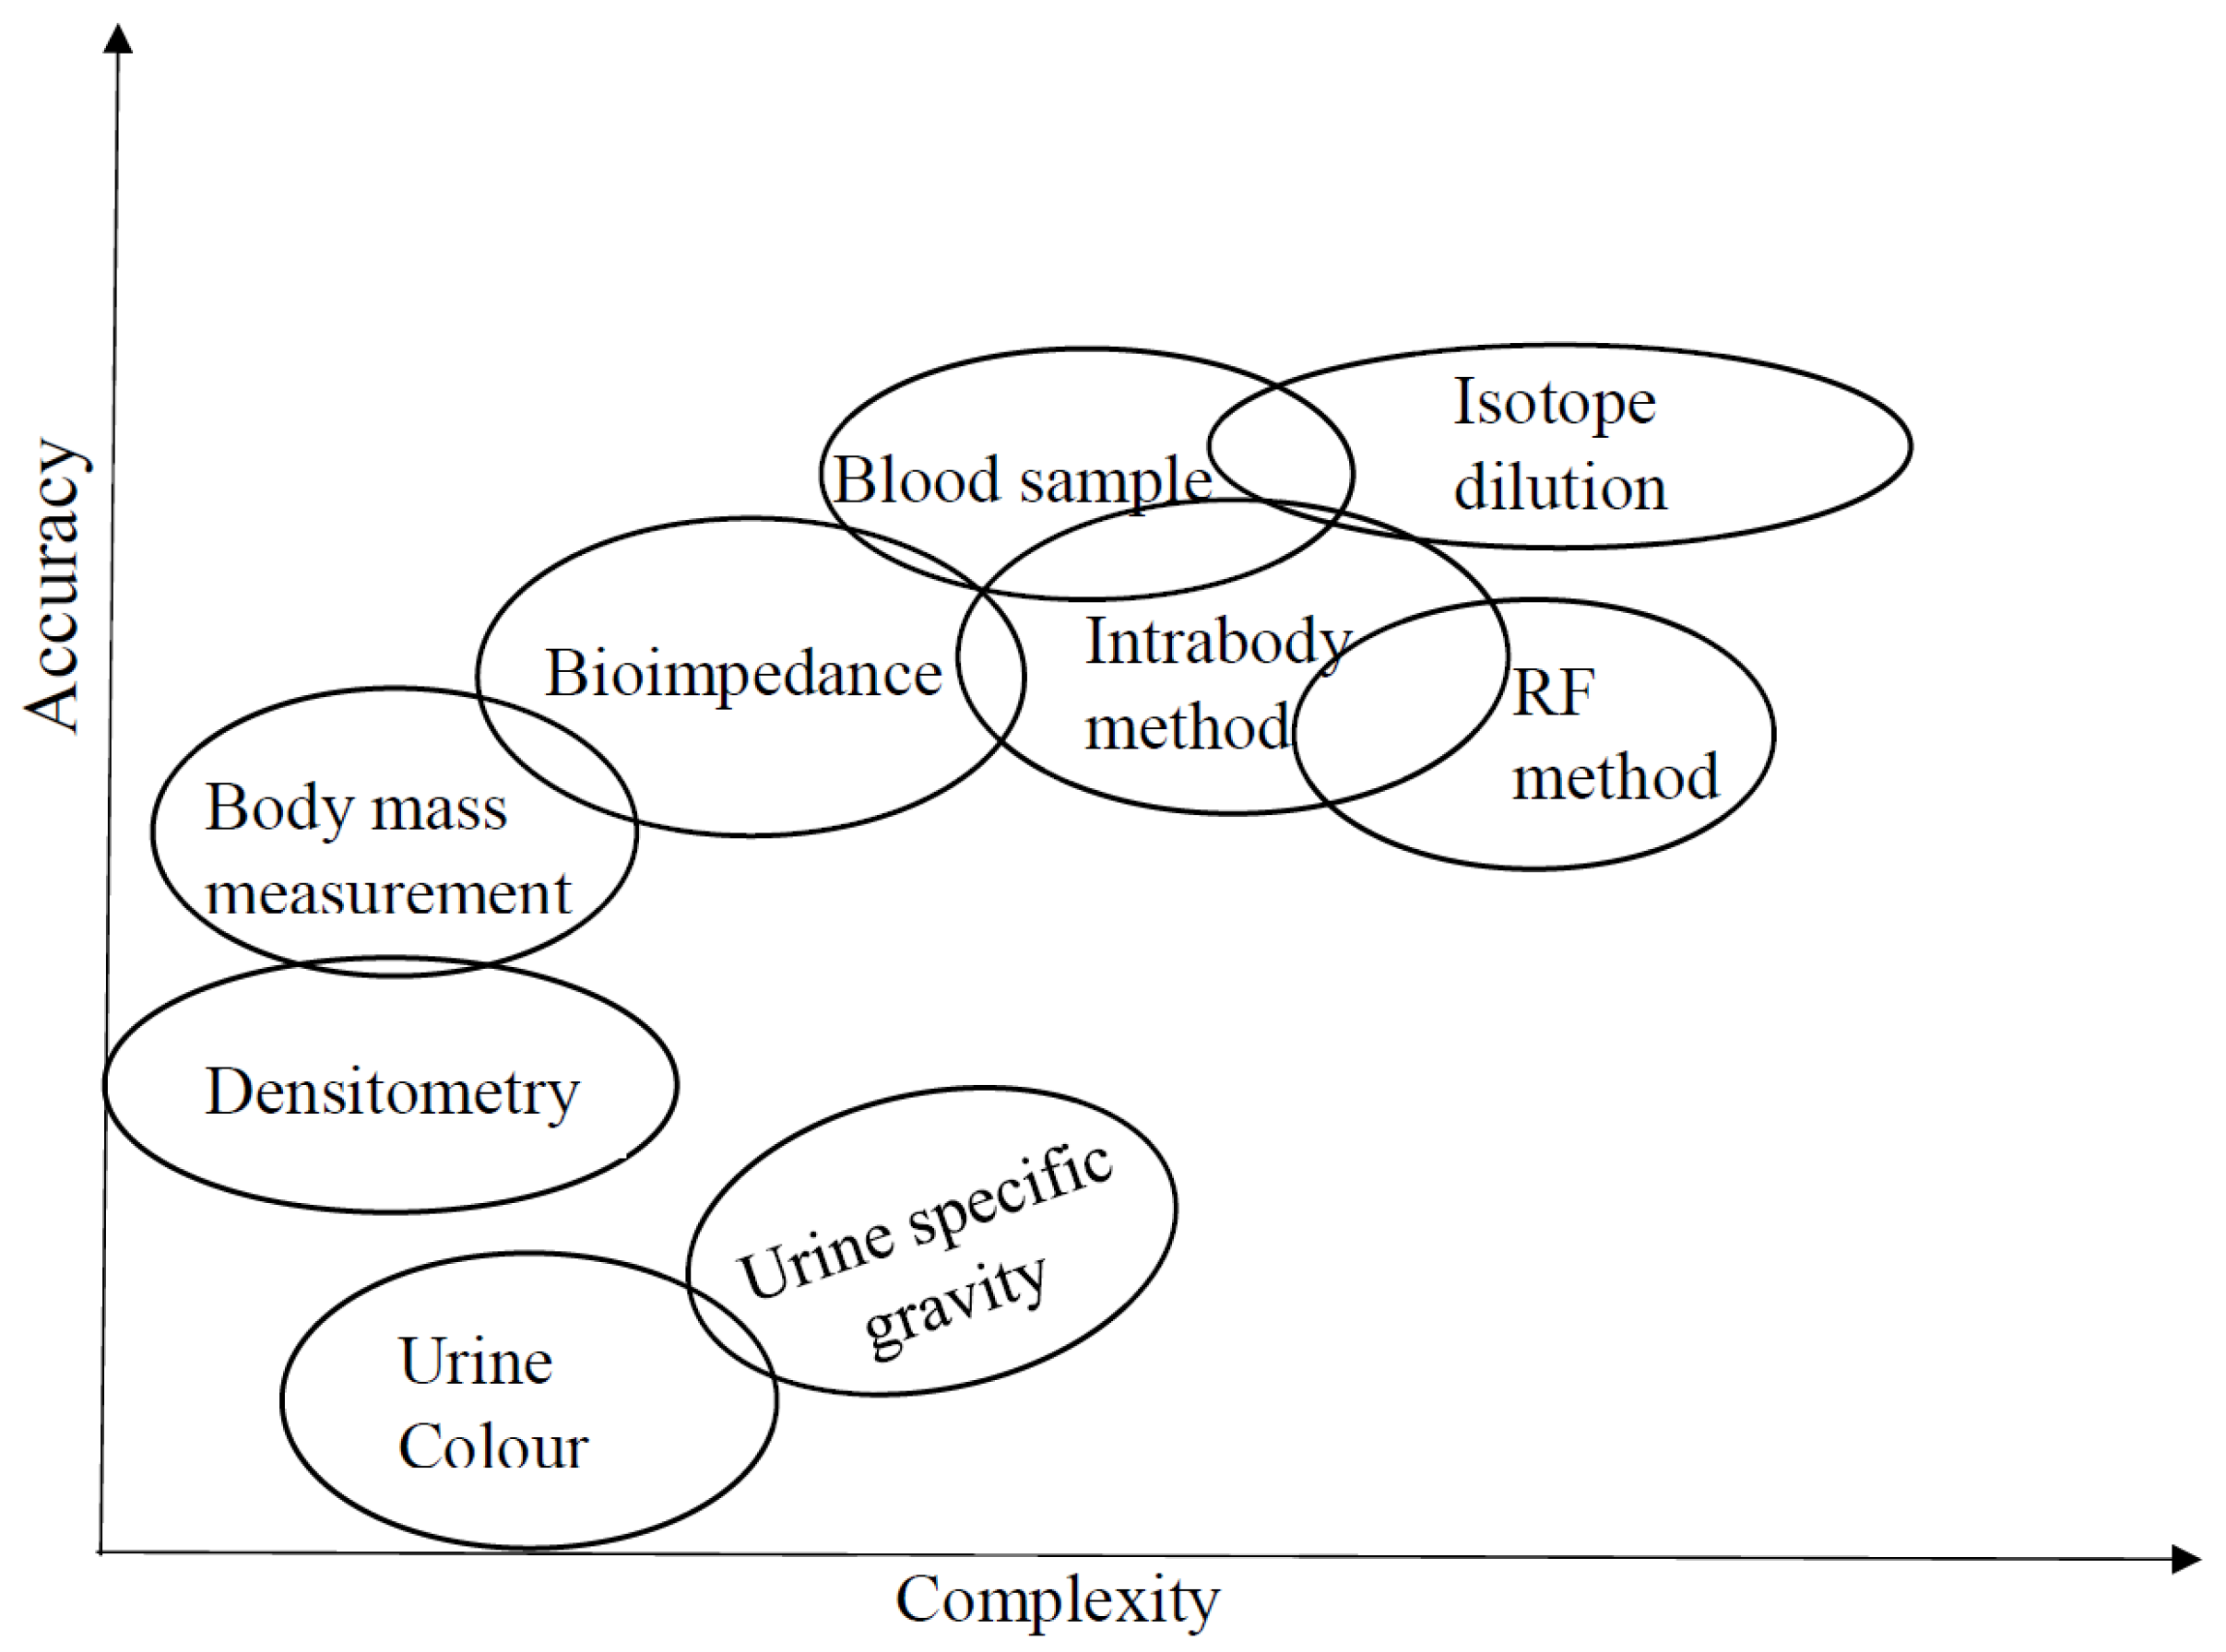
In 2009, Ramos et al. [64] proposed a ZigBee based mobile wireless sensor containing bioimpedance (BI) measurement circuit integrated in a 0.35 micro-meter complementary metal-oxide-semiconductor (CMOS) with a ZigBee transceiver for the wireless communication. The goal of the experiment was to demonstrate a wireless system that can remotely assess hydration and visceral fat of a user from a remote station. The transceiver has an embedded BI monitoring circuitry with an analogue front end that makes contact with the body through a wearable device. The BI sensor computes the water level in the body and transmits it wirelessly to a user device or a remote monitoring sever through a central coordinator. There are also web based hydration monitors which claim to estimate hydration level using basic inputs such as individual age, height, gender, physical activity, body mass and location without actual body contact with a measuring device [10]. Similarly, passive sensors for skin hydration are also integrated into Wireless Body Area Network (WBAN), which enable hydration sensing to be monitored remotely or transmitted to a designated server [65]. Wireless passive sensing uses passive inductive coupling to make epidermal contact with the skin. The sensing component alters the resonant frequencies of the inductor–capacitor circuit. The change is used to predict body hydration from sensed skin hydration and transmitted through a central coordinator to an externally connected wireless device. Many commercial hydration sensors (CHS) allow direct conversion of measured skin impedance [66], or chemically sensed parameters like sweat concentration, concentration of potassium in urine and relative humidity of the skin [67], to assess hydration levels. The effectiveness of these systems can be enhanced using wireless platforms to manage data transfer among devices and the internet. Integrating large-scale wireless communication networks with telemedicine provides real time opportunities both in healthcare applications such as the potential of real time hydration monitoring and in athletic performance. Figure 5 is our comparison of body fluid assessment techniques by accuracy and complexity which is clarified in more details in Table 1.
6. Research Challenges
The complexity of the body and the inhomogeneity of tissues usually result in statistical assumptions on specific densities and distribution that differ from person to person. Despite the existence of different methods of human body hydration assessment, empirical measurements do not usually conform to proposed models in all classes of people, and subject-specific anatomical parameters are difficult to account for. Many of the available models do not address user application by geography, gender and race, nor by physiological structure and metabolism. Furthermore, the contact mechanism of the various assessing devices has not been properly investigated. The contact impedance between an assessing device and the human body changes by body type, duration, activity, environment and humidity; further research is required to thoroughly address this electrode-skin impedance universally. Therefore indirect models using brain signalling or machine learning approach can provide further biological information to improve on the accuracy of current models. Wearable systems for daily hydration monitor is in demand but such a system may be seriously affected by movement artifacts, size and cost. A significant challenge to the reliability of a wireless hydration monitor is noise from internal and external sources. Huang et al. [66] proposed an array of embedded epidermal sensors mapped to provide uniform skin depth and intimate skin contact. This enables contact electrodes to follow skin motion, this way biological noise on epidermal hydration measurements is reduced. Variabilities in signal-to-noise ratio especially during daily activities can also be minimized by filtering. Filtering reduces noise in the signal, anti-aliasing (low-pass) filters prevents high frequencies, from either the signal or noise to introduce distortion. Alternatively, incorporating differential input amplifiers will significantly reduce the noise levels but with a trade-off between sensitivity and form-factor. Also, the use of flexible and stretchable electrode materials, such as silver nanowire, allows good contact and conformance to skin contour, which have been found to be insensitive to changes in external humidity [68]; changing external humidity alters measurements on wireless-based hydration monitor. More generally, many wearable monitoring systems require legal certification procedures to gain market entrance, popularity and acceptance. More effort is required to ensure that hydration monitoring systems reach a proper level of reliability and compliance with regulatory standards to gain market acceptance and use.
7. Conclusions
Body fluid assessment has been an on-going research for many decades. Investigation continues due to improvements in technology and the need for mobility, remote monitoring, and precise evaluation of fluid level for the purposes of health, medical care and exercise performance. Choosing a particular method for evaluating hydration status usually depends on a specific challenge. We have, therefore, tried to group the various methods by accuracy and complexity. Integrating hydration monitor to mobile devices is predicted to be the future of hydration assessment technology.
Author Contributions
Clement Ogugua Asogwa was the primary author while Daniel T. H. Lai reviewed and edited the work.
Conflicts of Interest
The authors declare no conflict of interest.
References
- Armstrong, L.E. Assessing hydration status: The elusive gold standard. J. Am. Coll. Nutr. 2007, 26, 575s–584s. [Google Scholar] [CrossRef] [PubMed]
- Bak, A.; Amalia, T.; Carolynn, G. Methods of Assessment of Hydration Status and their Usefulness in Detecting Dehydration in the Elderly. Curr. Res. Nutr. Food Sci. J. 2017, 5. [Google Scholar] [CrossRef]
- Mitchell, H.H.; Hamilton, T.S.; Steggerda, F.R.; Bean, H.W. The chemical composition of the adult human body and its bearing on the biochemistry of growth. J. Biol. Chem. 1945, 168, 625–637. [Google Scholar]
- Agostoni, C.V.; Bresson, J.L.; Fairweather-Tait, S. Scientific opinion on dietary reference values for water. EFSA J. 2010, 8, 3. [Google Scholar]
- Martinsen, O.G.; Grimnes, S. Bioimpedance and Bioelectricity Basics. In Bioimpedance and Bioelectricity Basics (Second Edition); Academic Press: London, UK, 2008; pp. 7–55. ISBN 978-0-12-374004-5. [Google Scholar]
- John, G.W. A role for water in cell structure. Biochem. J. 1987, 248, 615–617. [Google Scholar]
- Dieter, H. The role of cellular hydration in the regulation of cell function. Biochem. J. 1996, 313, 697–710. [Google Scholar]
- Peronnet, F.; Mignault, D.; Du Souich, P.; Vergne, S.; Le Bellego, L.; Jimenez, L.; Rabasa-Lhoret, R. Pharmacokinetic analysis of absorption, distribution and disappearance of ingested water labeled with d2o in humans. Eur. J. Appl. Physiol. 2012, 112, 2213–2222. [Google Scholar] [CrossRef] [PubMed]
- Rothlingshofer, L.; Ulbrich, M.; Hahne, S.; Leonhardt, S. Monitoring change of body fluid during physical exercise using bioimpedance spectroscopy and finite element simulations. J. Electr. Bioimp. 2011, 2, 79–85. [Google Scholar] [CrossRef]
- Max, L.; David, H.; Hardinsyah, I.; Jean-Francois, D.; Simon, B.; Lawrence, E.A. Hydration for Health. Available online: http://www.h4hinitiative.com/ (accessed on 17 July 2017).
- Mifflin, M.D.; St Jeor, S.T.; Hill, L.A.; Scott, B.J.; Daugherty, S.A.; Koh, Y. A new predictive equation for resting energy expenditure in healthy individuals. Am. J. Clin. Nutr. 1990, 51, 241–247. [Google Scholar] [PubMed]
- Chamney, P.W.; Wabel, P.; Moissl, U.M.; Muller, M.J.; Bosy-Westphal, A.; Korth, O.; Fuller, N.J. A whole-body model to distinguish excess fluid from the hydration of major body tissues. Am. J. Clin. Nutr. 2007, 85, 80–89. [Google Scholar] [PubMed]
- Oppliger, R.A.; Bartok, C. Hydration testing of athletes. Sports Med. 2002, 32, 959–971. [Google Scholar] [CrossRef] [PubMed]
- Shirrefs, S.M. Markers of hydration status. Eur. J. Clin. Nutr. 2003, 57, S6–S9. [Google Scholar] [CrossRef] [PubMed]
- Armstrong, L.E. Hydration Assessment Techniques. Nutr. Rev. 2005, 63, S40–S54. [Google Scholar] [CrossRef] [PubMed]
- Thornton, S.N. Thirst and hydration: Physiology and consequences of dysfunction. Physiol. Behav. 2010, 100, 15–21. [Google Scholar] [CrossRef] [PubMed]
- Pace, N.; Rathbun, E.N. Studies on body composition 3. The body water and chemically combined nitrogen content in relation to fat content. J. Biol. Chem. 1945, 158, 685–691. [Google Scholar]
- Behnke, A.R.; Feen, B.G.; Welham, W.C. The specific gravity of healthy men: Body weight and volume as an index of obesity. J. Am. Med. Assoc. 1942, 118, 495–498. [Google Scholar] [CrossRef]
- Deurenberg, P.; Weststrate, J.A.; Van Der Kooy, K. Is an adaptation of siri’s formula for the calculation of body fat percentage from body density in the elderly necessary? Eur. J. Clin. Nutr. 1989, 43, 559–567. [Google Scholar] [PubMed]
- Ridner, S.H.; Montgomery, L.D.; Hepworth, J.T.; Stewart, B.R.; Armer, J.M. Comparison of upper limb volume measurement techniques and arm symptoms between healthy volunteers and individuals with known lymphedema. Lymphology 2007, 40, 35–46. [Google Scholar] [PubMed]
- Wang, Z.; Pierson, R.N.; Heymsfield, S.B. The five-level model: A new approach to organizing body-composition research. Am. J. Clin. Nutr. 1992, 56, 19–28. [Google Scholar] [PubMed]
- Armstrong, L.E.; Maresh, C.M.; Castellani, J.W.; Bergeron, M.F.; Kenefick, R.W.; LaGasse, K.E.; Riebe, D. Urinary indices of hydration status. Int. J. Sport Nutr. 1994, 4, 265–279. [Google Scholar] [CrossRef] [PubMed]
- Mentes, J.C.; Bonnie, W.; Kennith, C. Use of a urine color chart to monitor hydration status in nursing home residents. Biol. Res. Nurs. 2006, 7, 197–203. [Google Scholar] [CrossRef] [PubMed]
- MedlinePlus: Urine Concentration Test by U.S. National Library of Medicine. Available online: https://medlineplus.gov/ency/article/003608.htm (accessed on 13 August 2017).
- Williamson, M.A.; Snyder, L.M. Wallach’s Interpretation of Diagnostic Tests, 9th ed.; Lippincott Williams & Wilkins: Philadelphia, PA, USA, 2011. [Google Scholar]
- Graff, L. A Handbook of Routine Urinalysis; Lippincott Williams & Wilkins: Philadelphia, PA, USA, 1983. [Google Scholar]
- Lentner, C. Units of Measurement, Body Uids, Composition of the Body, Nutrition. In Geigy Scientific Tables; Ciba-Geigy Ltd.: Basle, Switzerland, 1981. [Google Scholar]
- Cheuvront, S.N.; Carter, R., III; Montain, S.J.; Sawka, M.N. Daily body mass variability and stability in active men undergoing exercise-heat stress. Int. J. Sport Nutr. Exerc. Metab. 2004, 14, 532–540. [Google Scholar] [CrossRef] [PubMed]
- Kenefick, R.W.; Sawka, M.N. Hydration at the work site. J. Am. Coll. Nutr. 2007, 26, 597S–603S. [Google Scholar] [CrossRef] [PubMed]
- Dimant, J. Delivery of nutrition and hydration care in nursing homes: Assessment and interventions to prevent and treat dehydration, malnutrition, and weight loss. J. Am. Med. Dir. Assoc. 2001, 2, 175–182. [Google Scholar] [CrossRef]
- Maughan, R.J.; Shirreffs, S.M.; Leiper, J.B. Errors in the estimation of hydration status from changes in body mass. J. Sport Sci. 2007, 25, 797–804. [Google Scholar] [CrossRef] [PubMed]
- Sollanek, K.J.; Kenefick, R.W.; Cheuvront, S.N.; Axtell, R.S. Potential impact of a 500-mL water bolus and body mass on plasma osmolality dilution. Eur. J. Appl. Physiol. 2011, 111, 1999–2004. [Google Scholar] [CrossRef] [PubMed]
- Moran, D.S.; Heled, Y.; Margaliot, M.; Shani, Y.; Laor, A.; Margaliot, S.; Shapiro, Y. Hydration status measurement by radio frequency absorptiometry in young athletes—A new method and preliminary results. Physiol. Meas. 2003, 25, 51. [Google Scholar] [CrossRef]
- Francesconi, R.P.; Hubbard, R.W.; Szlyk, P.C.; Schnakenberg, D.; Carlson, D.; Leva, N.; Sils, I.; Hubbard, L.; Pease, V.; Young, J. Urinary and hematologic indexes of hypohydration. J. Appl. Physiol. 1987, 62, 1271–1276. [Google Scholar] [PubMed]
- Guyton, A.C. Textbook of Medical Physiology, 5th ed.; Saunders: Philadelphia, PA, USA, 1976. [Google Scholar]
- Ellis, K.J. Human body composition: In vivo methods. Physiol. Rev. 2000, 80, 649–680. [Google Scholar] [PubMed]
- Schwan, H.P. Electrical properties of tissue and cell suspensions. Adv. Biol. Med. Phys. 1957, 5, 147–209. [Google Scholar] [PubMed]
- Cole, K.S.; Cole, R.H. Dispersion and Absorption in Dielectrics—I Alternating Current Characteristics. J. Chem. Phys. 1941, 9, 341–352. [Google Scholar] [CrossRef]
- Gabriel, S.; Lau, R.W.; Gabriel, C. The dielectric properties of biological tissues: III. Parametric models for the dielectric spectrum of tissues. Phys. Med. Biol. 1996, 41, 2271–2293. [Google Scholar] [CrossRef] [PubMed]
- Gabriel, C. Compilation of the dielectric properties of body tissues at RF and microwave frequencies. In Brooks Air Force Technical Report, Occupational and Environmental Health Directorate, Radiofrequency Radiation Division; N.AL/OE-TR-1996–0037; Brooks Air Force Base: San Antonio, TX, USA, 1996. [Google Scholar]
- Gabriel, C.; Peyman, A. Dielectric measurement: Error analysis and assessment of uncertainty. Phys. Med. Biol. 2006, 51, 6043–6046. [Google Scholar] [CrossRef] [PubMed]
- IEEE Standard for Local and Metropolitan Area Networks Part 15.6: Wireless Body Area Networks; IEEE Std. 802.16.6; IEEE: New York, NY, USA, 2012.
- Zimmerman, T.G. Personal area networks: Near-field intrabody communication. IBM Syst. 1996, 3–4, 609–617. [Google Scholar] [CrossRef]
- Song, Y.; Hao, Q.; Zhang, K.; Wang, M.; Chu, Y.; Kang, B. The simulation method of the galvanic coupling intrabody communication with different signal transmission paths. IEEE Trans. Instrum. Meas. 2011, 60, 1257–1266. [Google Scholar] [CrossRef]
- Asogwa, C.O.; Teshome, A.; Collins, S.; Lai, D. A Circuit Model of Real Time Human Body Hydration. IEEE Trans. Biomed. Eng. 2016, 63, 1239–1247. [Google Scholar] [CrossRef] [PubMed]
- Xu, R.; Zhu, H.; Yuan, J. Electric-field intra-body communication channel modeling with finite-element method. IEEE Trans. Biomed. Eng. 2011, 58, 705–712. [Google Scholar] [PubMed]
- Wegmueller, M.S.; Kuhn, A.; Froehlich, J.; Oberle, M.; Felber, N.; Kuster, N.; Fichtner, W. An attempt to model the human body as a communication channel. IEEE Trans. Biomed. Eng. 2007, 54, 1851–1857. [Google Scholar] [CrossRef] [PubMed]
- Pethig, R. Dielectric and Electronic Properties of Biological Materials; Wiley Press: New York, NY, USA, 1979; pp. 47–53. [Google Scholar]
- Wang, J.; Zilic, Z.; Shu, Y. Evaluation of an RF wearable device for non-invasive real-time hydration monitoring. In Proceedings of the 2017 IEEE 14th International Conference on Wearable and Implantable Body Sensor Networks (BSN), Eindhoven, The Netherlands, 9–12 May 2017; pp. 91–94. [Google Scholar]
- Shanholtzer, B.A.; Patterson, S.M. Use of bioelectrical impedance in hydration status assessment: Reliability of a new tool in psychophysiology research. Int. J. Psychophysiol. 2003, 49, 217–226. [Google Scholar] [CrossRef]
- Asselin, M.C.; Kriemler, S.; Chettle, D.R.; Webber, C.E.; Bar-Or, O.; McNeill, F.E. Hydration status assessed by multi-frequency bioimpedance analysis. Appl. Radiat. Isotopes 1998, 49, 495–497. [Google Scholar] [CrossRef]
- Nyboer, J. Workable volume and flow concepts of bio-segments by electrical impedance plethysmography. TIT. J. Life Sci. 1972, 2, 1–13. [Google Scholar] [PubMed]
- Kreider, J.; Nyboer, M.M.; Hannapel, L. Electrical impedance plethysmography: A physical and physiologic approach to peripheral vascular study. Circulation 2 1950, 6, 811–821. [Google Scholar]
- Van Loan, M.D.; Withers, P.; Matthie, J.; Mayclin, P.L. Use of bioimpedance spectroscopy to determine extracellular fluid, intracellular fluid, total body water, and fat-free mass. Basic Life Sci. 1993, 60, 67–70. [Google Scholar] [PubMed]
- Wabel, P.; Chamney, P.; Moissl, U.; Jirka, T. Importance of whole-body bioimpedance spectroscopy for the management of fluid balance. Blood Purif. 2009, 27, 75–80. [Google Scholar] [CrossRef] [PubMed]
- Norman, K.; Stobäus, N.; Pirlich, M.; Bosy-Westphal, A. Bioelectrical phase angle and impedance vector analysis–clinical relevance and applicability of impedance parameters. Clin. Nutr. 2012, 31, 854–861. [Google Scholar] [CrossRef] [PubMed]
- Zouridakis, A.; Simos, Y.V.; Verginadis, I.I.; Charalabopoulos, K.; Ragos, V.; Dounousi, E.; Boudouris, G.; Karkabounas, S.; Evangelou, A.; Peschos, D. Correlation of bioelectrical impedance analysis phase angle with changes in oxidative stress on end-stage renal disease patients, before, during, and after dialysis. Ren. Fail 2016, 38, 738–743. [Google Scholar] [CrossRef] [PubMed]
- Asogwa, C.O.; Collins, S.F.; Mclaughlin, P.; Lai, D.T. A Galvanic Coupling Method for Assessing Hydration Rates. Electronics 2016, 5, 39. [Google Scholar] [CrossRef]
- De Lorenzo, A.; Deurenberg, P.; Andreoli, A.; Sasso, G.F.; Palestini, M.; Docimo, R. Multifrequency impedance in the assessment of body water losses during dialysis. Kidney Blood Press Res. 1994, 17, 326–332. [Google Scholar] [CrossRef]
- Ellis, K.J.; Bell, S.J.; Chertow, G.M.; Chumlea, W.C.; Knox, T.A.; Kotler, D.P.; Lukaski, H.C.; Schoeller, D.A. Bioelectrical impedance methods in clinical research: A follow-up to the NIH Technology Assessment Conference. Nutrition 1999, 15, 874–880. [Google Scholar] [CrossRef]
- Jaffrin, M.Y.; Morel, H. Body fluid volumes measurements by impedance: A review of bioimpedance spectroscopy (BIS) and bioimpedance analysis (BIA) methods. Med. Eng. Phys. 2008, 30, 1257–1269. [Google Scholar] [CrossRef] [PubMed]
- Kushner, R.F.; Gudivaka, R.; Schoeller, D.A. Clinical characteristics influencing bioelectrical impedance analysis measurements. Am. J. Clin. Nutr. 1996, 64, 423S–427S. [Google Scholar] [PubMed]
- Ionescu, M.A.; Guerin, H. System for the Remote Monitoring of the Hydration Status of a Living Being. U.S. Patent 14/840,852, 3 March 2016. Ecole polytechnique fédérale de Lausanne (EPFL). [Google Scholar]
- Ramos, J.; Ausín, J.L.; Torelli, G.; Duque-Carrillo, J.F. A wireless sensor network for fat and hydration monitoring by bioimpedance analysis. In Proceedings of the 6th IEEE International Workshop on Wearable Micro and Nano Technologies for Personalized Health (pHealth), Oslo, Norway, 24–26 June 2009; pp. 49–52. [Google Scholar]
- Huang, X.; Liu, Y.; Cheng, H.; Shin, W.J.; Fan, J.A.; Liu, Z.; Lu, C.J.; Kong, G.W.; Chen, K.; Patnaik, D.; et al. Materials and designs for wireless epidermal sensors of hydration and strain. Adv. Funct. Mater. 2014, 24, 3846–3854. [Google Scholar] [CrossRef]
- Huang, X.; Cheng, H.; Chen, K.; Zhang, Y.; Zhang, Y.; Liu, Y.; Zhu, C.; Ouyang, S.C.; Kong, G.W.; Yu, C.; et al. Epidermal impedance sensing sheets for precision hydration assessment and spatial mapping. IEEE Trans. Biomed. Eng. 2013, 60, 2848–2857. [Google Scholar] [CrossRef] [PubMed]
- Solovei, D.; Žák, J.; Majzlíková, P.; Sedláček, J.; Hubálek, J. Chemical sensor platform for non-invasive monitoring of activity and dehydration. Sensors 2015, 15, 1479–1495. [Google Scholar] [CrossRef] [PubMed]
- Yao, S.; Myers, A.; Malhotra, A.; Lin, F.; Bozkurt, A.; Muth, J.F.; Zhu, Y. A Wearable Hydration Sensor with Conformal Nanowire Electrodes. Adv. Healthc. Mater. 2017, 6. [Google Scholar] [CrossRef] [PubMed]
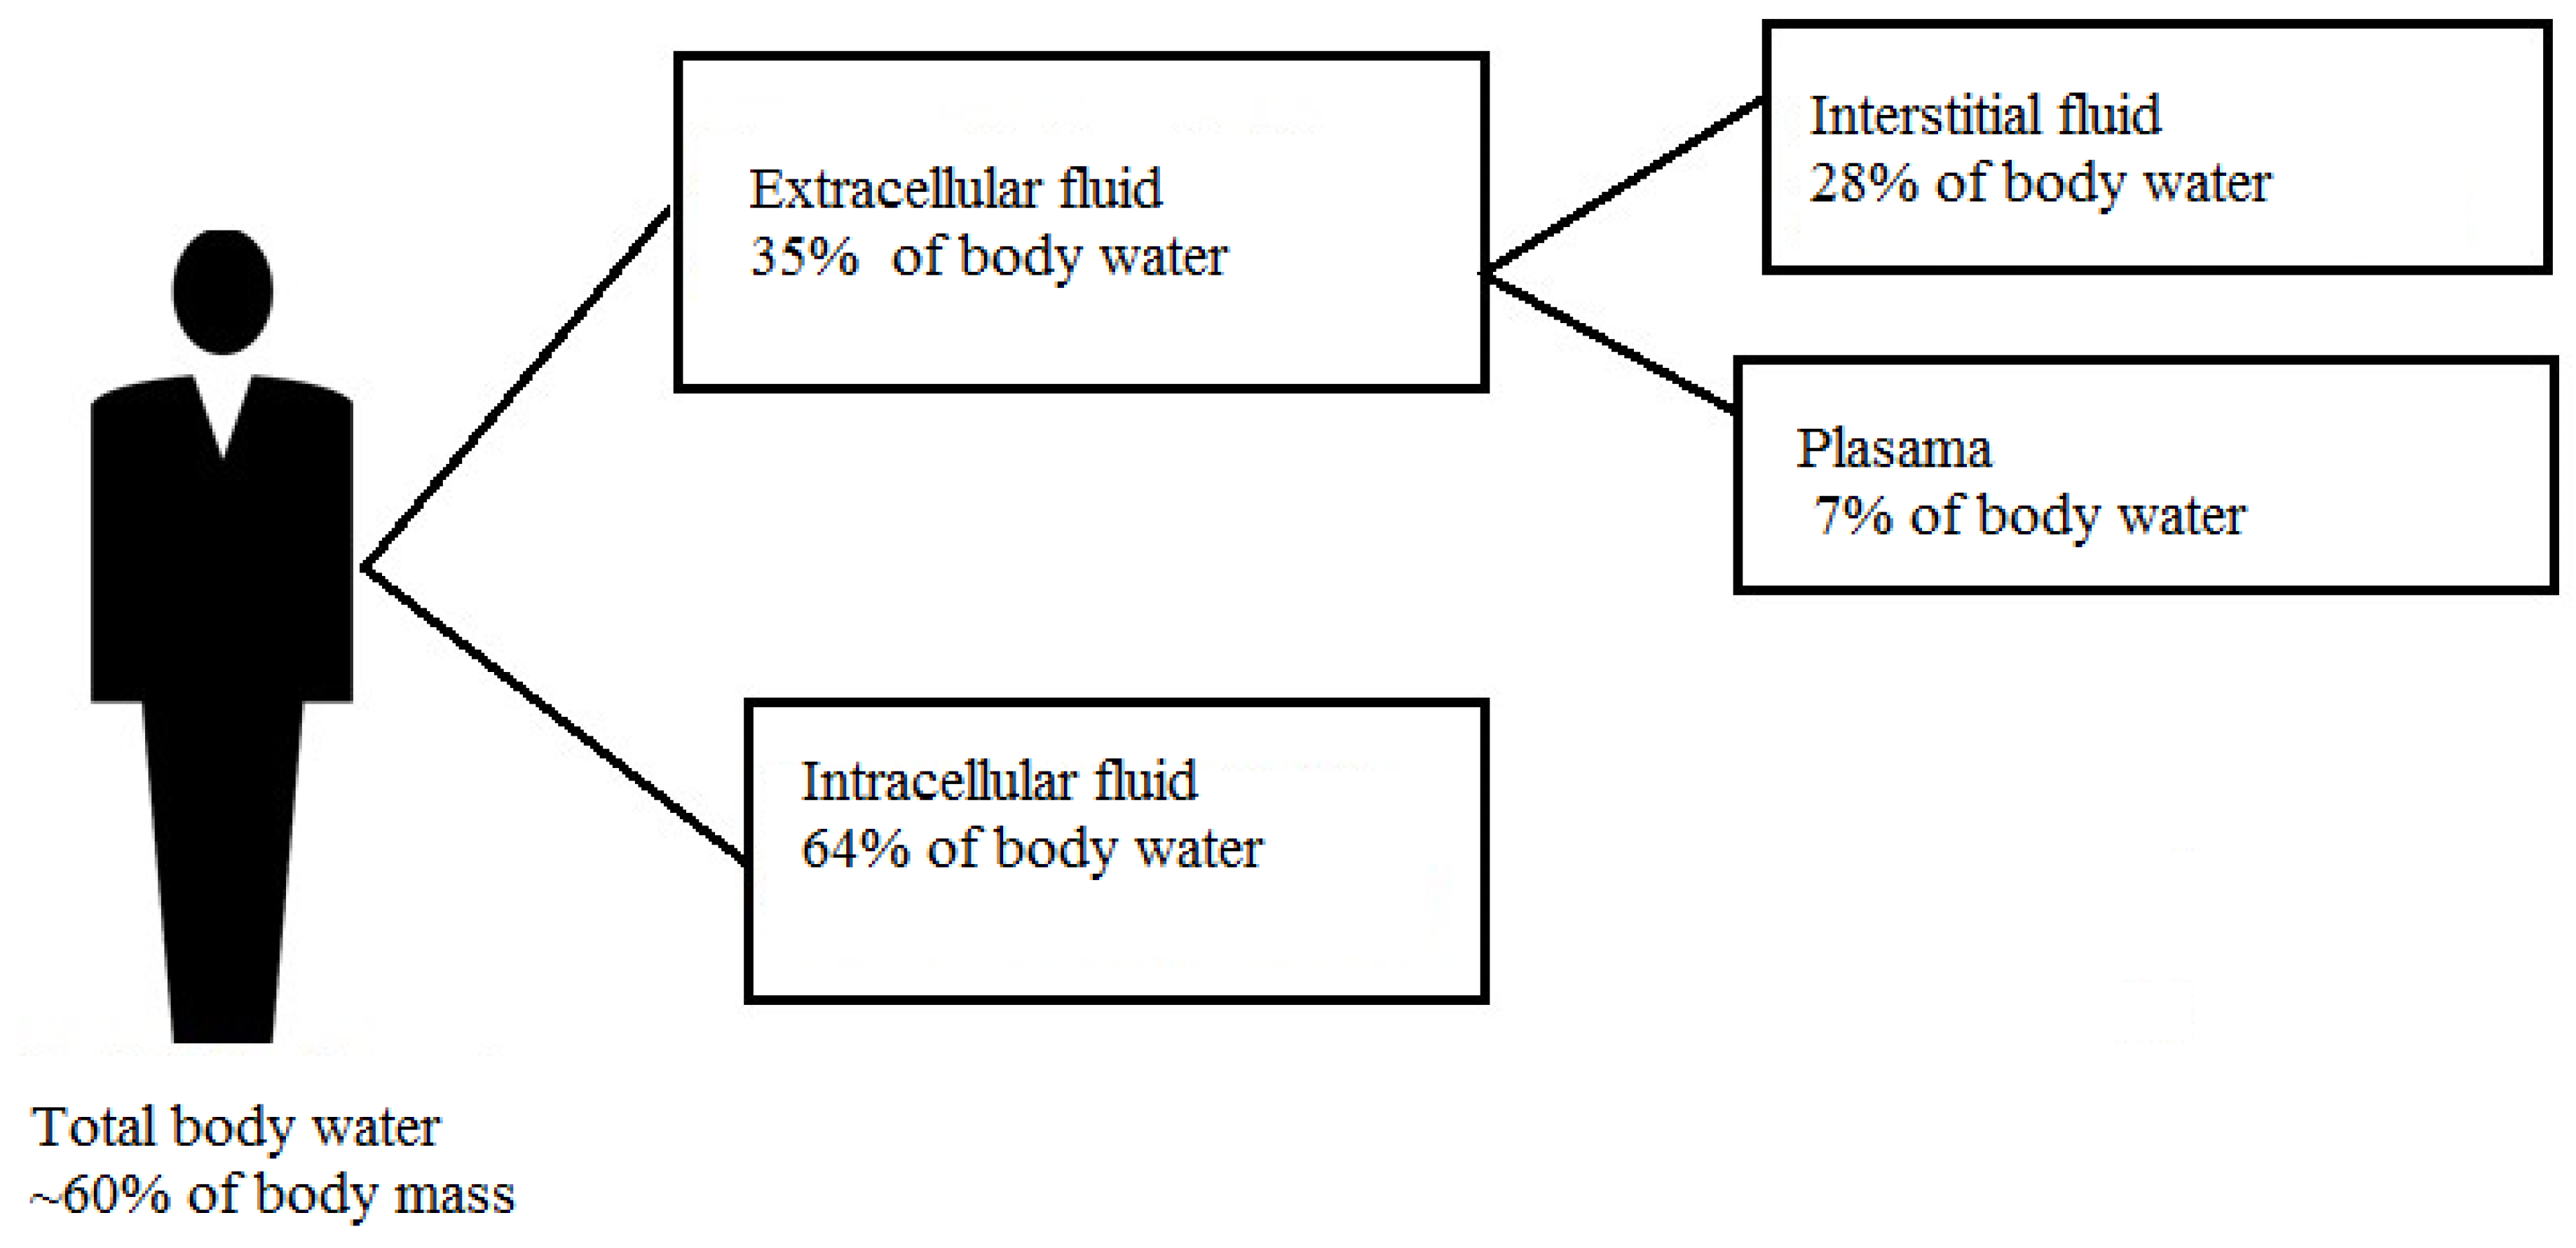
Figure 2.
Cole–Cole parametric plot.
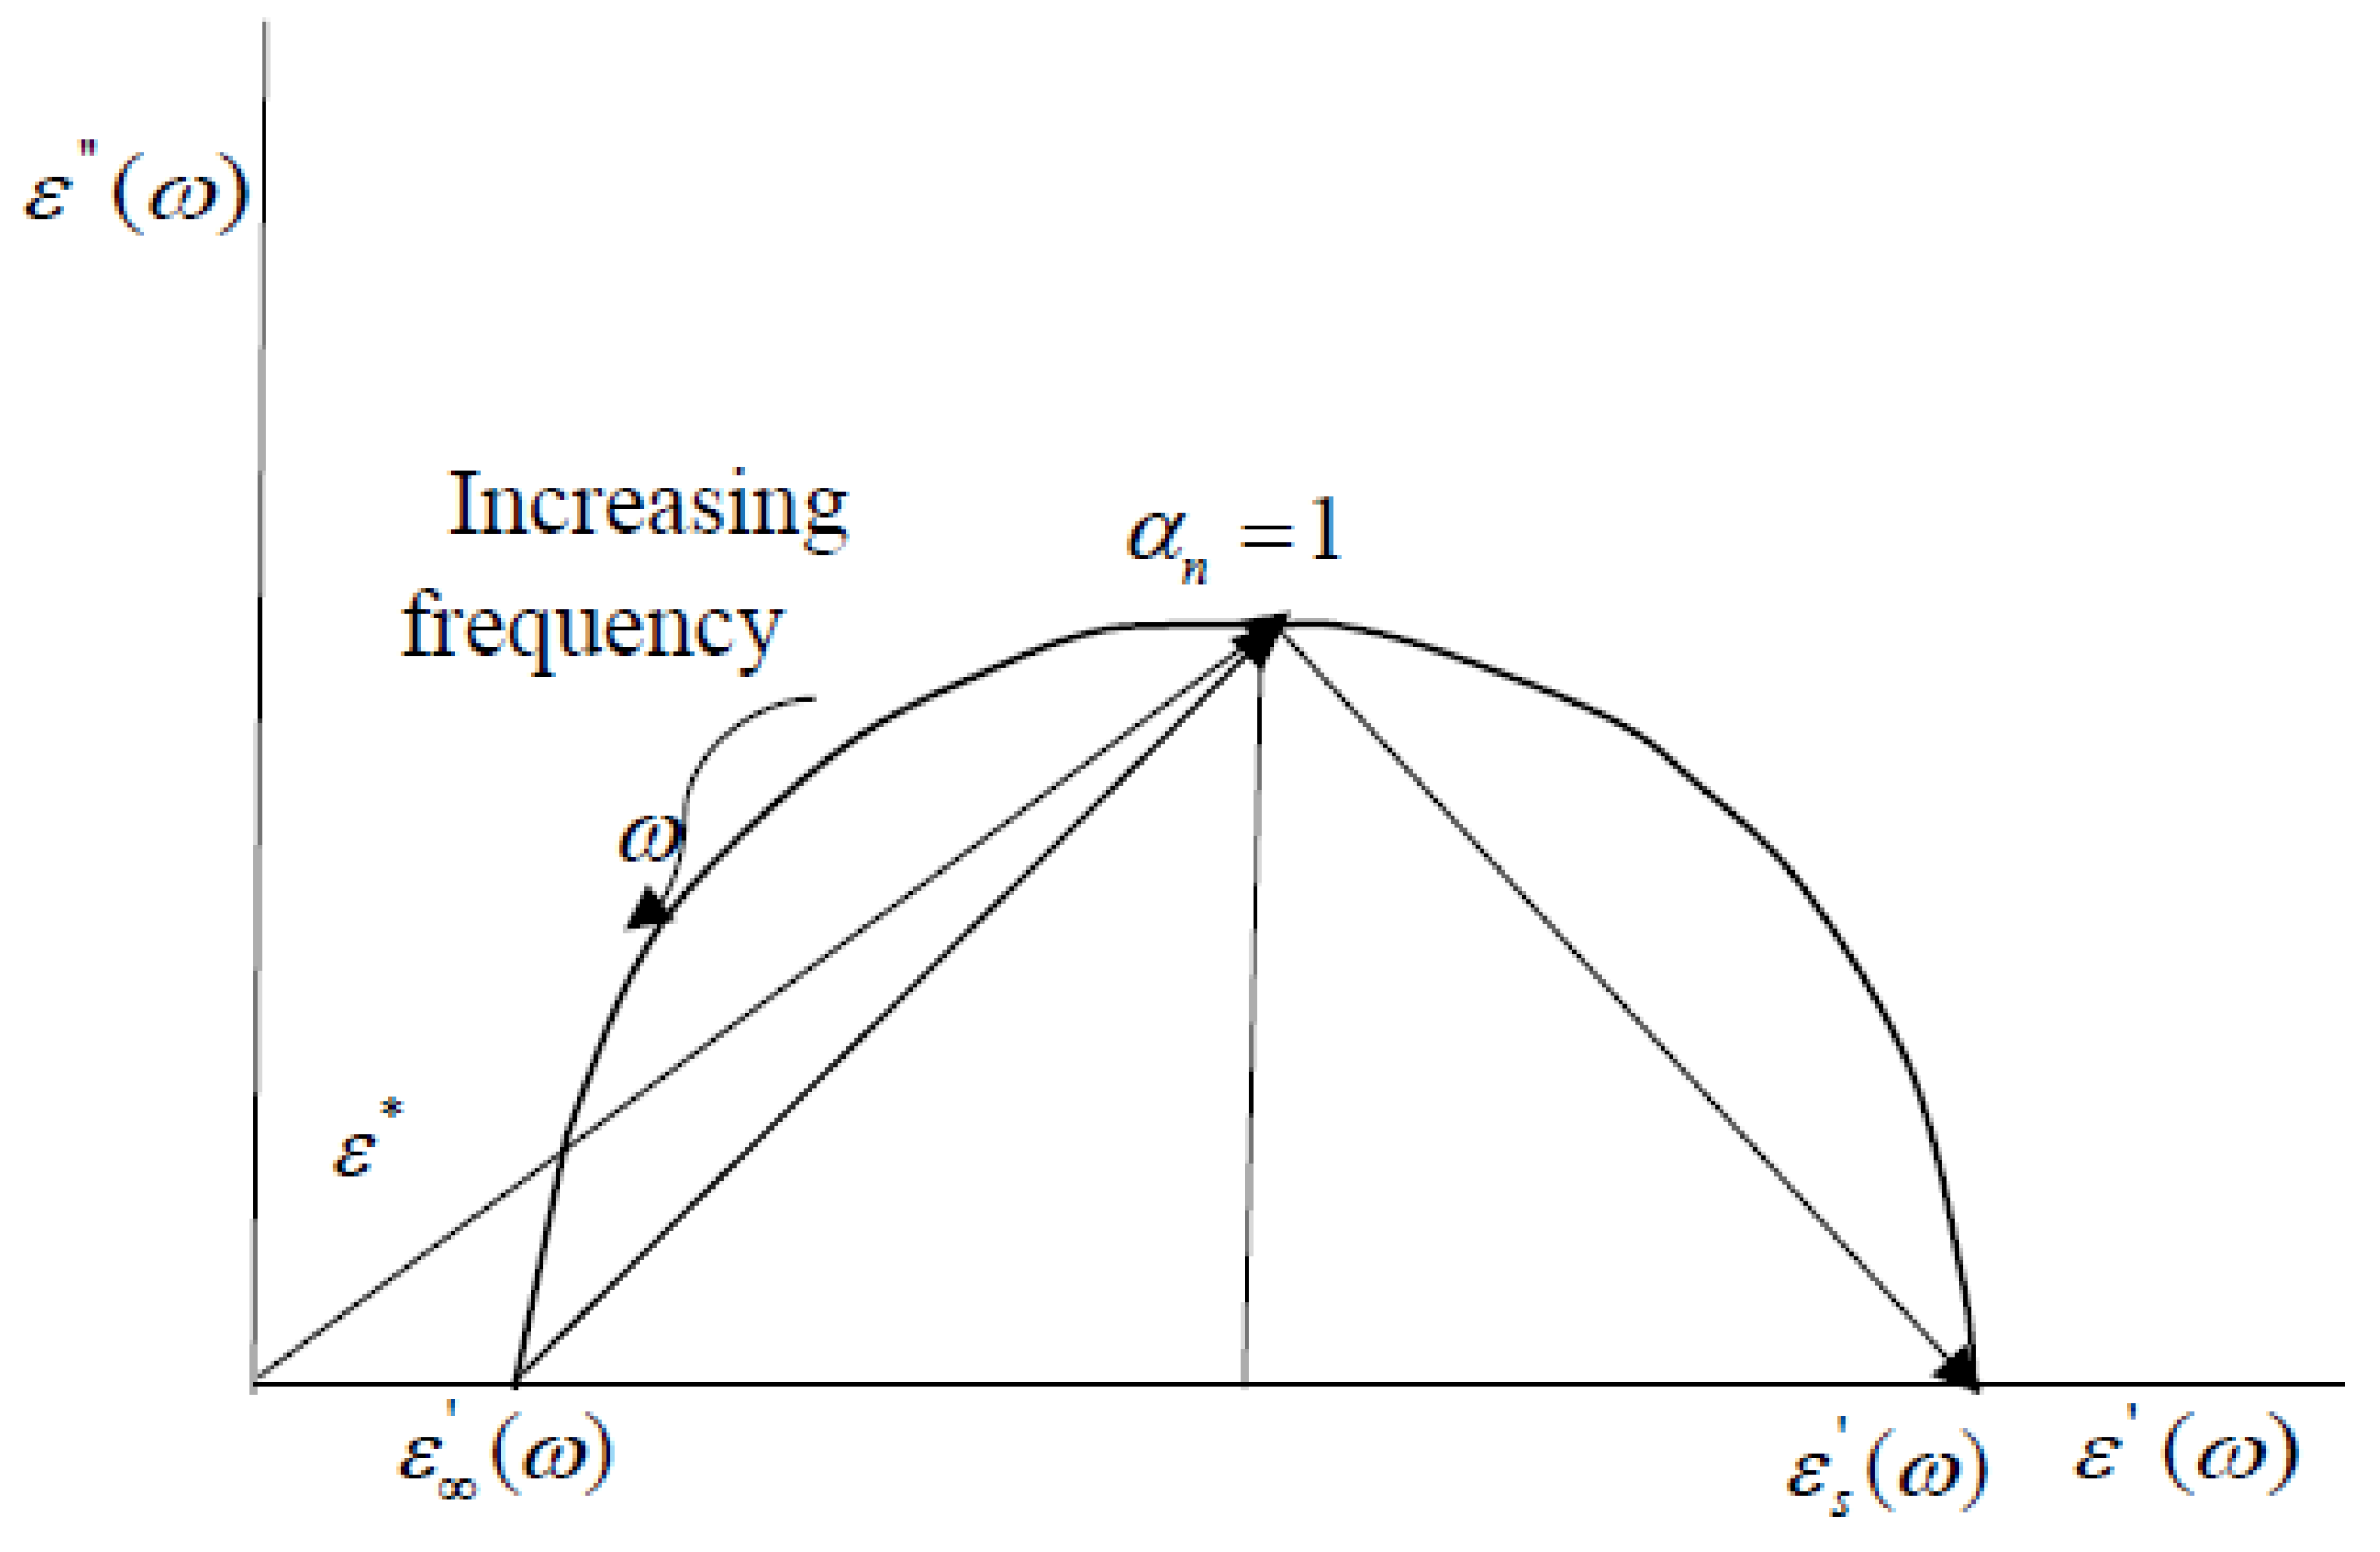
Figure 3.
Graph of the sensitivity test of an intrabody signal measured on subjects L, D, K at 3 random days measured at 900 kHz, before drink (A), after drinking 100 mL, 250 mL and 300 mL amounts of water (B), and after urinating (C).
Figure 3.
Graph of the sensitivity test of an intrabody signal measured on subjects L, D, K at 3 random days measured at 900 kHz, before drink (A), after drinking 100 mL, 250 mL and 300 mL amounts of water (B), and after urinating (C).
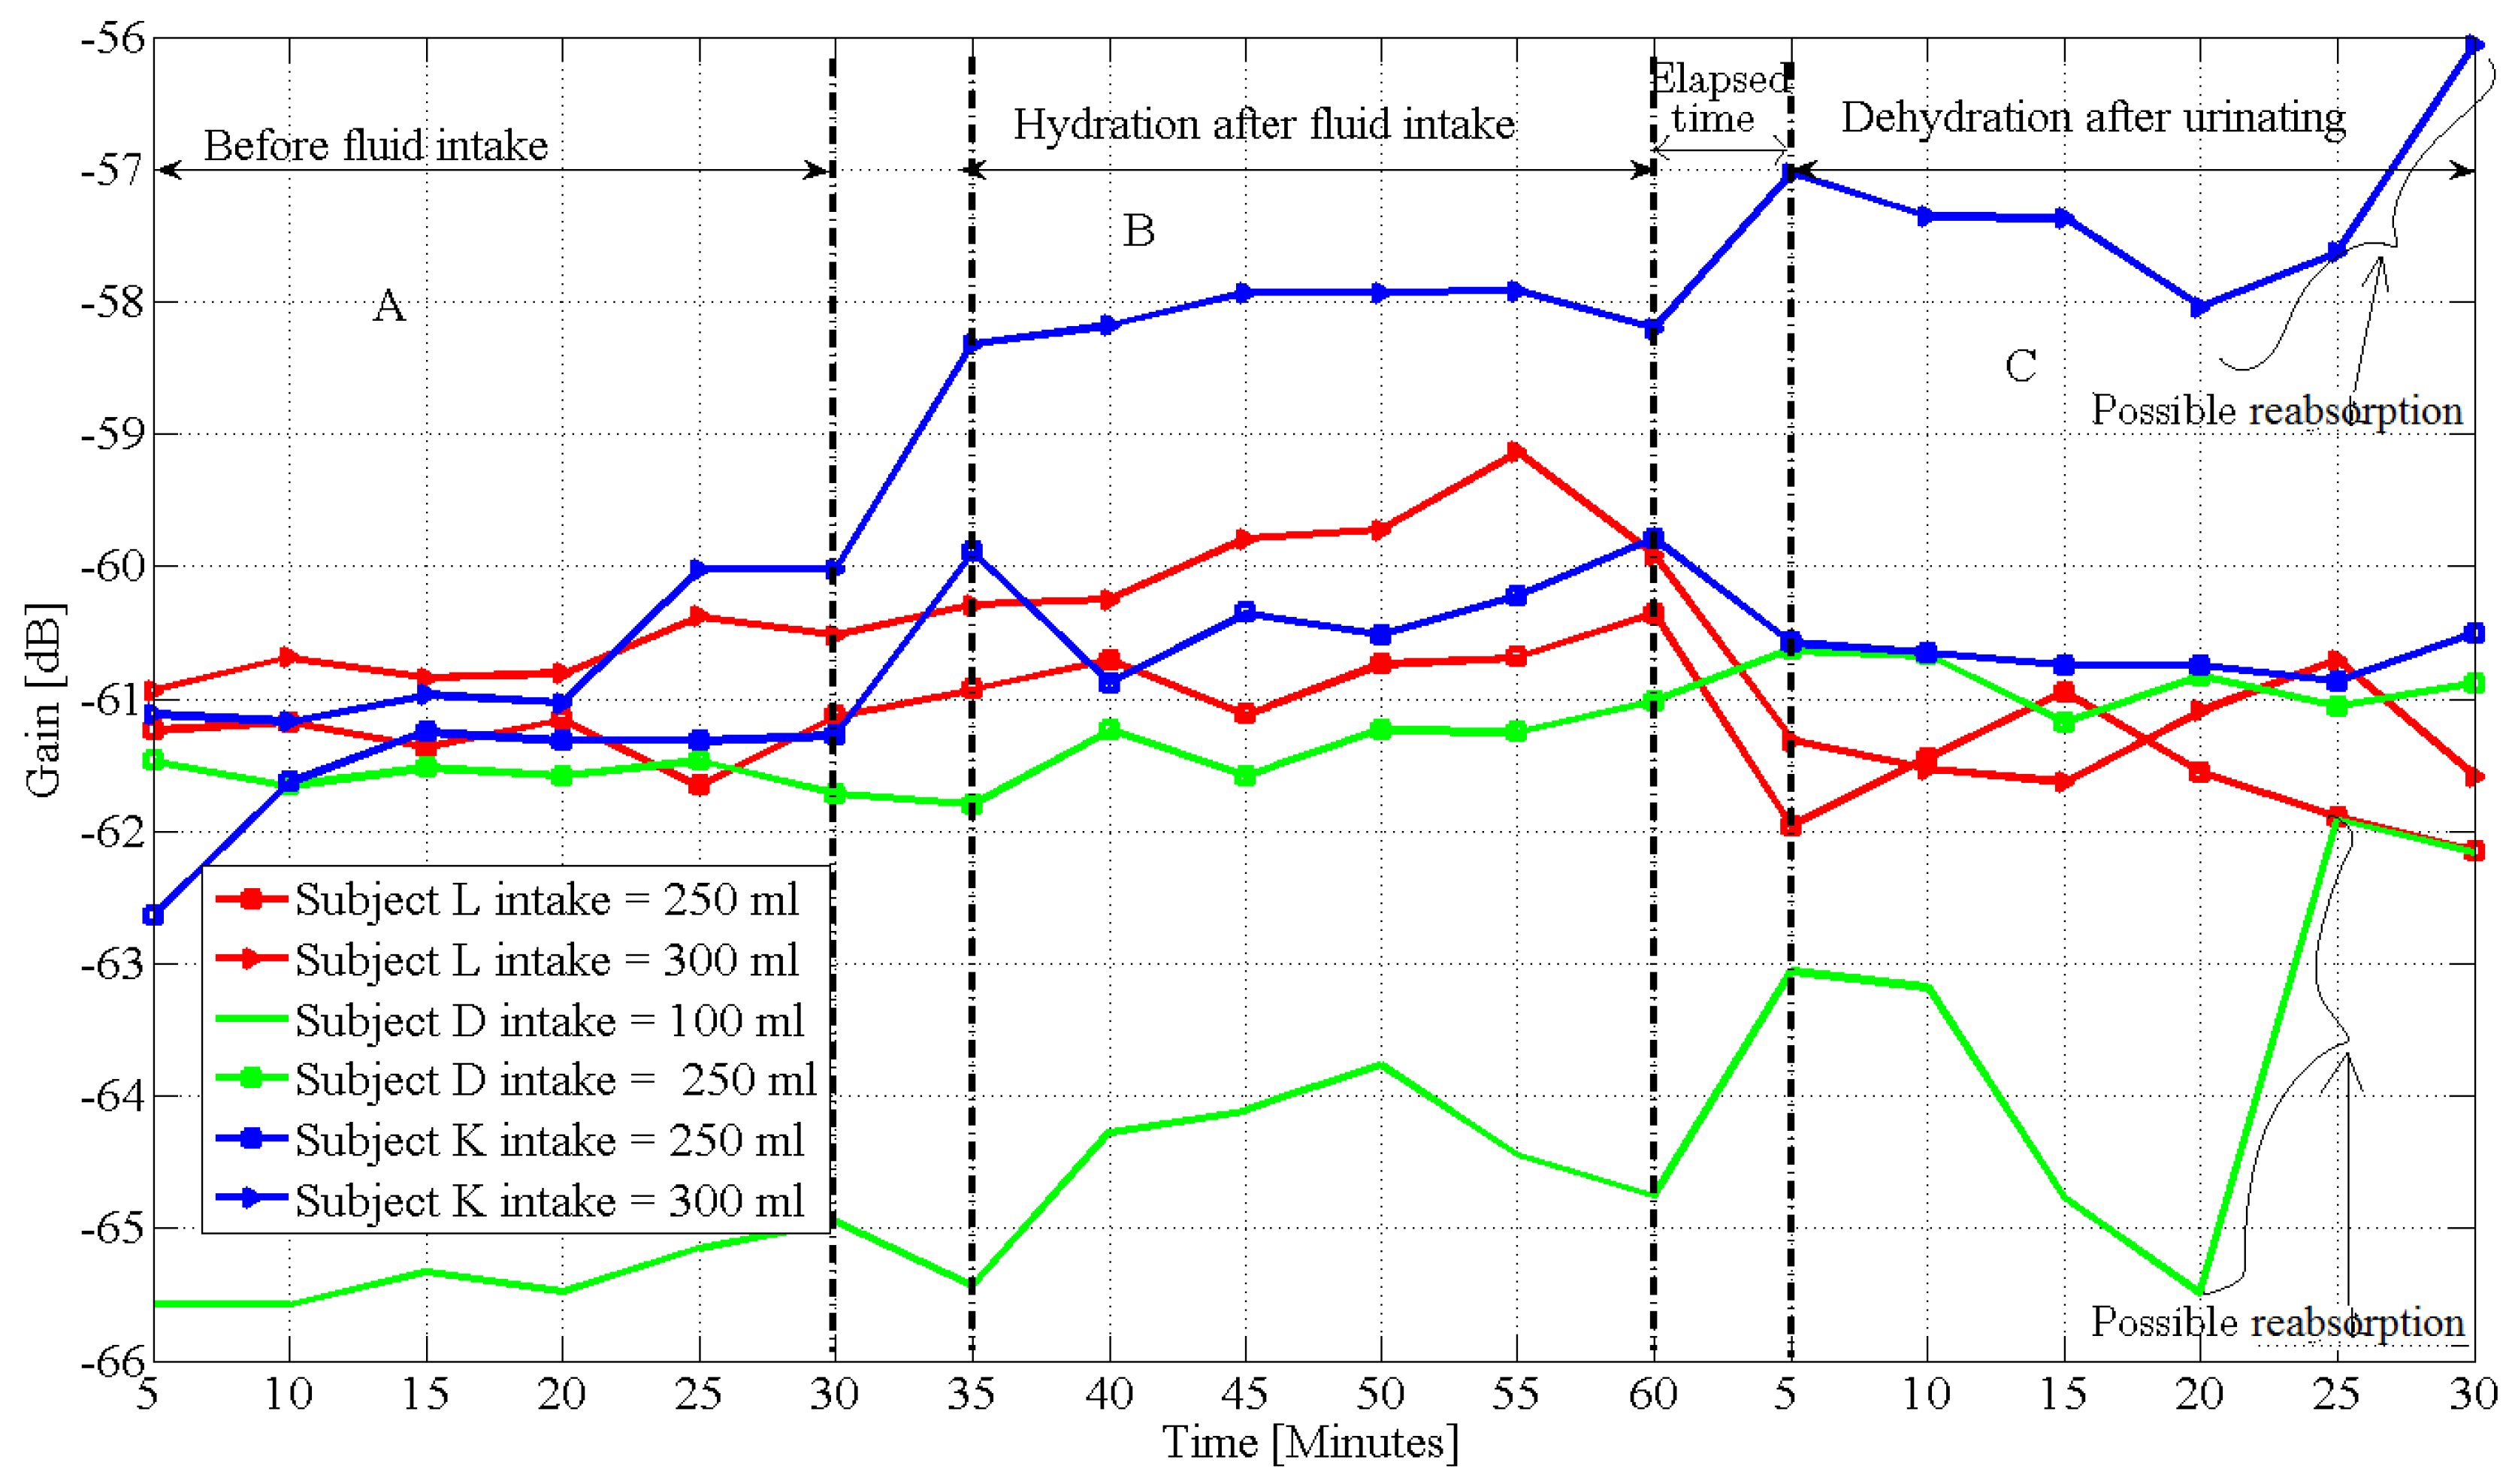
Figure 4.
Block diagram of wearable RF hydration monitor.
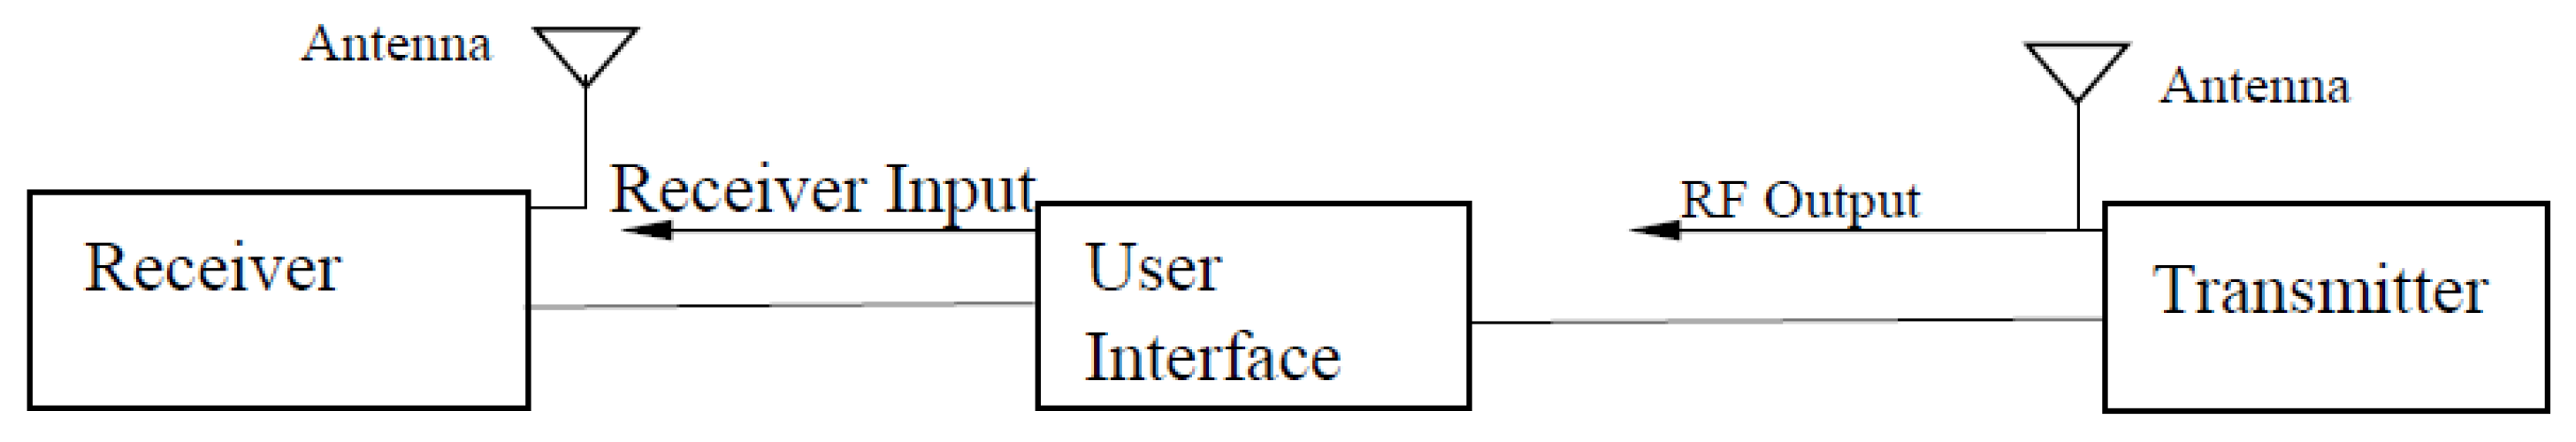
Figure 5.
Comparison of body fluid assessment techniques by accuracy and complexity.

Table 1.
Summary of body fluid assessment techniques. SF-BIA: Single-frequency bioelectrical impedance); MF-BIA: multi-frequency bioimpedance analysis; BIS: bioimpedance spectroscopy; TBW: Total body water; ECW: extracellular water; ICW: intracellular water; FFM: fat free mass; FM: fat mass; ECF: extracellular fluid; ICF: intracellular fluid; BMI: body mass index.
| Method | Strength | Weakness | Comment |
|---|---|---|---|
| Urine Colour Analysis (UCA) | Very simple No speciality skill is required | Subjective Limited accuracy | 1. No standard colour code 2. Affected by dietary intakes, drugs and supplements [26] |
| Urine Specific Gravity | More reliable than UCA 3. Inexpensive | Result can be altered by medication | 1. Limited accuracy |
| Densitometry | Easy to perform | Measures TBW only | over simplified result |
| Body mass measurement | Self-administered Simple and inexpensive | Limited accuracy Measures TBW only | 1. Accuracy depends on sensitivity of scale |
| SF-BIA | Good for TBW | 1. Cannot differentiate ECF from ICF 2. It is based on a 2-C model of human body | 1. Over simplified 2. Subject to uncertainties 3. Does not respond quickly to acute changes in body fluid level [59] 4. Measures only extra-cellular fluid [60] |
| MF-BIA | Measures ECW and ICW, Good for whole body healthy normal-weight people fluid measurement in | 1. Does not respond to acute changes in fluid level from hydration or dehydration | 1. Different devices used for different body parts 2. Not suitable as a wearable device |
| BIS | 1. Measures ECW, ICW, FFM, FM, TBW 2. Broad frequency range( 1–1000 kHz) 3. Segmental BIS calculates body composition segment by segment 4. Bulky, not suitable as a wearable device | 1. Needs further refinement particularly for populations with abnormal body geometry (e.g., very high BMI) 2. Assumes constant specific resistivity of the fluid compartment measured 3. Did not include the effects of temperature and metabolism [62] on the assumptions | 1. Theoretically differentiates ECW from ICF 2. Quantifies body cell mass 3. Impedance data in the frequency spectrum is fit into Cole’s model [61] 4. Uses statistical modelling equations based on Hanai mixture theory to calculate resistances at different frequencies |
| Analysis of Blood Sample | Higher accuracy than previous methods | 1. Result is affected by postural changes and exercise 2. Complicated and risky 3. Does not evaluate the amount of water by tissue compartment [33] 4. Does not respond quickly to mild reduction of water [34] | Measures the concentration of electrolyte substance in the blood and comparison with a reference |
| Isotope Dilution | High accuracy, 1. Tracks the distribution of water in the body Suitable for laboratory research | 1. Complicated and expensive 2. Requires different isotopes for different tissue compartments 3. Large time consuming 4. Can be affected by metabolism 5. Insensitive to 1 kg loss in TBW [36] | Assumes uniform circulation of tracers and risks overdose |
© 2017 by the authors. Licensee MDPI, Basel, Switzerland. This article is an open access article distributed under the terms and conditions of the Creative Commons Attribution (CC BY) license (http://creativecommons.org/licenses/by/4.0/).
Share and Cite
MDPI and ACS Style
Asogwa, C.O.; Lai, D.T.H. A Review on Opportunities To Assess Hydration in Wireless Body Area Networks. Electronics 2017, 6, 82. https://doi.org/10.3390/electronics6040082
AMA Style
Asogwa CO, Lai DTH. A Review on Opportunities To Assess Hydration in Wireless Body Area Networks. Electronics. 2017; 6(4):82. https://doi.org/10.3390/electronics6040082
Chicago/Turabian StyleAsogwa, Clement Ogugua, and Daniel T. H. Lai. 2017. "A Review on Opportunities To Assess Hydration in Wireless Body Area Networks" Electronics 6, no. 4: 82. https://doi.org/10.3390/electronics6040082
Note that from the first issue of 2016, this journal uses article numbers instead of page numbers. See further details here.